Article

Estimating the Potential for Rooftop Generation of Solar Energy in an Urban Context Using High-Resolution Open Access Geospatial Data: A Case Study of the City of Tromsø, Norway

1
Scott Polar Research Institute, University of Cambridge, Cambridge CB2 1ER, UK
2
Department of Technology and Safety, ARC Arctic Centre for Sustainable Energy, UiT the Arctic University of Norway, N-9037 Tromsø, Norway
*
Author to whom correspondence should be addressed.
ISPRS Int. J. Geo-Inf. 2025, 14(3), 123; https://doi.org/10.3390/ijgi14030123
Submission received: 13 December 2024 / Revised: 21 February 2025 / Accepted: 26 February 2025 / Published: 7 March 2025

Abstract

:
An increasing trend towards the installation of photovoltaic (PV) solar energy generation capacity is driven by several factors including the desire for greater energy independence and, especially, the desire to decarbonize industrial economies. While large ‘solar farms’ can be installed in relatively open areas, urban environments also offer scope for significant energy generation, although the heterogeneous nature of the surface of the urban fabric complicates the task of forming an area-wide view of this potential. In this study, we investigate the potential offered by publicly available airborne LiDAR data, augmented using data from OpenStreetMap (OSM), to estimate rooftop PV generation capacities from individual buildings and regionalized across an entire small city. We focus on the island of Tromsøya in the city of Tromsø, Norway, which is located north (69.6° N) of the Arctic Circle, covers about 13.8 km2, and has a population of approximately 42,800. A total of 16,377 buildings were analyzed. Local PV generation potential was estimated between 120 and 180 kWh m−2 per year for suitable roof areas, with a total estimated generation potential of approximately 200 GWh per year, or approximately 30% of the city’s current total consumption. Regional averages within the city show significant variations in potential energy generation, highlighting the importance of roof orientation and building density, and suggesting that rooftop PV could play a much more substantial role in local energy supply than is commonly assumed at such high latitudes. The analysis method developed here is rapid, relatively simple, and easily adaptable to other locations.

1. Introduction

Solar photovoltaic (PV) energy generation has become increasingly important in the global pursuit of sustainable clean energy solutions and climate change mitigation. In 2023, global solar PV energy capacity grew by 87% compared to the previous year, adding 447 GW of new capacity and bringing the world’s total solar PV capacity to 1.6 TW [1], making solar PV energy currently the fastest-growing renewable energy source globally [2]. This surge in solar energy adoption is expected to significantly decrease emissions from the production and use of fossil fuels, which are primary sources of CH₄, CO₂, and CO [3,4].
While most solar energy continues to be generated from large, dedicated PV arrays, rooftop PV generation is becoming more prevalent. In urban environments, PV deployment on buildings has the potential to play an important role in decarbonization and facilitating the clean energy transition [5,6,7]. Exploiting existing building areas, including rooftop spaces, may offer an environmentally and economically sustainable solution to meet the escalating energy demands of city populations [6,7]. Rooftop PV solar installations reduce dependence on fossil fuels, mitigate greenhouse gas emissions, and enhance air quality [8]. Furthermore, rooftop PV installations reduce competition for land for other purposes such as recreation, agriculture, or the maintenance of biodiversity, and reduce transmission losses by generating electricity close to the point of consumption [9]. With rapid global urbanization, the total rooftop area is projected to increase significantly. Recent findings estimate that from 2020 to 2050, the world’s rooftop area could expand by 20–52%, highlighting the potential of this resource to sustainably meet the growing energy needs of urban populations [10]. It is important to note that at the European level, this trend is being reinforced by legislative measures such as the European Union’s Solar Rooftop Standard, part of the Energy Performance of Buildings Directive (EPBD) [11,12]. This standard, which recently came into force, aims to install 150–200 GW of rooftop PV across the EU between 2026 and 2030, potentially powering approximately 56 million European homes. Given the huge potential of rooftops in Europe, estimated by the EU’s Joint Research Centre at approximately 560 GW our study’s focus on mapping rooftop PV capacity directly supports the goals of the EPBD by offering a method that can be readily extended to other regions seeking to meet these ambitious targets [11,13].
Obstacles to the adoption of rooftop PV generation, however, include economic factors, structural and technical challenges, complex administrative and regulatory processes [14], as well as aesthetic concerns and limited awareness of the benefits of solar PV generation. Moreover, the limited availability of optimal sunlight hours in some parts of the world, further affected by varying weather conditions, can present a challenge to the efficiency and performance of any form of solar energy generation [15,16].
Despite the global potential for solar PV generation energy on buildings, its realization in high-latitude regions, such as northern Norway, faces some particular challenges [17,18,19]. Although the total annual insolation is somewhat lower at high latitudes compared to more southern locations, summer insolation is still high and the main difficulty arises from the extreme seasonality of the potential solar PV generation [20,21,22]. Harsh climatic conditions impose further difficulties. These factors have led to a widespread perception that solar PV systems are not feasible in these regions [22]. In addition, Norway’s vast hydropower reserves have historically provided citizens with cheap and abundant renewable electricity [2,20,21,22,23]. However, the urgent need for more renewable energy production makes it imperative to explore and exploit the solar potential of roofs, even in Arctic regions [22,23]. Widespread electrification, establishment of green industries, and the need to diversify the energy supply are among the factors driving the need for renewable energy installations in Norway, and the cumulative installed solar PV capacity has increased from 300 MW in 2023 to 661 MW by May 2024 [24]. The solar PV generation output is positively affected by factors such as abundant summer sunshine lasting up to 24 h above the Arctic Circle, low temperatures that increase the efficiency of PV installations, and increased received or in-plane solar radiation from snow reflection [2,24,25]. A recent report calculated that there is a potential to install 8.7 GW on buildings alone in Norway, and the Norwegian Government has established an energy goal of 8 TWh annually from solar PV generation [26,27].
Assessment of the potential for solar PV generation from a building requires the integration of geometrical data describing the building and its surroundings with a model of the available solar radiation. It is well known that the solar PV generation of individual buildings can be assessed using cadastral building plans, while citywide assessments require large amounts of geospatial data and are rarely carried out [28,29,30]. However, the increasing availability of high-resolution remote sensing data in the public domain is changing this landscape [31]. Airborne LiDAR (light detection and ranging) data, at a sufficiently high spatial resolution to resolve relevant aspects of roof geometry, are becoming increasingly valuable in this regard [31,32,33,34,35,36]. The spatial resolution of LiDAR surveys is usually expressed in points per square meter (psm), or as the cell size of interpolated and uniformly gridded data. A number of studies [30,31,34,35,36,37,38,39] have explored the potential of LiDAR data at different resolutions, from less than 1 to as high as 25 psm. In general, resolutions below approximately 1 psm are shown to be insufficient for anything other than rough estimates of solar PV generation [40] while higher resolutions can be used to derive 3D models of buildings [34,41]. LiDAR data can however be enhanced by combining with other sources of 3D information such as cadastral data, photogrammetry [42] or vector data from OpenStreetMap (OSM) [22,43].
Local insolation at a roof surface can be used to derive an area-specific solar PV generation potential, either instantaneously or integrated over some period of time. As well as requiring information about the slope and aspect of the roof surface, this also needs a model of solar radiation [41,42,44,45]. Various well-known models are available for use within a GIS environment. Models, such as the Area Solar Radiation/Raster Solar Radiation tool [46], the Solar irradiance and irradiation model ‘r.sun’ in GRASS GIS [47,48], and the Potential Incoming Solar Radiation tool in SAGA GIS [45,49,50], can offer more detailed local scale calculations but are typically more computationally intensive especially when applied to high-resolution data for an entire city. PVGIS, developed by the European Commission’s Joint Research Centre and available online (https://re.jrc.ec.europa.eu/pvg_tools/en/ accessed on 2 September 2024) [51,52,53]), uses satellite-derived cloudiness data to provide near-instant estimates of solar radiation for a given location. Our approach differs by applying a simplified statistical method directly to ultra-high-resolution LiDAR data, focusing on roof orientation and geographic location while deliberately neglecting local shading effects and horizon irregularities. A key aspect of our approach is that it calculates insolation on a pixel-by-pixel basis, for processing speed. By parameterizing the insolation in terms of the roof slope angle and a function of geographical position that varies only very slowly with location (relative to the spatial scale of the city), we avoid the need to make repeated calls to PVGIS. This yields a transparent, modifiable workflow within a GIS environment and significantly reduces computational effort compared to full 3D solar radiation modeling on large urban datasets. Consequently, we can efficiently process high-resolution data for a citywide assessment of rooftop PV generation potential, a notable advantage over more complex and less adaptive existing tools.
Integration of the area-specific solar PV generation potential over an entire roof requires knowledge of which parts of a roof are capable of supporting solar panels. This necessitates a detailed knowledge of the roof’s topology so that it is not assumed that solar panels can be placed on top of, for example, chimneys, roof lights etc. [38,54,55,56]. For instance, Schuffert et al. (2015) [57] employ an Eagle platform-based approach that comprehensively evaluates the quality of automatically extracted roof areas from height data by assessing key parameters such as positional shifts, slope, aspect, and roof size, while also considering factors like data resolution and compression rate. While for estimation for a single building, this information can be gathered from an individual survey, for a citywide analysis it must be derived automatically from topographic data or statistically approximated. The ability to recognize roof features from defined DSM alone is clearly dependent on its spatial resolution [56,57,58,59].
The primary objective of the present study is to develop and implement methods using publicly available high-resolution LiDAR data within an open-source processing environment like QGIS to perform a citywide analysis of rooftop solar PV potential in Tromsø, Norway. This involves assessing the capabilities of accessible data and analysis tools to estimate solar PV generation both at the level of individual buildings and across different regions of the city, identifying areas that are more suitable for solar PV generation. By exploring techniques, such as connecting nearby buildings, and by following approaches suggested in [43,60], this study can identify how to optimize local solar PV deployment strategies that incorporate battery storage. This preliminary assessment seeks to contribute to the understanding of solar PV generation potential in high-latitude urban environments using readily available data and open-source tools, addressing spatial resolution challenges noted in previous research [36,60]. Since the study is performed using freely available data and tools, it also can contribute to empowering local communities and increasing their ownership of climate change mitigation strategies. A key component of this aspect of the study is the development of a simple solar PV generation model that can be applied in a GIS environment and can easily be adapted by users to suit local circumstances.
In summary, this study significantly expands the understanding of the energy generation potential of solar PV systems in high-latitude urban environments using LiDAR data and geoinformation analysis. The remainder of this paper is organized as follows: Section 2 delineates the study area and justifies the selection of the high-latitude city of Tromsø, while also providing a detailed description of the methodology for constructing a statistical model of solar PV generation potential, including all relevant model parameters. This section outlines the process of acquiring high-resolution LiDAR data and processing it within QGIS, as well as the procedure for identifying roof areas suitable for the installation of solar panels and illustrates a diagram that visually represents the sequential stages of the study. Section 3 is dedicated to the implementation of the described methodology and the presentation of the main results, particularly the local PV generation potential calculated using the developed algorithm based solely on roof areas deemed suitable for solar panel installation. Section 4 discusses the obtained results, examines the primary limitations of the applied approach and possible strategies for addressing them, and outlines potential directions for future research. Section 5 summarizes the study by formulating conclusions and proposing avenues for future investigation.

2. Materials and Methods
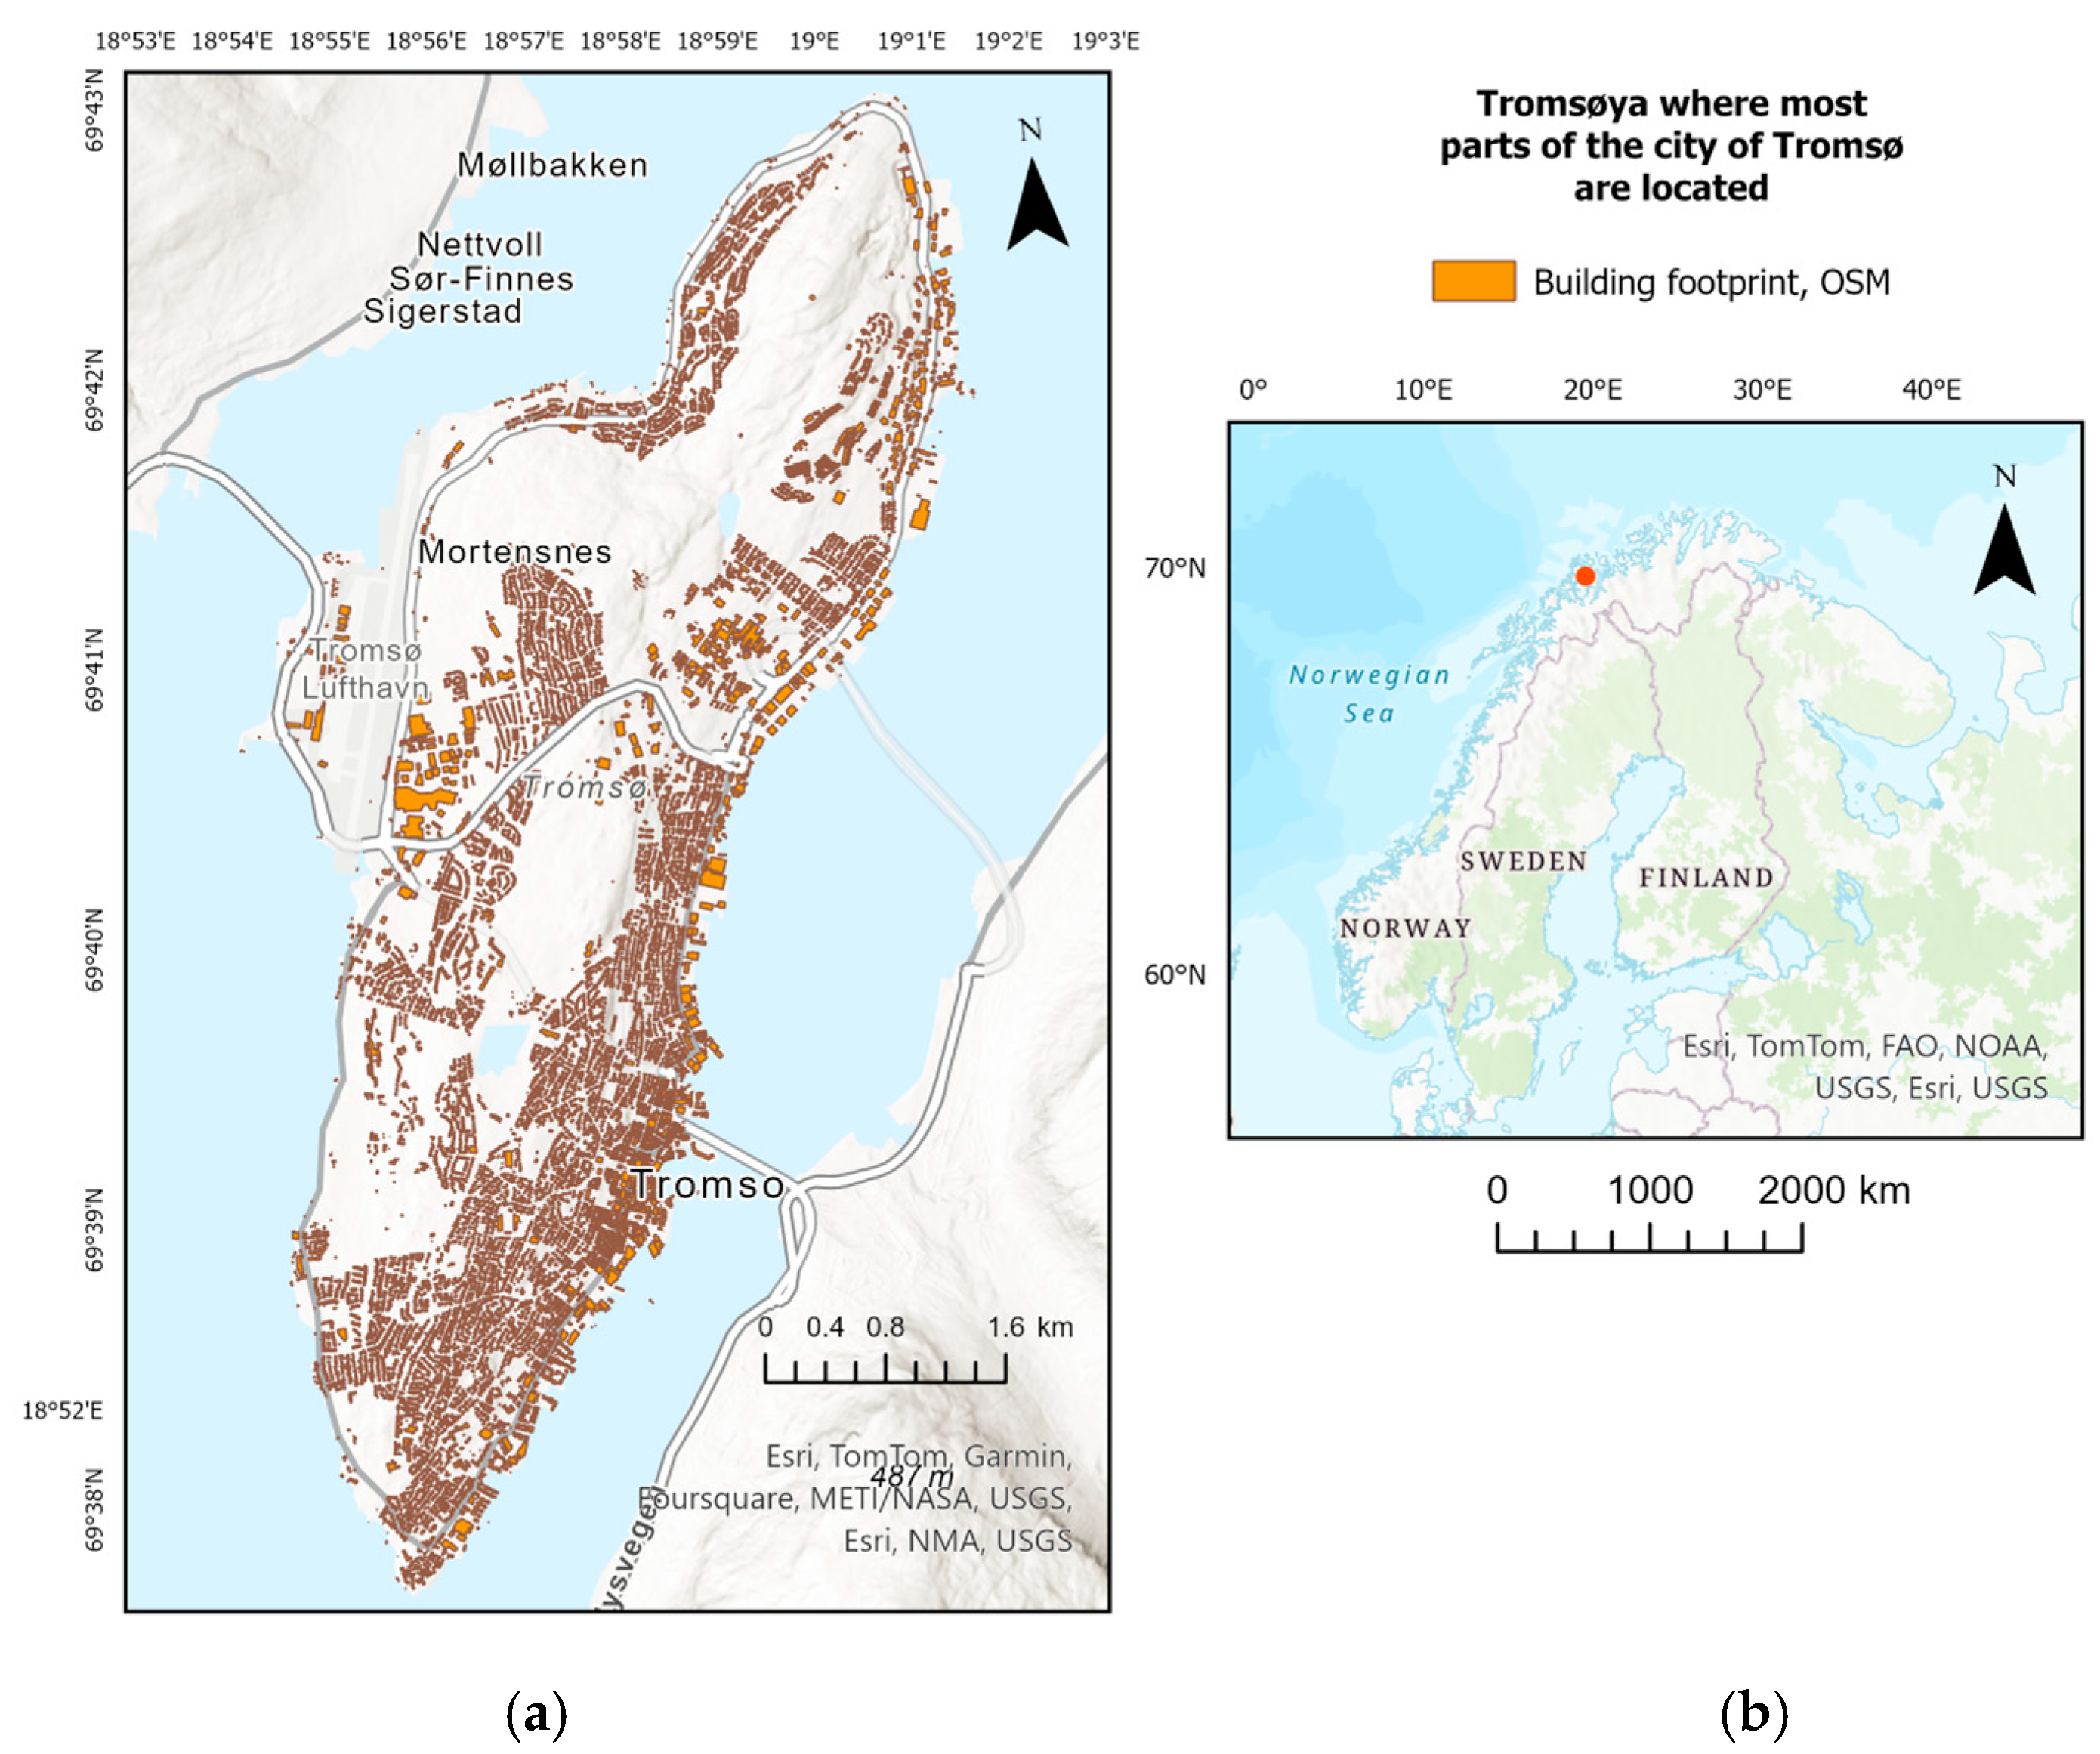
2.1. Study Area

Tromsø, located at a latitude of 69.6° N and longitude of 18.9° E, is the largest urban area in Northern Norway and the world’s third largest city north of the Arctic Circle, after Murmansk and Norilsk. The city center is situated on the island of Tromsøya (Figure 1a,b), covering an area of 13.8 km2, and is home to a population of 42,800. The urban area also encompasses parts of the nearby mainland and the island of Kvaløya, giving it a total population of 69,800, which is 89% of the population in Tromsø municipality [61]. Despite its high latitude, Tromsø experiences milder temperatures than other regions at similar latitudes due to the warming effects of the Gulf Stream. The total electricity consumption of the municipality in 2023 was 1281.9 GWh [2,24,25], equivalent to approximately 16 MWh per person, yet the adoption of solar power remains minimal and is often doubted in Arctic regions. Due to its location above the Arctic Circle, solar energy production in Tromsø varies significantly throughout the year due to extreme seasonal changes in daylight hours and weather conditions. This includes the midnight sun between 21 May and 21 July, and polar night between 27 November and 15 January [60,61]. Experimental data from solar PV installations in Tromsø [62] show typical area-specific annual energy generation of approximately 110 to 150 kWh m−2 per year for south-facing roofs. These data also imply that the maximum monthly energy generation, in July, is almost three times as high as the average monthly energy generation, with zero generation in December and January.
The primary reason for exploring Tromsø as a case study is to assess the feasibility and potential of rooftop solar PV installations in high-latitude urban environments. Norway possesses extensive high-resolution LiDAR data, arguably more than any other European Arctic country, which provides an excellent foundation for accurately estimating solar energy potential in urban areas like Tromsø [31,62]. This data availability, combined with the city’s unique geographic and climatic characteristics, makes Tromsø a suitable location for such an analysis.

2.2. PV Generation Model

We developed a statistical model of solar PV generation potential that is a function of geographical location and roof orientation. The approach involves a number of approximations and ignores any effects from local shadowing or uneven horizons but leads to a model that can be applied simply and transparently in a GIS environment. Specifically, our approach is based on parameterizing the characteristics of the local solar irradiation to leave only the slope and aspect of the illuminated surface as relevant variables. This, coupled with the fact that processing of the digital surface model is performed on a pixel-by-pixel basis, is a huge advantage given the need to process very large quantities of data to represent an entire city.
Geographical location affects both direct-beam insolation and the impact of cloudiness. The fundamental insolation model is derived as follows. Its inputs are the known geographical location of the study area, and the slope and aspect of the insolated surface, which are obtained from a suitable DSM as described below.
First, we define the annual insolation E0 on a plane surface with slope angle θ and aspect ψ located at latitude ϕ, assuming no atmosphere (and no clouds), and that the surface is not shadowed by neighboring structures or an elevated horizon:
E 0 θ , ψ , ϕ
This function is evaluated by straightforward numerical integration of the relevant astronomical formulae and tabulated for different values of its arguments. Details of how this calculation is performed are provided in the Supplementary Materials, which includes a suite of functions in the GNU Octave programming language.
To allow for the effect of atmosphere and cloudiness, we apply a factor f that depends only on geographical location (i.e., on latitude ϕ and longitude λ):
E 1 θ , ψ , ϕ , λ = f ϕ , λ E 0 θ , ψ , ϕ
The factor f is estimated from:
f ϕ , λ = E s 0,0 , ϕ , λ E 0 0,0 , ϕ
where Es (0, 0, ϕ, λ) is annual at-surface insolation on a horizontal surface estimated by the PVGIS-SARAH2 model [51,52,63]. PVGIS-SARAH2 data, which are gridded at a spatial resolution of 0.05°, were downloaded from the PVGIS Data Download portal [64] (https://joint-research-centre.ec.europa.eu/photovoltaic-geographical-information-system-pvgis/pvgis-data-download/sarah-2-solar-radiation-data_en accessed on 4 September 2024). Values of the function f, estimated using Equation (2) for the whole of Europe, are illustrated in Figure 2.
Finally, to allow for the efficiency of the solar panel, we estimate the annual energy generation potential as:
E 2 θ , ψ , ϕ , λ = η E 1 θ , ψ , ϕ , λ
In our model, we simply assume that the efficiency η = 0.2. Although modern crystalline silicon PV modules typically have an efficiency a little higher than this, losses in cabling and inverters would probably decrease the efficiency defined in terms of power input to the electricity grid to 0.2 or even a little lower. In any case, this parameter is easily adjusted. Because of the relatively coarse spatial resolution of the SARAH2 dataset it is not feasible to distinguish between illumination conditions in different parts of the city. Hence, all places within Tromsø are assumed to lie at the same location so we assume, using the data of Figure 2, that f(ϕ, λ) = 0.4, and hence, that η f(ϕ, λ) = 0.08.
To facilitate calculation within a GIS environment, we approximate the function E0 at this latitude as:
E 0 θ , ψ , 70 0 A θ + B ( θ ) c o s ψ + C ( θ ) c o s 2 ψ
where the slope-dependent functions have the following polynomial forms (values of θ expressed in radians):
A = 1731 + 49.5 θ + 689.3 θ 2 457.5 θ 3
B = 19.5 1758.2 θ + 833.7 θ 2 + 32.0 θ 3
C = 1.8 + 105.3 θ 161.5 θ 2 642.2 θ 3 + 1040.4 θ 4 397.2 θ 5
Inspection of tabulated data on E0 as a function of aspect angle suggested that the form of Equation (4) would be suitable at any latitude, while Equations (5)–(7) were generated by least-squares fitting of polynomial functions to the data tabulated for latitude 70° N. Errors in fitting these equations were less than 2% in all cases. If the analysis reported in this work were to be repeated for another location, the coefficients, but not the form, of these equations, would be different.
We assume that solar PV panels are laid parallel to roof surfaces, so that the potential for energy generation is controlled locally by the roof slope and aspect. These were calculated from high-resolution LiDAR data downloaded from the Norwegian national elevation data portal Høydedata, which provides openly accessible digital elevation models. Specifically, we utilized LiDAR-derived DSMs and DTMs with a raster resolution of 0.25 m × 0.25 m. These data are part of the National Detailed Elevation Model (NDH—Nasjonal detaljert høydemodell), where selected areas were laser-scanned at a density of 5 psm. The LiDAR data collection for Tromsø was acquired on 31 July 2022 under favorable conditions characterized by clear skies and light turbulence, although some localized areas of snow were present. For our analysis, we downloaded 69 raster tiles covering the entire island of Tromsøya. Each tile measures 800 m × 600 m (3200 × 2400 pixels) and, at a bit depth of 32 bits, has a data size of approximately 30 MB, so the total data volume for this study was approximately 2 GB. Data were accessed at https://hoydedata.no/LaserInnsyn2/ (accessed on 7 September 2024). Tiles were merged into a single file and processed in QGIS to generate slope and aspect, then the modeled annual area-specific PV generation E2 was calculated for all pixels using the raster calculator to implement Equations (1)–(7).

2.3. Selecting Usable Areas of Roofs

The data were filtered in two further steps. To this point, the method estimates the insolation on all parts of the defined DSM, regardless of whether they constitute roofs of buildings, other artificial surfaces, or vegetation. It is necessary to remove all areas that are not roofs of buildings through the selective masking of the defined DSM. This could potentially be achieved using the defined DSM itself [37,65], in conjunction with the defined DTM, to select for objects sufficiently elevated above the terrain and perhaps using a texture measure to differentiate between artificial structures and tall vegetation [32,66]. In the present study, however, building footprints were derived from vector data provided by Open Streetmap (OSM), simplifying and automating the approach, particularly for large-scale research. The data contained in the OSM database is available under the Open Data Common Open Database License (ODbL) license3 which allows for data download along with using, sharing, and modifying it as long as the data are attributed and made available under the same license [66,67]. This includes classification of buildings and other structures. Data were downloaded from https://www.openstreetmap.org/#map=12/69.6656/18.9976 (accessed on 30 September 2024) using the ‘Export’ function. Informal checking suggested that the data contained in this dataset were generally accurate and up-to-date, and 16,445 building footprints were extracted, encompassing a diverse range of building types, and imported into QGIS. The raster data representing the PV generation variable E2 were set to zero for all non-roof areas.
The final filtering step was to segment rooftop areas into suitable and unsuitable parts for mounting solar panels. This required a simple criterion that could be applied uniformly across the entire dataset. We chose to define suitability based on uniformity of slope and aspect—in effect, the local smoothness of the surface—and derived this as a texture measure of the PV generation variable E2. This was implemented by applying a high-pass filter, followed by thresholding, converting to binary form, and then dilating. Symbolically, this is represented by Equation (8):
D I S E 2 > t = 1
where > and = are interpreted as binary tests with outcomes of 0 if false and 1 if true, D is a dilation operator, I is a square identity kernel, S is a square smoothing kernel of unit total weight, t is a threshold value, and |.| denotes the absolute value. The result of applying this set of operators is a binary image representing unsuitably rough areas of the roof surface. Choices that must be made in implementing Equation (8) are the neighborhood size of the kernels D, I, and S, the specific form of the kernel S, and the value of threshold t. After some experimentation, we selected a 3 × 3 neighborhood for I and S, and a 3 × 3 neighborhood for D with a threshold value of 20. Examples of the application of this operation to small and large buildings are shown in Figure 3.
Figure 4 provides a graphical summary of our methodological approach, emphasizing its simplicity as a pixel-by-pixel image processing method with parameterized modelling of solar radiation.

3. Results

Local PV generation potential calculated using our algorithm, and masked to include only suitable roof surfaces, is presented in Figure 5a,b. Typical values of this variable range from approximately 120 to 180 kWh m−2 per year, with a mean value of 147 and a standard deviation of 31. As implicit in the algorithm, the roof aspect can be seen to play an important part in controlling the generation potential (Figure 5b).
The data presented in Figure 5a,b were spatially smoothed using a uniform circular kernel with a radius of 250 m, to give a sense of regional variations across the city. The result of this operation is presented in Figure 6.
The spatial filter was normalized (idempotent), implying that a uniform area in Figure 5a,b would be unchanged by smoothing. In this context, we can note that a value of 1 kWh m−2 is equivalent to 10 MWh ha−1, so that typical local values of the generation potential as shown in Figure 7 range from approximately 1.2 to 1.8 GWh ha−1. We note that there is appreciable spatial variation in this quantity, with particularly high values around the district of Hamna in the north-central part of the island, where the density of buildings is especially high, and low values around Breivik (the north-eastern part of the island), the airport, and the coastal areas. A few parts of the island have no roofs, and hence no regional generation potential according to this definition, within a 250-metre radius.
Data were analyzed according to the class of building. Importing metadata from OSM into the GIS attribute table of QGIS revealed 54 different building types, some of which (such as ‘bridge’ and ‘greenhouse’) were deemed unsuitable for installation of solar panels, some of which were essentially duplicates (e.g., ‘garage’ and ‘garages’), and some of which were ambiguous (e.g., ‘roof’ and ‘yes’). After eliminating unsuitable objects, the dataset was reduced to 16,377 buildings. Types were aggregated into broad classes as follows: ‘residential’ = apartments, dormitory, house, residential, semidetached house, terrace; ‘commercial’ = commercial, retail, hotel, office; ‘civic’ = civic, fire station, hangar, hospital, parking, prison, public, toilets, transportation, cathedral, chapel, church, monastery, religious, grandstand, riding hall, sports center, stadium; ‘education’ = college, kindergarten, school, university; ‘outbuildings’ = carport, garage, garages, cabin, hut, shed; ‘warehouses’ = warehouse; ‘industrial’ = barn, boathouse, farm, farm auxiliary, container, industrial. Analysis by building type is summarized in Table 1, which shows both the average roof area for each building class and the average usable roof area after applying the roof smoothness criterion. It also shows the average roof slope. Average aspects were not calculated since the figure would be largely meaningless for most buildings, which have sections of roofs with different aspects. The Table 1 shows, inter alia, that residential buildings account for approximately 60% of all buildings, 50% of total roof area, and 40% of total estimated energy generation from the city, and that the total estimated annual energy generation potential is approximately 200 GWh, or approximately 30% of the city’s current total consumption of electricity.
Table 1 shows differences between the roof slopes of different classes of buildings: residential buildings and outbuildings generally have the steepest pitches, while warehouses are generally flatter. The effect of roof slope on the area-specific generation potential was investigated, as summarized in Figure 7. We do not attempt to analyze the data according to roof aspect, since while most roofs are characterized by a single value of slope this is not true of aspect.
Fitting a quadratic variation to the data explains 23% of the variance. Since the model depends only on roof slope and orientation, the remaining 77% of the variance must be attributed to orientation.

4. Discussion

We have developed a relatively simple, transparent, and easily adaptable method of estimating citywide rooftop solar PV generation, applied to the city of Tromsø in Norway. Fundamentally, the method requires little more than high-resolution LiDAR data. A key aspect of the approach is the separation of consideration of the solar illumination conditions from a pixel-by-pixel analysis of the DSM representing the urban roofscape. This allows for much faster processing than would be the case if the neighborhood of each point in the DSM needed to be examined to determine local shadowing and different horizon configurations.
Lacking any direct validation of the results, we can consider their plausibility by comparing our work to the results of other studies in the region. The mean estimated annual area specific to solar PV generation potential was found to be 147 kWh m−2 per annum, and a typical estimated usable fraction of roof area approximately 30–50%. Measurement data from actual PV installations in Tromsø is very limited, but initial results show area-specific energy generation of between 110 and 150 kWh m−2 per year for south-facing surfaces with 20–60° slope, with typical values approximately 130 kWh m−2 [62]. This is slightly lower than the results of the present study, and could possibly be attributed to effects from shading, soiling, or snow coverage. For buildings with both north- and south-facing roofs, Equations (4) to (7) imply that the average would be approximately 80% of the south-facing value, i.e., in the range 90–120 kWh m−2 per year. Larsen (2022) [43] has modeled, in some detail, the generation potential from a particular warehouse building in Tromsø with different PV setups, assuming that a total area of 5187 m2 (35%) of the roof would be suitable for solar PV generation. Larsen estimated an area-specific generation potential of between 91 and 141 kWh m−2 per annum, using (respectively) ‘Area Solar Radiation’ in ArcGIS Pro [46], and ‘PVsys solar modeller’ [68] driven by local meteorological data. The latter figure is very close to our modelled average of 142.3 kWh m−2 per annum for warehouses (Table 1), which encourages confidence in our algorithm. Falklev (2017) [60] also investigated the solar radiation potential in Tromsø island by creating a solar radiation map using ArcGIS Pro and compared it to data from one measurement station on the island (Holt), finding these values to be consistent approximately 700 kWh m−2 for a horizontal surface. This is similar to the results in our study. Building on this work, Eikeland (2019) [69] further investigated the solar energy potential on roofs in Tromsø, simulation approximately 130 kWh m−2 for a residential roof, and up to 134 GWh total energy output if all suitable roof areas on the Tromsøya island were utilized, that is, slightly lower than the results from the present study [69].
It may be reasonable to suggest that the range of energy generation density found by Larsen (2022) [43] in modeling one specific building is indicative of the uncertainty in estimating the potential generation from all rooftop areas in the city, so perhaps a realistic estimate would be 130 to 210 GWh. We note that this would represent approximately 20–30% of the city’s total electricity consumption, although we do not assert that such an installation would be viable on economic, practical, or aesthetic grounds. As already noted, the potential generation of solar PV electricity at high latitudes is highly seasonal, so there is an increased likelihood that generation during the summer months would be surplus to requirements, and hence, that seasonal energy storage would be needed.
With regard to the required computational time, Falklev (2017) reported over 13 h for an analysis of the whole of the island for one month using a DSM with 1 m resolution, but the time was reduced to approximately 145 min by splitting the map into five tiles and utilizing multiple processors simultaneously [60]. Eikeland (2019) used a DSM with 0.25 m resolution and divided the map into 14 tiles, giving a computational time of 4 h per tile using a server with high computational capacity [69]. These figures, and our own experiments, imply a typical processing time for the whole island of Tromsøya at a resolution of 0.25 m of the order of one or a few days using GIS tools such as ArcGIS Spatial Analyst. By contrast, our more approximate pixel-by-pixel approach processes the data roughly 100 times faster.
One important uncertainty is in the filtering of unsuitable areas of the roof. According to our adopted criteria, we retain on average approximately 35–50% of the roof area. While this is not identical to the assumption of a fixed proportion of the roof, such as 25%, our approach is at least capable of distinguishing between roofs with many irregularities and those that are smooth, and it seems implausible that the figure should be much lower or indeed higher than this. The method could be validated by considering the shapes of individual buildings in detail. Although it would not be consistent with the pixel-by-pixel approach we have adopted in our algorithm, promising approaches to characterizing roof geometry from high-resolution remotely sensed data are available. While the EAGLE approach demonstrates significant advantages by utilizing both LiDAR and aerial image-derived height data to perform a detailed quality assessment of extracted roof planes including shadow analysis our current study was intentionally focused on developing a simplified, scalable method using open vector data for roof area selection. Future research could integrate the enhanced precision and quality metrics of the EAGLE methodology to further refine the extraction of suitable roof surfaces [57].
Some aspects of our model could be more realistic. It does not allow for shadowing by surrounding buildings or by an irregular topographic horizon. Schuffert et al. (2015) identify shading as a crucial factor affecting the efficiency of solar energy installations, and the EAGLE system accounts for this by conducting a detailed analysis of shading effects on individual roof planes, considering not only local obstructions, such as skylights and chimneys, but also neighboring buildings and topography [57]. Both aspects could be incorporated, with further processing of the LiDAR-derived DSM and including a topographic DEM, though this would move the approach significantly away from the pixel-by-pixel approach that we have developed, and the computational burden would be greatly increased. Relevant studies that have included an allowance for shadowing include those of [29,30] for Uppsala, Sweden, and of [38,39] for Canberra, Australia. A study of Västerås, Sweden [70] also incorporated shading by trees. Compared with these settlements, Tromsø is densely built and surrounded by relatively high mountains, so shadowing effects are likely to be relatively more important. Given the complexity of implementing an exact solution [57,71], it is suggested that a statistical approach following shadowing could be adopted in future work. A comparison of our estimated values of solar PV generation with in situ measurements [62] suggests that the combined effect of these unmodelled factors is overestimated by approximately 30%.
The model also assumes that solar panels are always laid directly on the roof. In the case of relatively steeply pitched roofs, this is certainly a reasonable assumption, although for flat roofs it is usually not the case, especially at high latitudes, that the optimum slope of a solar panel is rather steep. As Table 1 shows, the dominant roof pitch in Tromsø is relatively steep, at least for the residential buildings, which account for both the largest number of buildings and 40% of the potential energy output. It is therefore unlikely that this assumption is an important source of error for residential buildings. The average roof slope is lower for buildings such as warehouses or commercial buildings, and though these are lower in number than residential buildings, their roof areas are generally larger. A number of these buildings also have large flat roofs, which may be ideal for solar installations, but where the installation would not be laid directly on the roof, but either with a low slope angle or vertically using bifacial modules. The assumption of modules laid directly on the roof would underestimate the potential of such installations. For example, Larsen (2022) [43] studied three possible PV layouts on the same roof area and found that a layout with east and west facing sloped modules yielded approximately 50% more than horizontal modules. It would be possible to modify the functional dependence expressed by Equation (4) to allow for this effect. In any case, we note that failing to allow for this effect is ‘conservative’ in the sense that it underestimates the potential for energy generation by not choosing the optimum slope for solar panels.
According to the definition presented in this paper, the area-specific solar PV potential is influenced by both the roof aspect and slope and the number of roofs in the area. It should be noted that the individual roofs in an area with lower area-specific solar PV potential could still have high solar PV potential and vice versa. Furthermore, according to the values in Table 1, a high occurrence of warehouses and industrial buildings in an area would also reduce the area-specific solar PV potential with this definition, compared to an area with a high density of residential buildings. The possibility that the model underestimates the solar PV potential of flat roofs, as discussed above, should be kept in mind when studying the map in Figure 6.
It can, however, be argued that the focus on only roof areas in this study omits a potentially significant contribution from façade-mounted PV systems. This type of installation is particularly relevant in the north since the optimal angle for an installation (approximately 50°) is steeper than most roofs. Other benefits of façade installations are fewer problems with snow pileup on the modules, and a better match between the heating season and potential solar energy generation, due to the low sun height in the spring and autumn.
Other sources of uncertainty should be considered. The height error in the LiDAR data is estimated as 1 cm based on transects through a flat area, while horizontal errors can only be assessed to be small compared to the gridding interval of 25 cm (they may be much smaller than this). Since the planar geometry of roofs is not determined from the LiDAR data itself but from OSM data, errors in slope and aspect of roofs determined from the LiDAR data will depend principally on the height errors and will be negligibly small. For example, an error in the mean roof slope of an outbuilding of an area 45 m2 (Table 1) will be of the order of 0.01°, assuming that LiDAR errors are spatially uncorrelated. Very occasional errors in the spatial interpolation of the LiDAR data onto the 25 cm grid were noted, estimated informally as less than one error per thousand buildings.
Potential errors in the OSM vector data are harder to quantify [72]. Although the data were not inspected systematically or exhaustively, matching the hill-shaded LiDAR GSM to the OSM vector outlines of buildings gave great confidence in the spatial accuracy in the latter, and again, very conservatively, we state that not more (and, in reality, probably very many fewer) than one building in a thousand was incorrectly located in the OSM dataset. Other authors [22,56,73] have demonstrated the utility of OSM data for evaluating rooftop solar energy potential. The attributes describing the buildings, however, were somewhat less reliable. We attempt to minimize the impact of variability in the naming of building types by grouping them into very general classes (Table 1). Errors in this attribution, or too broad a generalization, could obscure the relationship between solar energy generation potential and different building types, but would not affect more general conclusions about the total energy generation from a building.
Deductions from applying the method that relates primarily to the spatial distribution and orientation of roof surfaces will be only weakly affected by the omissions noted above, or by incorrectly selected parameters. The conclusion implied by Table 1, that residential buildings could provide approximately 30% of the total rooftop solar energy generation capacity of the city, is believed to be robust, and is similar to the conclusion of study [42] for urban areas in Lithuania, as is the result implied by Figure 7 that the variance in area-specific energy generation capacity is partitioned between slope and aspect in the ratio of approximately 1 to 3. Figure 7 also reliably indicates district-to-district variations in potential energy generation density, and hence, provides a good indication of where energy storage could preferentially be located. Higher district potentials are associated with denser building patterns and favorable roof orientations, while lower potentials indicate lower ratios of roof area to ground area, in turn likely associated with wealthier neighborhoods.
Although this investigation has been focused on the city of Tromsø in Arctic Norway, the method developed here could readily be applied to other locations for which accurate high-resolution (sub-meter) LiDAR data are available. Notably, the public availability of such datasets is steadily expanding, thereby enabling broader spatial applications. In this regard, in study [31], the authors provide a comprehensive overview of the current state of LiDAR data availability throughout European countries. Beyond Europe, numerous other regions—including the United States, Canada, China, New Zealand, and Australia [73,74]—are also actively engaged in the systematic acquisition of high-resolution LiDAR surveys.

5. Conclusions

We have developed a relatively simple, transparent approach to estimating the potential annual generation of solar PV across an urban area, using publicly available high-resolution LiDAR data. The method is very fast (typically 100 times faster) compared to other commonly used approaches, though with the loss of some accuracy. The speed of processing fits the method to analysis of relatively large areas. The method can be implemented using open-access tools, such as QGIS GIS software (checked against version 3.34.7). We have demonstrated the method for the city of Tromsø in Arctic Norway, where the estimated local PV generation potential for suitable roof areas ranges between 120 and 180 kWh m−2 per year, yielding an overall potential of roughly 200 GWh per year. Although no direct validation has yet been performed, we believe that the conclusion that between 20 and 30% of the city’s annual electricity consumption could be generated from rooftop solar installations is robust. Approximately 40% of this total would be contributed by residential properties. Our method permits simple visualization of spatial variation in electricity generation density, which is potentially useful for determining the location of seasonal energy storage facilities.

Supplementary Materials

The following supporting information can be downloaded at: https://www.repository.cam.ac.uk/items/529dccc2-f0fa-4c8e-8379-e7b67a120ad9 (accessed on 25 February 2025), Cambridge’s Apollo repository, GNU Octave code, which should also run in the MATLAB environment, to calculate the annual insolation on a horizontal surface.

Author Contributions

Gareth Rees and Liliia Hebryn-Baidy conceived this project and carried out the geospatial analysis. Clara Good contributed experimental data from installations in Tromsø. Gareth Rees, Liliia Hebryn-Baidy, and Clara Good all contributed to the writing. All authors have read and agreed to the published version of the manuscript.

Funding

This research received no external funding.

Data Availability Statement

Map data copyrighted by OpenStreetMap contributors and available from https://www.openstreetmap.org (accessed on 30 September 2024). LiDAR data for Tromsøya are provided freely by the Norwegian Mapping Agency Statens Kartverket, and are available from https://hoydedata.no/LaserInnsyn2 (accessed on 7 September 2024).

Acknowledgments

The work described here is connected to the project Northern Homes, supported by Troms and Finnmark County, Norway, and to the Arctic Centre for Sustainable Energy (ARC), both at UiT The Arctic University of Norway, Tromsø. LHB gratefully acknowledges the financial support of the British Academy and the Council for At-Risk Academics (CARA).

Conflicts of Interest

The authors declare no conflicts of interest.

References

  1. Global Market Outlook for Solar Power 2024–2028. Intersolar Europe, Global Solar Council (GSC). 2024. Available online: https://www.solarpowereurope.org/insights/outlooks/global-market-outlook-for-solar-power-2024-2028/detail (accessed on 12 September 2024).
  2. Norway 2022 Energy Policy Review. IEA Publications. 2022. Available online: https://iea.blob.core.windows.net/assets/de28c6a6-8240-41d9-9082-a5dd65d9f3eb/NORWAY2022.pdf (accessed on 27 September 2024).
  3. Lee, H.; Calvin, K.; Dasgupta, D.; Krinner, G.; Mukherji, A.; Thorne, P.; Trisos, C.; Romero, J.; Aldunce, P.; Barrett, K.; et al. IPCC, 2023: Climate Change 2023: Synthesis Report. Contribution of Working Groups I, II and III to the Sixth Assessment Report of the Intergovernmental Panel on Climate Change; Core Writing Team, Lee, H., Romero, J., Eds.; Intergovernmental Panel on Climate Change (IPCC): Geneva, Switzerland, 2023. [Google Scholar] [CrossRef]
  4. Muellejans, H.; Pavanello, D.; Sample, T.; Kenny, R.; Shaw, D.; Field, M.; Dunlop, E.; Stoyanova Lyubenova, T.; Mihaylov, B.; Antonelli, A.; et al. State-of-the-Art Assessment of Solar Energy Technologies; EUR 31189 EN, JRC130086; Publications Office of the European Union: Luxembourg, 2022; ISBN 978-92-76-55849-1. [Google Scholar] [CrossRef]
  5. Molnár, G.; Ürge-Vorsatz, D.; Chatterjee, S. Estimating the global technical potential of building-integrated solar energy production using a high-resolution geospatial model. J. Clean. Prod. 2022, 375, 134133. [Google Scholar] [CrossRef]
  6. Bódis, K.; Kougias, I.; Jäger-Waldau, A.; Taylor, N.; Szabó, S. A high-resolution geospatial assessment of the rooftop solar photovoltaic potential in the European Union. Renew. Sustain. Energy Rev. 2019, 114, 109309. [Google Scholar] [CrossRef]
  7. Kapsalis, V.; Maduta, C.; Skandalos, N.; Bhuvad, S.S.; D’Agostino, D.; Yang, R.J.; Udayraj Parker, D.; Karamanis, D. Bottom-up energy transition through rooftop PV upscaling: Remaining issues and emerging upgrades towards NZEBs at different climatic conditions. Renew. Sustain. Energy Transit. 2024, 5, 100083. [Google Scholar] [CrossRef]
  8. Chen, L.; Hu, Y.; Wang, R.; Li, X.; Chen, Z.; Hua, J.; Osman, A.I.; Farghali, M.; Huang, L.; Li, J.; et al. Green building practices to integrate renewable energy in the construction sector: A review. Environ. Chem. Lett. 2023, 22, 751–784. [Google Scholar] [CrossRef]
  9. Maka, A.O.M.; Ghalut, T.; Elsaye, E. The pathway towards decarbonisation and net-zero emissions by 2050: The role of solar energy technology. Green Technol. Sustain. 2024, 2, 100107. [Google Scholar] [CrossRef]
  10. Joshi, S.; Zakeri, B.; Mittal, S.; Mastrucci, A.; Holloway, P.; Krey, V.; Shukla, P.R.; O’Gallachoir, B.; Glynn, J. Global high-resolution growth projections dataset for rooftop area consistent with the shared socioeconomic pathways, 2020–2050. Sci. Data 2024, 11, 563. [Google Scholar] [CrossRef]
  11. EU/2024/1275. Directive (EU) 2024/1275 of the European Parliament and of the Council of 24 April 2024 on the Energy Performance of Buildings (Recast) (Text with EEA Relevance). Available online: https://eur-lex.europa.eu/eli/dir/2024/1275/oj (accessed on 9 February 2025).
  12. EU. Energy Performance of Buildings Directive. Available online: https://energy.ec.europa.eu/topics/energy-efficiency/energy-efficient-buildings/energy-performance-buildings-directive_en (accessed on 11 February 2025).
  13. Kakoulaki, G.; Taylor, N.; Szabo, S.; Kenny, R.; Chatzipanagi, A.; Jäger-Waldau, A. Communication on the potential of applied PV in the European Union: Rooftops, reservoirs, roads (R3). EPJ Photovolt. 2024, 15, 2. [Google Scholar] [CrossRef]
  14. Mathew, T.C.; Nagaraja Pandian, S. Unveiling the shadows: A qualitative exploration of barriers to rooftop solar photovoltaic adoption in residential sectors. Clean Energy 2024, 8, 218–228. [Google Scholar] [CrossRef]
  15. Bernardi, M.; Ferralis, N.; Wan, J.H.; Villalon, R.; Grossman, J.C. Solar energy generation in three dimensions. Energy Environ. Sci. 2012, 5, 6880. [Google Scholar] [CrossRef]
  16. Khan, M.I.; Al Huneidi, D.I.; Asfand, F.; Al-Ghamdi, S.G. Climate Change Implications for Optimal Sizing of Residential Rooftop Solar Photovoltaic Systems in Qatar. Sustainability 2023, 15, 16815. [Google Scholar] [CrossRef]
  17. Jouttijärvi, S.; Lobaccaro, G.; Kamppinen, A.; Miettunen, K. Benefits of bifacial solar cells combined with low voltage power grids at high latitudes. Renew. Sustain. Energy Rev. 2022, 161, 112354. [Google Scholar] [CrossRef]
  18. Akbarinejad, T.; Machlein, E.; Bertolin, C.; Lobaccaro, G.; Salaj, A.T. Enhancing the deployment of solar energy in Norwegian high-sensitive built environments: Challenges and barriers—A scoping review. Front. Built Environ. 2023, 9, 1285127. [Google Scholar] [CrossRef]
  19. Sicard, M.; Kageyama, M.; Charbit, S.; Braconnot, P.; Madeleine, J.-B. An energy budget approach to understand the Arctic warming during the Last Interglacial. Clim. Past 2022, 18, 607–629. [Google Scholar] [CrossRef]
  20. Formolli, M.; Kleiven, T.; Lobaccaro, G. Assessing solar energy accessibility at high latitudes: A systematic review of urban spatial domains, metrics, and parameters. Renew. Sustain. Energy Rev. 2023, 177, 113231. [Google Scholar] [CrossRef]
  21. Formolli, M.; Lobaccaro, G.; Kanters, J. Solar Energy in the Nordic Built Environment: Challenges, Opportunities and Barriers. Energies 2021, 14, 8410. [Google Scholar] [CrossRef]
  22. Formolli, M.; Schön, P.; Kleiven, T.; Lobaccaro, G. Solar accessibility in high latitudes urban environments: A methodological approach for street prioritization. Sustain. Cities Soc. 2024, 103, 105263. [Google Scholar] [CrossRef]
  23. Gholami, H. Technical potential of solar energy in buildings across Norway: Capacity and demand. Sol. Energy 2024, 278, 112758. [Google Scholar] [CrossRef]
  24. The Energy Commission. 2023. Available online: https://www.regjeringen.no/no/dokumenter/nou-2023-3/id2961311/ (accessed on 10 October 2024).
  25. Bjørndalen, J.; Fiskvik, I.H.; Hadizadeh, M.; Horschig, T.; Ingeberg, K. Energy Transition Norway 2050. DNV AS. Available online: https://www.dnv.com/publications/energy-transition-norway-2024/ (accessed on 10 October 2024).
  26. Solar Power Potential on Built-Up Areas in Norway. 2024. Available online: https://solenergiklyngen.no/wp-content/uploads/2024/10/Solkraftpotensial-pa-nedbygde-arealer-i-Norge_final.pdf (accessed on 10 October 2024).
  27. Socioeconomic Analysis of 8 TWh Solar Power. 2024. Available online: https://solenergiklyngen.no/wp-content/uploads/2024/03/240321-DNV-Menon-Solrapport-6.pdf (accessed on 10 October 2024).
  28. Eikeland, O.F.; Apostoleris, H.; Santos, S.; Ingebrigtsen, K.; Boström, T.; Chiesa, M. Rethinking the role of solar energy under location specific constraints. Energy 2022, 211, 118838. [Google Scholar] [CrossRef]
  29. Lingfors, D. Solar Variability Assessment in the Built Environment: Model Development and Application to Grid Integration. Ph.D. Thesis, Acta Universitatis Upsaliensis, Uppsala, Sweden, 2017. [Google Scholar]
  30. Lingfors, D.; Bright, J.M.; Engerer, N.A.; Ahlberg, J.; Killinger, S.; Widén, J. Comparing the capability of low- and high-resolution LiDAR data with application to solar resource assessment, roof type classification and shading analysis. Appl. Energy 2017, 205, 1216–1230. [Google Scholar] [CrossRef]
  31. Kakoulaki, G.; Martinez, A.; Florio, P. Non-Commercial Light Detection and Ranging (LiDAR) Data in Europe; Publications Office of the European Union: Luxemburg, 2021; Available online: https://op.europa.eu/en/publication-detail/-/publication/0a79fa74-2c29-11ec-bd8e-01aa75ed71a1/language-en (accessed on 3 September 2024).
  32. Huang, Y.; Chen, Z.; Wu, B.; Chen, L.; Mao, W.; Zhao, F.; Wu, J.; Wu, J.; Yu, B. Estimating Roof Solar Energy Potential in the Downtown Area Using a GPU-Accelerated Solar Radiation Model and Airborne LiDAR Data. Remote Sens. 2015, 7, 17212–17233. [Google Scholar] [CrossRef]
  33. Kodysh, J.B.; Omitaomu, O.A.; Bhaduri, B.L.; Neish, B.S. Methodology for estimating solar potential on multiple building rooftops for photovoltaic systems. Sustain. Cities Soc. 2013, 8, 31–41. [Google Scholar] [CrossRef]
  34. Nguyen, H.T.; Pearce, J.M.; Harrap, R.; Barber, G. The Application of LiDAR to Assessment of Rooftop Solar Photovoltaic Deployment Potential in a Municipal District Unit. Sensors 2012, 12, 4534–4558. [Google Scholar] [CrossRef] [PubMed]
  35. Hu, M.; Liu, Z.; Huang, Y.; Wei, M.; Yuan, B. Estimation of Rooftop Solar Photovoltaic Potential Based on High-Resolution Images and Digital Surface Models. Buildings 2023, 13, 2686. [Google Scholar] [CrossRef]
  36. Nelson, J.R.; Grubesic, T.H. The use of LiDAR versus unmanned aerial systems (UAS) to assess rooftop solar energy potential. Sustain. Cities Soc. 2020, 61, 102353. [Google Scholar] [CrossRef]
  37. Nys, G.-A.; Poux, F.; Billen, R. CityJSON Building Generation from Airborne LiDAR 3D Point Clouds. ISPRS Int. J. Geo-Inf. 2020, 9, 521. [Google Scholar] [CrossRef]
  38. Lingfors, D.; Killinger, S.; Engerer, N.A.; Widén, J.; Bright, J.M. Identification of PV system shading using a LiDAR-based solar resource assessment model: An evaluation and cross-validation. Sol. Energy 2018, 159, 157–172. [Google Scholar] [CrossRef]
  39. Lingfors, D.; Shepero, M.; Good, C. Modelling City Scale Spatio-temporal Solar Energy Generation and Electric Vehicle Charging Load. In Proceedings of the 8th International Workshop on the Integration of Solar Power into Power Systems, Stockholm, Sweden, 16–17 October 2018. [Google Scholar]
  40. Gooding, J.; Crook, R.; Tomlin, A.S. Modelling of roof geometries from low-resolution LiDAR data for city-scale solar energy applications using a neighbouring buildings method. Appl. Energy 2015, 148, 93–104. [Google Scholar] [CrossRef]
  41. Manni, M.; Nocente, A.; Kong, G.; Skeie, K.; Fan, H.; Lobaccaro, G. Solar energy digitalization at high latitudes: A model chain combining solar irradiation models, a LiDAR scanner, and high-detail 3D building model. Front. Energy Res. 2022, 10, 1082092. [Google Scholar] [CrossRef]
  42. Kozlovas, P.; Gudzius, S.; Ciurlionis, J.; Jonaitis, A.; Konstantinaviciute, I.; Bobinaite, V. Assessment of Technical and Economic Potential of Urban Rooftop Solar Photovoltaic Systems in Lithuania. Energies 2023, 16, 5410. [Google Scholar] [CrossRef]
  43. Larsen, A. Solar Photovoltaic Potential on Commercial Buildings in Arctic Latitudes. Master’s Thesis, UiT The Arctic University of Norway UiT Norges Arktiske Universitet, Tromsø, Norway, 2022. Available online: https://hdl.handle.net/10037/26152 (accessed on 15 October 2024).
  44. Liang, J.; Gong, J.; Xie, X.; Sun, J. Solar3D: An Open-Source Tool for Estimating Solar Radiation in Urban Environments. ISPRS Int. J. Geo-Inf. 2020, 9, 524. [Google Scholar] [CrossRef]
  45. Melius, J.; Margolis, R.; Ong, S. Estimating Rooftop Suitability for PV: A Review of Methods, Patents, and Validation Techniques. National Renewable Energy Laboratory. 2013. Available online: https://www.nrel.gov/docs/fy14osti/60593.pdf (accessed on 12 September 2024).
  46. ArcGIS Pro. Version Spatial Analyst Toolbox. [Computer Software]. Esri. Available online: https://pro.arcgis.com/en/pro-app/latest/tool-reference/spatial-analyst/area-solar-radiation.htm (accessed on 25 October 2024).
  47. Neteler, M.; Mitasova, H. Open Source GIS; Springer US: New York, NY, USA, 2008. [Google Scholar] [CrossRef]
  48. Hofierka, J.; Suri, M. The solar radiation model for Open source GIS: Implementation and applications. In Proceedings of the International GRASS Users Conference, Trento, Italy, 11–13 September 2002. [Google Scholar]
  49. Conrad, O. Potential Incoming Solar Radiation, [Computer Software]. 2010. Available online: https://saga-gis.sourceforge.io/saga_tool_doc/6.1.0/ta_lighting_2.html (accessed on 25 October 2024).
  50. Kaňuk, J.; Zubal, S.; Šupinský, J.; Šašak, J.; Bombara, M.; Sedlák, V.; Gallay, M.; Hofierka, J.; Onačillová, K. Testing of V3.Sun Module Prototype for Solar Radiation Modelling on 3d Objects with Complex Geometric Structure. Int. Arch. Photogramm. Remote Sens. Spat. Inf. Sci. 2019, XLII-4/W15, 35–40. [Google Scholar] [CrossRef]
  51. Amillo, G.; Huld, T. Performance Comparison of Different Models for the Estimation of Global Irradiance on Inclined Surfaces: Validation of the Model Implemented in PVGIS; Publications Office: Luxembourg, 2013; Available online: https://op.europa.eu/en/publication-detail/-/publication/4ef8c4e1-4397-4e27-8487-448786327f27/language-en (accessed on 15 October 2024).
  52. Amillo, G.; Taylor, N.; Martinez, A.M. Adapting PVGIS to Trends in Climate, Technology and User Needs. In Proceedings of the 38th European Photovoltaic Solar Energy Conference and Exhibition (PVSEC), Online, 6–10 September 2021; pp. 907–911. [Google Scholar] [CrossRef]
  53. Mueller, R.; Behrendt, T.; Hammer, A.; Kemper, A. A New Algorithm for the Satellite-Based Retrieval of Solar Surface Irradiance in Spectral Bands. Remote Sens. 2012, 4, 622–647. [Google Scholar] [CrossRef]
  54. Margolis, R.; Gagnon, P.; Melius, J.; Phillips, C.; Elmore, R. Using GIS-based methods and lidar data to estimate rooftop solar technical potential in US cities. Environ. Res. Lett. 2017, 12, 074013. [Google Scholar] [CrossRef]
  55. Martínez-Rubio, A.; Sanz-Adan, F.; Santamaría-Peña, J.; Martínez, A. Evaluating solar irradiance over facades in high building cities, based on LiDAR technology. Appl. Energy 2016, 183, 133–147. [Google Scholar] [CrossRef]
  56. Ni, H.; Wang, D.; Zhao, W.; Jiang, W.; Mingze, E.; Huang, C.; Yao, J. Enhancing rooftop solar energy potential evaluation in high-density cities: A Deep Learning and GIS based approach. Energy Build. 2024, 309, 113743. [Google Scholar] [CrossRef]
  57. Schuffert, S.; Voegtle, T.; Tate, N.; Ramirez, A. Quality Assessment of Roof Planes Extracted from Height Data for Solar Energy Systems by the EAGLE Platform. Remote Sens. 2015, 7, 17016–17034. [Google Scholar] [CrossRef]
  58. Prieto, I.; Izkara, J.L.; Usobiaga, E. The Application of LiDAR Data for the Solar Potential Analysis Based on Urban 3D Model. Remote Sens. 2019, 11, 2348. [Google Scholar] [CrossRef]
  59. Yan, L.; Zhu, R.; Kwan, M.-P.; Luo, W.; Wang, D.; Zhang, S.; Wong, M.S.; You, L.; Yang, B.; Chen, B.; et al. Estimation of urban-scale photovoltaic potential: A deep learning-based approach for constructing three-dimensional building models from optical remote sensing imagery. Sustain. Cities Soc. 2023, 93, 104515. [Google Scholar] [CrossRef]
  60. Falklev, E.H. Mapping of Solar Energy Potential on Tromsøya Using Solar Analyst in ArcGIS. Master’s Thesis, UiT The Arctic University of Norway UiT Norges Arktiske Universitet, Tromsø, Norway, 2017. [Google Scholar]
  61. Statistics Norway. Annual Report 2020. Available online: https://www.ssb.no/en (accessed on 5 June 2024).
  62. Boström, T.; Good, C. Long-Term PV Performance at High Latitudes. Department of Technology and Safety UiT the Arctic University of Norway, Tromso, Norway. 2024; manuscript in preparation. [Google Scholar]
  63. Huld, T.; Müller, R.; Gambardella, A. A new solar radiation database for estimating PV performance in Europe and Africa. Sol. Energy 2012, 86, 1803–1815. [Google Scholar] [CrossRef]
  64. Pfeifroth, U.; Kothe, S.; Müller, R.; Trentmann, J.; Hollmann, R.; Fuchs, P.; Werscheck, M. Surface Radiation Data Set—Heliosat (SARAH)—Edition 2 (Version 2.0, p. 7.1 TiB) [NetCDF-4]. 2017. Satellite Application Facility on Climate Monitoring (CM SAF). Available online: https://doi.org/10.5676/EUM_SAF_CM/SARAH/V002 (accessed on 4 September 2024).
  65. Adjiski, V.; Kaplan, G.; Mijalkovski, S. Assessment of the solar energy potential of rooftops using LiDAR datasets and GIS based approach. Int. J. Eng. Geosci. 2023, 8, 188–199. [Google Scholar] [CrossRef]
  66. Alhamwi, A.; Medjroubi, W.; Vogt, T.; Agert, C. GIS-based urban energy systems models and tools: Introducing a model for the optimisation of flexibilisation technologies in urban areas. Appl. Energy 2017, 191, 1–9. [Google Scholar] [CrossRef]
  67. Biljecki, F.; Chow, Y.S.; Lee, K. Quality of crowdsourced geospatial building information: A global assessment of OpenStreetMap attributes. Build. Environ. 2023, 237, 110295. [Google Scholar] [CrossRef]
  68. PVsyst SA. PVsyst Photovoltaic Software v7. PVsyst SA. Satigny, Switzerland. Available online: https://www.pvsyst.com/ (accessed on 15 October 2024).
  69. Eikeland, O.F. Investigation of Photovoltaic Energy Yield on Tromsøya by Mapping Solar Potential in ArcGIS. Master’s Thesis, Faculty of Science and Technology, UiT The Arctic University of Norway, Tromsø, Norway, 2019. Available online: https://hdl.handle.net/10037/16580 (accessed on 15 October 2024).
  70. Yang, Y.; Campana, P.E.; Stridh, B.; Yan, J. Potential analysis of roof-mounted solar photovoltaics in Sweden. Appl. Energy 2020, 279, 115786. [Google Scholar] [CrossRef]
  71. Romero Rodríguez, L.; Duminil, E.; Sánchez Ramos, J.; Eicker, U. Assessment of the photovoltaic potential at urban level based on 3D city models: A case study and new methodological approach. Sol. Energy 2017, 146, 264–275. [Google Scholar] [CrossRef]
  72. Vargas-Munoz, J.E.; Srivastava, S.; Tuia, D.; Falcão, A.X. OpenStreetMap: Challenges and Opportunities in Machine Learning and Remote Sensing. IEEE Geosci. Remote Sens. Mag. 2021, 9, 184–199. [Google Scholar] [CrossRef]
  73. Cheng, L.; Zhang, F.; Li, S.; Mao, J.; Xu, H.; Ju, W.; Liu, X.; Wu, J.; Min, K.; Zhang, X.; et al. Solar energy potential of urban buildings in 10 cities of China. Energy 2020, 196, 117038. [Google Scholar] [CrossRef]
  74. Gagnon, P.; Margolis, R.; Melius, J.; Phillips, C.; Elmore, R. Estimating rooftop solar technical potential across the US using a combination of GIS-based methods, lidar data, and statistical modeling. Environ. Res. Lett. 2018, 13, 024027. [Google Scholar] [CrossRef]
Figure 1. (a) Study area location, showing the island of Tromsøya where most parts of the city of Tromsø are located. Our analysis is confined to the island area. (b) The geographical location of Tromsø in Norway is marked with a red dot.
Ijgi 14 00123 g001
Figure 2. Geographical cloudiness function f defined for Europe, calculated using Equation (2) and PVGIS-SARAH2 estimates of average horizontal insolation between 2005 and 2020. The value of f at the location of Tromsø is taken as 0.4. The apparent discontinuity in values at latitude 65° is due to the joining of two different sources of solar irradiance data (SARAH2 in the southerly part, ERA5 in the northerly part).
Ijgi 14 00123 g002
Figure 3. Estimating unusable parts of roofs. (a,c) show image extracts with small and large buildings, respectively, while (b,d) show the corresponding areas after applying the roof roughness filter defined by Equation (8). The variable represented in these raster images is the value of the annual estimated area-specific PV generation, E2.
Ijgi 14 00123 g003
Figure 4. Integrated workflow—combining insolation modeling (left) with LiDAR-based image processing (right) used to estimate annual rooftop PV potential and identify usable roof surfaces. Colors and symbols are used to differentiate different data types, as specified in the legend.
Ijgi 14 00123 g004
Figure 5. (a) Local area-specific rooftop solar PV generation potential for Tromsøya, estimated using the algorithm developed in this work, (b) enlarged view of part of (a).
Ijgi 14 00123 g005
Figure 6. Area-specific solar PV generation potential. Smoothing radius = 250 m.
Ijgi 14 00123 g006
Figure 7. Area-specific generation potential as a function of roof slope angle for all buildings on Tromsøya. Each point represents a single roof. The regression line is the best-fitting quadratic variation.
Ijgi 14 00123 g007
Table 1. Statistical analysis of annual solar PV generation potential for different building classes on Tromsøya. Definitions of building classes are given in the main text.
Total (GWh)Annual Energy Generation (kWh/m2/year)Average Slope (°)Average Usable Area (m2)Average Area (m2)NumberClass
86149.037.15916810,211residential
31143.827.9395793555commercial
19144.328.36911274199civic
16145.027.5530968211education
8150.135.013454342outbuildings
17142.323.6543748227warehouses
11142.431.9356483238industrial
15142.837.3272378394unknown
203 16,377TOTAL
Disclaimer/Publisher’s Note: The statements, opinions and data contained in all publications are solely those of the individual author(s) and contributor(s) and not of MDPI and/or the editor(s). MDPI and/or the editor(s) disclaim responsibility for any injury to people or property resulting from any ideas, methods, instructions or products referred to in the content.

