Abstract
Accurate side road detection is essential for traffic management, urban planning, and vehicle navigation. However, existing research mainly focuses on road network construction, lane extraction, and intersection identification, while fine-grained side road detection remains underexplored. Therefore, this study proposes a road segment-level side road detection method based on crowdsourced trajectory data: First, considering the geometric and dynamic characteristics of trajectories, SRDet introduces a trajectory lane-change pattern recognition method based on mutation intervals to distinguish the heterogeneity of lane-change behaviors between main and side roads. Secondly, combining geometric features with spatial statistical theory, SRDet constructs multimodal features for trajectories and road segments, and proposes a potential side road segment classification model based on random forests to achieve precise detection of side road segments. Finally, based on mutation intervals and potential side road segments, SRDet utilizes density peak clustering to identify main and side road access points, completing the fitting of side roads. Experiments were conducted using 2021 Beijing trajectory data. The results show that SRDet achieves precision and recall rates of 84.6% and 86.8%, respectively. This demonstrates the superior performance of SRDet in side road detection across different areas, providing support for the precise updating of urban road navigation information.
1. Introduction
Side roads, as an important component of complex urban transportation networks, are typically used to connect other roads or provide services to surrounding areas such as residential and industrial zones, thereby effectively alleviating traffic pressure on main roads. With the development of intelligent transportation systems and autonomous driving technologies, the demand for higher accuracy in electronic maps has grown significantly. Detailed side road information provides a foundational data layer for traffic navigation and flow management. The absence or inaccuracies in side road information can lead to increased traffic congestion and reduced navigation efficiency, particularly during peak hours. The real-time and accuracy requirements for electronic maps have driven rapid advancements in map construction and inference technologies, with significant achievements, especially in the field of road information extraction [1,2,3]. Comprehensive surveys such as Feng and Zhu [4] provide an overview of trajectory data mining techniques and their wide-ranging applications, highlighting the central role of trajectory-based approaches in intelligent transportation systems. Digital road information can be extracted from various sources, including laser point clouds, remote sensing imagery, and crowdsourced trajectory data [5]. Among these, laser point clouds are valued for their accuracy in road boundary detection, as demonstrated by Hervieu and Soheilian [6], who proposed a precise roadside detection and reconstruction method using LIDAR sensors. However, they often suffer from sparsity and precision issues, making detailed boundary extraction difficult, especially under high-noise conditions [7]. Remote sensing imagery is susceptible to weather and sunlight conditions, and can suffer from occlusion or confusion due to physical objects [8]. In contrast, crowdsourced trajectory data contains rich implicit features and offers advantages such as low cost, high timeliness, and broad coverage, making it an important source of information for current digital road information extraction [9]. While trajectory-based road information extraction techniques are relatively mature, they predominantly target main roads and major intersections, posing substantial challenges when applied directly to side roads. To overcome this limitation, we adapt and extend these methods by incorporating novel components, including semantic filtering and mutation interval analysis, to address the distinctive features of side roads. This focused approach not only complements existing methodologies but also fulfills practical needs for improved map accuracy and traffic management.
Currently, research on digital road information extraction based on trajectory data primarily includes road abstraction, incremental branching, and intersection linking [10]. These approaches treat trajectory data as input to either construct the map in a single step or incrementally expand the map over time. However, side roads, as roads adjacent to main roads, face increased difficulty in data acquisition due to irregular traffic flow and complex environmental occlusions. Existing studies tend to focus resources and attention on main roads and key nodes, often neglecting side roads due to their lower traffic volume, and research in this area remains relatively scarce. The research most relevant to side road detection in digital road information extraction can be further categorized into two types: road-line-based and road-point-based. In road-line-based research, typical tasks include lane structure recognition, road centerline, road boundary, and lane marking extraction [11], with further refinement in lane recognition [12]. Road-point-based research mainly focuses on key road navigation points such as intersections, gas stations, and parking lots, along with auxiliary information [13].
In road-line-based research, various methods have been proposed to extract road features from trajectory data, especially focusing on the identification of road networks and lane-level information. For example, Li et al. [14] utilized a spatial linear clustering technique that effectively infers road segments from GPS trajectories, detects missing roads, and validates existing road networks. Yang et al. [15] introduced a method using Delaunay triangulation to extract high-quality road boundary information from crowdsourced GPS vehicle trajectories. Li, Kulik [14] further combined the Delaunay triangulation method with a constrained Gaussian mixture model, achieving lane information extraction from low-precision floating vehicle data [16]. Zhou, Wang [17] proposed a method for urban road extraction based on floating car trajectory clustering, which considers the impact of trajectory point locations and directional angles. This approach uses path clustering to identify road contours and employs Delaunay triangulation to extract the road skeleton line. Many studies have developed various clustering algorithms to analyze large-scale trajectory data, aiming to discover intrinsic movement patterns and extract meaningful structures. Methods such as the partition-and-group trajectory clustering [18], as well as segmentation based on representativeness [19], share the common feature of performing clustering on segmented sub-trajectories. By decomposing complex trajectories into manageable segments, these approaches enhance the accuracy and interpretability of lane detection in large-scale trajectory datasets. For instance, Wagstaff, Cardie [20] introduced a new clustering algorithm to identify roads and compute lane structures. Uduwaragoda, Perera [21] applied kernel density clustering methods to detect lane numbers and positions from vehicle GPS trajectory data. Alsahfi, Almotairi [22] proposed a method using GPS trajectories to generate road maps by recognizing intersections and connecting them to construct road segments through a grid-based line simplification algorithm. Moreover, Wu, Zhang [23] used DeepDualMapper to effectively combine aerial images and GPS trajectory data, generating high-precision maps. Li, Wang [24] introduced a time-varying road network model (TRNM), which efficiently represents dynamic topological relationships arising from time-dependent traffic control measures, supporting lane-level navigation in path planning. Yuan, Yue [25] further advanced this research by analyzing lane-change behavior to extract lane centerlines from high-precision trajectory data and inferring lane-level topological structures, leading to improved lane-level road network generation. These studies highlight the development of advanced methods to address road network extraction and lane-level information retrieval, facilitating more accurate digital map construction and efficient traffic management systems.
In point-based road recognition research, several methods have been developed to extract key locations such as intersections and points of interest from trajectory data. For instance, Xingzhe, Philips [26] proposed a method based on GPS trajectory to extract common sub-trajectories, using local maxima in the sub-trajectory end point density map to identify intersections. Zhang, Liu [27], addressing the density differences in trajectories on different road types, introduced an adaptive density equalization method and turning distance ratio for identifying intersections. Their method effectively distinguishes intersections from points with similar movement characteristics, such as gas stations and parking lots. Deng, Huang [28] proposed a hierarchical trajectory rasterization strategy to address the spatial distribution heterogeneity of trajectory density. They also developed a full-process “conversion–segmentation–optimization” method for road intersection hierarchical extraction from a visual perspective. Yang, Tang [29] utilized a multi-level feature extraction strategy to achieve intersection recognition and layout detection, automatically generating lane-level intersection maps from crowdsourced trajectory data. Karagiorgou and Pfoser [30] employed hotspot analysis and point clustering based on triangulation to detect the spatial coverage of road intersections [31]. They used an improved hierarchical trajectory clustering algorithm and K-segment fitting to generate urban road intersection models. Li, Su [32] studied a personalized route guidance system called PaRE, which uses user trajectory data to extract points of interest or intersections from the road network. These studies highlight various methods aimed at accurately identifying road points such as intersections from trajectory data, contributing to the improvement of road network mapping, navigation systems, and urban traffic management. An intuitive comparison of key point- and line-based road network extraction methods is provided in Table 1.

Table 1.
Comparative summary of road network extraction approaches: strengths and limitations.
In summary, significant progress has been made in the field of main road information extraction, yet systematic research on side road information remains relatively scarce. Studies focusing on road lines emphasize the extraction of general road features, using methods such as clustering algorithms, geometric features, and probabilistic classification models to identify road line objects [35,36]. Essentially, these methods identify segments with higher trajectory density distributions, and the reliability of the results improves as trajectory density increases. However, they struggle to capture the geometric shape and topological structure of adjacent road segments. Since side roads are typically located adjacent to main roads and trajectory data is limited in precision, these methods tend to focus on the overall distribution of trajectory lines, overlooking the spatial heterogeneity in the data, which makes it difficult to effectively identify side road objects within adjacent areas. In research focused on road points, some progress has been made in intersection identification and road network simplification through feature engineering and clustering algorithms. However, these methods are still limited to key point extraction and have not delved deeply into the connectivity relationships of road networks [37,38]. When extracting spatial distribution information, different points of interest often exhibit unique behavioral characteristics. Even though side roads have associated access points, existing methods still struggle to effectively identify these access points. Therefore, the challenges in existing methods for extracting digital road information can be summarized as follows:
- Not suitable for the extraction of side road information that is parallel and compactly distributed on both sides of the main road.
- Over-reliance on geometric information of the road network and road structure, neglecting the spatial data distribution patterns of the trajectory data.
- Lack of comprehensive consideration of the overall trajectory path morphology and the spatiotemporal feature changes, with most methods treating individual trajectory points as the main analysis objects.
Based on the principles of side road design and traffic flow characteristics analysis, trajectories on side roads are typically connected to the main road via access points. Therefore, accurately identifying side road access points is key to detecting side road information. Additionally, in the lane-change behaviors between the main and side roads, the trajectory paths exhibit significant differences in terms of morphology, turning, speed, and other driving behaviors, providing important evidence for the extraction of side road information. In light of these challenges, this study proposes a road segment-level side road detection method based on trajectory data, SRDet, which not only fills the research gap in the field of side road information detection but also effectively enhances the data-updating capability of navigation systems and the efficiency of road management. The contributions are as follows:
- A mutation interval identification method is proposed to extract significant trajectory change features and combine side road lane-change driving behaviors, achieving precise classification of trajectory behaviors.
- A road segment classification model based on multimodal features is proposed, combining the linear features of main and side roads with the spatiotemporal distribution features of trajectories to filter potential side road segments.
- A method for access point identification based on mutation point density distribution and lane-change type is proposed, enabling access point localization and classification, and fitting to generate side roads.
2. Methodology
The trajectory points generated by vehicles on the road record the current driving status and location information. After matching with the corresponding road segments, these trajectory data can be used to extract feature information that reflects the road network structure [39]. Main and side roads are typically connected by access points, and the lane-change behaviors of vehicles at these access points exhibit specific spatiotemporal characteristics. These characteristics can reveal the connection relationship between main and side roads, serving as a reference for road segment classification. Based on this, this study proposes a side road detection method, which, based on trajectory data, determines whether a side road exists within a road segment and further identifies the specific location of the main and side road access points, thereby generating road segment-level side road information and updating road segment navigation data. The overall process of the side road detection method is shown in Figure 1.
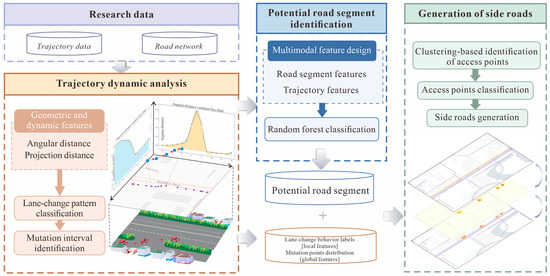
Figure 1.
Overall process of side road detection.
Firstly, during the data preprocessing stage, trajectory and OSM road network data are preprocessed to achieve the connection between trajectory points and road segments. Secondly, in the trajectory dynamic analysis, lane-change behavior features are taken as core feature variables to identify lane-change behavior pattern trajectory sequences. Furthermore, a stepwise optimization strategy is employed, where the trajectory mutation intervals are defined to quantify the interaction features between main and side roads. Then, in road segment classification, the point pattern analysis method is used to detect the spatial clustering characteristics of mutation points, and a multimodal feature space is constructed. A random forest model is used for road segment classification. Finally, for potential side road segments, kernel density estimation and density peak clustering methods are applied to accurately identify and classify the main and side road access points, thereby fitting and generating the complete topology of the side road.
Definition 1 Trajectory Sequence ().
, where , and , . A trajectory is composed of a series of points arranged in chronological order [40], where and represent the spatial coordinates of trajectory point , typically in longitude and latitude, and is the timestamp of . The sampling frequency between two consecutive points is , and the sampling distance is .
Definition 2 Mutation Interval ().
, where . represents a subset of continuous trajectory points that meet specific spatiotemporal constraints, with trajectory point satisfying both time and spatial change conditions. is used to identify potential side road segments and serves as an input feature for the subsequent side road extraction process, providing guidance for accurately locating side road entrances and paths.
Definition 3 Road Segment ().
, where each road segment , and represent the spatial coordinates of the start and end points of , is the unique identifier of , describes the topological attributes of , indicating its adjacency relationships within the road network, and denotes the classification attribute of , representing the road type.
2.1. Dynamic Analysis of Trajectory Lane-Change Patterns
To fully explore the geometric and dynamic features of trajectories, this study proposes a lane-change pattern recognition method based on core variables, aimed at dynamically selecting lane-change behavior trajectories. Additionally, a stepwise optimization strategy is employed, introducing the concept of mutation intervals to further reveal the intrinsic characteristics of trajectory sequences. By combining lane-change pattern recognition with mutation interval identification, this approach integrates both local and global features, providing data-driven guidance for Section 2.3.
2.1.1. Data Cleaning and Fusion
GPS trajectory data is susceptible to noise and anomalous trajectories due to interference from weather conditions or tall surrounding objects, and may experience stopping phenomena in complex environments such as traffic congestion. To improve the accuracy of trajectory pattern recognition, preprocessing of GPS trajectory data is performed, including quality filtering, anomaly trajectory handling, trajectory segmentation, and stop detection. In order to ensure the accuracy of subsequent side road detection results and improve the quality of OSM road network data, crowdsourced OSM road network data is preprocessed, including the removal of low-level roads, road network interruptions, and road segment merging operations. Data cleaning ensures the quality of the input data and reduces noise interference.
Based on the processed trajectory data and road network topology, this study uses the Hidden Markov Model (HMM) for map matching to obtain the association information between road segments and trajectories [41]. By considering multiple features such as the distance, direction, and sampling accuracy of trajectory points, along with the road segment direction, the observation and transition probabilities are calculated. The Viterbi algorithm is then used to infer the optimal path, correcting instances of reverse driving caused by trajectory point drift and connecting trajectory points to road segments [42]. This method effectively combines the spatial location and dynamic features of trajectory points, ensuring the matching accuracy between trajectories and road segments. It provides a reliable data foundation for subsequent lane-change pattern recognition. The connection between trajectory points and data ensures that trajectory points are accurately mapped to specific road segments in the road network, laying the foundation for later classification based on road segments and providing high-quality data input for lane-change pattern analysis.
2.1.2. Lane-Change Pattern Recognition
Considering that vehicles often transition between the main road and side roads via access points, analyzing the temporal and spatial distribution characteristics of trajectory data at these access points becomes a crucial method for detecting side road information. In this study, lane-change behavior is defined as the continuous change in position and direction of a vehicle during its driving process. This behavior differs from actions such as entering a highway ramp, turning at an intersection, or overtaking on the main road, as it is influenced by the unique physical structure of access points and the dynamic interaction of vehicles. As a result, it exhibits distinct dynamic spatiotemporal distribution characteristics.
To effectively characterize this lane-change pattern, this study constructs two key variables: projection distance and angle distance, which are used to describe the geometric and dynamic characteristics of different lane-change patterns, respectively.
Definition 4 Projection Distance ().
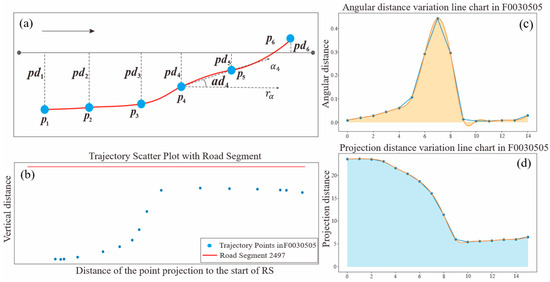
, where represents the projection distance of the trajectory point to the main road. Specifically, it is the perpendicular distance from the trajectory point to the line segment formed by the start and end points of the main road segment. If the trajectory point lies to the left of the road segment, the projection distance is positive; if it lies to the right, the projection distance is negative. The calculation of the trajectory’s projection distance is shown in Figure 2a.
Figure 2.
Schematic diagram of geometric and dynamic features. (a) Schematic diagram of projection distance and angular distance calculations; (b) trajectory F0030505 scatter plot with road segment 2497; (c) angular distance variation line chart in F0030505; (d) projection distance variation line chart in F0030505.
Definition 5 Angular Distance ().
, where represents the angular distance between the direction angle of trajectory point and the main road direction, calculated as shown in Figure 2a, as indicated by Equation (1):
where represents the azimuth angle of trajectory point , calculated from the latitude and longitude coordinates of trajectory points and , which indicates the travel direction of the trajectory point. denotes the road direction, which is aligned with the trajectory direction and is calculated from the latitude and longitude coordinates of the road’s start and end points. Figure 2b illustrates a specific trajectory scatter plot as an example, while (c) and (d) show the line charts of angular distance variation and projection distance variation, respectively.
In this study, SRDet constructs two core variables—the projection distance and the angular distance—of the trajectory to quantify the dynamic features of the trajectory, enabling the quantitative filtering of lane-change behavior trajectories. Specifically, lane-change pattern recognition adopts a multidimensional constraint strategy, which, based on the geometric and dynamic changes in the trajectory and its statistical representation, quantifies the spatial distribution instability and directional mutations of the trajectory, further capturing lane-change behavior on main and side roads. Building on the classification concept of TraClass [43], SRDet introduces a statistical-based trajectory feature extraction technique, combining local and global feature statistical representations to enhance the evaluation of trajectory variability, achieving the quantitative classification of lane-change and non-lane-change trajectories. During the recognition process, a multidimensional feature selection framework is utilized to improve classification accuracy and enhance the repeatability and generalization ability of the results. Based on this, SRDet accurately selects trajectory sequences that conform to the lane-change characteristics of main and side roads while filtering out irrelevant data that does not meet the criteria.
2.1.3. Mutation Interval Recognition
To further reveal the intrinsic features of trajectory sequences, SRDet adopts a multilayered optimization strategy for the fine extraction of mutation intervals. First, potential mutation points are detected based on the preprocessed trajectory data and core geometric variables (projection distance and angular distance). Then, an initial mutation interval is progressively constructed through temporal extension, describing the dynamic mutation range of the trajectory. Finally, the mutation point distribution and lane-change behavior types are output, as shown in the overall process in Figure 3. During the extension process, the trend of the angular distance is analyzed based on preset threshold values, and interval boundaries are defined to improve the accuracy of mutation interval boundary recognition. In the interval merging process, for trajectories with multi-peak fluctuation characteristics, adjacent mutation intervals are further integrated to enhance the coherence of lane-change behavior.
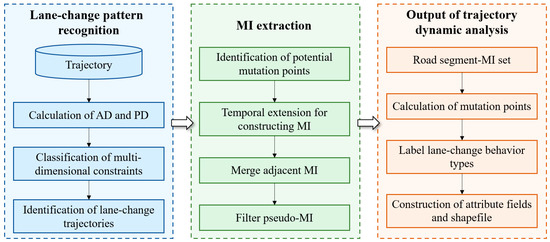
Figure 3.
Trajectory dynamic analysis process based on projection distance (PD), angular distance (AD), and mutation interval (MI).
To address the abnormal fluctuations that may arise from dynamic drift in some trajectory points, SRDet designs a fluctuation filtering mechanism to further optimize the interval quality in complex road network environments. Specifically, by combining the statistical characteristics of the changes in the azimuth angles at the beginning and end of the mutation intervals, SRDet sets dynamic angular constraints to capture the small-angle variation characteristics of real lane-change behavior (see Equation (2)), thereby excluding pseudo-mutation intervals caused by junction turns. The 30° threshold in Equation (2) is established based on highway design standards and geometric characteristics of mainline-side road configurations. According to highway design specifications of the Technical Standard for Highway Engineering in Suburban and Rural Town Areas, the geometric design of interchange ramps, acceleration/deceleration lanes, and weaving sections must satisfy specific angular constraints to ensure safe vehicle maneuvering. The stepwise optimization strategy retains the characteristics of true lane-change behavior, eliminates irrelevant pseudo-intervals, and enhances SRDet’s adaptability in complex traffic scenarios, providing higher-quality data input for subsequent feature construction.
A schematic representation of the real-world spatial distribution of main and side roads is shown in Figure 4a. In practical road environments, the main and side roads are typically arranged in parallel, with a separation (green belt or fence) between them. As a result, vehicles can only switch between main and side roads at specific access points. This spatial constraint forms the foundation for reliably determining the direction of lane-change events. Furthermore, the physical meaning of the projection distance, which is used to identify the direction of lane changes, is further illustrated in Figure 2a. In this figure, we show the geometric relationship between the trajectory points and the road segment, using the scenario of a side road to main road lane change as an example. The variation in the projection distance (refer to Definition 4) along the trajectory directly reflects the vehicle’s transition direction. In more detail, for the optimized mutation interval , if , indicating a decrease in the projection distance to the main road, it is considered a lane-change behavior from the main road to the side road. Conversely, if , indicating an increase in the projection distance to the main road, it is defined as a lane-change behavior from the side road to the main road, as shown in Figure 4b,c. SRDet uses the median index point of the interval trajectory or the geometric center of the two middle points of the interval as the mutation point for the mutation interval. The final output includes the optimized mutation interval and the set of mutation points, with each mutation interval labeled with its corresponding lane-change behavior type (main road to side road, side road to main road).
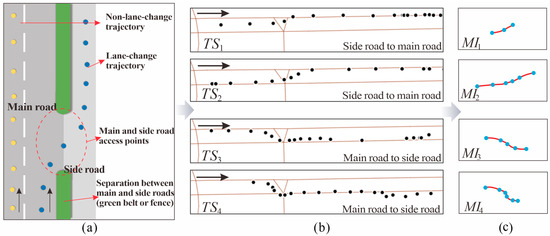
Figure 4.
Explanation of mutation interval identification. (a) Schematic of main and side roads; (b) example of lane-change trajectories on main and side roads; (c) mutation interval extraction.
2.2. Potential Side Road Segment Recognition
Based on road segment data, trajectory data, and mutation intervals, this study proposes a refined road segment classification method for subsequent access point identification and side road generation. First, SRDet combines geometric features with spatial statistical theory, introducing Ripley’s K function to quantitatively model the spatial clustering characteristics of key mutation points [44]. Then, by incorporating trajectory features (such as speed changes and angular direction) and road network features (such as segment length, curvature, and traffic flow distribution), SRDet constructs a multimodal feature extraction framework to systematically describe the complex characteristics of main and side road access points. Finally, SRDet proposes a side road segment recognition model based on random forests to improve the accuracy of access point identification and the robustness of the model.
2.2.1. Multimodal Feature Construction
To further capture the spatiotemporal distribution characteristics of lane-change behaviors on main and side roads, this study proposes a multimodal feature construction method based on the combination of geometric features and spatial statistical theory. This approach integrates spatial distribution statistical features based on Ripley’s K function, dynamic vehicle trajectory features, and road network features, systematically modeling the complex characteristics of main and side road access points and providing feature inputs for the random forest classification model.
First, to detect the spatial clustering characteristics of the mutation point set on the road segment, Ripley’s K function is used for quantitative modeling, as shown in Equation (3).
Here, represents the spatial distance, is the total number of mutation points, and is the total area of the feature. is the weight. In the specific analysis, mutation points from different road segments are extracted through the K function analysis to assess the significant clustering at specific distances. Figure 5 presents the visualization results of mutation point pattern analysis for a specific road segment. For road segments with main and side road access points, mutation points tend to cluster at the access points, while road segments without side roads exhibit a random distribution.
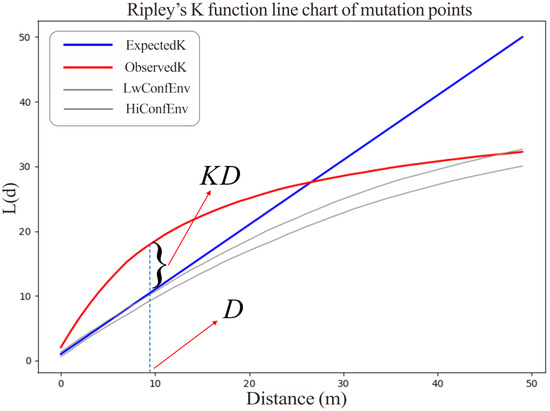
Figure 5.
Ripley’s K function line chart of mutation points. KD is the difference between the observed and predicted K-values, and D is the optimal clustering distance.
The spatiotemporal distribution characteristics of trajectory and road network data are closely related to the identification of main and side road access points, and can be mined through road network and trajectory data. Therefore, this study constructs a series of features for the identification of potential side road segments and access points. As shown in Table 2, based on the work in [45], this study introduces statistical features related to dynamic behavior and spatial clustering, effectively combining the local and global correlations between road network topology information and trajectory behavior features, which enables a comprehensive description of the complex characteristics of main and side road access points.
Table 2.
Design of multimodal features.
2.2.2. Random Forest-Based Model Construction for Side Road Segment Identification
To identify potential side road segments, this study proposes a classification model based on random forest. The random forest algorithm demonstrates strong adaptability in handling complex data and multidimensional features. By integrating the results of multiple decision trees, it effectively captures the relationship between road segment features and the existence of side roads. Trajectory data often contains noise and randomness, and the ensemble learning mechanism of random forest can smooth the impact of noise while emphasizing key features, ensuring the stability and reliability of classification results. This makes it well suited for tasks involving structured data in the field of geographic information [46].
For the mutation interval , SRDet constructs the feature array , where is the label vector indicating the road segment category (labeled as Y for potential side road segments and N for non-potential side road segments). Through feature importance analysis, random forest can automatically identify the key variables influencing side road determination, thereby efficiently adapting to complex data structures.
2.3. Access Point Identification and Side Road Generation
For potential side road segments, this study performs mutation point density calculation based on density peak clustering and kernel density estimation, extracting access points and fitting side roads. The advantage of SRDet lies in the fact that, with clear road segment characteristics, access point identification is conducted within the framework of existing road segment features and traffic behavior patterns, ensuring accurate recognition results.
As shown in Figure 6, SRDet first uses the Gaussian kernel density method to estimate the local density of mutation points, characterizing the density distribution of mutation points for the target road segment [47]. Based on the overall density distribution layer of mutation points, SRDet applies the density peak clustering algorithm to extract cluster centers, which are then treated as potential main and side road access points. Next, based on the lane-change behavior types identified through mutation interval recognition, SRDet classifies the main and side road access points, as shown in Equation (4). Finally, based on the characteristics of side road configuration and the categories of access points, SRDet fits and generates the complete structure of the side road.
where represents the number of access points within the search radius where the lane-change behavior label is marked as transitioning from the main road to the side road, and represents the number of access points within the search radius where the lane-change behavior label is marked as transitioning from the side road to the main road. represents the proportion of access points within the search radius where the lane-change behavior label is marked as transitioning from the main road to the side road, relative to all access points. The maximum threshold and minimum threshold are set to determine the classification of main and side road access points, as shown in Table 3.
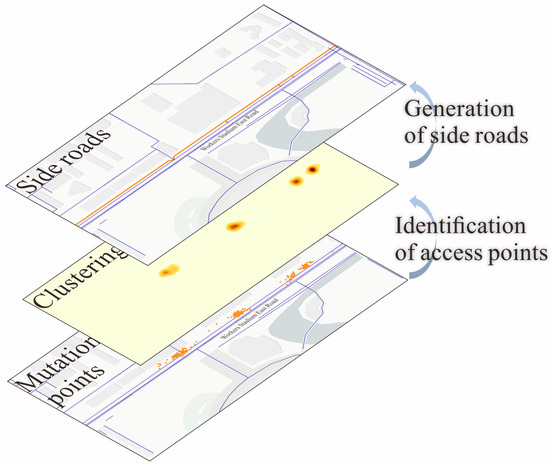
Figure 6.
Access point identification and side road generation process.
Table 3.
Classification of main and side road access points.
According to road design standards and actual traffic flow characteristics, side roads can be classified into three categories: “Only main-to-side road”, “Only main-to-side road”, and “Bidirectional turn allowed” as shown in Table 3. Based on the extracted access points and their categories, and considering the typical parallel distribution of side roads close to the main road, the side road segments are fitted and generated. This step identifies the access points of side roads and generates the road segment-level side road paths.
3. Experiments and Results
3.1. Study Area and Dataset
The study area is located in the central districts of Beijing, including Dongcheng, Xicheng, and Chaoyang, as shown in Figure 7a,b. Experiment Area A is selected from the area around Chaoyangmen Outer Street, located in Dongcheng and Chaoyang Districts, as shown in Figure 7c. Experiment Area B is selected from the area near Xidan North Street in Xicheng District, as shown in Figure 7d. Experiment Area A features relatively regular road shapes, with a simple road network structure and classification. This area was chosen because its simple road network structure is conducive to initially verifying the feasibility of SRDet. Experiment Area B has a more complex, winding road network with varying road distances, high intersection and junction ratios, and diverse network levels. This area was selected to test the adaptability of SRDet in a more complex and variable environment. The selection of these different regions allows for evaluating SRDet’s performance in road network environments of varying complexity. The characteristics of the selected regions and the data used are representative for the analysis and extraction of crowdsourced trajectory data and main and side road access points, which can validate the effectiveness of SRDet for road networks with varying road levels, segment structures, and distribution features.
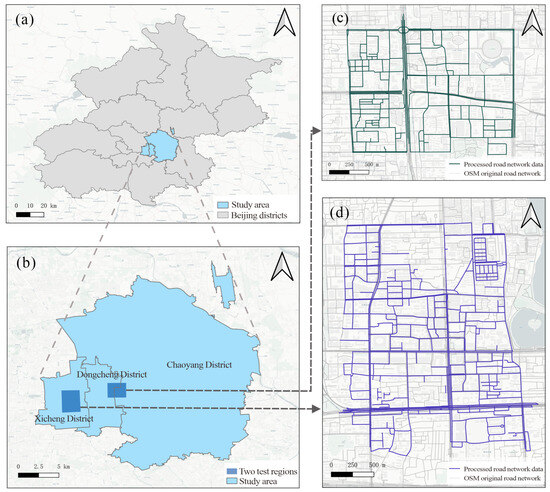
Figure 7.
Location of the study area. (a) Location of Beijing; (b) location of several districts; (c) road network of Experiment Area A; (d) road network of Experiment Area B.
Considering the redundancy in the original road network, this study performs preprocessing on the OSM road networks of two regions [48]. The specific data information is shown in Table 4. Based on the existing research [45], the OSM road network is reclassified, and in combination with side road setup rules, urban ring roads, non-signalized intersections, grade-separated roads, and functionally strong connecting roads such as elevated and ground-level connections, as well as dedicated turning lanes for left and right turns, are excluded. In the experimental regions A and B, 35 and 156 road segments with mutation point distributions are selected, respectively. These segments, along with access points of the main and side roads, are labeled using Baidu Street View and remote sensing images, serving as verification samples for SRDet in this study to test the performance of the main and side road recognition algorithm.
Table 4.
Description of experimental area data.
The trajectory data is sourced from GPS navigation data generated by vehicles between 08:00 and 20:00 on 22 January 2021. Each trajectory point in the raw data includes attributes such as the trajectory device ID, timestamp, positioning accuracy, latitude, longitude, and others, as detailed in Table 4. The preprocessing steps for the trajectory data include the following:
- Retaining points with positioning accuracy within 5 m and deleting trajectory points that are duplicate in terms of location or time.
- Excessive points are removed through a speed threshold (eliminating abnormal trajectories that are either far below the free-flowing speed of motor vehicles or significantly exceed the road speed limit).
- In trajectory segmentation, a sampling frequency and sampling distance are set; when or , it is marked as a new segment.
- Stay detection identifies stationary or slow-moving segments, which are then replaced with virtual trajectory points.
- Feature calculation includes average speed and direction angle.
3.2. Trajectory Dynamic Analysis Experiment
For trajectory pattern classification, this study conducts extensive experimental statistical analysis to set the thresholds for the range of projection distance , standard deviation , and maximum angular distance , in order to quantitatively filter the trajectories. Trajectories that satisfy Equation (5) are classified as lane-change trajectories, while those that do not satisfy Equation (5) are classified as non-lane-change trajectories. To assess the robustness of our method to the selection of threshold parameters, we conducted a sensitivity analysis for ptp(PD), std(PD), and max(AD). Each parameter was varied individually within ±15% of its baseline value (i.e., 0.85 × baseline, baseline, 1.15 × baseline), while keeping the other parameters fixed. The results are presented in Table 5, demonstrating that the model’s precision, recall, and F1-score remained stable within this range, indicating that our approach is robust to reasonable changes in threshold selection.
Table 5.
Sensitivity analysis for trajectory pattern classification.
Figure 8 shows trajectories with different lane-change patterns on the same road segment. (a) illustrates the selected non-lane-change trajectories, where the fluctuations in projection distance and angular distance are within the threshold range, representing normal fluctuations during regular driving on the main road. (b) shows lane-change trajectories, where projection distance and angular distance exhibit distinct features, indicating a lane-change behavior from the main road to the side road.
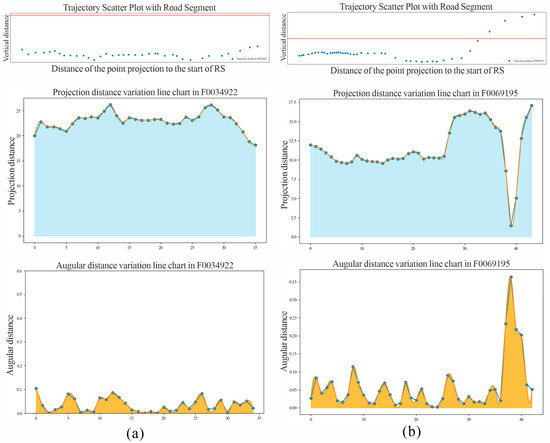
Figure 8.
Lane-change pattern recognition. (a) Non-lane-change trajectory F0034922; (b) lane-change trajectory F0069195.
Based on lane-change trajectories, mutation intervals are extracted with the threshold for set to 2.8, as it captures the characteristic surge in angular distance variation observed in over 95% of true lane-change intervals. This threshold effectively separates genuine lane-change behaviors from intervals merely reflecting small-scale fluctuations or measurement noise. Taking two trajectories with mutation intervals, F0029351 and F0063911, from the same road segment as examples, Figure 9 illustrates how SRDet captures the angular change characteristics of lane-change behavior between main and side roads, removing pseudo-mutation intervals. In Figure 9a, after filtering the mutation intervals, two mutation intervals remain, which actually correspond to a single lane-change event. Therefore, the mutation intervals are merged to obtain the complete mutation interval, representing the behavior of changing lanes from the main road to the side road. In Figure 9b, the trajectory shows behavior from the side road to the main road, followed by a return to the side road after traveling a certain distance on the main road. This behavior is distinctly reflected in the projection distance and angular distance line charts. Through threshold settings, two mutation intervals are extracted: the first is labeled as a lane-change from the side road to the main road, and the second is labeled as a lane-change from the main road to the side road.
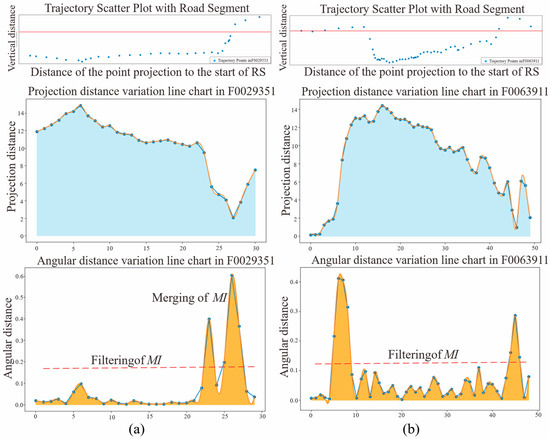
Figure 9.
Mutation interval identification. (a) Lane-change trajectory F0029351 with two mutation intervals; (b) lane-change trajectory F0063911 with two mutation intervals.
3.3. Potential Road Segment Recognition
SRDet uses a random forest classifier to validate feature importance. To filter the features strongly correlated with the target variable, the Spearman correlation coefficient between each feature and the label is first calculated. The features are then ranked based on the absolute value of the correlation coefficient, and a threshold (0.1) is set to filter out the important features. The features with significant correlation with the label are selected for subsequent modeling. After removing the irrelevant features, the important features that meet the threshold range are selected for regions A and B, and the importance ranking is shown in Table 6.
Table 6.
Feature importance in the experimental regions.
We report precision, recall, and F1-score as the primary evaluation metrics, as they better reflect model performance in imbalanced classification scenarios. To evaluate the effectiveness of the Spearman correlation-based feature selection, we conducted a comparative experiment using two sets of input features: one using all 13 original features (denoted as All-F) and the other using only the 7 features with absolute Spearman correlation coefficients ≥ 0.1 (denoted as Sel-F). For both Region A and Region B, we trained random forest classifiers with 5-fold cross-validation to ensure stability and generalizability. As shown in Table 7, the Sel-F model achieved comparable or slightly better performance across all evaluation metrics—precision, recall, and F1-score—when compared to the All-F model. These results confirm that the Spearman-based feature selection effectively eliminates redundant and noisy features without sacrificing model performance, resulting in a more efficient and interpretable model.
Table 7.
Comparison of classification performance using all features vs. selected features.
Small sample datasets are prone to overfitting, and to avoid the potential impact of such defects, cross-validation can be used to evaluate the model’s stability and generalization ability. In this study, 5-fold cross-validation is employed to train and evaluate the model. For each fold, 80% of the data is used for training, and 20% for testing. The test results from each fold are averaged to obtain the overall result. The judgment of side roads within road segments has a significant impact on the subsequent identification of access points. Four evaluation metrics, precision, recall, and F1-score—are used to assess the effectiveness of the feature-based classification model for determining the presence of side roads. The classification results for potential side road segments are shown in Table 8.
Table 8.
Road segment-level side road classification results.
In SRDet’s multimodal features, the FC feature reflects, to some extent, the traffic flow and capacity of the road, and is closely related to the presence of side roads. Generally, the higher the road grade, the greater the likelihood of side roads, but it cannot be excluded that some lower-grade roads may also have side road access points. The MS feature reflects the smoothness and efficiency of traffic flow on the road segment. A higher MS value typically indicates smooth traffic flow, while a lower MS value may suggest congestion or other traffic issues. The difference between KD and D characterizes the spatial distribution of mutation points.
As shown in Figure 10, we present the visualization of the K function for different road segments. Figure 10a shows a road segment without side roads, while Figure 10c,d show segments with main and side road access points. The two features exhibit distinct differences under these conditions, which helps to assess the heterogeneity and complexity of road traffic flow. The LS feature is positively correlated with traffic flow stability and speed; longer segments typically lead to more traffic bottlenecks or different types of traffic conditions. The CU feature has a significant impact on the stability and speed of vehicle movement. Higher curvature often leads to deceleration or clustering of mutation intervals, thereby reducing traffic flow smoothness. As shown in Figure 10b, a pseudo-clustering phenomenon of mutation points occurs in segments with higher curvature.
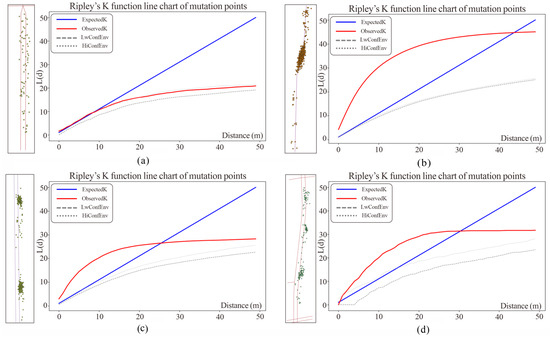
Figure 10.
Visualization of mutation points on different road segments using Ripley’s K function. (a) RS with discrete distribution of mutation points; (b) RS with clustered distribution of mutation points but no access points; (c) RS with clustered distribution of mutation points and access points; (d) RS with clustered distribution of mutation points and access points.
To further validate the overall advantages of SRDet over existing methods, we selected two representative machine learning-based approaches as baselines and conducted comparative experiments on the Beijing trajectory dataset. The first method of DBSCAN + KDE clusters trajectory points using DBSCAN and identifies centerlines by applying kernel density estimation (KDE) to determine whether points belong to side roads based on density thresholds. The second method of SVM utilizes the same multimodal features constructed by SRDet, but replaces the random forest classifier with a support vector machine. This baseline is intended to assess the effectiveness of the proposed feature engineering and to disentangle the contributions of the classifier from those of the feature design. Classification performance and inference efficiency were assessed using the following metrics: precision, recall, and F1-score. The results are presented in Table 9.
Table 9.
Comparison of SRDet and baseline methods on side road identification.
As shown in Table 9, SRDet(RF) achieves the highest precision, recall, and F1-score in both regions, outperforming both SVM and DBSCAN + KDE. The results demonstrate that the combination of the proposed feature engineering and random forest classifier significantly improves side road identification accuracy. Additionally, the improvement of SVM over DBSCAN + KDE further confirms the effectiveness of the designed features.
3.4. Access Point Identification and Side Road Generation
To validate the effectiveness of SRDet, experiments on the identification of entry and exit points for potential side road segments and the generation of side roads were conducted. First, kernel density estimation was used with a search radius of 10 m to calculate the density of mutation points and generate a raster layer [34]. Subsequently, density peak clustering was applied to extract cluster centers, thereby generating the location information for main and side road entry/exit points. Using the cluster centers as the origin, mutation points within a 10 m radius were selected. Based on the lane-change behavior labels assigned to each mutation interval in Section 2.2, the was calculated using Equation (4), with set to 0.9 and set to 0.1. As shown in Table 3, the entry/exit point category for each corresponding cluster center can be labeled according to this index. The different categories of entry/exit points determine the drawing direction and generation rules for the side road, including the following:
- Entry points that only allow lane changes from the main road to the side road; side roads are drawn in the direction along the road segment (following the flow of traffic on the main road).
- Entry points that only allow lane changes from the side road to the main road; side roads are drawn in the opposite direction (against the flow of traffic on the main road) along the road segment.
The main and side road classification, combined with the entry/exit point recognition results, extracts the entry/exit points for segments with main and side road access. The precision and recall rates for entry/exit point extraction in experimental area A are calculated to be 84.6% and 86.8%, respectively. For experimental area B, the precision is 85.3%, and the recall is 84.0%, achieving high-accuracy entry/exit point recognition results. The detailed results are provided in Table 10.
Table 10.
Results of access point identification.
Taking part of Xishiku Street in Xicheng District, Beijing, as an example, the process of entry/exit point generation and side road generation is shown in Figure 11. Specifically, the mutation intervals are first identified, with Figure 11a displaying the distribution of mutation points within the road segment. After clustering, the main and side road entry/exit points for the segment are extracted, and the entry/exit point category is determined using the lane-change behavior labels and Equation (4). Figure 11b–d show street view maps of actual entry/exit locations. Points 1 and 2 represent entry/exit points where bidirectional lane changes are allowed, while point 3 represents an entry/exit point that only allows entry to the side road. Figure 11f shows the fitted side road, and by combining the street view map and remote sensing imagery, it can be seen that the correctly fitted side road topology for the segment is accurately generated.
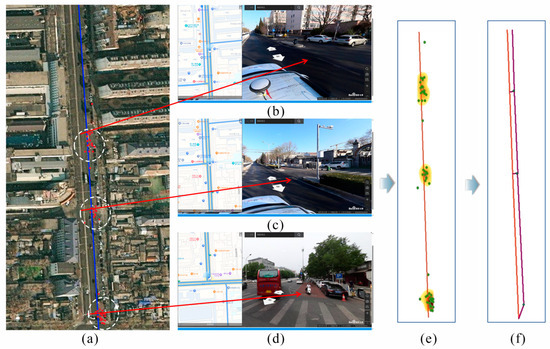
Figure 11.
Example of access point identification and side road generation. (a) Mutation points extracted from RS near Xishiku Street; (b) access point 1; (c) access point 2; (d) access point 3; (e) access points generated by DPC; (f) side road classification and generation.
Figure 12 shows the overall performance of SRDet. In both experimental Area A and Area B, regardless of whether the road segment structure is simple or complex, the integrated feature model combined with the random forest classifier demonstrated high accuracy in side road recognition, further validating the model’s transferability. Specifically, as shown in Figure 13, examples of potential side road segments from GPS data to side road generation are presented across four different scenarios. Figure 13a shows the GPS trajectory data, Figure 13b shows the distribution of potential side road segments, Figure 13c shows the distribution of mutation points, reflecting significant changes in traffic flow, and Figure 13d shows the generated side roads with specific topological structures based on road network information and mutation point detection results. Through these specific steps, meaningful features are extracted from the raw trajectory data, and with in-depth analysis using SRDet, changes in road traffic conditions are captured, potential side roads are identified and generated, further refining the transportation network.
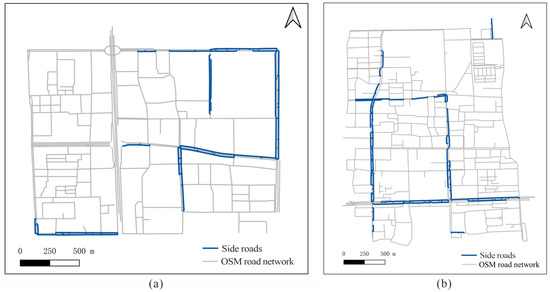
Figure 12.
Recognition results of side road detection. (a) Experiment Area A; (b) Experiment Area B.
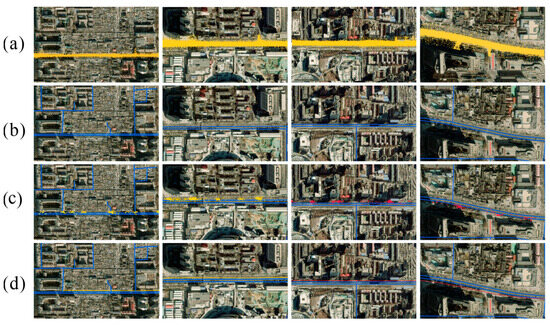
Figure 13.
Data processing and SRDet results. (a) Trajectory data; (b) road segments; (c) distribution of mutation points; (d) side road generation.
Due to the complexity of actual road conditions, both missed and false detection of entry/exit points are caused by various factors. Missed detection of entry/exit points is often due to low traffic volume on the road segment, leading to fewer mutation points and insufficient density to form significant clustering. Even if there are main and side road access points, they may not be properly detected. False detection of entry/exit points primarily arises from lane-change behaviors at non-main and side road entry/exit locations or other special traffic situations, such as changes in the number of lanes, road shape distortion, or the presence of non-temporary obstacles on the road. As shown in Figure 14, when the number of lanes on a road segment increases or decreases, lane-change behaviors may cause mutation points to distribute, which can be falsely interpreted as entry/exit points. Figure 14a,b show street view maps of segments where lane number changes occur. Similarly, when road shape becomes curved or long-term obstacles (e.g., protected ancient trees) are present on the road, pseudo-clustering of mutation points may also occur, leading to false detection, as illustrated in Figure 14c,d. These errors are typically caused by the irregularity of actual road conditions and traffic flow, resulting in clustering patterns of mutation points that do not align with the actual definition of entry/exit points.
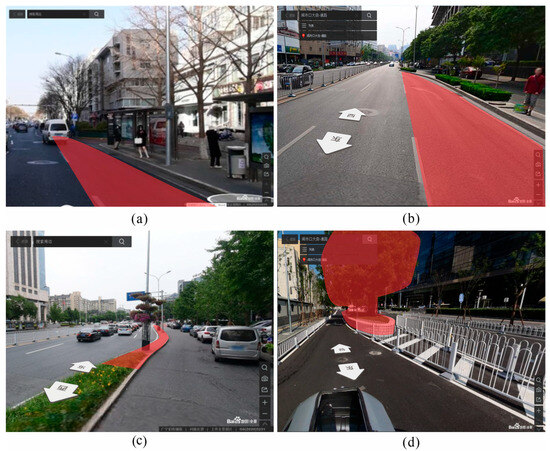
Figure 14.
Street view map corresponding to special cases of road segments. (a) Increase in the number of lanes; (b) increase in the number of lanes; (c) road curvature; (d) tree obstacles.
In the local density estimation of mutation points, we applied a Gaussian kernel function for KDE to generate clear density distribution layers. The results show that KDE effectively smooths the surrounding area of each mutation point, providing accurate density distribution information for subsequent density peak clustering, and validating the clustering performance of SRDet on trajectory datasets. Experimental results indicate that SRDet can effectively identify cluster centers when processing mutation point sets with non-uniform density distributions.
Finally, based on road design standards and actual traffic flow characteristics, and using the lane-change labels marked in mutation intervals along with road segment classification results, we successfully classified the side roads into three categories—“only main road to side road”, ”only side road to main road”, and “bidirectional lane change allowed”—and accurately fitted the location of the side roads. The experimental results validate the practical application of SRDet in side road extraction, providing more detailed data support for digital road information updates and traffic planning management.
4. Discussion
Although SRDet achieves high accuracy in fine-grained side road detection, some limitations should be noted. First, the inherent noise and drift in trajectory data can introduce irregular fluctuations that are not always fully addressed by stepwise optimization and fluctuation filtering mechanisms, leading to occasional missed or incorrect detections. Second, the absence of large-scale, publicly available datasets with detailed side road annotations limits the diversity and generalizability of our experimental evaluation, as our approach depends on manually labeled samples combining street view and remote sensing imagery. Third, SRDet’s effectiveness relies on the availability of high-frequency, high-precision trajectory data; in scenarios with lower data quality or sparse sampling, the method’s detection performance declines significantly. Additionally, variations in traffic regulations, road network structures, and urban development across cities may require careful parameter adjustment and model calibration for each application context. Finally, complex traffic and road conditions, such as dense interchanges and heavy congestion, can cause errors in the identification of access points, reducing the reliability of side road detection in real-world deployments. Addressing these limitations in future work, including improving robustness to data noise, expanding validation across diverse urban environments, and constructing richer annotated datasets, will be essential for further enhancing the applicability and generalizability of SRDet.
5. Conclusions and Future Work
With the acceleration of urban development, side road information has become increasingly important in road network construction and navigation. Due to the closely parallel nature of side roads, current methods of extracting road navigation information from trajectory data struggle to effectively identify side road features. This study proposes a novel side road information extraction method, SRDet, based on road information and trajectory semantic features. SRDet innovatively analyzes the unique trajectory lane-change patterns associated with the main-to-side road transition behaviors, adopting a multi-level optimization strategy to deeply mine trajectory feature information. By combining geometric features with spatial statistical theory, SRDet constructs a multimodal feature extraction framework. The use of a random forest classification model further enhances the ability to judge the main-to-side road connection relationships, accurately identifying the entry/exit points of side roads and thereby achieving effective detection of side roads at the road segment level. This provides more comprehensive data support for traffic planning and management.
Compared to existing methods for extracting digital road information, SRDet demonstrates good applicability in acquiring more detailed side road information. The experiments, based on trajectory data from Beijing, use remote sensing images, street view maps, and other annotated data for side road entry/exit points as ground truth to evaluate the main-to-side road discrimination results. The results show that SRDet performs with high accuracy and reliability in side road information extraction, verifying its potential and value in practical applications.
In conclusion, SRDet fills the research gap in the subfield of side road detection within navigation information extraction. Future improvements can focus on trajectory behavior recognition by deeply analyzing the interaction patterns between user driving behaviors and the main-to-side roads, enhancing the construction of multimodal features, and further exploring the spatiotemporal distribution information embedded in trajectory data.
Author Contributions
Conceptualization, Ying Luo and Fengwei Jiao; methodology, Ying Luo; formal analysis, Xin Chen and Meng Wang; writing—original draft preparation, Ying Luo; writing—review and editing, Fengwei Jiao and Longgang Xiang; visualization, Fengwei Jiao; supervision, Longgang Xiang and Xin Chen; funding acquisition, Longgang Xiang. All authors have read and agreed to the published version of the manuscript.
Funding
This research was funded by the National Natural Science Foundation of China, grant number 42471460.
Data Availability Statement
The data that support the findings of this study are not publicly available due to privacy and confidentiality restrictions. However, the data can be made available upon reasonable request from the corresponding author, subject to approval from relevant ethical review boards and agreements.
Conflicts of Interest
The authors declare no conflicts of interest.
References
- Blanke, U.; Guldener, R.; Feese, S.; Tröster, G. Crowdsourced pedestrian map construction for short-term city-scale events. In Proceedings of the First International Conference on IoT in Urban Space, Zurich, Switzerland, 27 October 2014; ICST (Institute for Computer Sciences, Social-Informatics and Telecommunications Engineering): Rome, Italy, 2014; pp. 25–31. [Google Scholar]
- Chao, P.; Hua, W.; Mao, R.; Xu, J.; Zhou, X. A Survey and Quantitative Study on Map Inference Algorithms From GPS Trajectories. IEEE Trans. Knowl. Data Eng. 2022, 34, 15–28. [Google Scholar] [CrossRef]
- Chen, X.; Yu, A.; Sun, Q.; Guo, W.; Xu, Q.; Wen, B. Updating Road Maps at City Scale With Remote Sensed Images and Existing Vector Maps. IEEE Trans. Geosci. Remote Sens. 2024, 62, 5616521. [Google Scholar] [CrossRef]
- Feng, Z.; Zhu, Y. A survey on trajectory data mining: Techniques and applications. IEEE Access 2016, 4, 2056–2067. [Google Scholar] [CrossRef]
- Yuan, H.; Wang, S.; Bao, Z.; Wang, S. Automatic Road Extraction with Multi-Source Data Revisited: Completeness, Smoothness and Discrimination. Proc. VLDB Endow. 2023, 16, 3004–3017. [Google Scholar] [CrossRef]
- Hervieu, A.; Soheilian, B. Road side detection and reconstruction using LIDAR sensor. In Proceedings of the 2013 IEEE Intelligent Vehicles Symposium (IV), Gold Coast, QLD, Australia, 23–26 June 2013; pp. 1247–1252. [Google Scholar]
- Yao, Y.; Gao, W.; Mao, S.; Zhang, S. Road Extraction from Point Cloud Data with Transfer Learning. IEEE Geosci. Remote Sens. Lett. 2024, 21, 6502005. [Google Scholar] [CrossRef]
- Wang, C.; Sun, W. Semantic guided large scale factor remote sensing image super-resolution with generative diffusion prior. ISPRS J. Photogramm. Remote Sens. 2025, 220, 125–138. [Google Scholar] [CrossRef]
- Johnson, B.A.; Iizuka, K. Integrating OpenStreetMap crowdsourced data and Landsat time-series imagery for rapid land use/land cover (LULC) mapping: Case study of the Laguna de Bay area of the Philippines. Appl. Geogr. 2016, 67, 140–149. [Google Scholar] [CrossRef]
- Wang, X.; Jin, X.; Dai, Z.; Wu, Y.; Chehri, A. Deep Learning-Based Methods for Road Extraction From Remote Sensing Images: A vision, survey, and future directions. IEEE Geosci. Remote Sens. Mag. 2025, 13, 55–78. [Google Scholar] [CrossRef]
- Cheng, G.; Zhu, F.; Xiang, S.; Pan, C. Road Centerline Extraction via Semisupervised Segmentation and Multidirection Nonmaximum Suppression. IEEE Geosci. Remote Sens. Lett. 2016, 13, 545–549. [Google Scholar] [CrossRef]
- Qin, Z.; Wang, H.; Li, X. Ultra Fast Structure-Aware Deep Lane Detection; Springer: Cham, Switzerland, 2020; pp. 276–291. [Google Scholar]
- Geng, T.; Cao, Y.; Wang, C. Multi-scale detail enhancement network for remote sensing road extraction. Earth Sci. Inform. 2025, 18, 262. [Google Scholar] [CrossRef]
- Li, H.; Kulik, L.; Ramamohanarao, K. Automatic Generation and Validation of Road Maps from GPS Trajectory Data Sets. In Proceedings of the 25th ACM International on Conference on Information and Knowledge Management, New York, NY, USA, 24 October 2016. [Google Scholar] [CrossRef]
- Yang, W.; Ai, T.; Lu, W. A Method for Extracting Road Boundary Information from Crowdsourcing Vehicle GPS Trajectories. Sensors 2018, 18, 1261. [Google Scholar] [CrossRef] [PubMed]
- Tang, L.; Yang, X.; Qi, C.; Liu, Z.; Li, Q. A Method for Rapid Extraction of Urban Lane Numbers Based on Floating Car Data. Geomat. Inf. Sci. Wuhan Univ. 2017, 42, 365–371. [Google Scholar] [CrossRef]
- Zhou, Y.; Wang, J.; Zhan, Y. An Urban Road Extraction Method Based on Trajectory Clustering. In Proceedings of the IGARSS 2022–2022 IEEE International Geoscience and Remote Sensing Symposium, Kuala Lumpur, Malaysia, 17–22 July 2022; pp. 1268–1271. [Google Scholar]
- Han, J.; Lee, J.G.; Whang, K.Y. Trajectory clustering: A partition-and-group framework. In Proceedings of the 2007 ACM SIGMOD International Conference on Management of Data, Bejing, China, 12–14 June 2007; pp. 593–604. [Google Scholar]
- Panagiotakis, C.; Pelekis, N.; Kopanakis, I.; Ramasso, E.; Theodoridis, Y. Segmentation and Sampling of Moving Object Trajectories based on Representativeness. IEEE Trans. Knowl. Data Eng. 2011, 24, 1328–1343. [Google Scholar] [CrossRef]
- Wagstaff, K.; Cardie, C.; Rogers, S.; Schrödl, S. Constrained K-means Clustering with Background Knowledge. In Proceedings of the Eighteenth International Conference on Machine Learning, Williamstown, MA, USA, 28 June–1 July 2001; pp. 577–584. [Google Scholar]
- Uduwaragoda, E.R.I.A.C.M.; Perera, A.S.; Dias, S.A.D. Generating lane level road data from vehicle trajectories using Kernel Density Estimation. In Proceedings of the 16th International IEEE Conference on Intelligent Transportation Systems (ITSC 2013), The Hague, The Netherlands, 6–9 October 2013; pp. 384–391. [Google Scholar]
- Alsahfi, T.; Almotairi, M.; Elmasri, R.; Alshemaimri, B. Road Map Generation and Feature Extraction from GPS Trajectories Data. In Proceedings of the 12th ACM SIGSPATIAL International Workshop on Computational Transportation Science, Chicago, IL, USA, 5 November 2019; p. 2. [Google Scholar]
- Wu, H.; Zhang, H.; Zhang, X.; Sun, W.; Zheng, B.; Jiang, Y. DeepDualMapper: A Gated Fusion Network for Automatic Map Extraction using Aerial Images and Trajectories. Proc. AAAI Conf. Artif. Intell. 2020, 34, 1037–1045. [Google Scholar] [CrossRef]
- Li, X.; Wang, M.; Liu, X.; Wang, Z.; Bian, Y. Representing dynamic lanes in road network models. Int. J. Geogr. Inf. Sci. 2022, 36, 1467–1483. [Google Scholar] [CrossRef]
- Yuan, M.; Yue, P.; Yang, C.; Li, J.; Yan, K.; Cai, C.; Wan, C. Generating lane-level road networks from high-precision trajectory data with lane-changing behavior analysis. Int. J. Geogr. Inf. Sci. 2024, 38, 243–273. [Google Scholar] [CrossRef]
- Xingzhe, X.; Philips, W.; Veelaert, P.; Aghajan, H. Road network inference from GPS traces using DTW algorithm. In Proceedings of the 17th International IEEE Conference on Intelligent Transportation Systems (ITSC), Qingdao, China, 8–11 October 2014; pp. 906–911. [Google Scholar]
- Zhang, Y.; Liu, J.; Xu, P.; Tang, G.; Tong, K. Hierarchical Extraction Method for Road Intersections Based on Multi-source Trajectory Data. J. Geomat. 2023, 48, 123–129. [Google Scholar] [CrossRef]
- Deng, M.; Huang, J.; Zhang, Y.; Liu, H.; Tang, L.; Tang, J.; Yang, X. Generating urban road intersection models from low-frequency GPS trajectory data. Int. J. Geogr. Inf. Sci. 2018, 32, 2337–2361. [Google Scholar] [CrossRef]
- Yang, X.; Tang, L.; Niu, L.; Zhang, X.; Li, Q. Generating lane-based intersection maps from crowdsourcing big trace data. Transp. Res. Part. C Emerg. Technol. 2018, 89, 168–187. [Google Scholar] [CrossRef]
- Karagiorgou, S.; Pfoser, D. On vehicle tracking data-based road network generation. In Proceedings of the 20th International Conference on Advances in Geographic Information Systems, Redondo Beach, CA, USA, 6 November 2012; pp. 89–98. [Google Scholar]
- Karagiorgou, S.; Pfoser, D.; Skoutas, D. A Layered Approach for More Robust Generation of Road Network Maps from Vehicle Tracking Data. ACM Trans. Spat. Algorithms Syst. 2017, 3, 1–21. [Google Scholar] [CrossRef]
- Li, Y.; Su, H.; Demiryurek, U.; Zheng, B.; He, T.; Shahabi, C. PaRE: A System for Personalized Route Guidance. In Proceedings of the 26th International Conference on World Wide Web, Perth, OC, Australia, 3 April 2017; pp. 637–646. [Google Scholar]
- Chen, C.; Ye, Z.; Hu, F.; Gong, S.; Sun, L.; Yu, Q. Vehicle trajectory-clustering method based on road-network-sensitive features. J. Intell. Fuzzy Syst. 2021, 41, 2357–2375. [Google Scholar] [CrossRef]
- Bíl, M.; Andrášik, R.; Janoška, Z. Identification of hazardous road locations of traffic accidents by means of kernel density estimation and cluster significance evaluation. Accid. Anal. Prev. 2013, 55C, 265–273. [Google Scholar] [CrossRef]
- Agamennoni, G.; Nieto, J.I.; Nebot, E.M. Robust Inference of Principal Road Paths for Intelligent Transportation Systems. IEEE Trans. Intell. Transp. Syst. 2011, 12, 298–308. [Google Scholar] [CrossRef]
- Biagioni, J.; Eriksson, J. Inferring Road Maps from Global Positioning System Traces:Survey and Comparative Evaluation. Transp. Res. Rec. 2012, 2291, 61–71. [Google Scholar] [CrossRef]
- Elleuch, W.; Wali, A.; Alimi, A.M. An Investigation of Parallel Road Map Inference from Big GPS Traces Data. Proc. Comput. Sci. 2015, 53, 131–140. [Google Scholar] [CrossRef][Green Version]
- Qiu, J.; Wang, R.; Wang, X. Inferring Road Maps from Sparsely-Sampled GPS Traces. In Proceedings of the Advances in Artificial Intelligence, Cham, Switzerland, 6–9 May 2014; pp. 339–344. [Google Scholar]
- Guan, D.; Ren, N.; Wang, K.; Wang, Q.; Zhang, H. Checkpoint data-driven GCN-GRU vehicle trajectory and traffic flow prediction. Sci. Rep. 2024, 14, 30409. [Google Scholar] [CrossRef]
- Ding, J.; Zhang, B.; Wang, X.; Zhou, C. TSNE: Trajectory similarity network embedding. In Proceedings of the 30th International Conference on Advances in Geographic Information Systems, Seattle, WA, USA, 1–4 November 2022. [Google Scholar] [CrossRef]
- Jagadeesh, G.R.; Srikanthan, T. Online Map-Matching of Noisy and Sparse Location Data With Hidden Markov and Route Choice Models. IEEE Trans. Intell. Transp. Syst. 2017, 18, 2423–2434. [Google Scholar] [CrossRef]
- Ma, J.; Sun, Q.; Wen, B.; Zhou, Z.; Lu, C.; Lü, Z.; Sun, S. A Hybrid Multi-feature Road Network Selection Method Based on Trajectory Data. Geomat. Inf. Sci. Wuhan Univ. 2022, 47, 1009–1016. [Google Scholar] [CrossRef]
- Lee, J.G.; Han, J.; Li, X.; Gonzalez, H. TraClass: Trajectory classification using hierarchical region-based and trajectory-based clustering. Proc. Vldb Endow. 2008, 1, 1081–1094. [Google Scholar] [CrossRef]
- Hohl, A.; Chen, P. Spatiotemporal simulation: Local Ripley’s K function parameterizes adaptive kernel density estimation. In Proceedings of the 2nd ACM SIGSPATIAL International Workshop on GeoSpatial Simulation, Chicago, IL, USA, 5 November 2019; pp. 16–23. [Google Scholar]
- Zhang, C.; Xiang, L.; Li, Y.; Lin, Z. Road Level Classification Considering Road Network and Multi-feature Trajectory Data. J. Geo-Inf. Sci. 2022, 24, 1925–1940. [Google Scholar]
- Li, J.; Pei, X.; Wang, X.; Yao, D.; Zhang, Y.; Yue, Y. Transportation mode identification with GPS trajectory data and GIS information. Tsinghua Sci. Technol. 2021, 26, 403–416. [Google Scholar] [CrossRef]
- Tanghuai, F.; Xin, L.; Jiazhen, H.; Baohong, L.; Ping, K. Density Peaks Clustering Algorithm Based on Kernel Density Estimation and Minimum Spanning Tree. Int. J. Intell. Comput. Appl. 2023, 24, 336–350. [Google Scholar] [CrossRef]
- Wang, H.; Wang, J.; Yu, P.; Chen, X.; Wang, Z. Extraction and construction algorithm of traffic road network model based on OSM file. J. Phys. Conf. Ser. 2021, 1848, 012084. [Google Scholar] [CrossRef]


Disclaimer/Publisher’s Note: The statements, opinions and data contained in all publications are solely those of the individual author(s) and contributor(s) and not of MDPI and/or the editor(s). MDPI and/or the editor(s) disclaim responsibility for any injury to people or property resulting from any ideas, methods, instructions or products referred to in the content. |
© 2025 by the authors. Published by MDPI on behalf of the International Society for Photogrammetry and Remote Sensing. Licensee MDPI, Basel, Switzerland. This article is an open access article distributed under the terms and conditions of the Creative Commons Attribution (CC BY) license (https://creativecommons.org/licenses/by/4.0/).