3.1. PSI Processing
In PSI processing, the Coherent Target Monitoring (CTM) algorithm [
9,
36,
37] that makes use of long-term stable pixels (PSs), called coherent targets, was used. The coherent targets are selected on the basis of the temporal coherence (TC) of a pixel. The temporal coherence is a measure describing how stable the phase of a scatterer is over time. CTM algorithm uses information from distributed targets as well as point like target.
The phase of a differential interferogram where the topographic phase and the flat earth phase terms have been removed is
where the phase components are deformation, atmospheric delay, residual topographic phase (DEM error) and noise. A stable reference area is chosen for the initial atmospheric phase estimate. Initially, the atmosphere is expected to be constant over the processing region. By subtracting the average phase of the reference area we get the atmosphere corrected interferogram
Phase corresponding to a DEM error value and slope of a linear deformation model are used to calculate the residual phase
The DEM error and slope are determined using the temporal coherence of a pixel
where i(1, …, n) is the interferogram and n is the total number of interferograms. The DEM error and slope pair that gives the highest temporal coherence is searched (template search, user-defined range). As a result, estimates for DEM error, deformation rate and TC are obtained.
In subsequent iterations, the atmospheric estimate is refined by subtracting the estimates of ϕdefo and ϕdem_error from the differential phase and smoothing it over the area to get a new estimate for the ϕatmo. For this, only pixels having a TC above a user-defined threshold are used. The new estimate of ϕatmo is then subtracted from the original differential phase to obtain a new atmosphere corrected interferogram, which is used in the search for new slope and DEM error values, and subsequently, new temporal coherence estimates are obtained.
In our study, the time series of the ERS and ENVISAT images were formed separately; hence cross-interferograms were not formed. The ERS and ENVISAT master images were co-registered. Thus, all of the ERS and ENVISAT images had a common reference grid, and thus, several common PSs can be found both in ERS and ENVISAT time series. A common region-of-interest (ROI) of 6 km × 15 km was chosen for interferometric processing. A simulated interferogram was obtained from the DEM and co-registered to the master image, in order to get the topographic phase of the interferograms.
First, the ERS time series of 33 interferograms was formed. The ERS master image (27.8.95) was selected to have a reasonable dispersion of geometrical and temporal baselines. The image processing steps are image co-registration to common master image, selection of region of interest, and the computation of differential interferograms using the topographic phase from the DEM and Delft (DEOS) precise orbits.
Secondly, the ENVISAT time series of seven interferograms was formed similarly. The ENVISAT master was selected to represent the same time of year as the ERS master, in order avoid effects due to seasonal variation in ERS master and ENVISAT master image co-registration.
A ROI (4.7 km × 4.4 km) for the PSI processing was selected from the differential interferogram stack. A known non-subsiding area in the center of the city was selected as the reference for zero deformation and for the estimation of the initial atmospheric offset. Deformation rates are estimated relative to this reference area. The area is presented in
Figure 3.
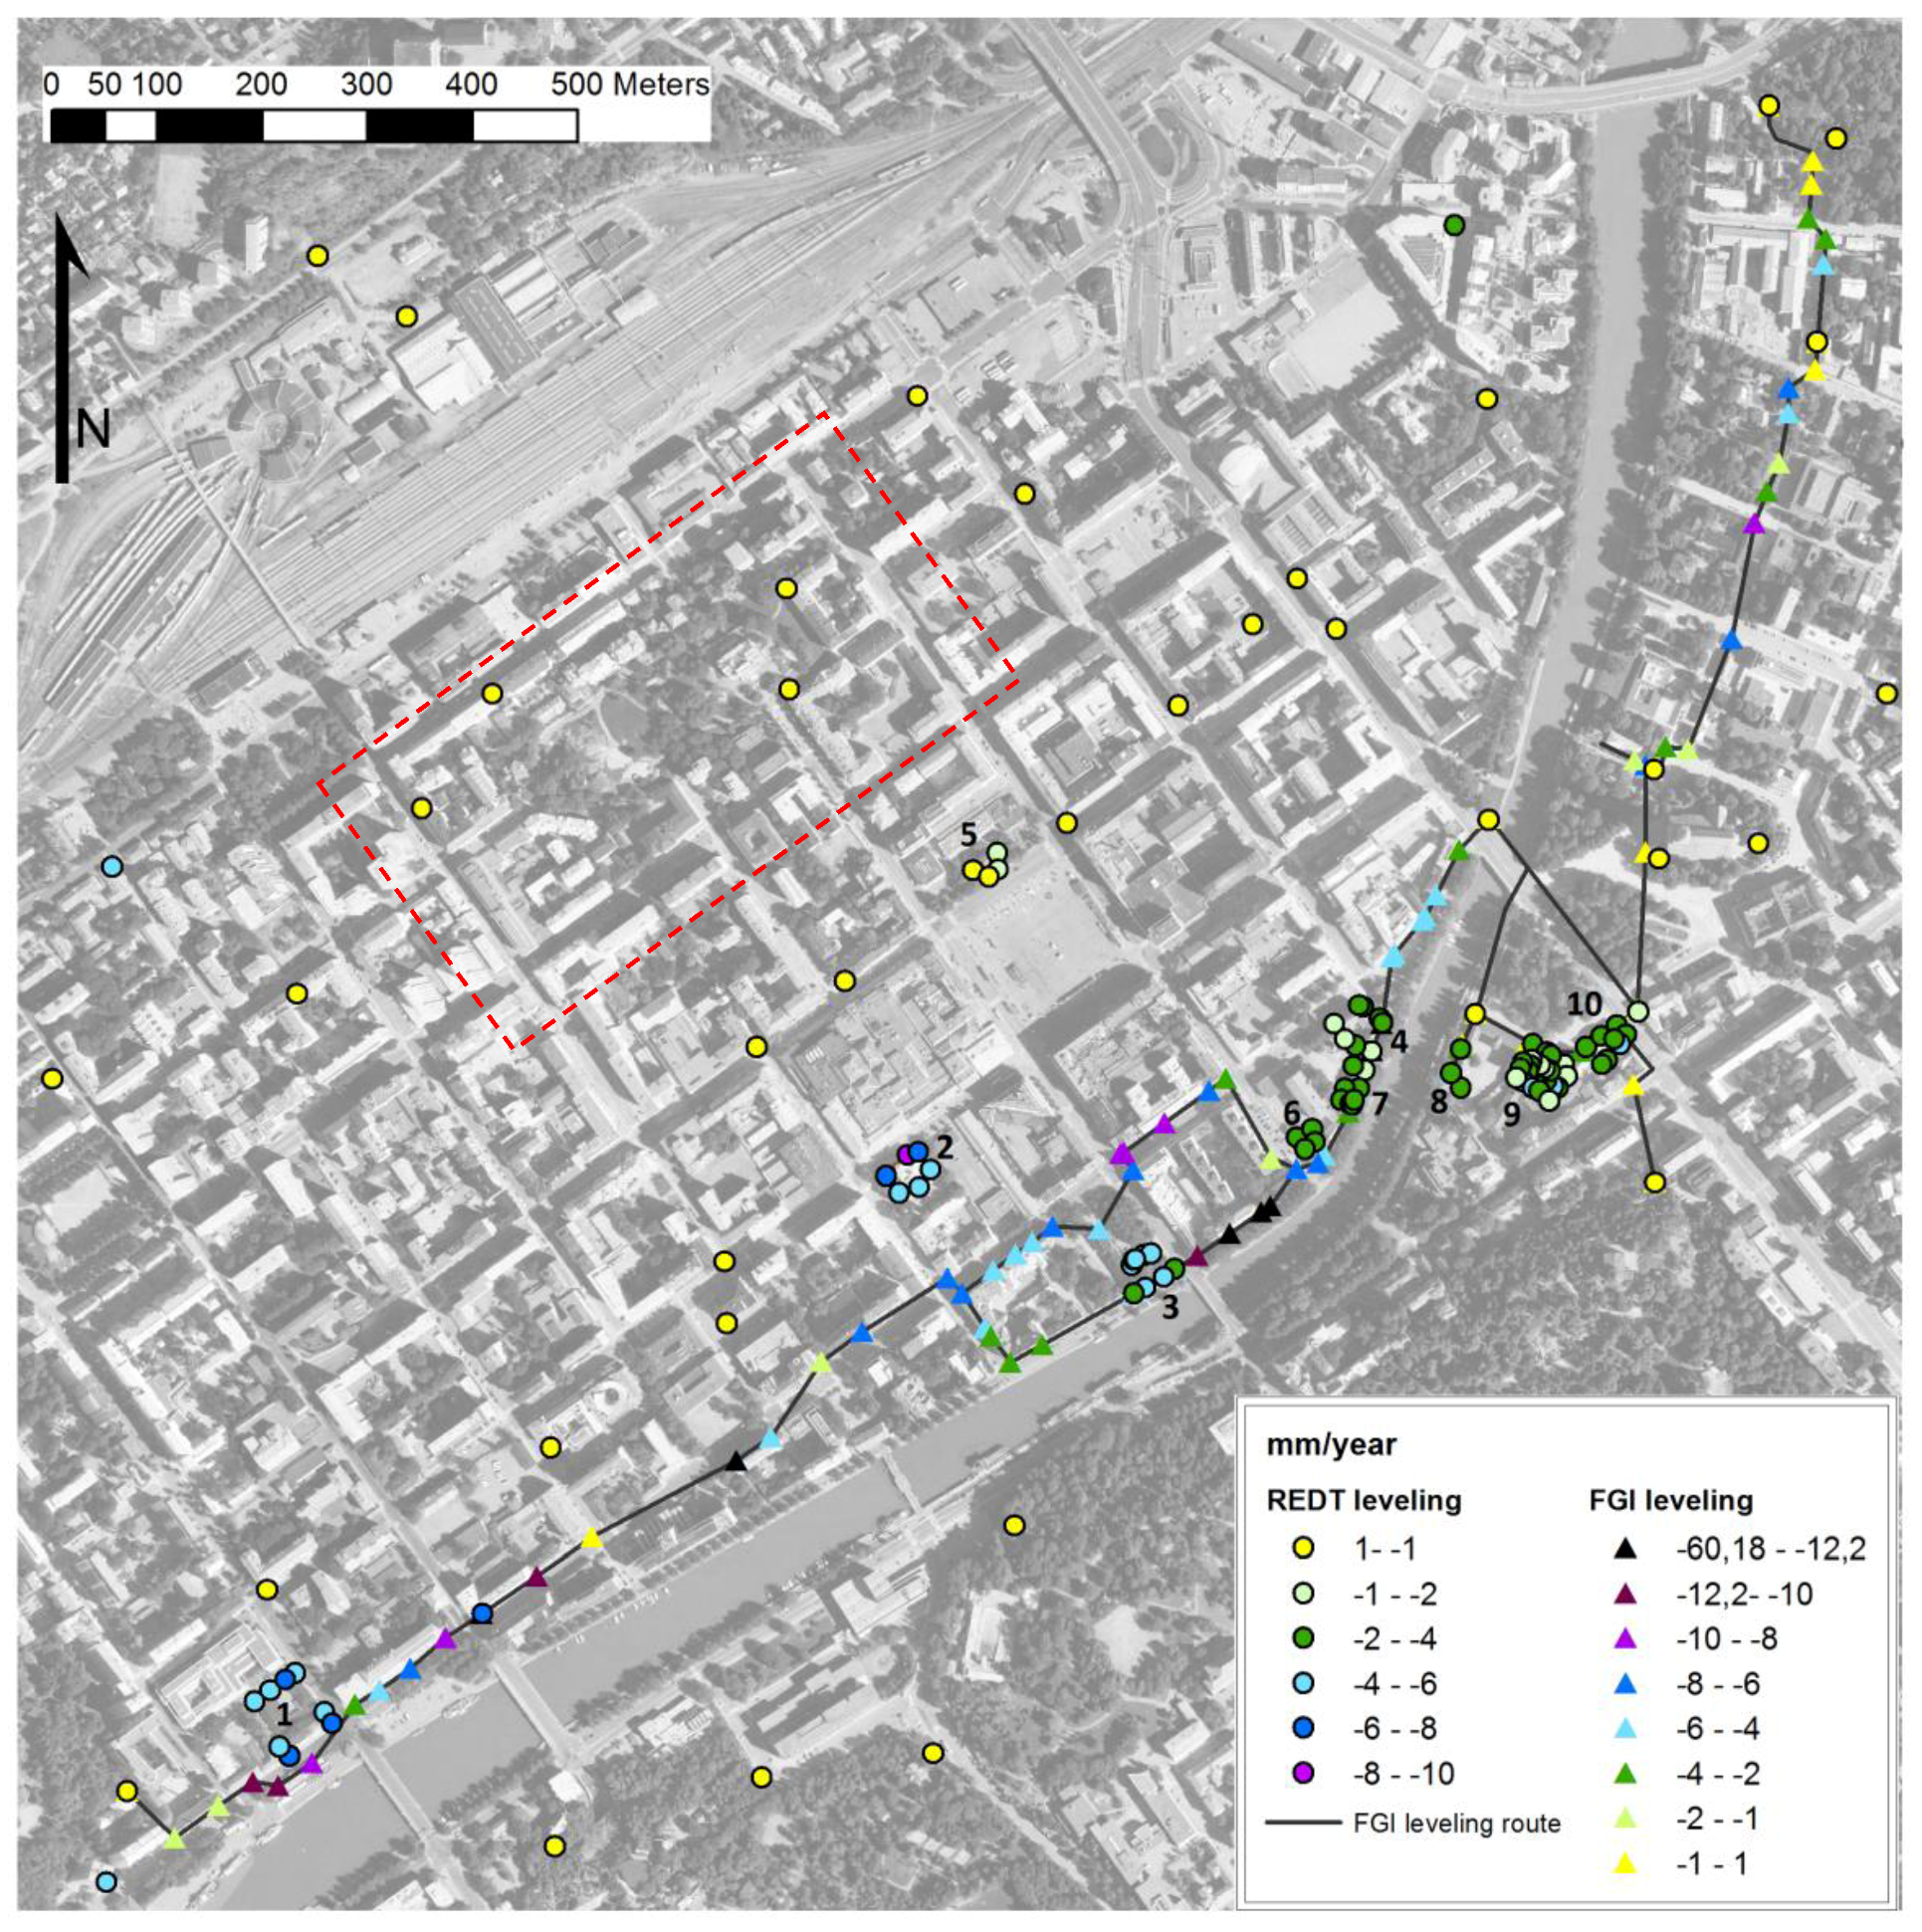
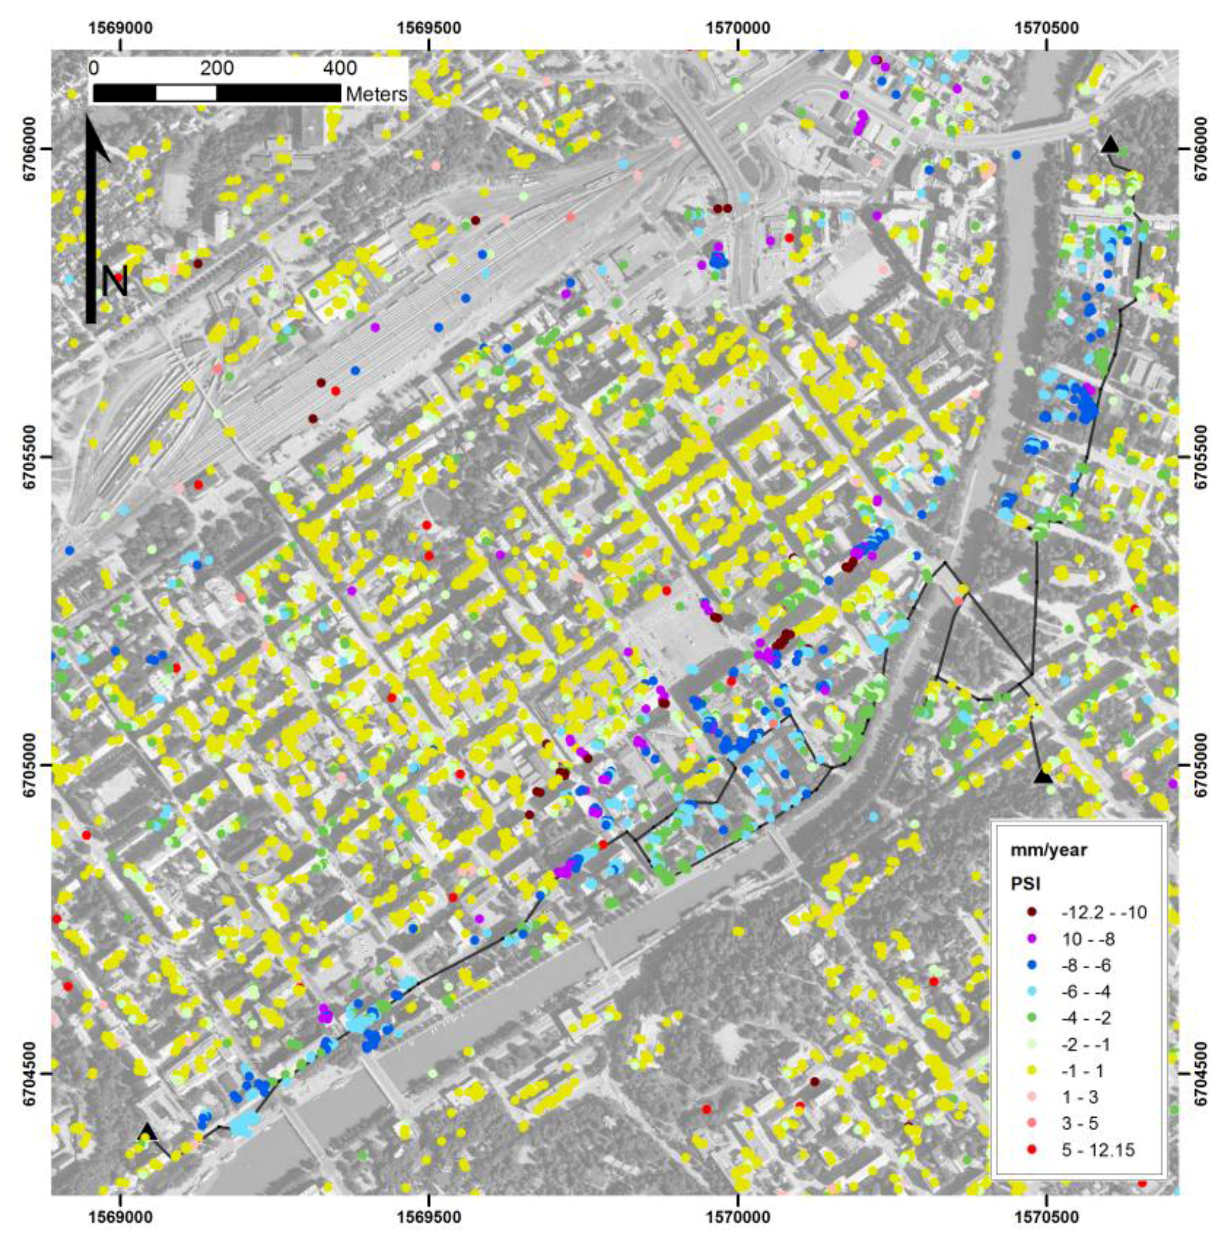
Figure 3.
Real Estate Department of Turku (REDT) and Finnish Geodetic Institute(FGI) leveling benchmarks and their vertical deformation rates in the area. Yellow is stable point. Red square marks the approximate position of the initial atmosphere estimate. Numbers mark the buildings measured by REDT. Aerial image © Turun kaupungin Kiinteistöliikelaitos.
Then, the iterative process was executed to separate the phase terms due to deformation, atmosphere change and DEM error. In the template search, maximum deformation slope was set ±0.5 cycle/yr, and 0.025 cycles/yr (~0.7 mm/yr) increments were used, for DEM error maximum of ±20 m and increments of 1 m were used. The temporal coherence estimate is refined during each iteration round and new PSs are found. The TC threshold for atmospheric refinement was 0.65, and for the output products (deformation maps) the TC thresholds of 0.6, 0.65 and 0.7 were used. In the atmospheric refinement, the atmospheric screen smoothing length was 2,000 m. A linear model was used for the deformation. The slope of the deformation model is estimated using both the ERS and ENVISAT time series and both time series are fitted to the model. Therefore, the final deformation estimation is done using information from the both time series. Finally, the line-of-sight deformation is converted to vertical deformation. Two iteration rounds were performed. Adding more iteration rounds did not make a significant difference to the annual subsidence rates. The second iteration results were used in the following analyses.
In addition to determining the deformation rate, the PSI processing also provides an estimate of the digital elevation model (DEM) error and temporal coherence of the PS. The DEM error is the difference between the reference DEM height and the height of the scatterer, e.g., the scatterer may be on top of a building.
3.2. Establishing a Validation Network for Subsidence Monitoring Based on Precise Leveling
Two different sets of leveling data were used as a reference in this study, one set from Turku City’s Real Estate Department (REDT) and one set was measured by FGI.
The subsidence of buildings in Turku has been monitored for decades on the basis of leveling measurements carried out by the city authorities and private companies. This includes a leveling dataset held by the City’s Real Estate Department (REDT) covering a number of City-owned buildings in the downtown area. The REDT leveling data contains several observations for each building, e.g., in all corners of the buildings and in the middle. The data were acquired between 1990 and 2003, though the coverage varies from one building to another, and contains data on several bolts for each building. The monitored buildings were those where damage had been observed. Ten buildings (including 76 benchmarks) were monitored in the city center area. In addition, tens of height control points are monitored in the area. The measurements were done separately for each building. The accuracy of these measurements is not known. The results have been documented with 1 mm precision. Taking into account the accuracy of standard leveling devices, the accuracy should within a few millimeters. Based on the REDT leveling data, linear subsidence rates can be assumed in the test area. Differential settlement is likely in building “Koulu” (2.9 mm/yr) and “Cathedral school” (1.8 mm/yr). For the other buildings, it is about 1 mm/yr or less, which can be caused by the measurement error. The REDT leveling benchmarks and rates are shown in
Figure 3.
In order to validate the PSI results more comprehensively, FGI established a PSI test site in the center of Turku in 2005. Precise leveling was chosen as the measurement method, since it is still the most accurate method available.
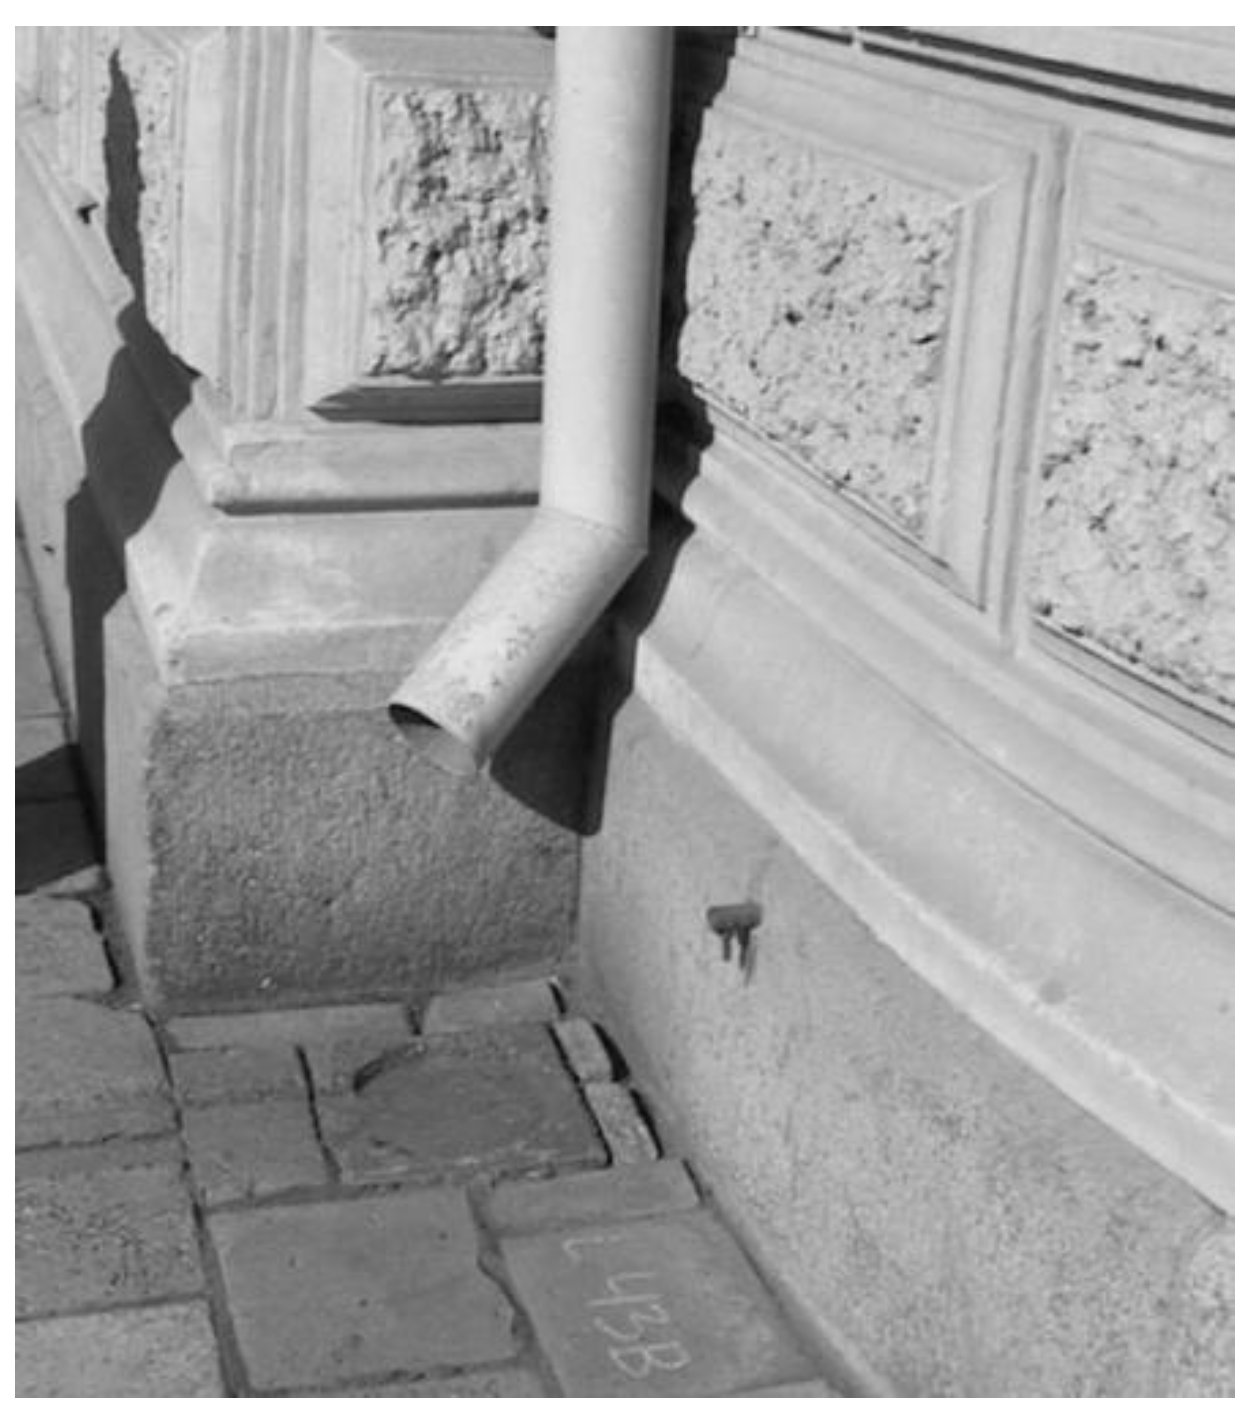
Figure 4.
An example of a levelling benchmark (photo: Veikko Saaranen).
Figure 4.
An example of a levelling benchmark (photo: Veikko Saaranen).
A large number of buildings already had metal bolts (
Figure 4) mounted on their stone foundations as a result of the known subsidence problems in the area. All bolts were already installed on buildings by the city authorities or private companies, which have been monitoring the buildings. Fourteen of these bolts were also used in the REDT measurements. The measurements were tied to three bolts in the bedrock (
Table 3), and these were considered to remain stable. The digital leveling system Zeiss DiNi12 with LD12 and LD13 bar code invar rods were used in the measurements.
Table 3.
Bedrock benchmark list.
Table 3.
Bedrock benchmark list.
| X (ETRS-GK23) | Y (ETRS-GK23) | Z (N2000) |
|---|
| 4545 | 6,705,385.2 | 23,460,366.6 | 13.793 |
| 3030 | 67,04,371.8 | 23,460,232.6 | 15.207 |
| 3639 | 6,703,842.6 | 23,458,753.6 | 10.414 |
The FGI precise leveling route is about 4.9 km long and covers the main subsidence area along the river. It is comprised of 82 bolts on the outside of buildings and the three bedrock benchmarks. The bolts are made of metal and mounted on the stone foundations of the buildings. Redundancy was considered in the leveling network design, and a number of loops were measured. The resulting leveling network is basically a leveling line through the city with two loops in the middle. This allowed more reliable results to be obtained and certain buildings of special interest to be included. Extending the test site to encompass other major subsidence locations, such as the area around the railway station, would be relatively straightforward, as these other locations also include bolts mounted in bedrock and on building foundations. However, it was not done due to the time required to complete the measurements.
The FGI has three sets of precise leveling measurements, the first from May 2005, the second from October 2005, and the third from June 2006. The network adjustment was carried out using program “Local X-positioning system” [
38]. The adjustment method was a constrained net with the three bedrock benchmarks fixed. The weight of each observation was inversely proportional to the distance of the benchmark interval. A posteriori standard deviations for the campaigns were 0.65 mm/(km
1/2), 1.05 mm/(km
1/2), 0.94 mm/(km
1/2). The results are stored as a set of point data containing the three observations for each point and the annual subsidence rate derived from these measurements. Average subsidence was 4.7 mm/yr and standard deviation was 3.6 mm/yr. Maximum measured displacement was 60 mm/yr (in a building being renovated at the time) and minimum was zero. FGI’s leveling test site is presented in
Figure 3 and described in more detail in [
39].
3.3. Comparison
When a deformation phenomenon is spatially continuous, the deformation can be modeled, and, point-wise PS observations have to be interpolated to obtain a continuous deformation field. Geostatistical methods, such as kriging in [
40], are often used for interpolation. However, when the deformation is spatially non-continuous (adjacent buildings can be stable or subsiding depending on the condition of the foundations), as in the Turku case, the situation is less straightforward, requiring the corresponding PSI observations and ground survey benchmarks to be determined. Since the density of PS is usually higher than the density of benchmarks, the alternatives are either to use the closest PS or every PS within a certain distance from the benchmark. The geocoding of each PS is rough,
i.e., the closest PS in not necessarily the closest in reality, and also there are several PSs in one building. In the following analyses, the closest PS that was inside the building borders was used. (
Figure 5) Maximum distance of 20 m was applied.
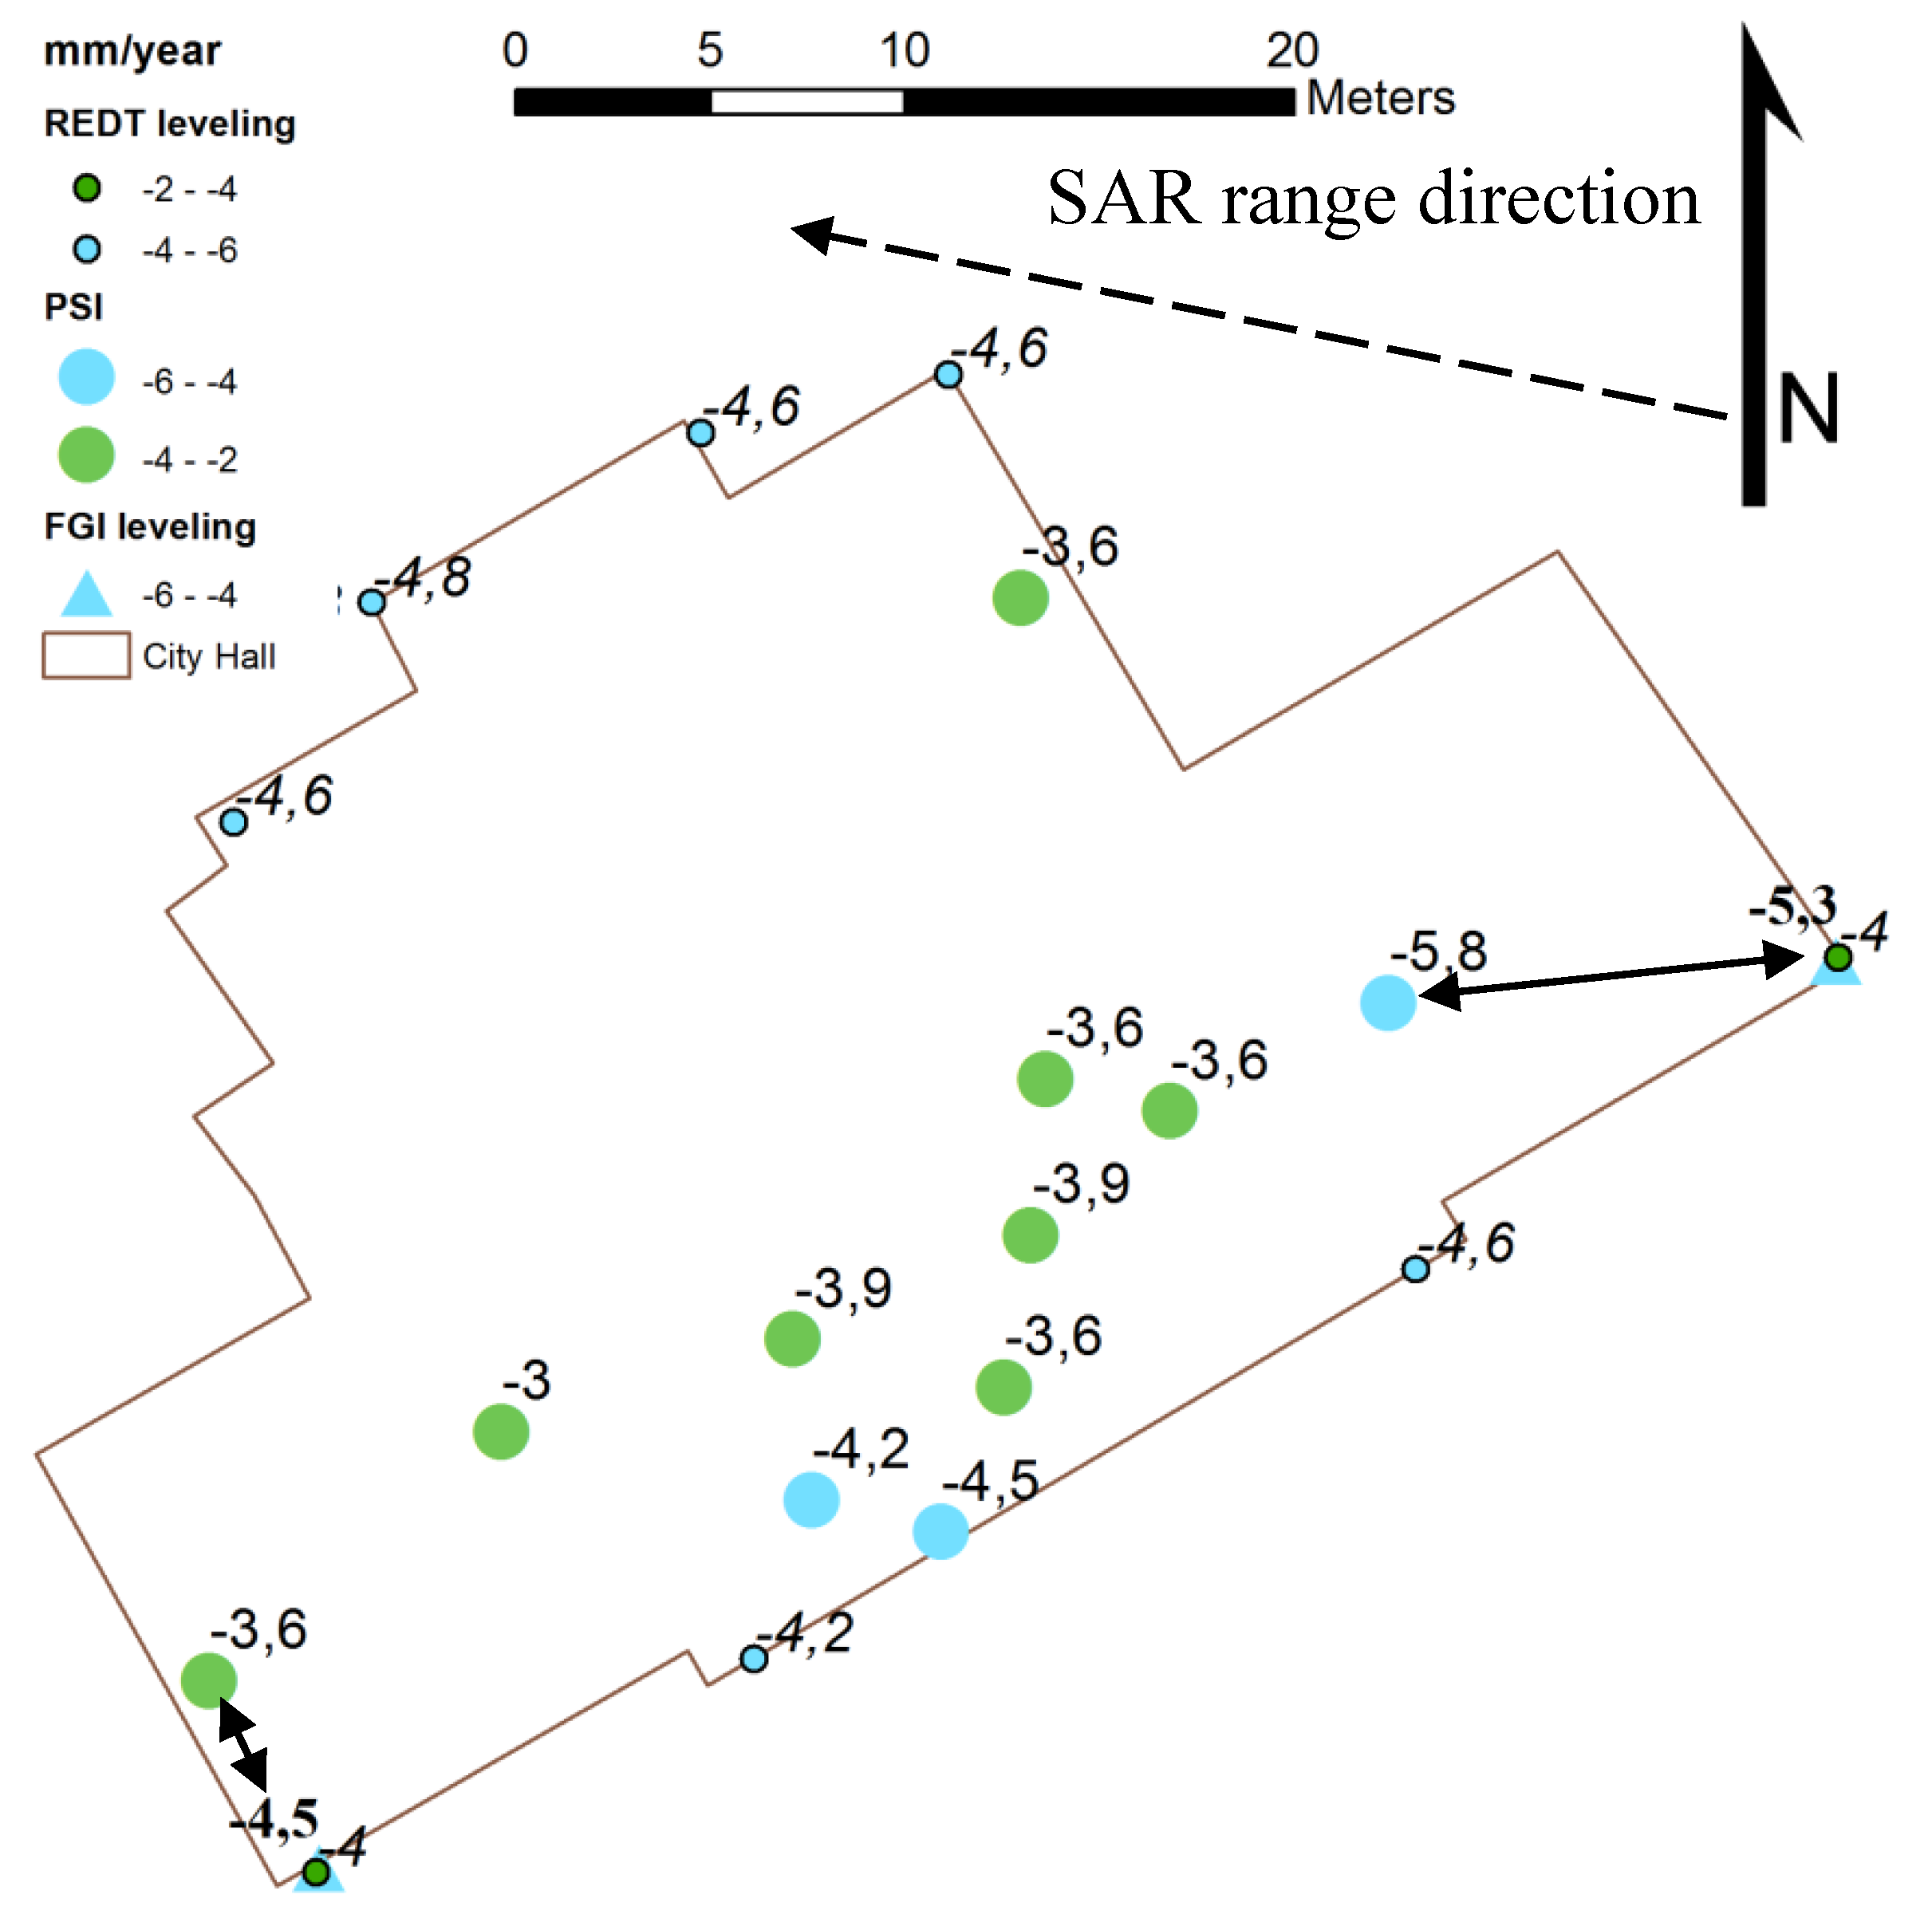
Figure 5.
11 PS, eight REDT and two FGI leveling benchmarks and their vertical deformation rates in Town Hall. Selection of the closest PS for two FGI benchmarks is shown with arrows. For mean annual PSI rate all 11 PS were used.
Figure 5.
11 PS, eight REDT and two FGI leveling benchmarks and their vertical deformation rates in Town Hall. Selection of the closest PS for two FGI benchmarks is shown with arrows. For mean annual PSI rate all 11 PS were used.
The geocoding of PSI results is not easy because of the different reference systems of the SAR data and the city maps. In addition, the scatterer is not necessarily situated in the center of the resolution element but is instead only known to be within the area of a resolution element. As a result of a PSI analysis, the height of the scatterer or the error of its height with respect to the DEM, used can be further used during the geocoding. However, an incorrect height estimate will lead to false geocoding. Fortunately, the PS observations are usually clustered, and this helps to relate the geocoded PS observations to ground objects, such as buildings. The geocoding accuracy of the PS with respect to the map data was visually estimated by comparing PSs to the building map. The maximum geocoding error was estimated to be circa 5 m in azimuth (~North-South direction) and circa 20 m in ground range direction (~East-West). This is similar to the ERS SLC image nominal resolution, which is 10 m in slant range and 5 m in azimuth direction.
In the Turku case study, the building data of Turku city digital base map were used to study the spatial distribution of the persistent scatterers. By using this data, it was possible to determine corresponding coherent targets and buildings. A set of aerial images was used for visual inspection purposes.
The REDT leveling data subsidence rates for a certain building part were very similar, thus, the leveling observations could be converted to mean annual subsidence velocity of the building or a part of a large building. It is also more convenient to relate the geocoded PSs to larger objects, e.g., a part of a building. The building data of the digital city base map was used in identifying the corresponding radar scatterers of certain buildings. The REDT observations were digitized on the base map. An overlay analysis of the leveling and SAR datasets was carried out. In order to compare the REDT leveling results and the PSI results, the mean annual deformation rates were calculated for different buildings or building parts. For the mean annual rates, all of the PS within building borders (or less than 2 m from border) were used.


