5.1. Urban- or Network-Oriented Communities?
Our research question was to investigate whether the spatial structure of the communities reflected more the urban or the railway network structure. A strong influence of the first component should induce a concentric structure centered on metropolitan areas, while the second will lead to a rather radial structure alongside main railway lines. Our results show that both concentric and radial patterns appear in the results (see
Section 4), although with varying importance across the data subsets considered.
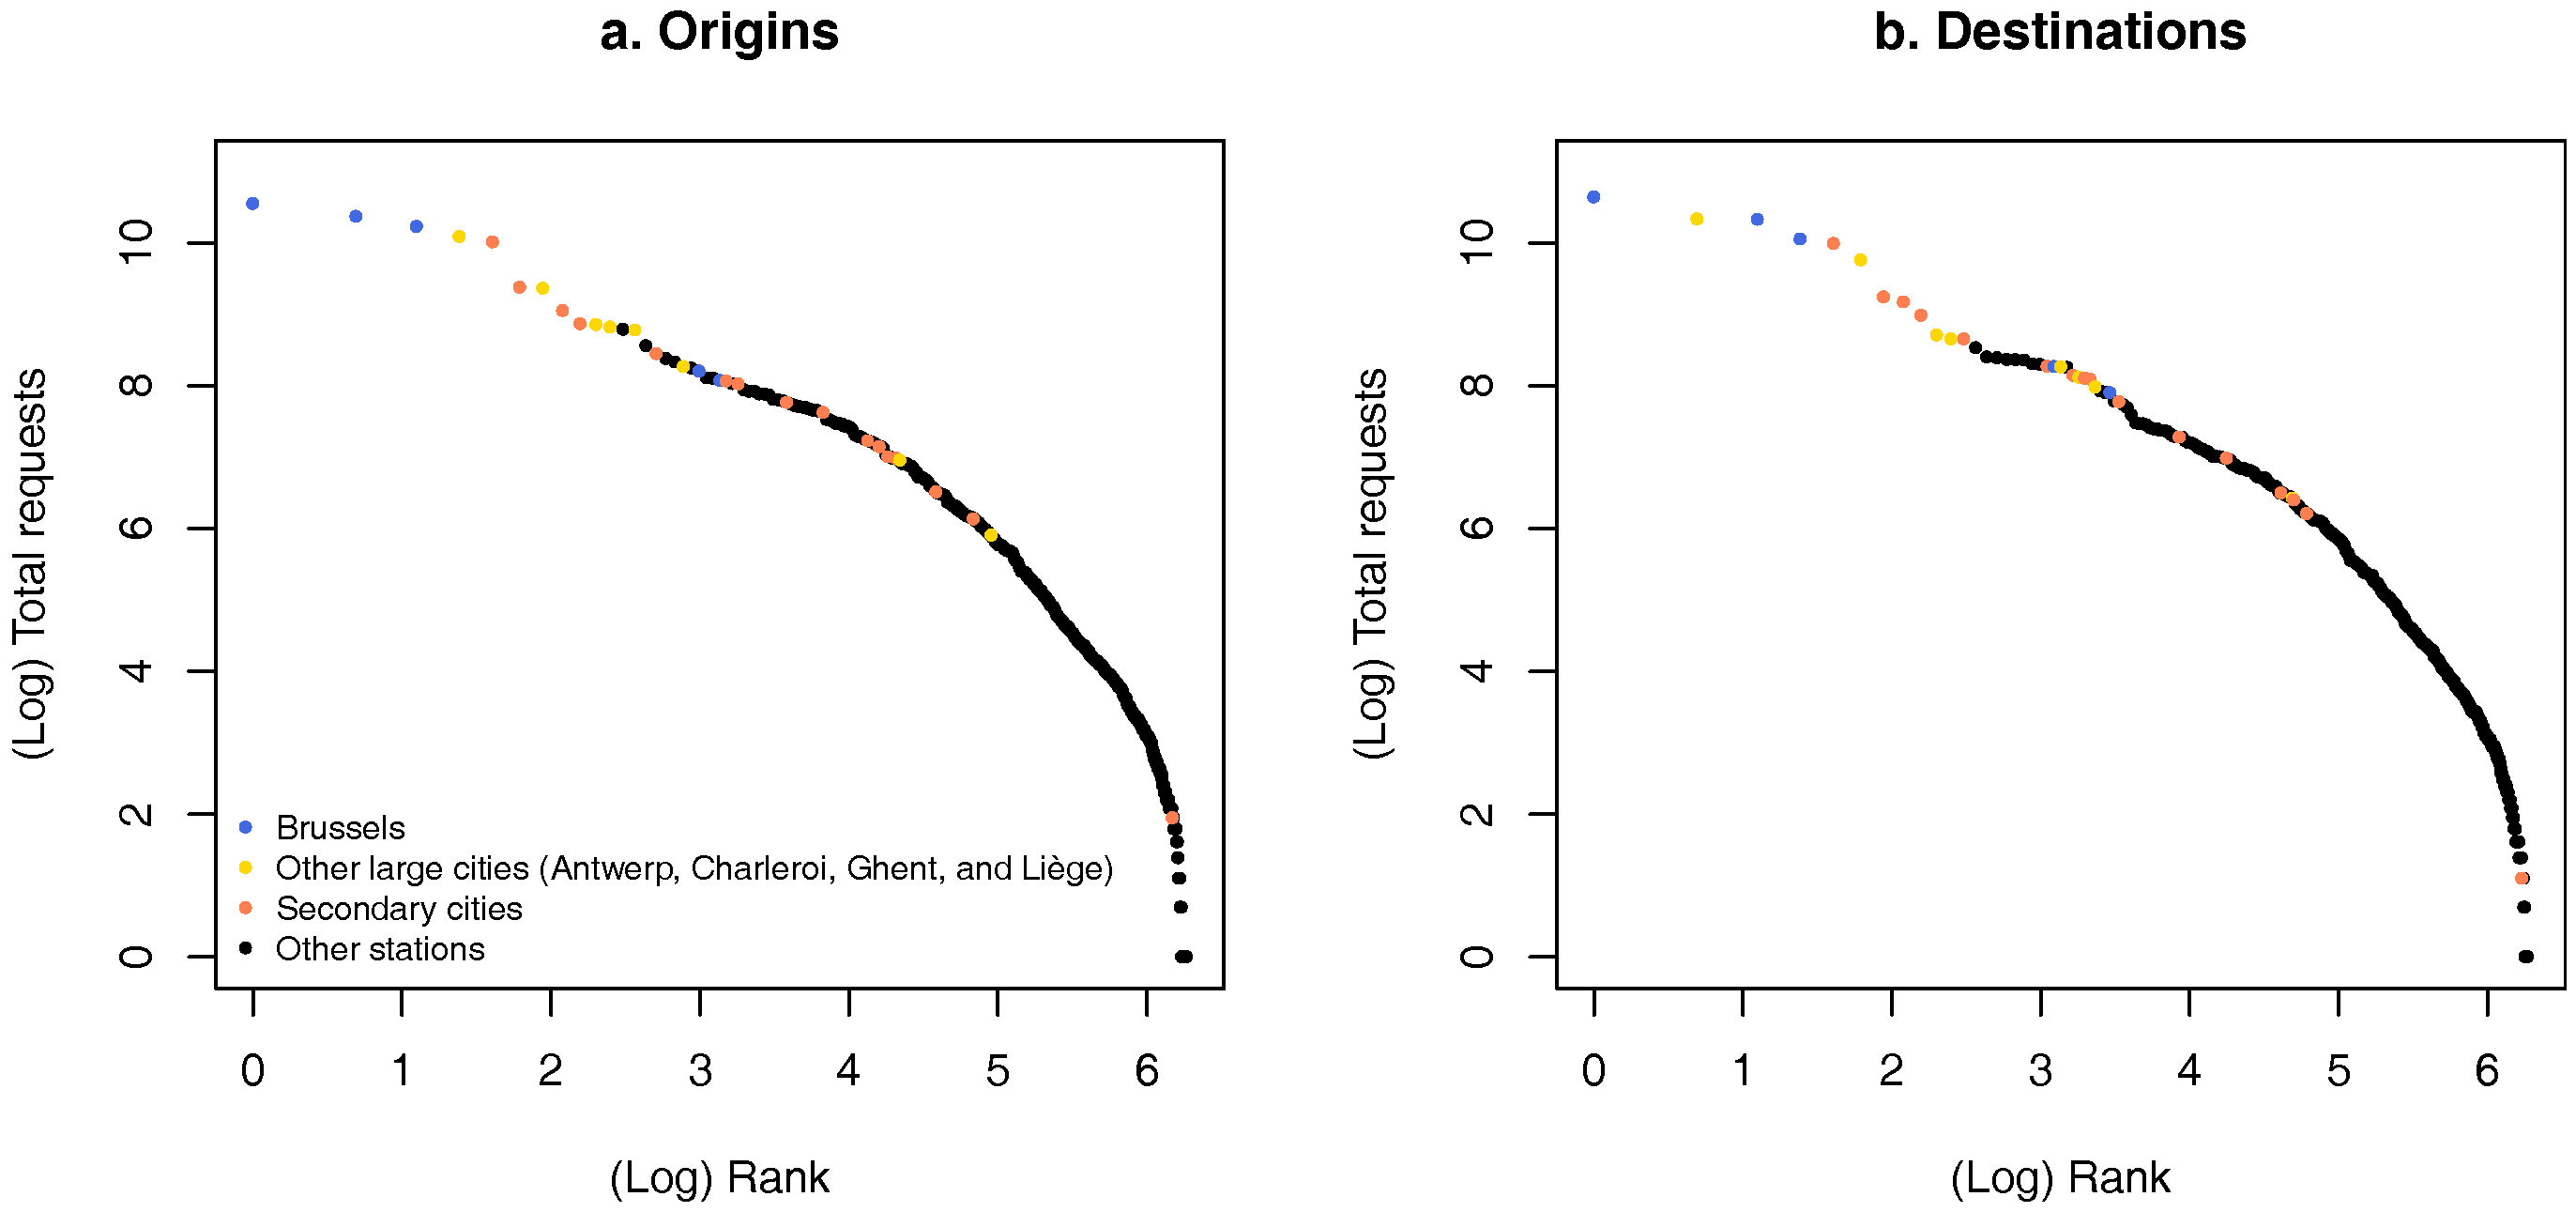
The central node of a community corresponds in most cases to a major city (
Table A1), and these cities are also the most frequent nodes in the iRail dataset, both as origins and as destinations (
Figure 4). Since the Louvain method ensures that the communities are composed of train stations that have relatively strong interactions with each other, the communities can, therefore, be considered as “influence areas”, similar in their principles to Reilly’s market areas [
64]. Note that the stability of the community at the node level (
Figure A1) allows assessing the robustness of these catchment areas.
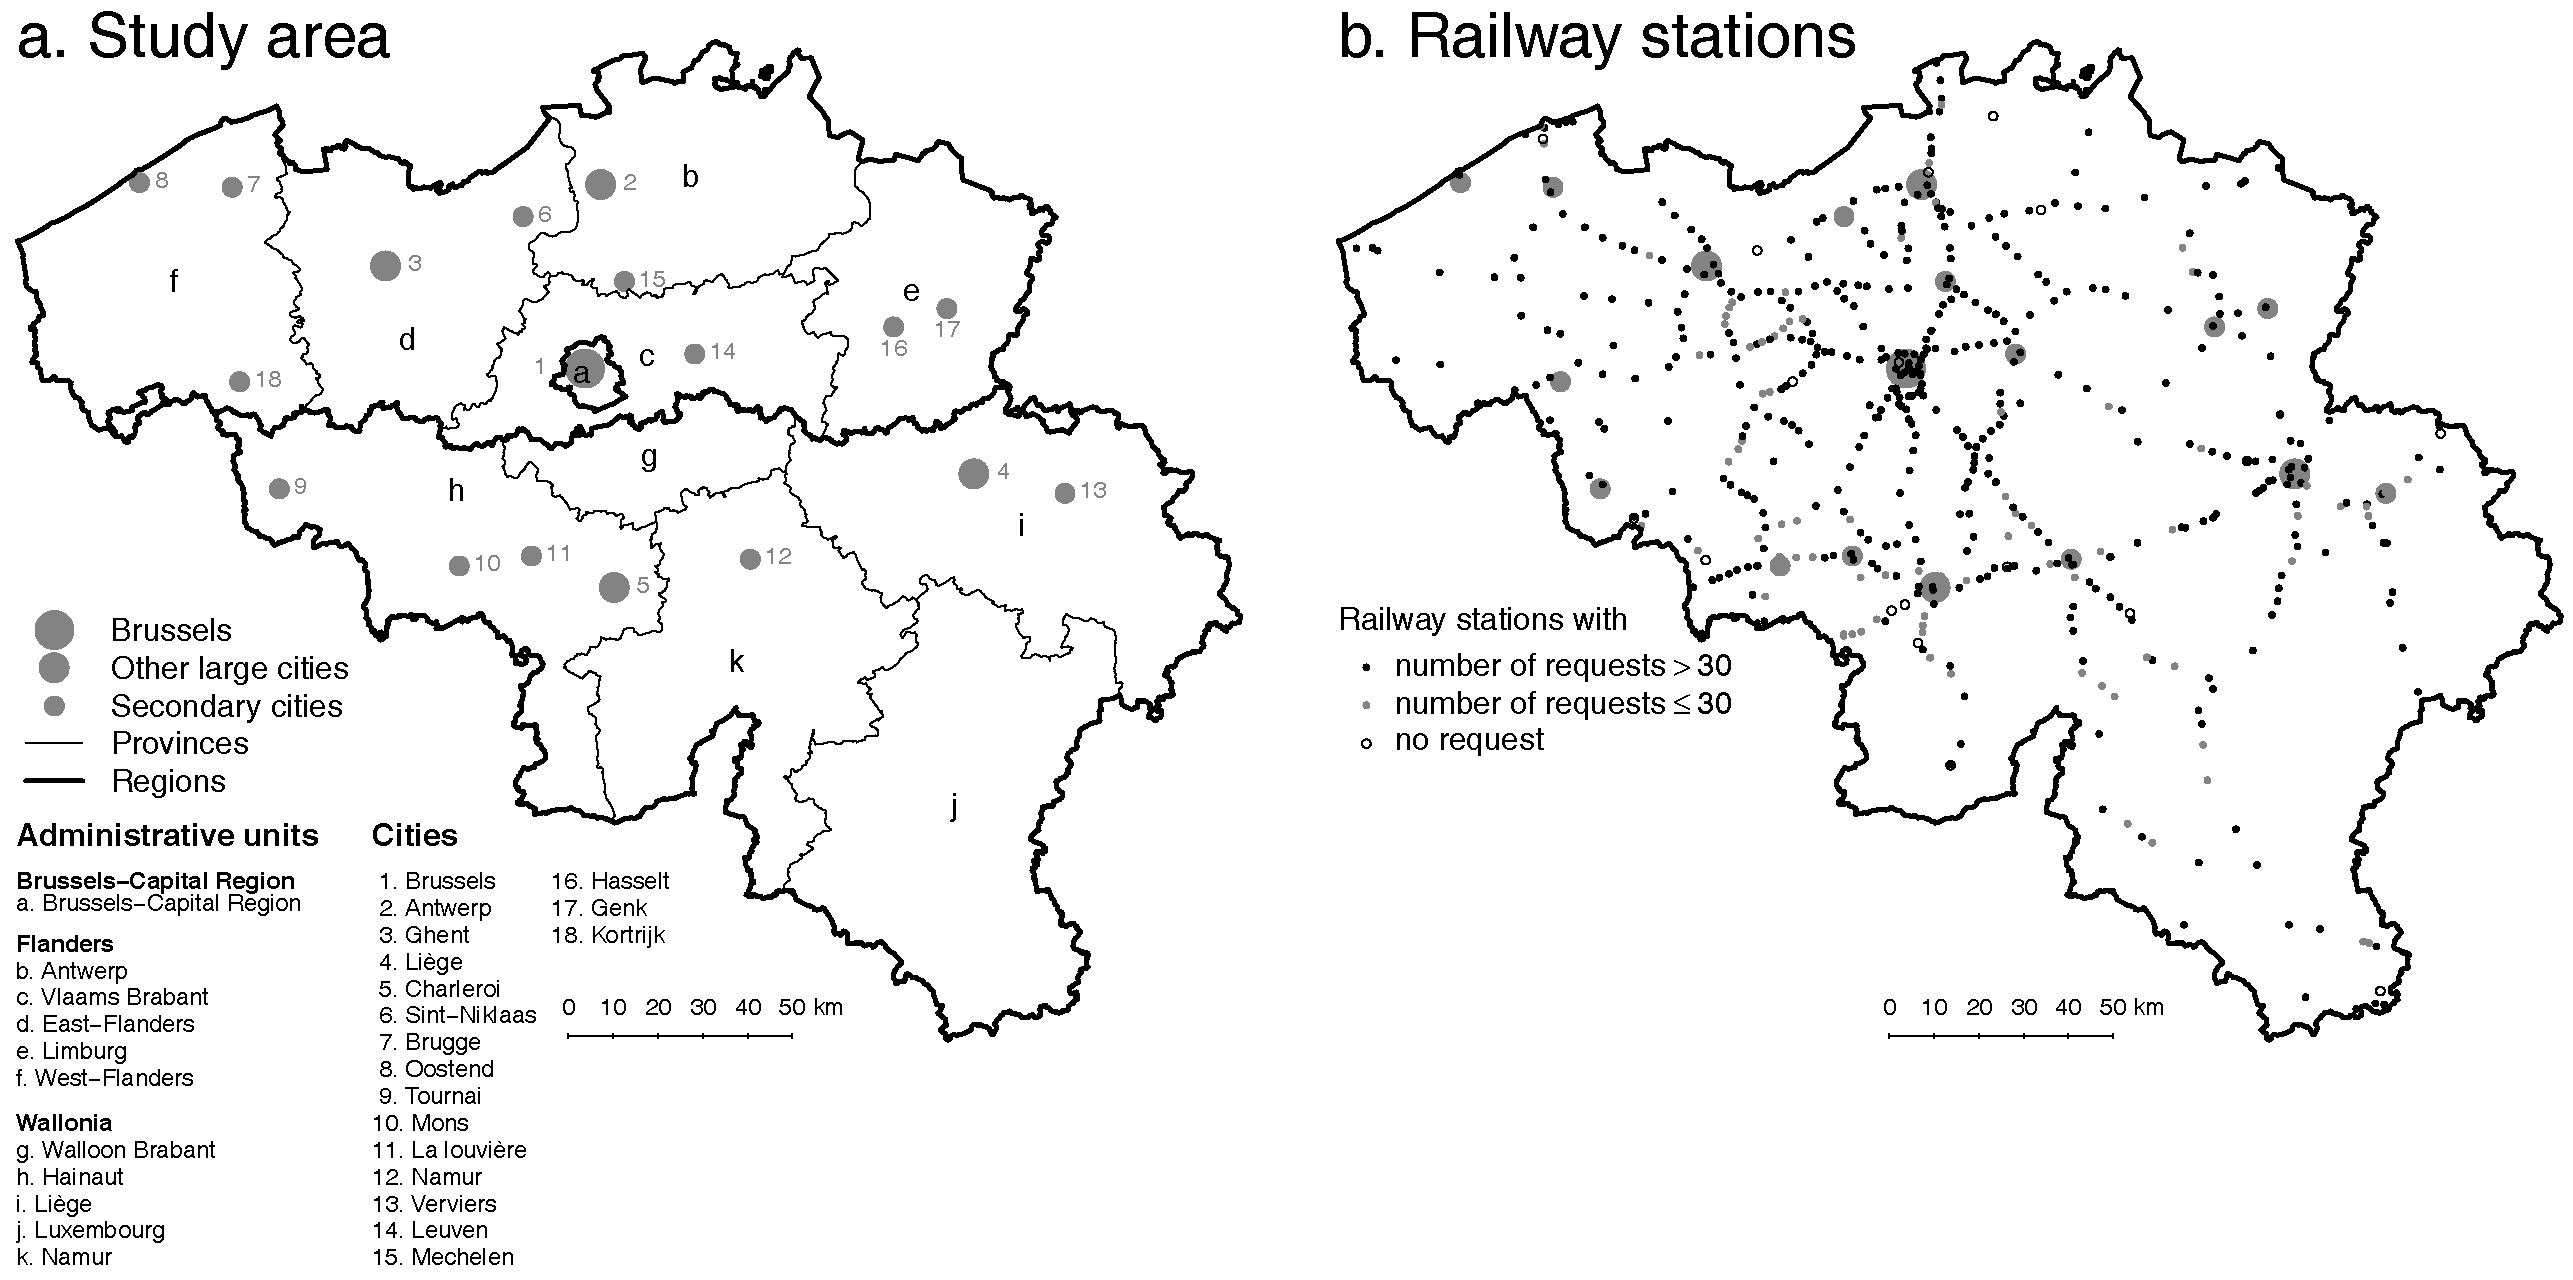
Belgian cities, however, vary in size (see
Section 3), and the different data subsets presented in
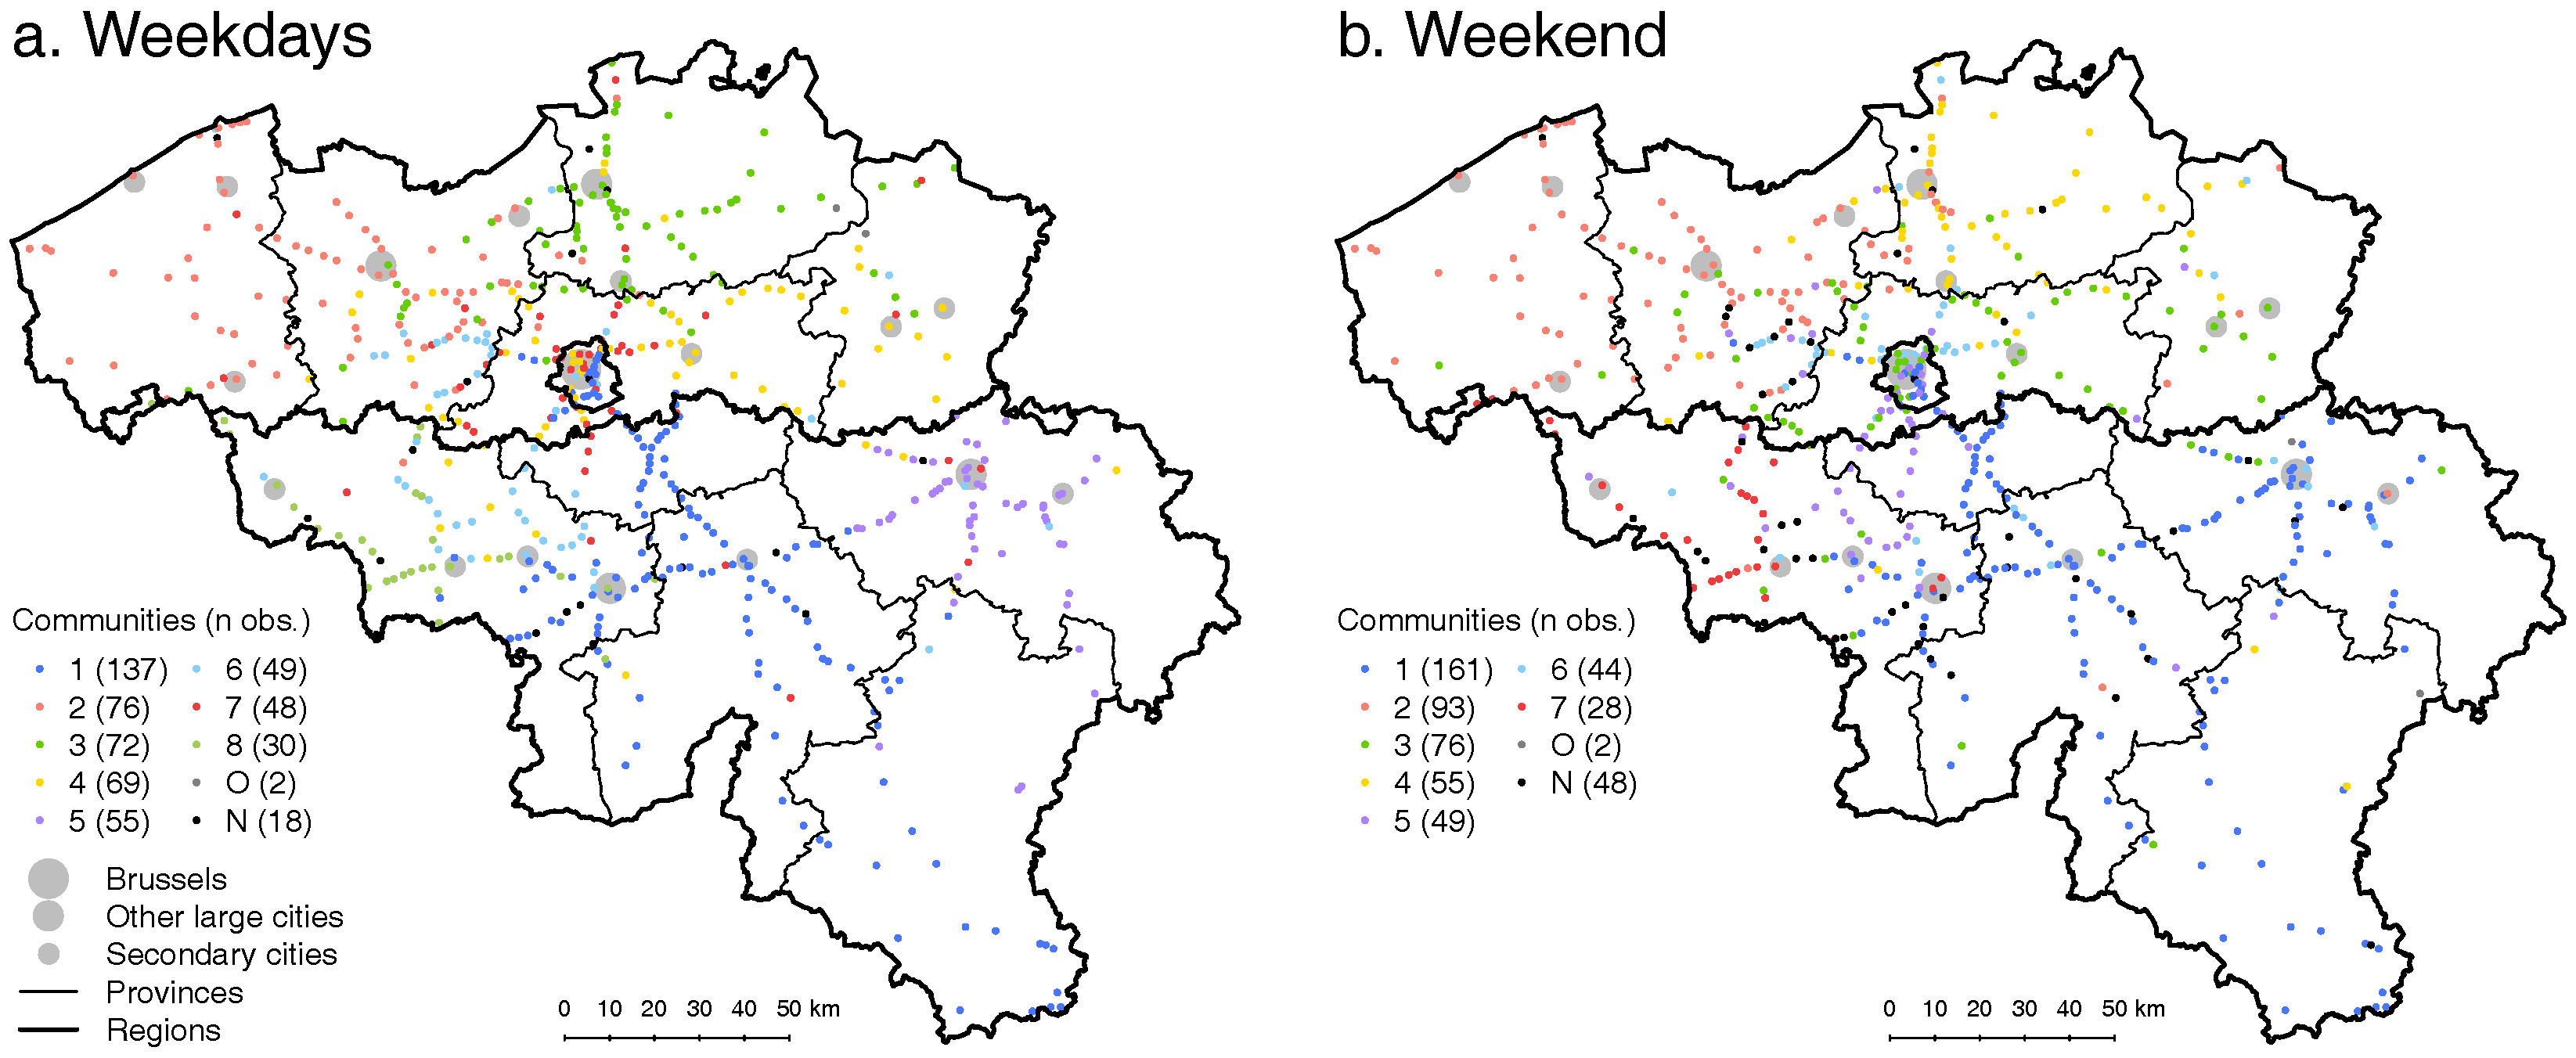
Section 4 also suggest a multi-level structure of the travel demand. This is in particular the case for the no Brussels, weekdays and weekend subsets. Brussels, the largest Belgian city, is the only metropolitan area constituting the central node of more than one community, for all subsets (except, obviously, the no Brussels case). Antwerp and Ghent (in Flanders) emerge as the center of one community for most case studies, while in Wallonia, a community centered on Liège is also found, but for only two of the case studies.
Other results, however, differ from what would be expected of urban-oriented communities. The relationship between the size of the city constituting the central node and the size of the community is tenuous. Among large cities, Charleroi is never the center of a community. Regarding smaller cities, despite (or due to) the denser urban structure in Flanders (
Figure 2), no other metropolitan area manages to constitute its own community, while in Wallonia, the relatively small city of Namur is the center of the largest community for most case studies.
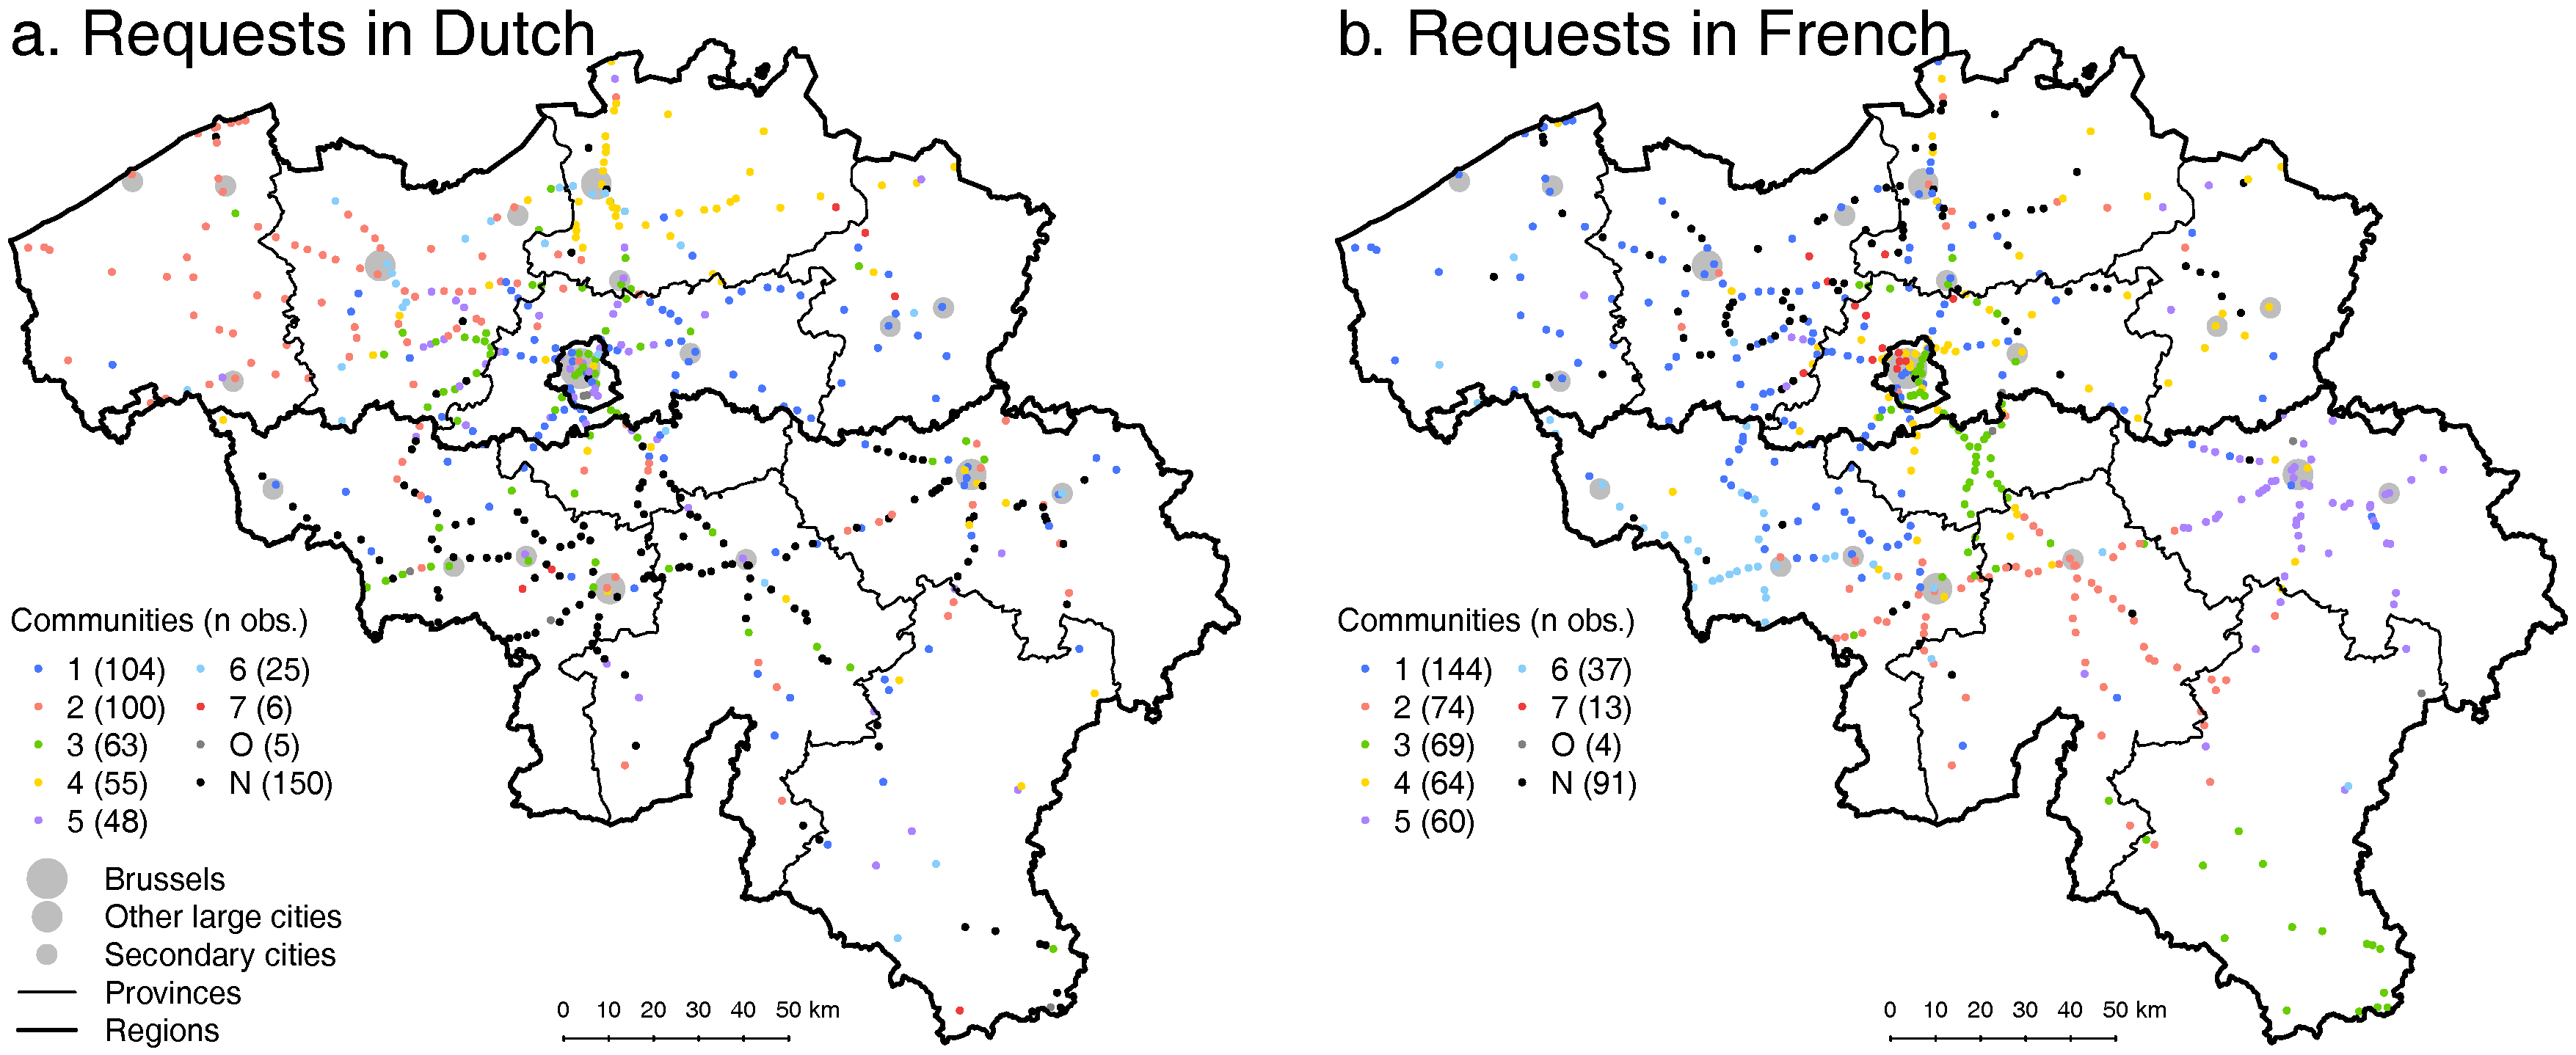
A radial structure centered on Brussels is visible in most data subsets, as well, consistent with a strong influence of the railway network on the communities. This influence seems larger in Wallonia and the eastern part of Flanders, where both the urban structure and railway network are less dense. For instance, the entire Brussels-Namur-Luxembourg line (southeast corner of Belgium) is included in the same community, except for the French subset. In the province of Hainaut (southwest corner), we can also observe communities shaped as triangles, with their basis in that province and their summits in the BCR (for the general, no Brussels and weekend subsets).
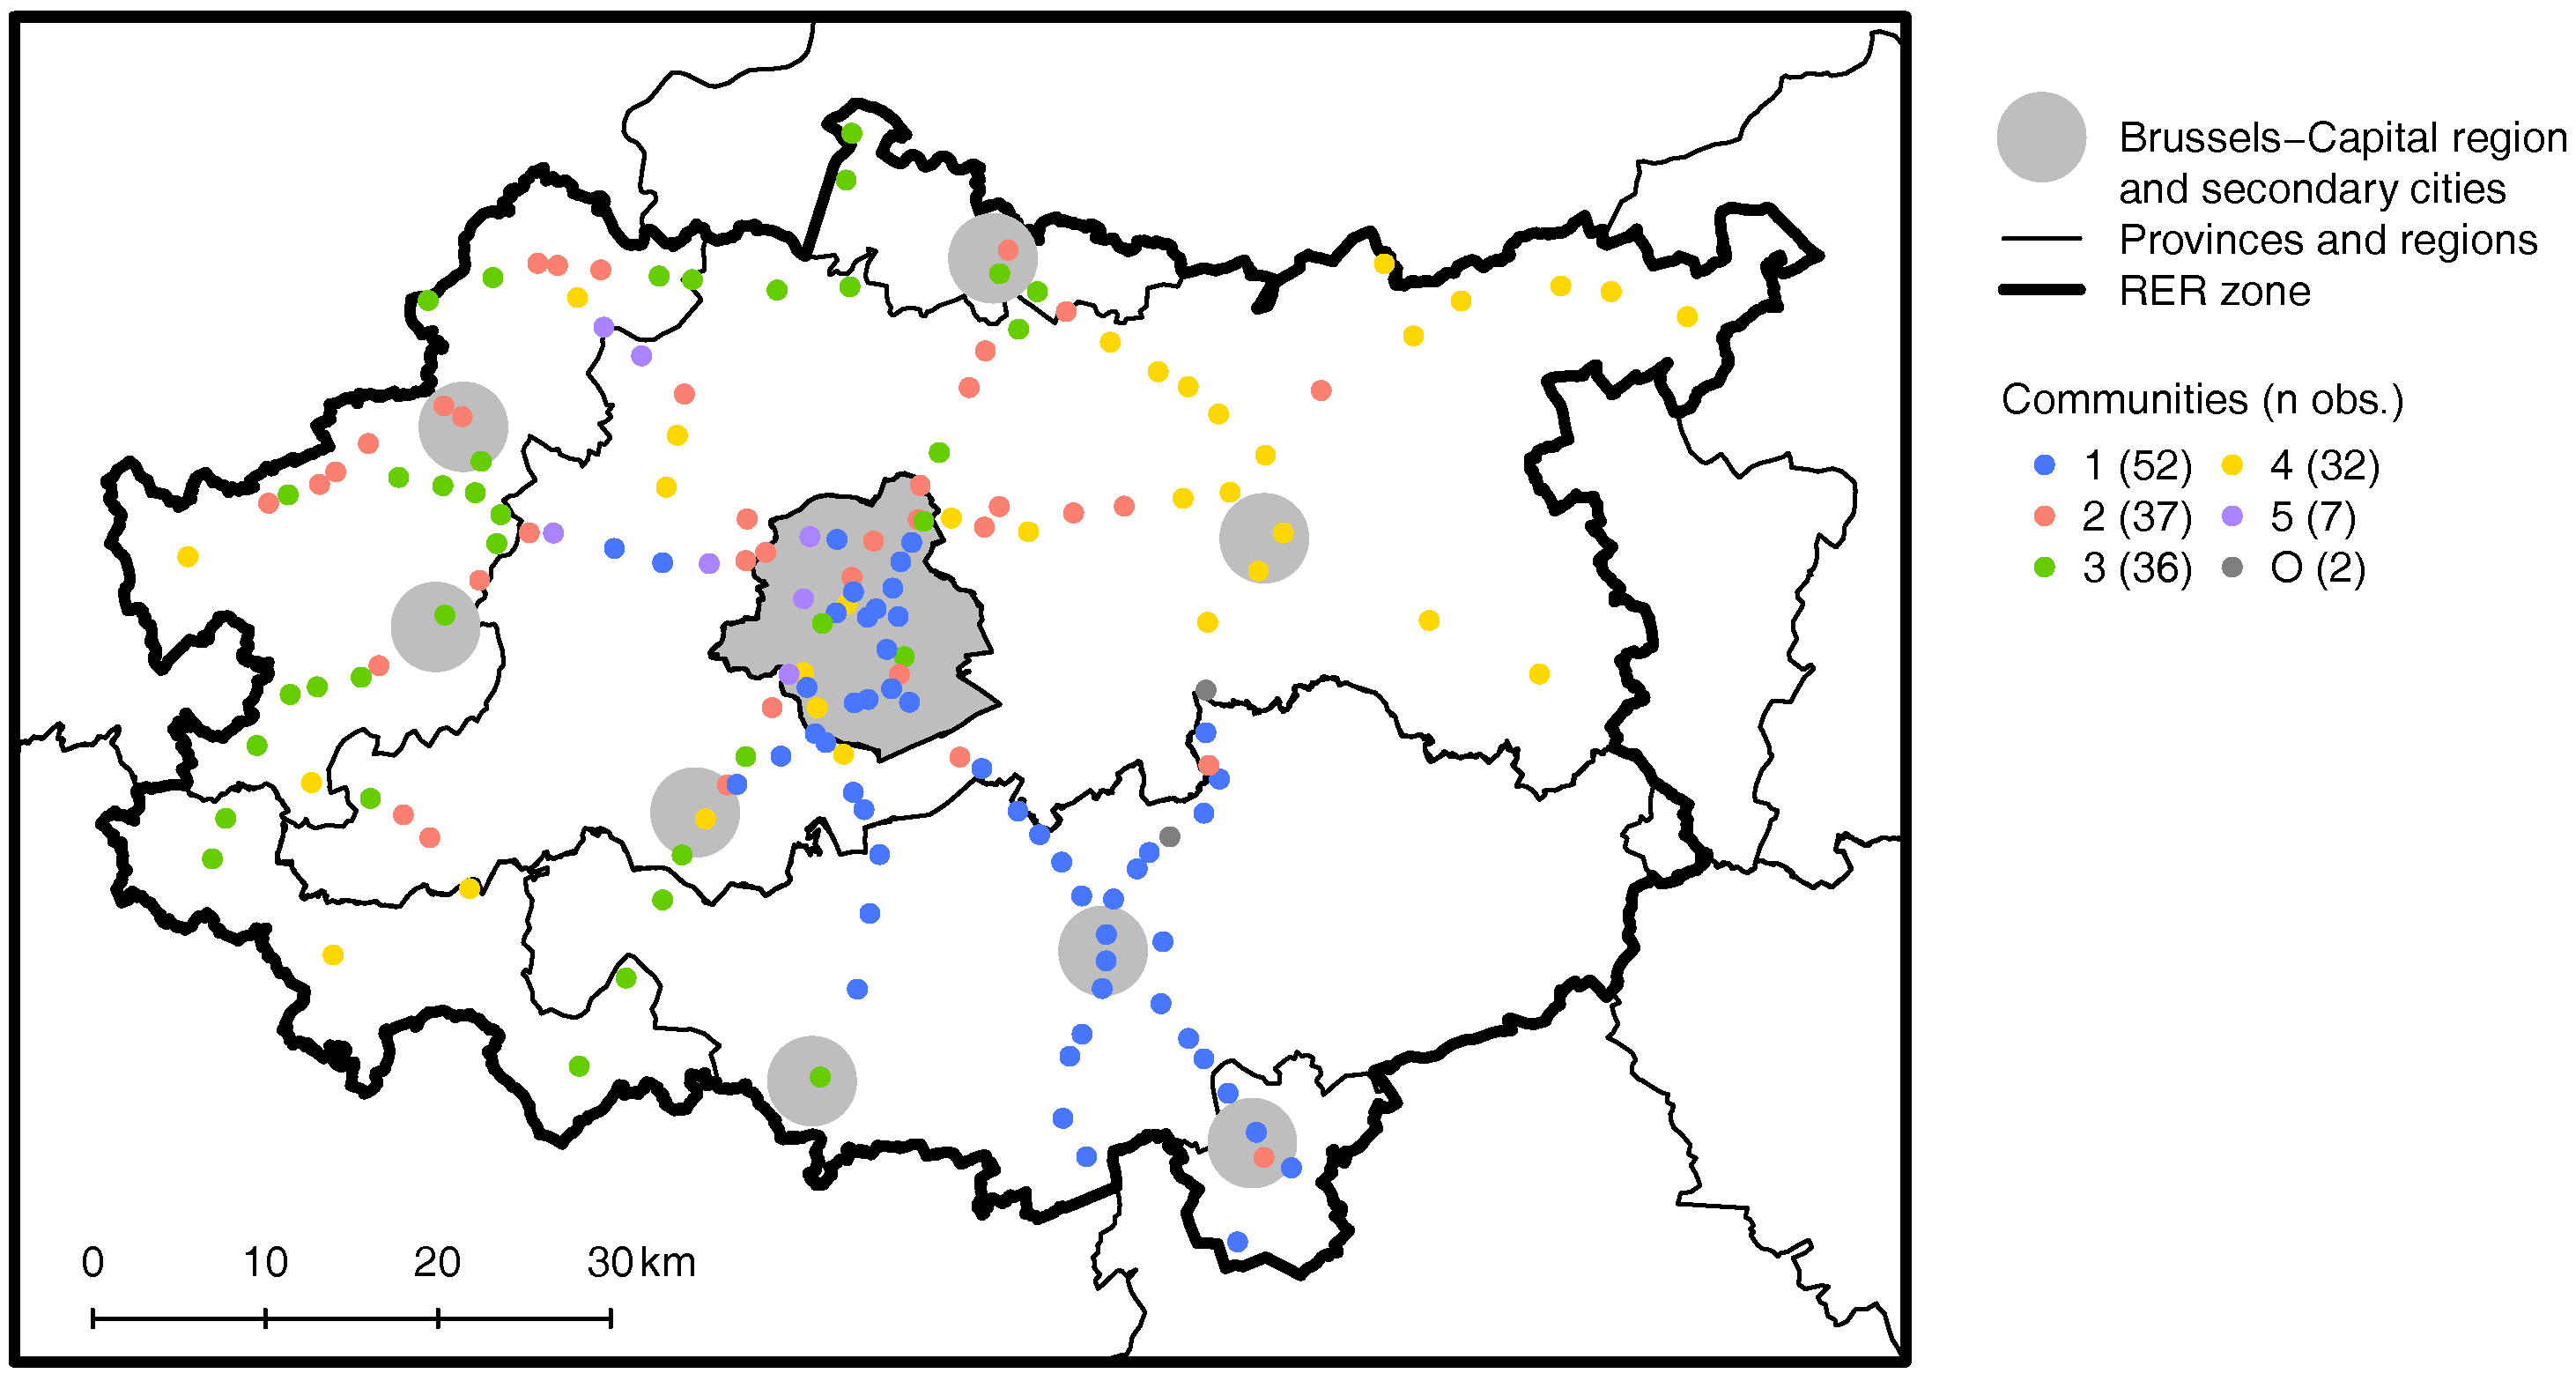
Therefore, both the urban and railway network structures influence the spatial pattern of the communities. More precisely, two factors seem to explain the weight of a city in our results: (1) its size (as expected from the classical gravity model of trade); and (2) its position within the railway network. Brussels is both the largest city of Belgium and the heart of its rail network and is, therefore, an outlier. Antwerp, Ghent and Liège, among other large cities, are main hubs on the network, offering interconnections between several lines. This is less the case for Charleroi (to be precise, we refer here to the stations of Antwerp-Central, Liège-Guillemins, Gent-Sint-Pieters and Charleroi-Sud), the only city that does not emerge as a community center. On the contrary, hubs of the railway network located in smaller cities (as Namur for the French subset) or even a purely functional hub (such as Ottignies for the RER subset) can still constitute communities’ centers. In particular, it is remarkable that for the RER subset all stations close to the Ottignies junction belong to the same community, while this is not the case for relatively larger cities, such as Aalst, Mechelen or Termonde. Both factors (the size of a city and its position on the railway network) are consistent with the economic and transportation geography literature and should be valid for other railway networks than the Belgian one.
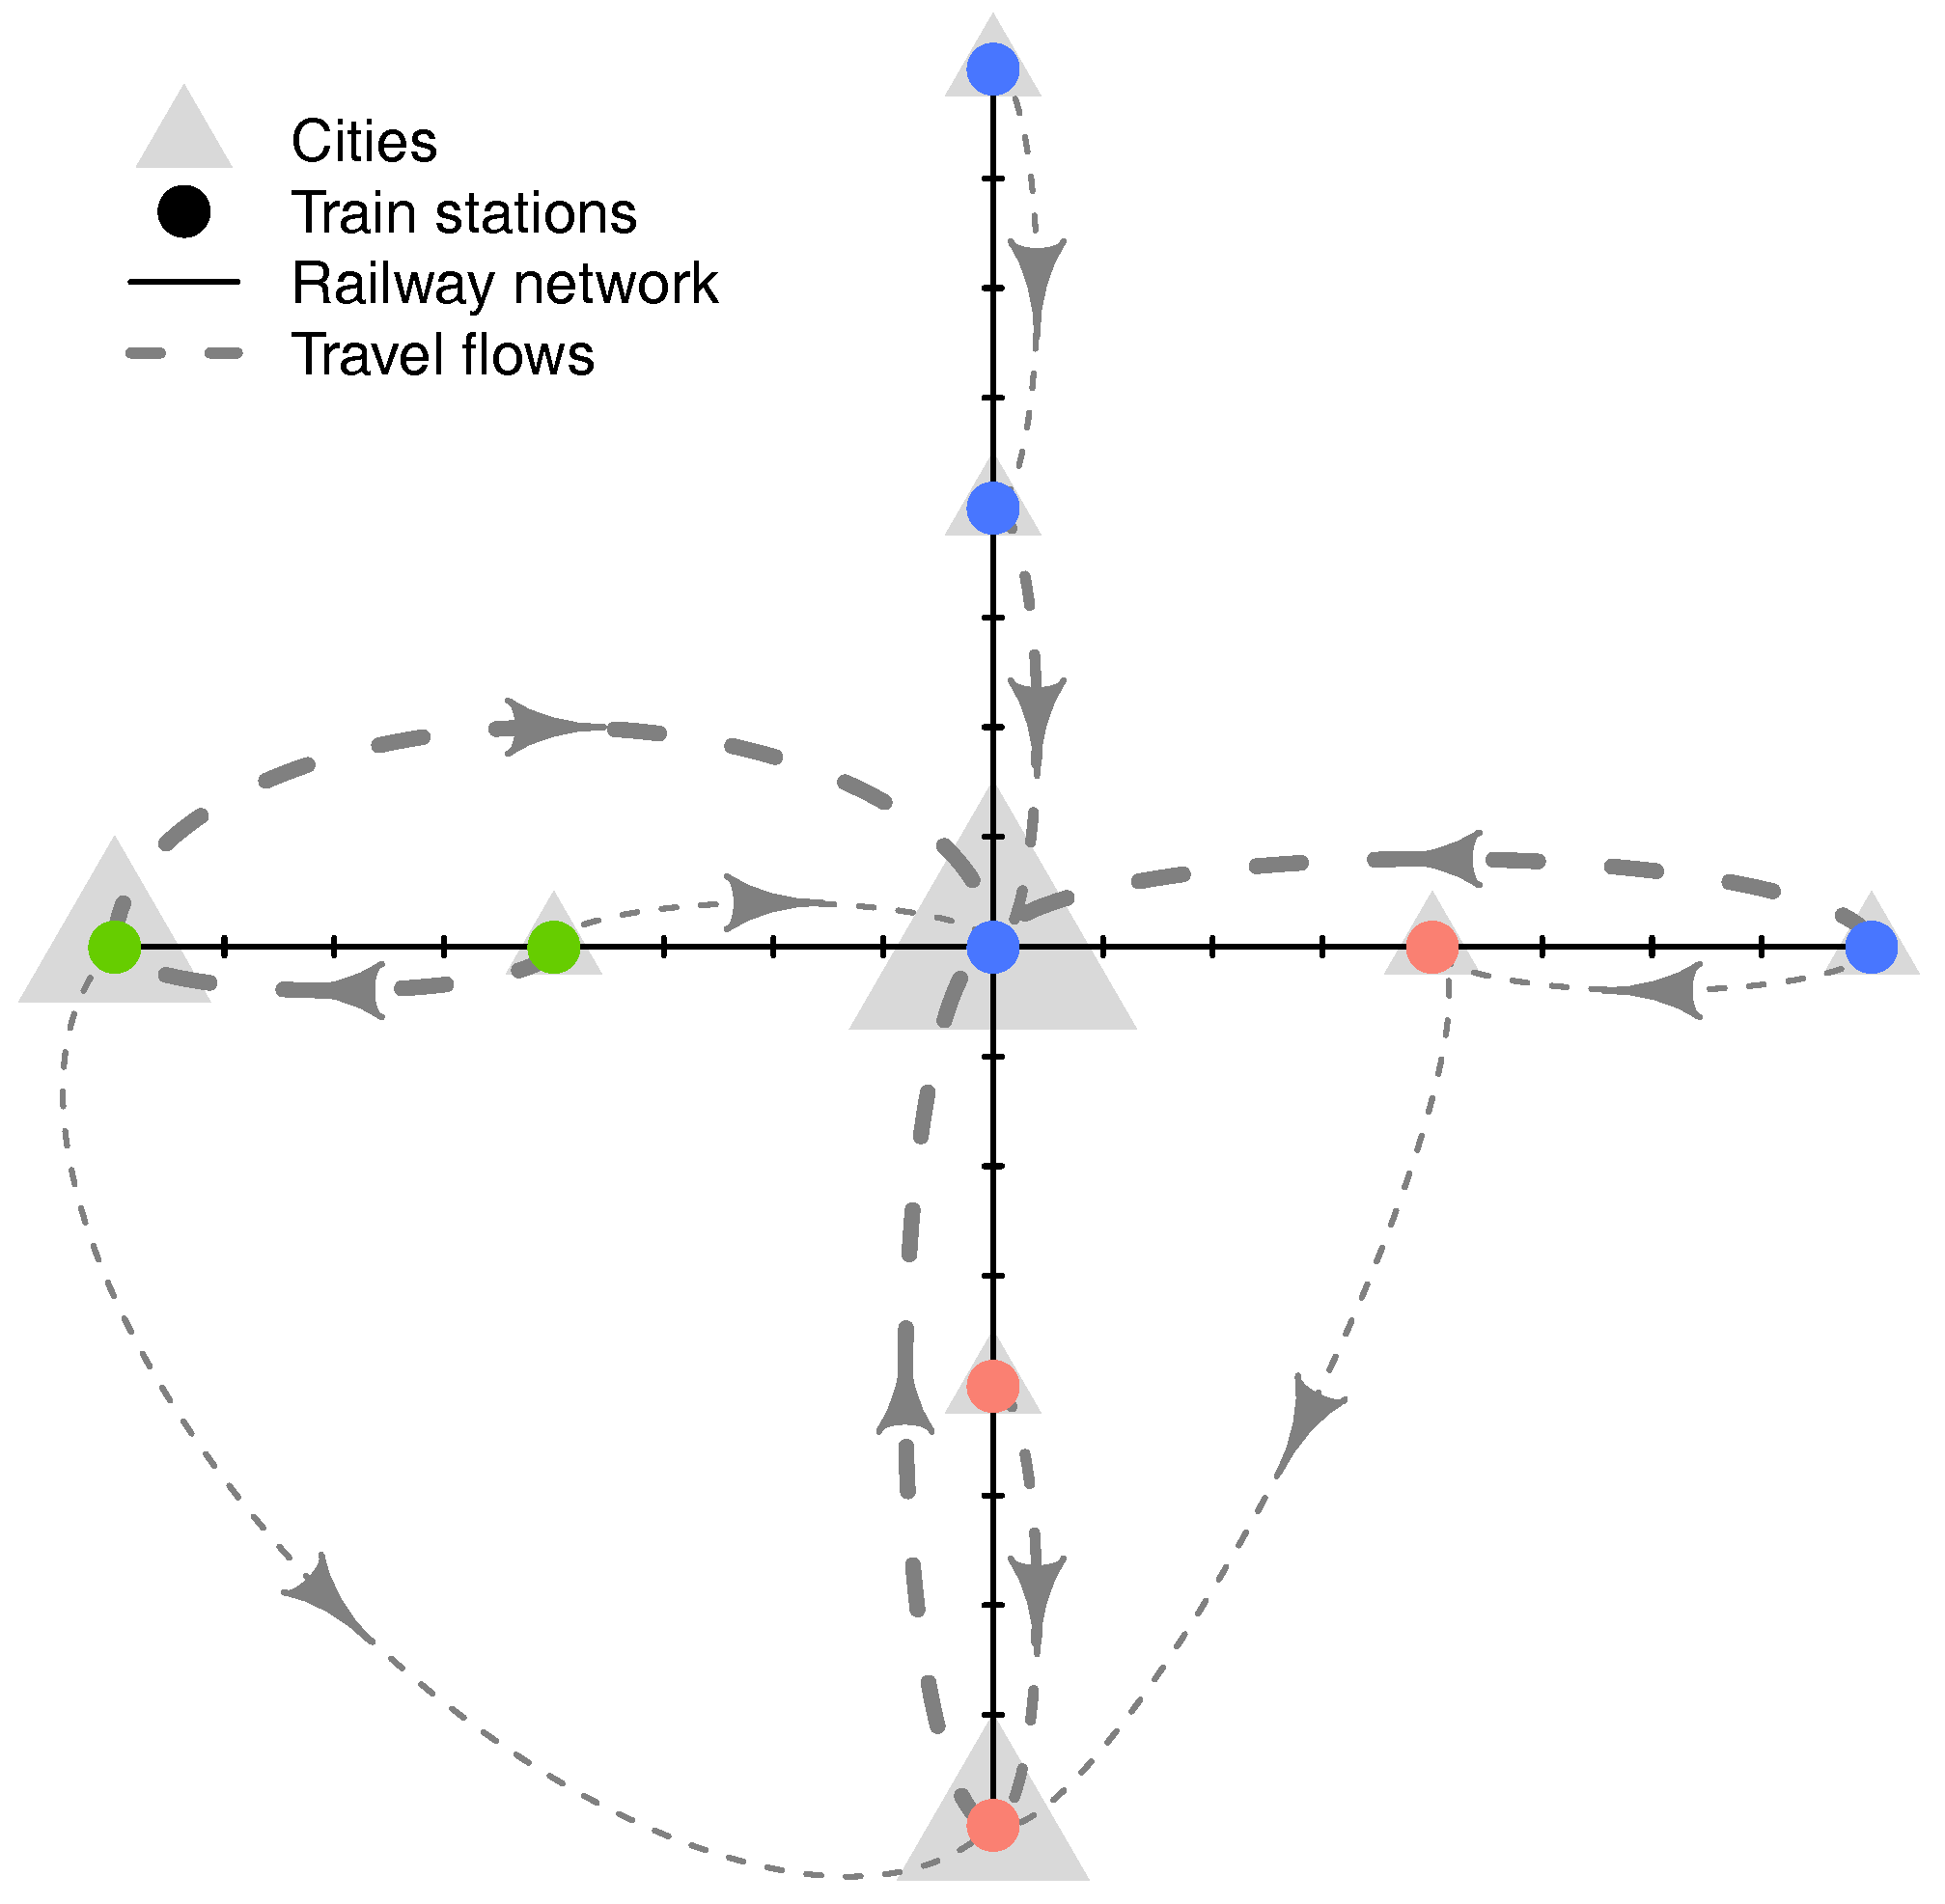
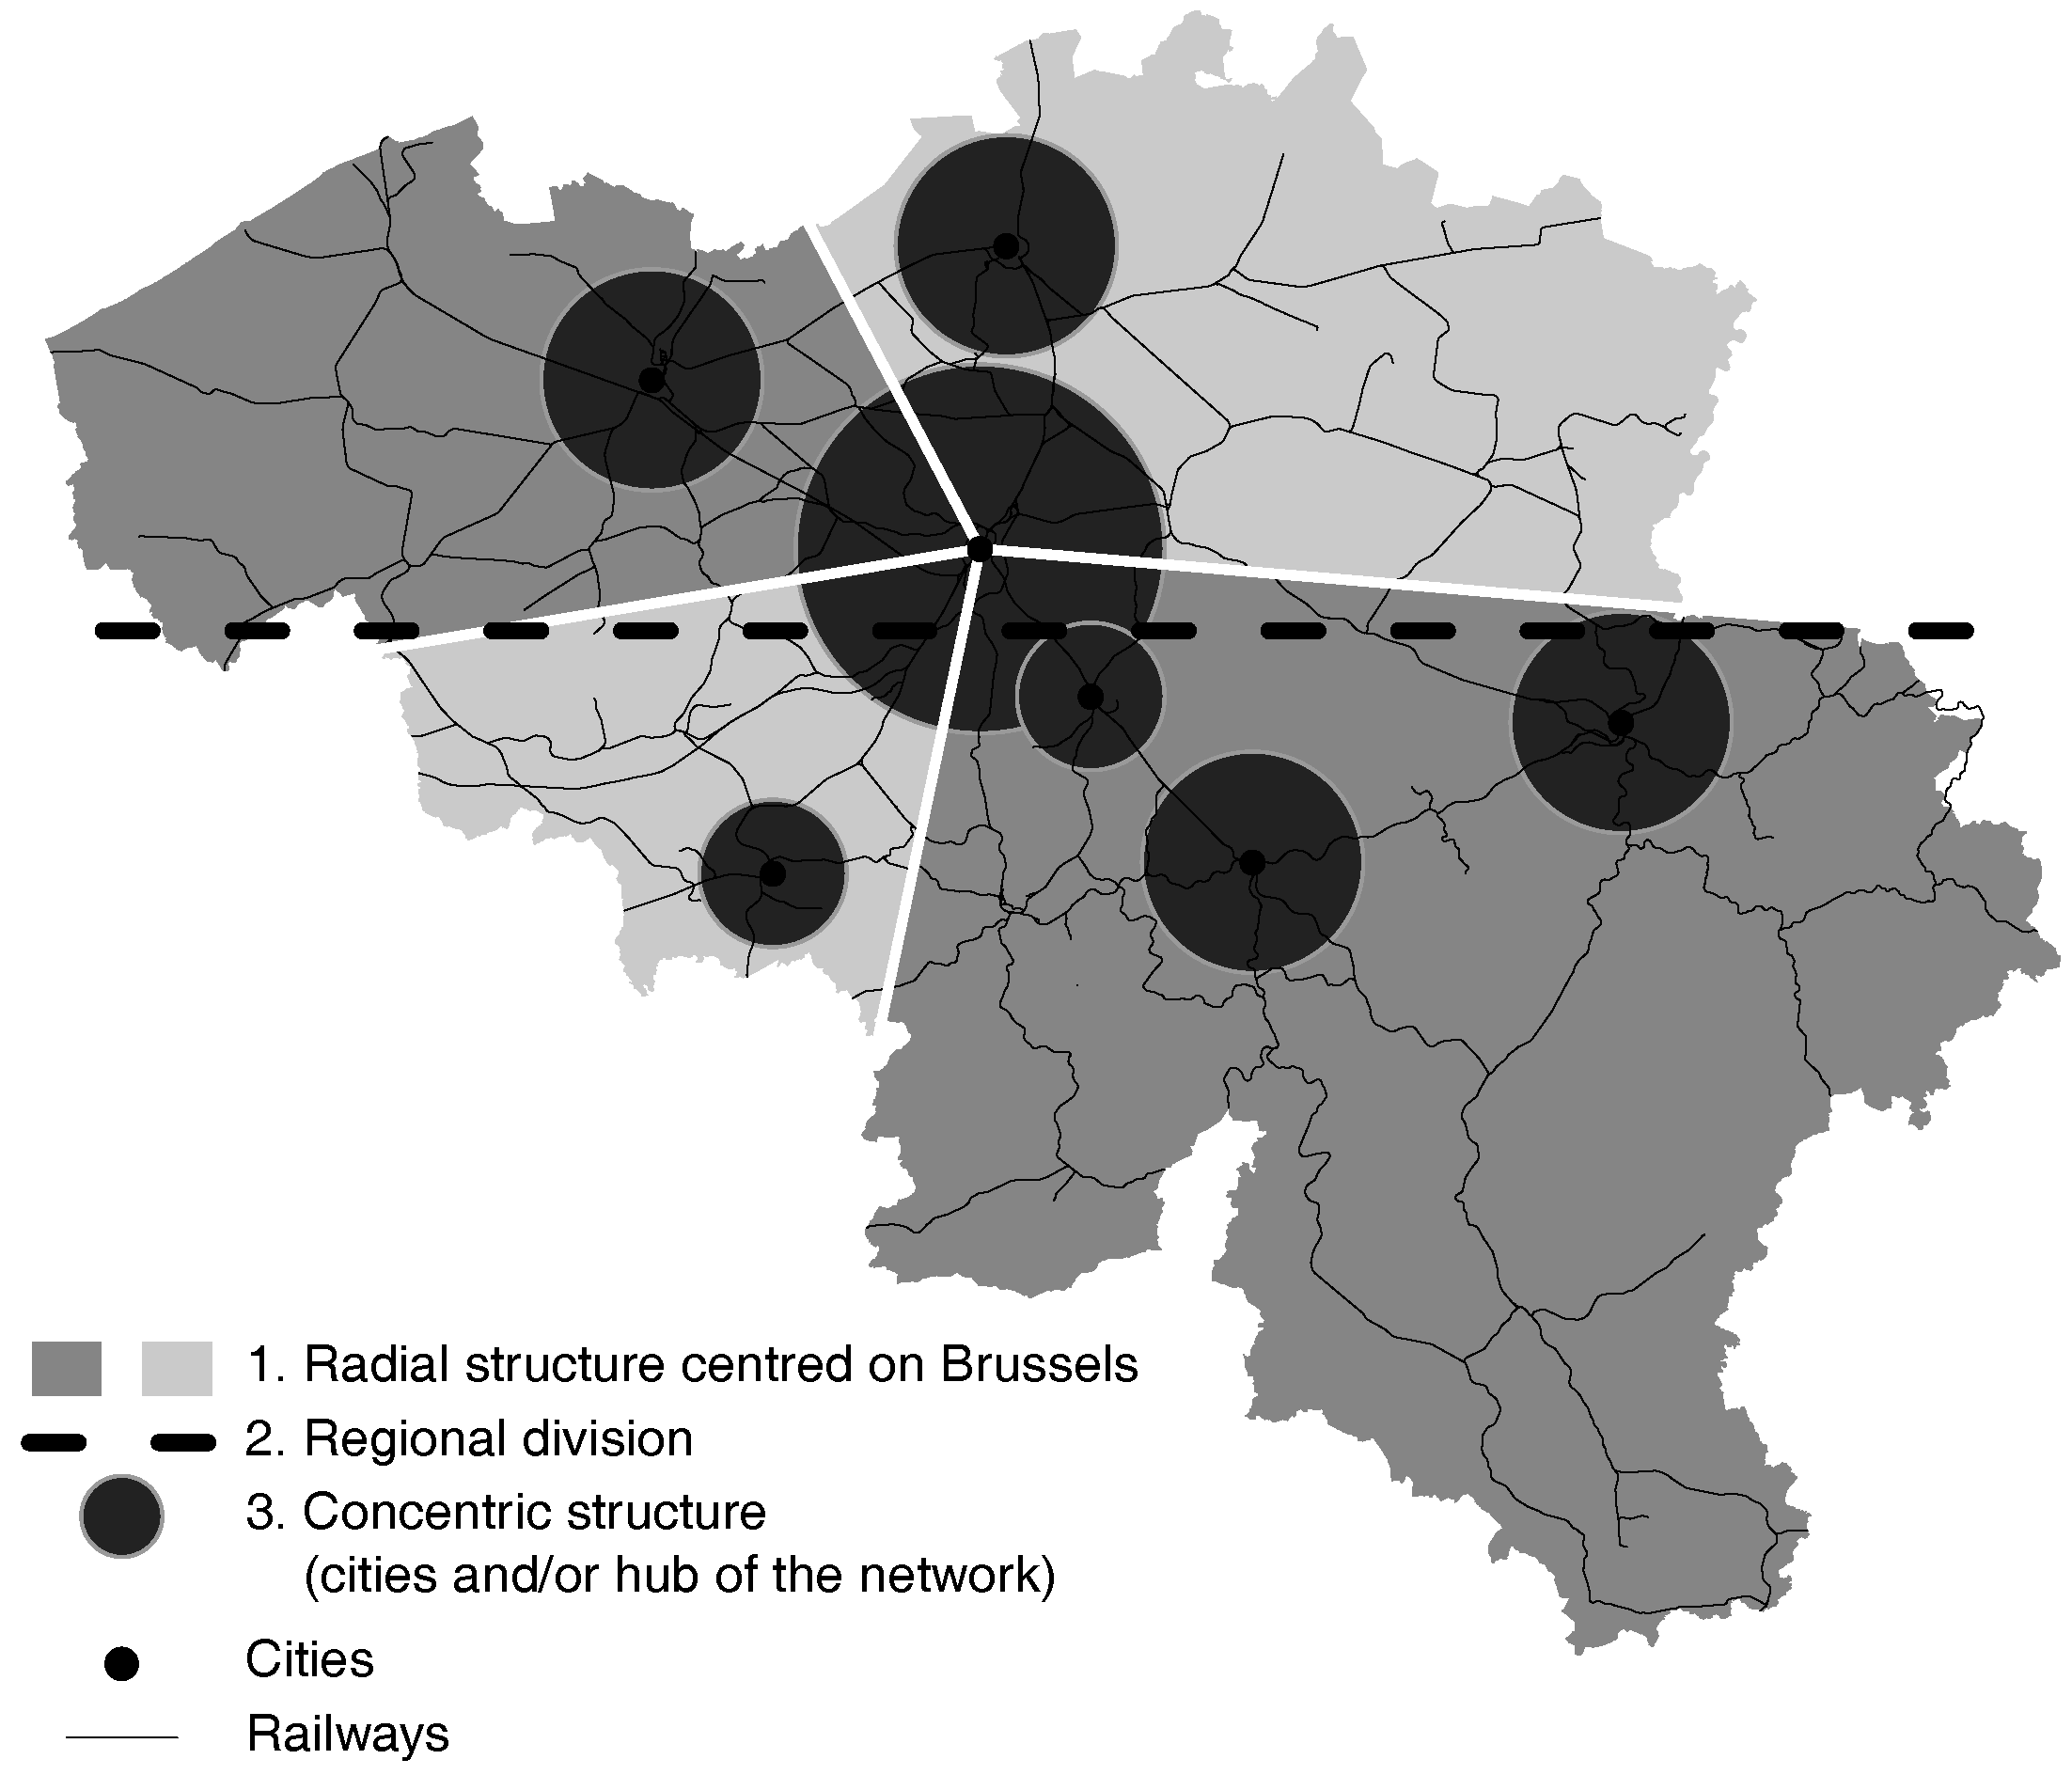
Overall, the spatial structure of the travel demand by train in Belgium, as revealed by the iRail dataset, consists of three nested layers: first, a radial structure centered on Brussels; second, a regional division appears, alongside the linguistic border between Flanders and Wallonia; third, there is a concentric structure around the main hub of the train network, mostly consisting of urban areas. This multi-level organization is schematized in
Figure 9. Note that its purpose is to formalize the spatial structure rather than representing the exact extension of the influence area of each city. For instance, the area in-between Brussels and Ghent (on the northwest) is essentially mixed, and the community centered on Ghent extends only to the West of that city. Nevertheless, Ghent is found to be a community center for five of the seven subsets. In our opinion, it deserves therefore its own circle in
Figure 9.
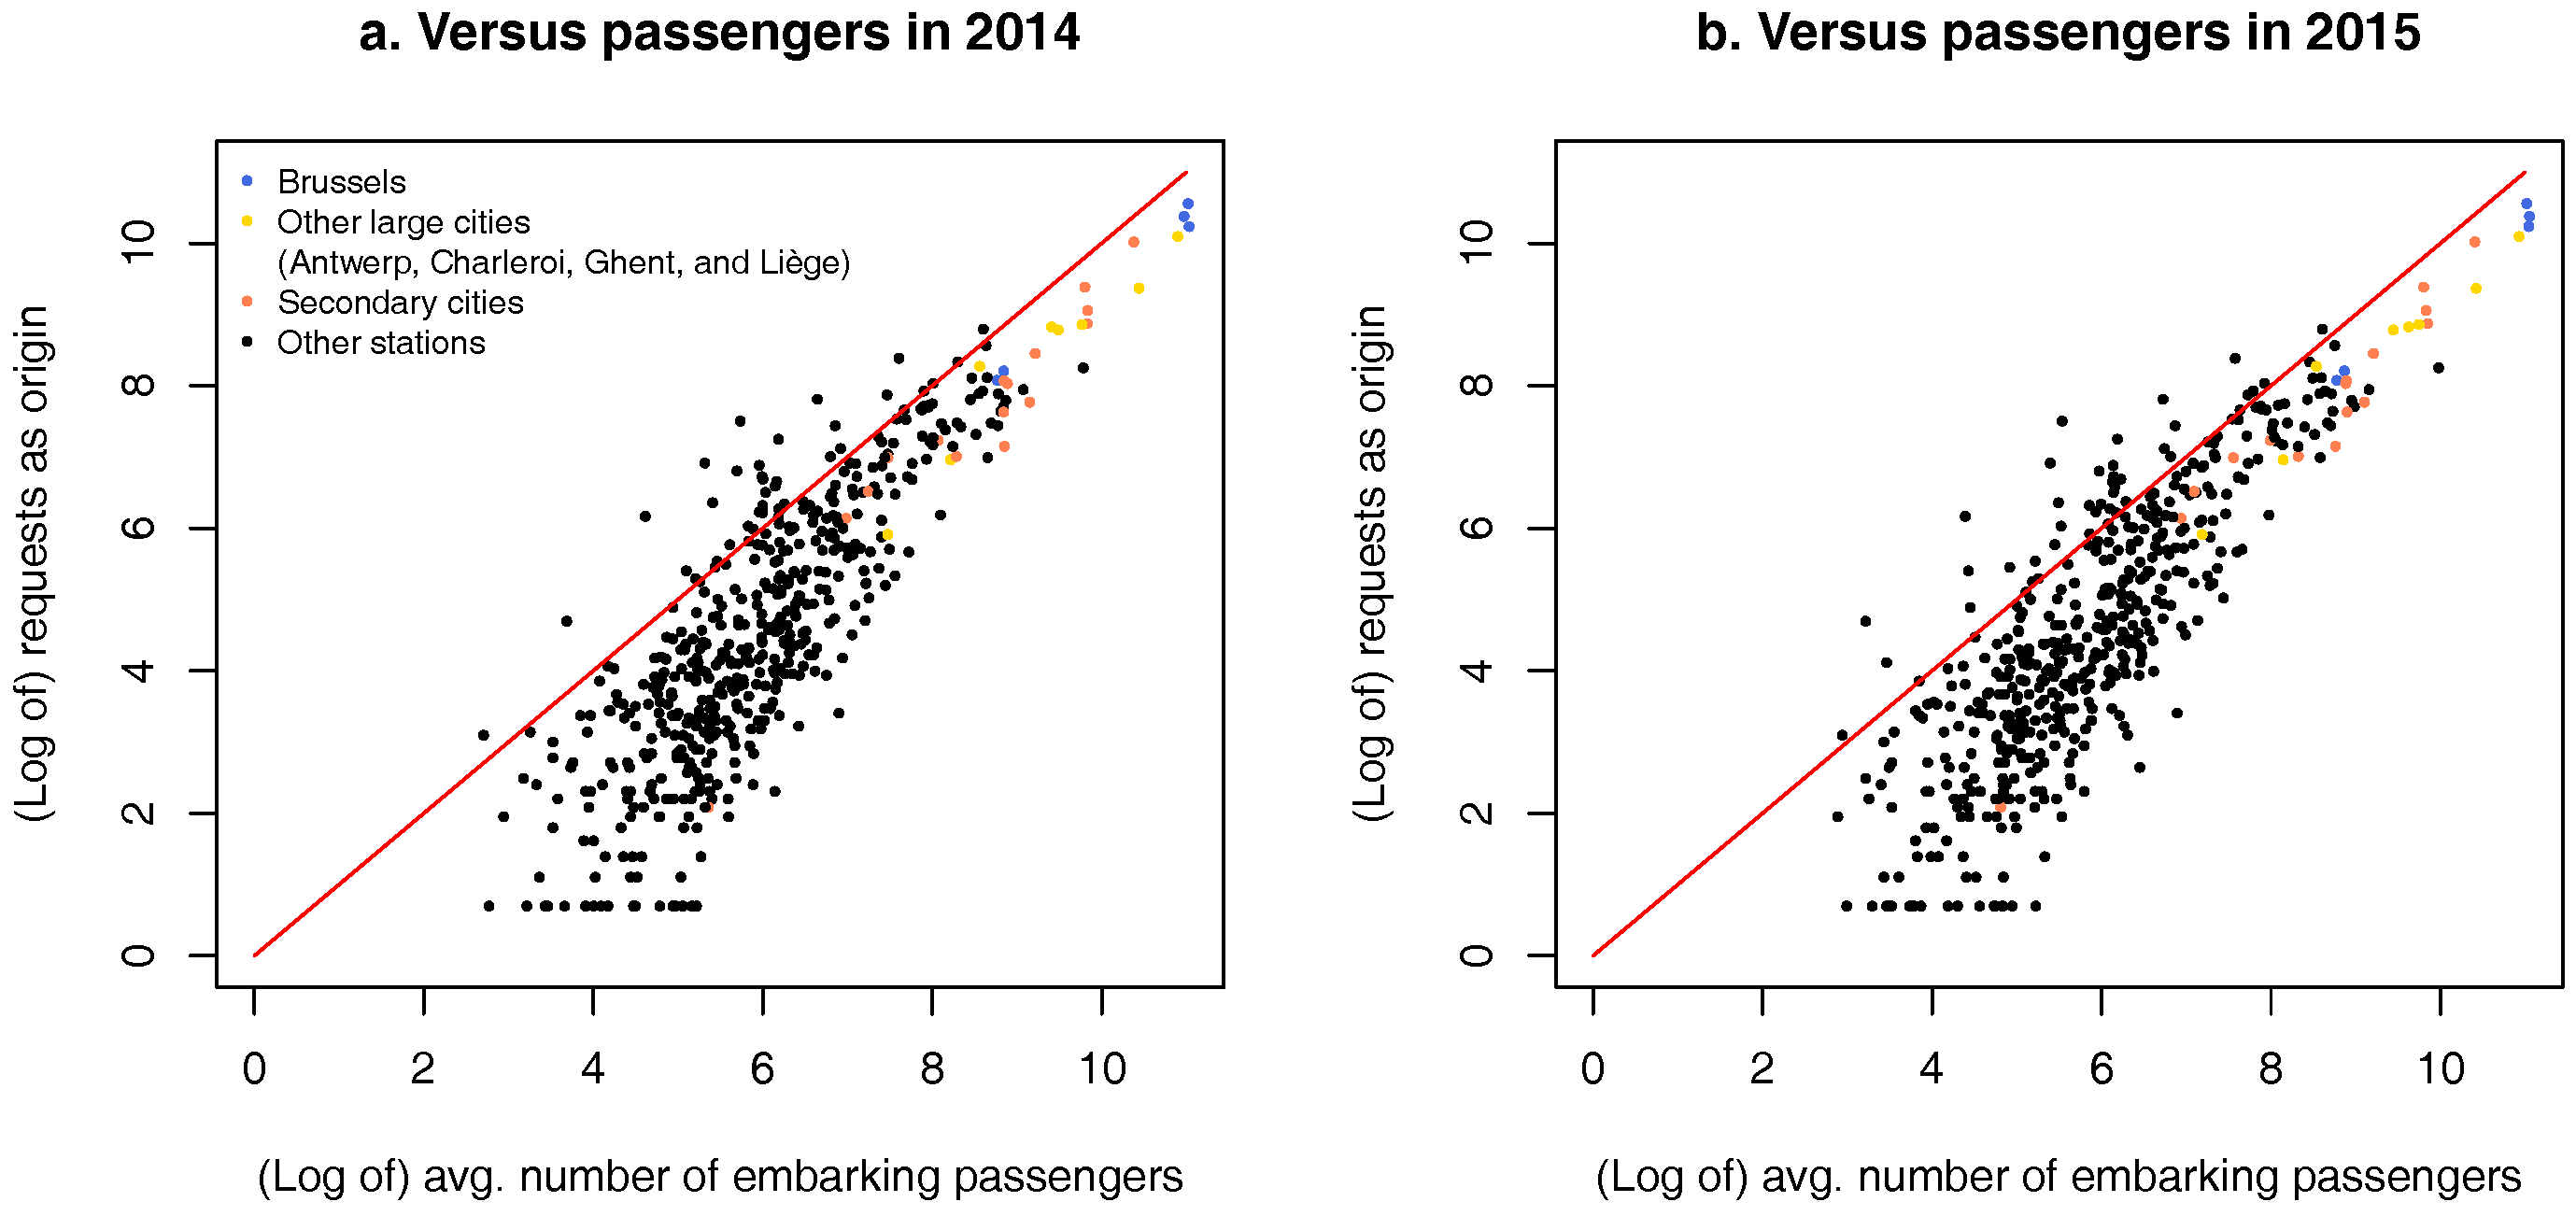
These findings are consistent with our initial hypothesis that both the urban and the railway network structure will influence the travel demand by train in Belgium. They also show that even in a dense country with relatively efficient public transport, such as Belgium, distance is still a key factor of the travel behavior, as assumed by the gravity model of trade and the related theory of market areas. Chiefly, however, their consistency with existing work on the urban and commuting structure of Belgium [
26,
27,
28] constitutes a strong support to our assumption that travel requests provide an accurate depiction of the geography of the actual travel flows.
5.2. Implications for Policy Decisions
The results presented in
Section 5.1 are straightforward for anyone familiar with the Belgian context, therefore supporting the robustness of the iRail dataset. Travel requests can thus be used further to explore non-trivial questions regarding transportation planning. In particular, two main debates exist currently in Belgium on the future of the SNCB. The first one concerns the RER service. Due to budgetary constraints, the completion of the network around Brussels (extension from two to four tracks per line) is, as of July 2016, uncertain for the Brussels-Nivelles and Brussels-Ottignies lines [
62,
65]. Our results show that these two lines belong to a community, including many stations located inside the BCR, both for the general case and for the RER subset (
Figure 8). Moreover, the five main stations of Brussels (Brussels-South, Brussels-Central, Brussels-North, Brussels-Schuman and Brussels-Luxembourg) are the destination of 18% of the requests from Ottignies and 80% from Nivelles. This fully supports the importance of completing the infrastructure as originally planned.
An auxiliary discussion about the RER is that local policy makers from the four other large Belgian cities (Antwerp, Charleroi, Ghent and Liège) advocate, from time to time, for the development of a RER service in their own city [
61]. The analyses provided here, although not specifically designed to answer this question, suggest that providing such a service would only make sense in metropolitan areas that are the central node of a community, i.e., Antwerp, Ghent and Liège, but not Charleroi. Among smaller cities, Namur is also a potential candidate.
The second debate on the future of the national railway company, mostly fueled by policy makers from Flanders, is its possible separation into two regional (Flanders and Wallonia) companies [
66,
67]. Our findings do indeed show that most communities do not trespass the linguistic border. This regional division is, however, the second level of the spatial structure described in
Section 5.1, the main one being a radial structure centered on Brussels. The spatial pattern of most communities centered on that city is independent from the regional boundaries. Moreover, the five main train stations within the BCR are the destination of travel requests from 423 different stations (or 78% of all stations) and the origins of travel requests towards 431 stations (80%). Whatever the future institutional organization of the Belgian railways, there is thus a clear need to preserve a high level of service to and from Brussels.
Nevertheless, we can question some features of the rail transport offer. In particular, thanks to the “Jonction Nord-Midi” (see
Section 3), the main stations in Brussels are connected to each other. Different train services can thus call in Brussels while joining other cities, for instance IC-01 (“IC” stands for “intercity”, i.e., fast interurban connections.) connection links Oostend to Eupen, via Ghent, Brussels and Liège (and vice versa) or the IC-05 connection going from Charleroi to Antwerp, via Brussels. In the iRail dataset, 11% of the requests from Ghent-Sint-Pieters have Brussels-Central as the destination, while for Liège, it is only 0.2%. The corresponding values from Liège-Guillemins are 5% and 0.5%. From the station of Charleroi-Sud, 12% of the requests have Brussels-Central as the destination, and 2% to Antwerpen-Centraal. In the other direction, the shares are 9% for Brussels-Central and 0.7% for Charleroi. Both examples show that the travel demand between two Belgian cities separated by the linguistic border is low, even if a direct connection exists between these towns. One may argue that a train service from a regional city to Brussels and return would be more efficient. However, assessing this question overcomes the goals of this paper.
5.3. Challenges and Paths for Future Research
The first contribution of this paper, as stated by
Section 1, was to assess if datasets made of travel requests can represent actual travel flows. Our results confirm their potential, even if the iRail dataset raises two main methodological challenges that should be addressed. First, as detailed in
Section 2, a travel request made on the iRail website or application does not mean that the journey was actually made. The number of requests cannot, therefore, be easily translated into forecasts of the absolute number of passengers. Still, using data collected during a two-month period only, we end up with an accurate representation of the relative importance of each link, which is sufficient to study the spatial structure of the travel demand by train in Belgium. The second difficulty is that iRail is only one of the various schedule-finder websites and applications existing for Belgian railways. The analysis proposed in this paper would gain from relying on the travel requests made on the official SNCB application, even if the pattern observed here is consistent with the geography of Belgium.
We were unable to find any published work relying on travel requests to study the travel demand. Nevertheless, datasets similar to iRail exist for all schedule-finder websites or applications, the main issue being their limited availability due to privacy or commercial reasons. Nevertheless, the results presented here open new avenues for further geographical research based on datasets similar to the iRail one.
A first direction for future works is territorial planning. The travel requests allow a high level of spatial and temporal details. In a sustainable development context, they could be used to assess the location of a proposed infrastructure offering the highest willingness to travel by train (or by other public transport means) and the optimal schedules to maximize the modal share of public transport towards this infrastructure.
The second path for research is that ICT data on travels’ intentions, such as the iRail dataset, offer information complementary to datasets on observed travel flows, that could lead to prospective transportation planning. Let us recall that the analyses conducted here rely on the date of the request, reducing the usability of the data to assess temporal variations of the travel demand. In the context of “smart cities” [
68], the dataset would benefit from the inclusion in a more robust way of the date and time of the requested journey. A surge of requests towards a given destination (e.g., the Belgian coast) may for instance be used by the SNCB as an indicator that the train’s offer should be increased at the time of the requested journeys (rather than relying solely on weather forecasts). Further work is however requested before being able to forecast trains’ frequentation in the future based on travel requests.


