Abstract
Understanding human movement patterns is of fundamental importance in transportation planning and management. We propose to examine complex public transit travel patterns over a large-scale transit network, which is challenging since it involves thousands of transit passengers and massive data from heterogeneous sources. Additionally, efficient representation and visualization of discovered travel patterns is difficult given a large number of transit trips. To address these challenges, this study leverages advanced machine learning methods to identify time-varying mobility patterns based on smart card data and other urban data. The proposed approach delivers a comprehensive solution to pre-process, analyze, and visualize complex public transit travel patterns. This approach first fuses smart card data with other urban data to reconstruct original transit trips. We use two machine learning methods, including a clustering algorithm to extract transit corridors to represent primary mobility connections between different regions and a graph-embedding algorithm to discover hierarchical mobility community structures. We also devise compact and effective multi-scale visualization forms to represent the discovered travel behavior dynamics. An interactive web-based mapping prototype is developed to integrate advanced machine learning methods with specific visualizations to characterize transit travel behavior patterns and to enable visual exploration of transit mobility patterns at different scales and resolutions over space and time. The proposed approach is evaluated using multi-source big transit data (e.g., smart card data, transit network data, and bus trajectory data) collected in Shenzhen City, China. Evaluation of our prototype demonstrates that the proposed visual analytics approach offers a scalable and effective solution for discovering meaningful travel patterns across large metropolitan areas.
1. Introduction
Monitoring human movement is of fundamental importance in transportation planning and management. To facilitate public transit planning and operational management, it is appealing to understand transit movement patterns across space and time [1]. Fortunately, recent advanced geospatial data collection technologies, such as global positioning systems, digital mapping, smart card automated fare payment systems, and wireless communication techniques, are generating a wealth of spatially and temporally varying transit data that create opportunities to discover meaningful and significant movement patterns over large metropolitan areas [2,3]. Various data mining methods have been developed to uncover transit travel behavior patterns on the basis of these heterogeneous geospatial datasets, including clustering for passenger segmentation [4,5], hazard modeling for loyalty analysis [6], trip chaining methods for destination estimation [7], and choice modeling for passenger activity analysis [8].
Over the past few years, many studies have been conducted to explore urban travel patterns using various modeling and analytical approaches based on massive human mobility data, such as optimization-based routing equilibrium models for congestion alleviation [9], clustering-based correlated analyses of mobility similarities and social relationships [10], low-level mobility pattern discovery [11], and multi-scale exploration of social fragmentation [12]. With the availability of massive human mobility data, machine learning techniques have been playing a more and more important role in gaining a deep understanding of human mobility behavior [13,14], ranging from movement pattern mining [15,16,17], mobility prediction [18,19,20], and movement mode classification [21], to lifestyle discovering and prediction [22].
Recently, many attempts to visualize massive human mobility data, including cell phone data [23,24], taxi movement data [25], and social media data [26] have been reported. Some systems have been developed to perform visual analytics on smart card data [27,28], aiming to discover salient travel patterns to improve public transit planning and management. These efforts mostly focus on novel visualization designs by aggregating individual trip information into compact visual forms. With these visualization tools, users can discover and analyze significant travel characteristics efficiently. Nevertheless, most of these methods focus on the visualization of simple and intuitive spatio-temporal movement patterns, such as place-based flow variations, inter-area flow maps, or accessibility maps. While transit planners and operational managers need to reveal complex movement patterns at different spatio-temporal scales, their intuitive tools are not adequate since they are based on simple statistical methods. This motivates us to investigate the possibility of applying machine learning techniques to identify high-level, complex transit movement patterns that support advanced transit planning and management.
It can be argued that visualization should be enhanced by advanced machine learning methods, given the overwhelming size and complexity of transit data. Over the past few years, researchers have developed visual analytics tools to support interactive exploration of spatio-temporal movement patterns using massive amounts of mobility data. Among these efforts, machine learning methods have been used for pattern discovery and analysis. For example, von Landesberger et al. [29] propose to integrate interactive spatio-temporal clustering and aggregated graph representations to discover abstracted urban movement patterns using social media and mobile phone data. We choose to discover public transit corridors and mobility communities using two state-of-the-art machine learning algorithms because they produce representative high-level, complex transit mobility patterns that are useful for transit and urban planning. Furthermore, we develop specific interactive visualization forms to facilitate the understanding of identified corridors and community structure. We argue that the combination of machine learning and geovisualization is beneficial for gaining a deep understanding of complex transit mobility patterns in large metropolitan areas. We propose to examine high-level, complex public transit travel patterns using visual analytics over large-scale transit networks, which is challenging since thousands of transit passengers and massive amounts of data from heterogeneous sources are involved. Moreover, efficient representation and visualization of discovered travel patterns is also a difficult task given large quantities of transit trips. To address these challenges, this study leverages advanced machine learning methods to identify time-varying mobility patterns based on multi-source transit big data. We also devise compact multi-scale visualization forms to represent the discovered travel behavior dynamics. A web-based prototype is developed to implement the proposed geovisual analytics approach within an integrated graphic interface, enabling in-depth analysis of multi-source massive transit data. We evaluate the prototype with realistic transit data collected in Shenzhen City, China. Our empirical usability study demonstrates that our approach can offer a scalable and effective solution for discovering meaningful travel patterns across large metropolitan areas.
In this study, we aim to identify spatially and temporally varying transit movement patterns based on massive transit data over a large public transit network. We make the following technical contributions:
- (1)
- We develop an integrated geovisual analytics approach that integrates two advanced machine learning methods with interactive maps to characterize two types of high-level, complex transit travel behavior patterns, including a clustering algorithm to identify transit corridors and a graph-embedding algorithm to identify hierarchical mobility community structure.
- (2)
- We design novel integrated geovisual analytics interfaces for the discovered complex transit movement patterns, including specific views to visualize identified mobility communities and corridors, allowing regular users to examine and understand these ever-changing patterns at different scales and perspectives.
2. Data
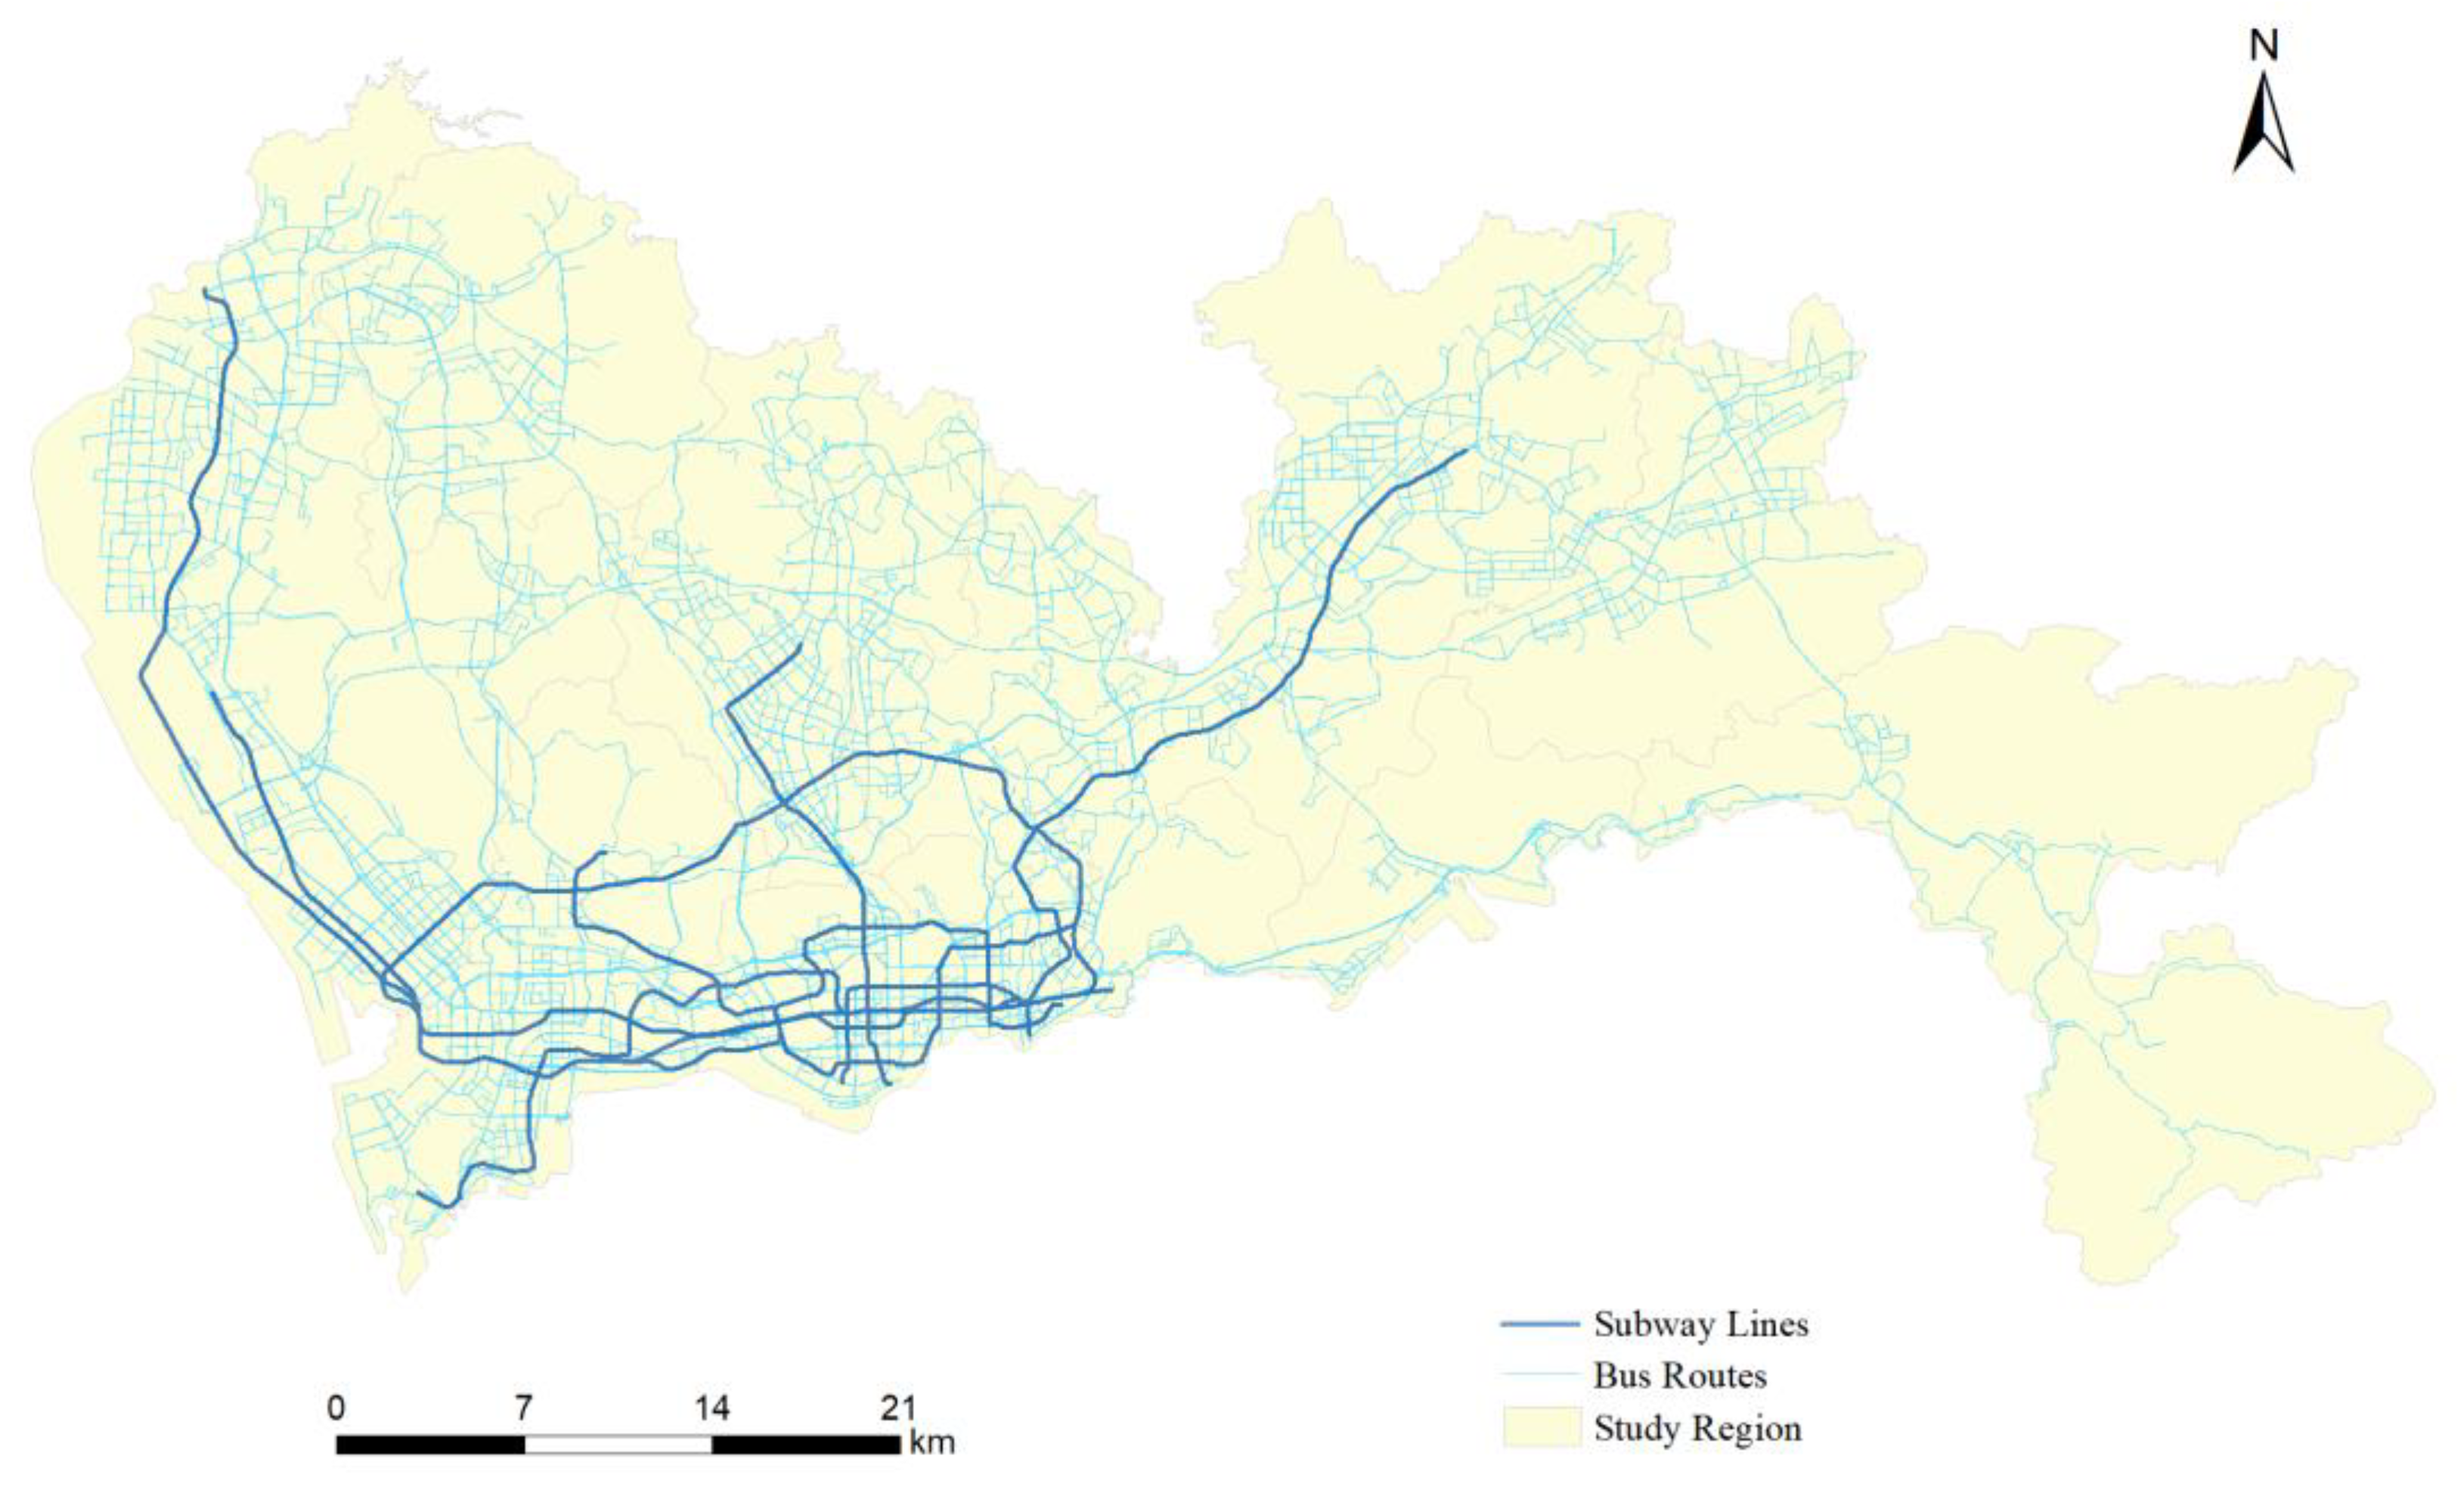
Being deployed on public transit vehicles, smart card automated fare payment systems provide an efficient way to collect large volumes of travel data at the individual level. The proposed approach utilizes smart card data (SCD) collected in Shenzhen City, China. Shenzhen City has a large bus and subway network consisting of 8 subway lines, 199 subway stations, 808 bus routes, and 6226 bus stops (Figure 1).
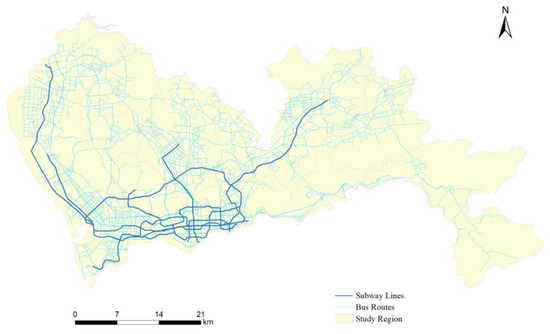
Figure 1.
The study region and public transit network.
We use a week of SCD starting from 3 to 9 April 2017. The SCD used in this study holds the names of boarding and alighting stations for each subway passenger. Bus passengers are not required to tap their smart cards when alighting. Therefore the information on alighting bus stops is not recorded. In addition to the SCD, we have access to bus trajectory data, public transit network, and road network data. These three datasets are registered into the same georeference framework, i.e., World Geodetic System 1984 (WGS 84) coordinate system and Universal Transverse Mercator coordinate system (UTM) Zone 50. The public transit network dataset contains the location, identification, and schedule information of all subway lines and bus routes. Based on GPS devices installed on each bus, we can obtain bus trajectory data such as longitude and latitude, speed, and travel direction at approximate 20–60 second intervals. In addition, bus identification information including license plate numbers, number of transit lines, and company names are all saved. With more than 6 million records collected for each day, the size of the SCD set for the week amounts to 6.5 GB. Each day, the bus trajectory dataset has approximately 63–73 million GPS records.
3. Methodology
3.1. Methodology Overview
Public transit systems contain multiple components: bus stops, subway stations, bus and subway lines, bus and subway vehicles, and passengers. Most existing literature focuses on the analytics of transit lines/stops [30], schedules [31], or aggregated transit trips [32,33]. Some have explored the relationships between transit trips and points of interest [28] but have not leveraged advanced machine learning methods to analyze complex travel patterns and global mobility structures. Given a large amount of trip data, one may wish to identify significant spatio-temporal travel patterns, reveal global mobility structures, and visualize them on interactive maps. For example, questions can be raised to find interconnected road segments that contain significant transit travel demand patterns at a global scale or to delineate areas with similar transit travel characteristics. What specific spatio-temporal patterns can be discovered from these road segments and areas, and how do these patterns evolve over time? Can we jointly examine transit travel patterns from different aspects of public transit services in an integrated interactive user interface?
To answer these questions, we can define geovisual analytics tasks as follows:
- (1)
- Global pattern discovery task 1: discover hierarchical mobility structure based on transit trip data and analyze their inter-correlations;
- (2)
- Global pattern discovery task 2: identify significant transit corridors for any specified time intervals;
- (3)
- Local pattern exploration task 1: explore the intrinsic information of identified individual transit corridors;
- (4)
- Local pattern exploration task 2: examine the temporal evolution of the discovered mobility community structure;
- (5)
- Comprehensive analysis task: design and implement linked or integrated views to visually analyze different components of public transit services (including corridors, community structures, and stops) and discovered travel patterns.
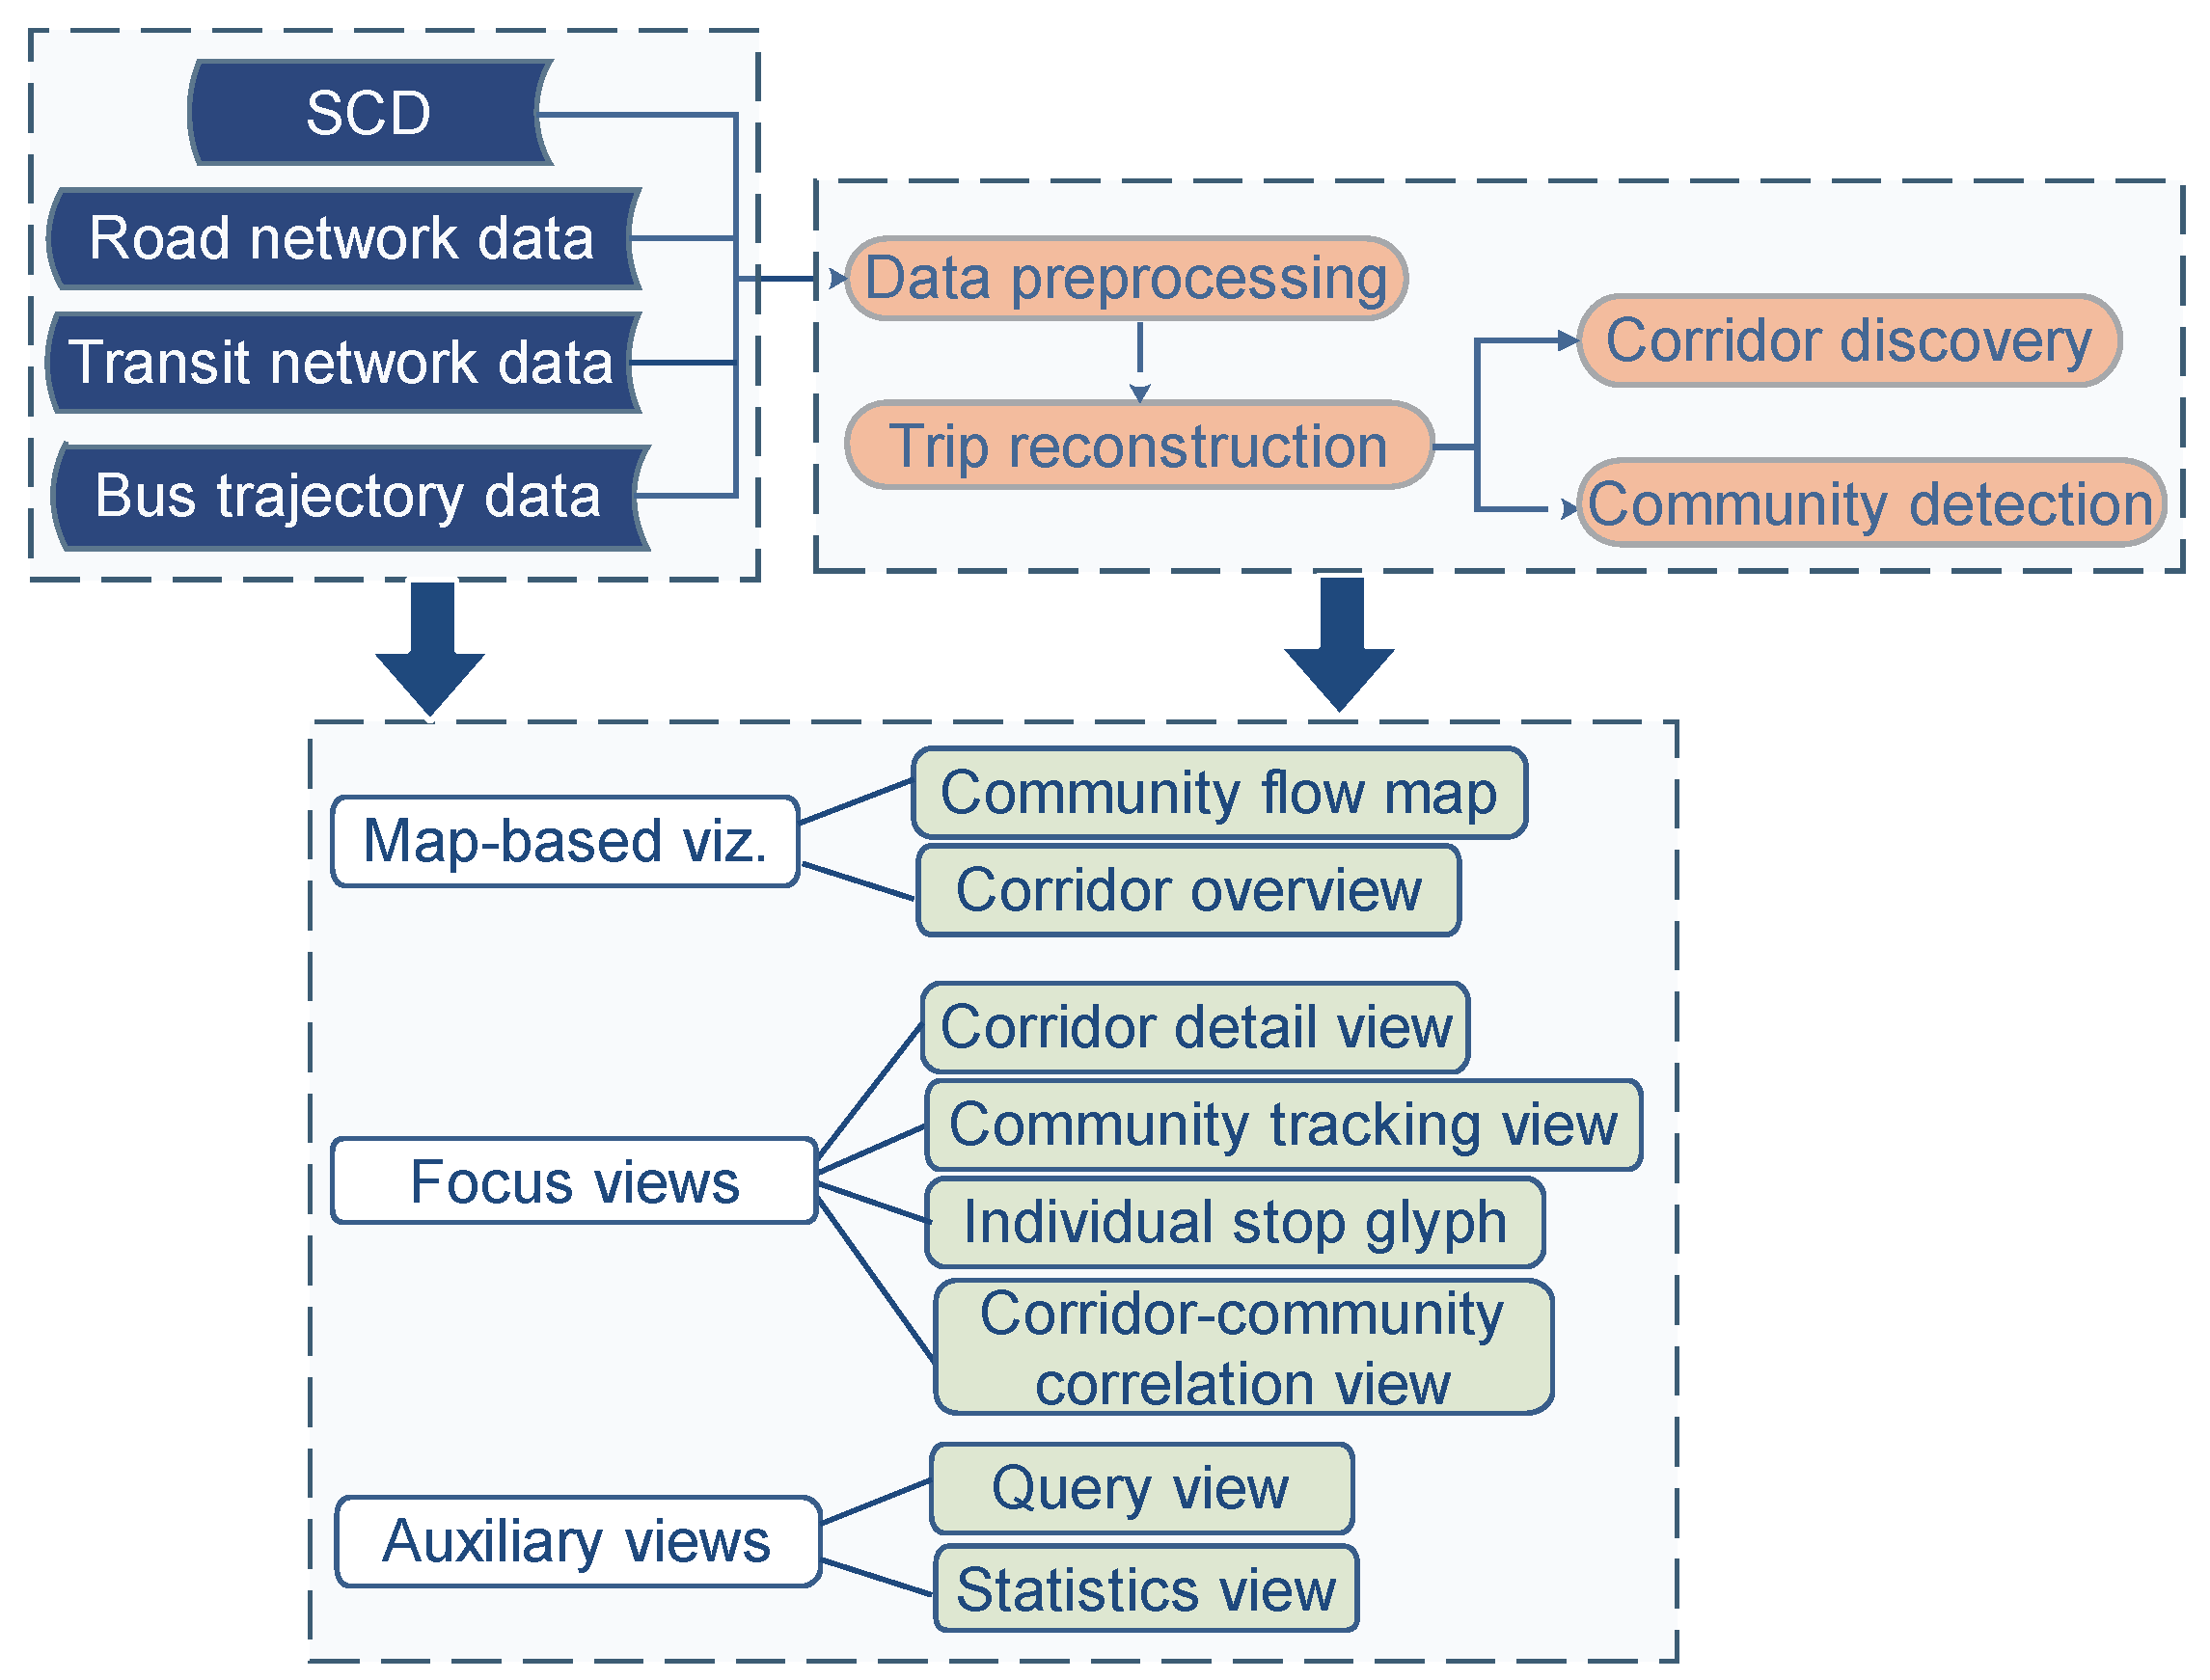
The proposed approach delivers a comprehensive solution to pre-process, analyze, and visualize complex public transit travel patterns (Figure 2). This approach first fuses SCD with other urban data to reconstruct transit trips. It then segments the study region into hierarchical areal units (i.e., public transit mobility community) according to mobility features of trips and static local features using graph embedding. Based on recovered public transit trip data, we develop a clustering-based algorithm for extracting transit corridors to represent mobility interactions between different regions. Based on detected corridors and mobility communities, we develop various visualization forms to represent these transit movement patterns on maps and other views. An interactive web-based mapping prototype is also developed to enable the visual exploration of mobility structures over space and time. Specific visualization forms are designed and implemented in the web-based prototype to facilitate the analysis of massive transit data, including map-based visualization, focus views, and auxiliary views, which will be detailed in Section 3.5. The discovered mobility community structure and transit corridors can be visualized on interactive maps. The focus views consist of four types of visualization: (1) a corridor detail view that shows detailed trip information based on a simplified schematic map for each selected corridor; (2) a community tracking view that presents evolving changes of specific communities across time; (3) a stop glyph plotting the statistical information of all trips that originate, end, or pass a specific bus stop or subway station; and (4) a corridor–community correlation view illustrating the spatio-temporal correlations between transit corridors and mobility communities using parallel coordinate plots.
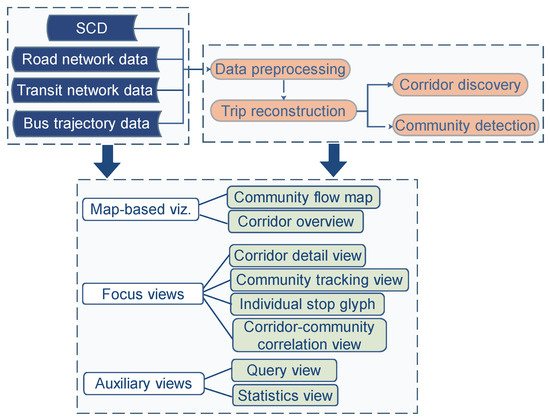
Figure 2.
Overview of the proposed geovisual analytic approach. SCD—smart card data.
The trip reconstruction and corridor discovery methods have been described in a separate paper [34]. Below, we briefly introduce the two methods. Implementation details are reported in Section 4.
3.2. Data Pre-Processing and Trip Reconstruction
Following the procedure developed in Zhang et al. [34], we performed data pre-processing for the original datasets and reconstructed transit trips, which were used in subsequent geovisual analytics tasks. For a passenger, a public transit trip consists of multiple consecutively linked trip legs with a specific travel purpose [35]. Our visual analytics approach is based on trips rather than trip legs because trips are better at revealing realistic travel demands and behavior patterns. In this subsection, we briefly describe the data pre-processing and trip reconstruction steps.
After removing erroneous SCD and bus trajectory records, we corrected inconsistent stops names and locations between heterogeneous datasets based on the method developed by [36]. All of the datasets were imported into Microsoft SQL Server databases in which spatial indices were constructed based on transit network data to accelerate data query and trip reconstruction. The original SCD was divided into subway-based and bus-based datasets by each date since subway-based records have full boarding and alighting information and an alighting stop estimation procedure was expected for bus-based SCD.
First, we needed to estimate boarding and alighting stops for bus-based trip legs. For each bus-based SCD record, the boarding stop can be identified by matching the license plate number from the SCD and the bus trajectory dataset to find GPS sampling points that are close to boarding time, which were matched to the transit network to find the most probable boarding stop. Then, we proceeded to estimate alighting stops: (1) alighting stops can be easily derived by searching for the closest stop to the next boarding stop if a passenger makes another boarding during the same day; (2) if the current trip leg is the final one of the day, the first boarding stop of the next day is used to estimate the possible alighting stop of this last trip leg; (3) otherwise, we can search other dates or other similar passengers to make estimations. Upon the availability of both boarding and alighting stops, complete bus trip legs could be recovered. These bus trip legs were then connected with subway legs to reconstruct a complete trip if these trip legs taken by the same individuals were within the 30 min threshold.
3.3. Extracting Transit Corridors
The concept of “transit corridors” has been widely adopted and put into real-world planning and management practices [37]. We define a corridor as a directional linear road segment consisting of multiple transit stops with significant numbers of passengers. Note that corridors may contain multiple branches and may overlap with other corridors. Based on massive transit trip data, time-varying transit corridors can be extracted to represent the most significant travel demand patterns across space and time. The corridor-extracting algorithm is developed on the basis of public transit trips, each of which is characterized by one single travel purpose. Each trip may consist of multiple legs, and each leg corresponds to one smart card transaction. We proposed a share-flow clustering algorithm [34]. The algorithm was based on the concept of “accumulated transit flow”, which calculates the number of stops each passenger passes after boarding. If two stops have a large shared “accumulated transit flow”, then the downstream stop is “directly transit-flow accessible” from its preceding adjacent stop. Starting from stops with a large amount of “accumulated transit flow”, the algorithm iteratively evaluates adjacent stops along the travel direction. If this next stop is directly transit-flow accessible from the current stop, the road segment between the current and the next stop will be linked to the current corridor. After the initial growth of corridors, a pruning and merging process is performed to remove short and non-significant corridor candidates. By this clustering algorithm, linear corridors can be discovered dynamically for any specific time interval. The algorithm can be described in the following steps:
- (1)
- Network modeling. The public transit network can be modeled as a directed graph and is mapped to the road network G (V, E), where V denotes the sets of road intersections Vr and transit stops Vt (Vt have been projected into road links), E denotes road segments between road intersections and transit stops. We extract a small set of connected segments Ec whose end nodes have a large shared “accumulated transit flow” and identify them as transit corridors.
- (2)
- Computing accumulated transit flow. For each node v in Vt, the number of passengers who board at v or before it is recorded as nv. For each passenger, the number of stops she has passed after boarding is recorded until she exits from the vehicle. Then for each v, this number is used as the “accumulated transit flow” at(v).
- (3)
- Corridor initialization. We choose nodes with a significant number of accumulated transit flows as seeds to grow corridors.
- (4)
- Corridor expansion. The seed nodes are stacked into a priority queue, ranked by its accumulated transit flow. The one with highest at(v) is popped out and used as the initial seed s0 to expand a corridor. From s0, the algorithm searches for one adjacent stop, s1, that meets the criterion of significant “shared accumulated transit flow” between s0 and s1. “Shared accumulated transit flow” is defined as sa(0→1) = [at(1)− at(0)] /at(0), i.e., the change ratio of accumulated transit flow for the two adjacent stops/nodes. Meanwhile, the two nodes must meet another criterion, namely, “shared transit flow”, which is defined as st(0→1) = n0⋂n1. If the two nodes meet both criteria, the algorithm expands a corridor from node 0 to 1. This procedure repeats until no downstream nodes meet the two criteria. Then another seed in the queue is fetched to grow another corridor, until all seeds are popped.
- (5)
- Corridor pruning. We need to prune short corridors (with less than 4 stops) or non-significant corridors (transit flows are less than a pre-defined threshold).
- (6)
- Corridor merging. This final step is to merge corridors if they are already connected or overlapped.
Usually, the algorithm can extract 5–10 transit corridors for peak hours and non-peak hours during weekdays and weekends based on the trip data we have produced.
3.4. Discovering Mobility Communities
It is desirable to represent high-level urban mobility structures with multi-scale communities when dealing with overwhelming amounts of mobility data [38]. Each mobility community is featured with similar travel characteristics. The representation of a hierarchical community structure can significantly facilitate the understanding of inter-area interconnections in a city. Traditionally, the construction of community structure uses community detection algorithms developed in network science [39]. These community detection algorithms first build a graph to represent connections between nodes and then employ clustering, optimization, or statistical inference methods to divide the entire graph into groups, ensuring nodes within each group are more densely connected than external nodes [40]. However, public transit passengers usually travel long distances away from their origins, and these mobility behaviors must be accounted for when extracting transit mobility structure. This study proposes a different community definition that considers not only local trip statistics but also trip destinations and other dynamic travel characteristics such as travel frequency and transferring patterns. All of this information can be readily computed from trip data.
Instead of denoting each subway station or bus stop by a graph node, we use region partitions with similar possible boarding stations nearby. We first partition the study region into regular grid cells, each of which has a size of 100 m × 100 m. We remove grid cells located in mountainous and water areas (inaccessible by transit services). Then a vector for each cell is built to record possible boarding stations (stops) that are close to them. Finally, a heuristic algorithm is employed to merge neighboring cells with the most similar vectors. After the merging of original grid cells, we obtain 18,109 grid groups, most of which consist of 2–7 original grid cells. These grid groups are then denoted as graph nodes, whose number is much smaller than original transit stops, thereby dramatically reducing computational expenses in community detection.
Traditional community detection algorithms cannot handle our problem and are not scalable to a large public transit network. In order to handle such complex trip behavior features, we use a graph-embedding method to uncover a dynamic community from realistic SCD. Graph embedding aims to produce a compact vector representation for each node and preserves graph structure within a low dimensional space [41].
We define a directed weighted graph Gt(V, E) for a time interval t. V is the set of grid groups, and E represents transit connection edges between nodes in V. Each edge e is weighted by realistic traffic flow between its origin node and ending node during t. Based on these weights, we can construct a traffic flow matrix F, where fi→j denotes the number of transit passengers travelling from node i to j. We also construct an adjacency matrix A to describe local connectivity between graph nodes. The matrix A can be used to represent first-order transit connectivity proximity. The global network structure can be preserved via a high-order proximity based on traffic flow matrix F. The high-order proximity is defined as the similarity between traffic connectivity structures of a pair of nodes.
Since transit travel behaviors are largely non-linear and non-stationary, we leverage deep learning methods to learn network embedding. A classical auto-encoder framework (structure deep network embedding, SDNE) is adopted to learn latent network representations [42]. The auto-encoder framework consists of an encoder and a decoder. The encoder contains multiple layers, each of which can be defined as
where denotes the hidden representation for the ith layer and is the original input data X, which is a n-dimensional vector. and are learnable parameters. is the non-linear activation function.
If we use K layers in the encoder, the input vector would be mapped into a hidden representation Correspondingly, the decoder transforms back to a reconstructed vector Y after performing K layers of nonlinear transformation operations,
where denotes the reconstructed data vector for the jth layer andand are learnable parameters. Note that = , Y = .
The model parameters can be learned by minimizing the reconstruction error between the reconstructed vector Y and the input vector X:
If multiple transit features are used as the input vector to the encoder (including flow, speed, destination, and travel frequency), we obtain L1. If the adjacency matrix A is used as the input, we can build
which preserves the high-order proximity of G.
The two reconstruction error functions can be linearly combined into a comprehensive joint loss function:
Lall = L1 + αL2.
The model is randomly initialized and optimized with a stochastic gradient descent. After model convergence, we can obtain the final embedding representation for all nodes in G. Based on learned compact node representations, we can use hierarchical clustering to generate hierarchical mobility communities.
3.5. Visual Analytics Design
In the literature, public transportation visualization studies mostly focus on public transit networks and represent travel statistics based on stops and routes. We propose to examine and evaluate public transit services from different perspectives, namely, hierarchical mobility communities and significant transit corridors, in addition to the public transit network. Several visual designs are proposed to facilitate this comprehensive visual analytics strategy.
Our visualization design consists of three types of views (Figure 2): (1) Map-based visualization that uses interactive maps to depict extracted mobility communities and inter-community transit flow. Detected corridors are also illustrated in the map view. (2) Focus view is designed to present detailed information on user-selected corridors, transit mobility communities, and individual transit stops. Correlations between corridors and communities can also be visualized. (3) Other auxiliary views, including a query view and a statistics view. The query view enables interactive data selection for visual analytics for any time interval. The statistics view uses statistical diagrams to present summary information on corridors.
3.5.1. Mobility Communities
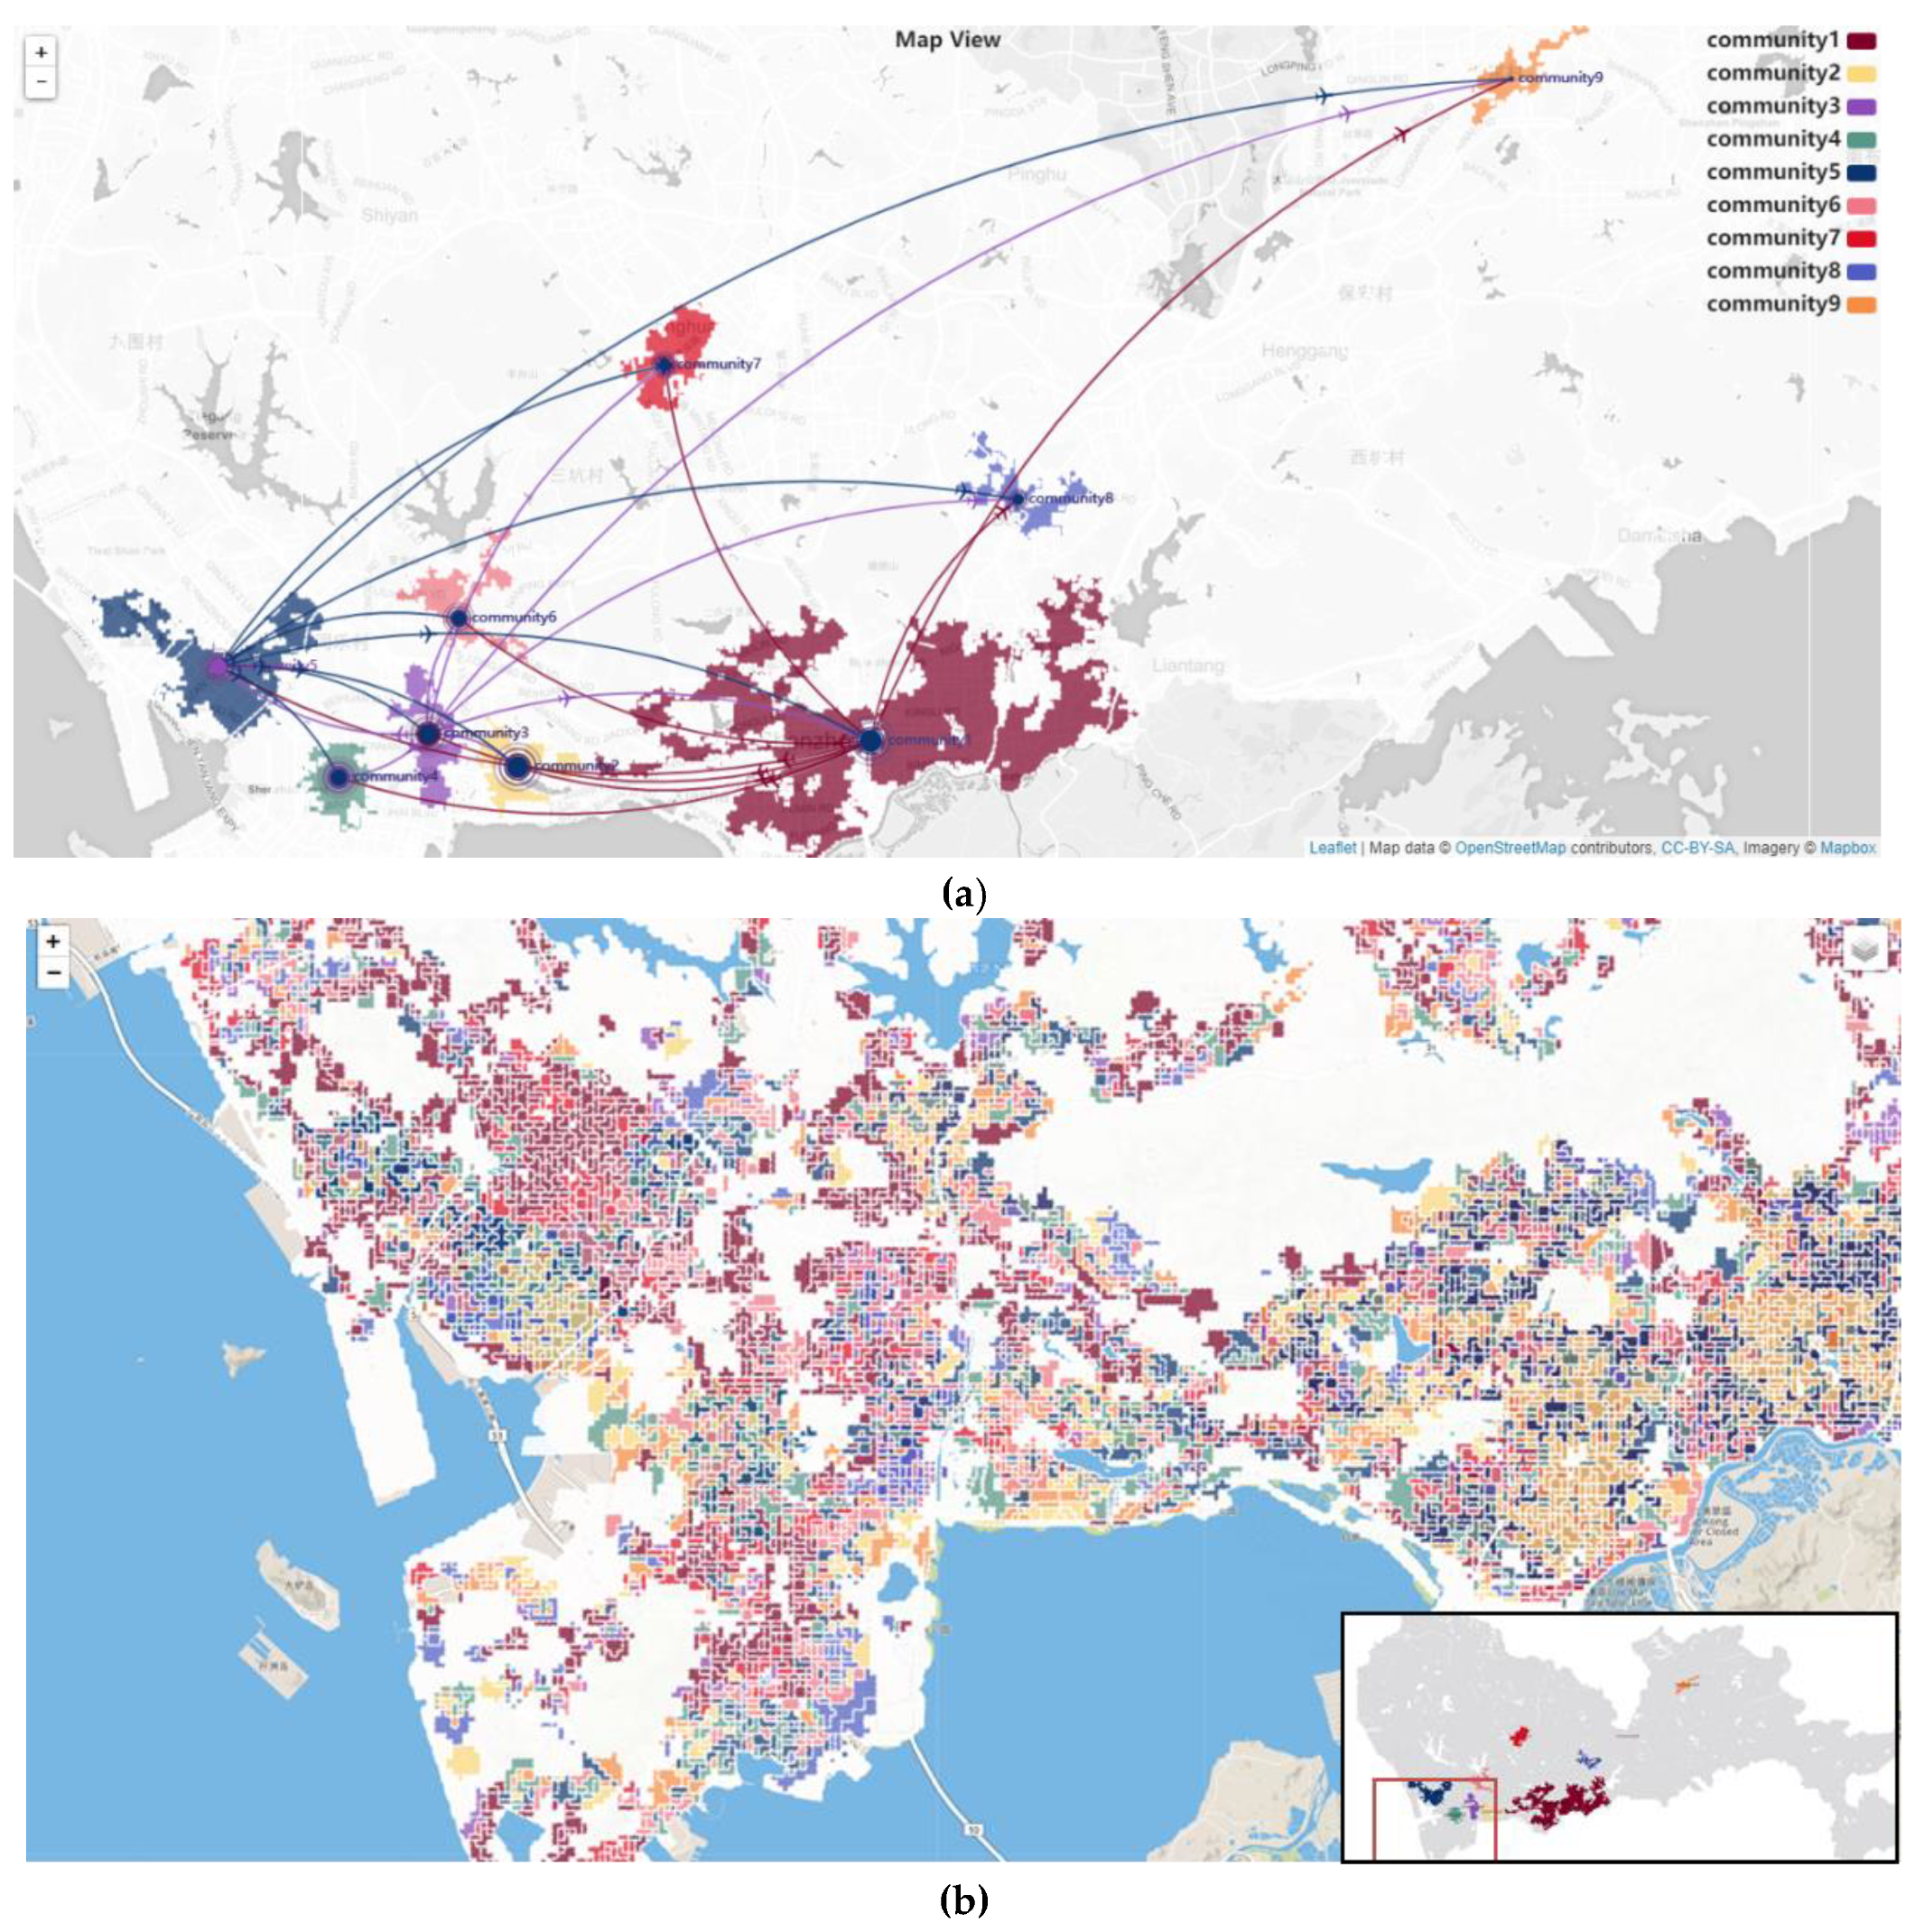
Based on realistic SCD, we can extract two-level mobility community structures over Shenzhen City. After performing graph embedding for g grid groups, we can perform hierarchical clustering based on these grid groups to produce two levels of mobility communities (see Section 4 for implementation details). Low-level communities are only based on the distances between embedded vectors. Based on low-level communities, we can further produce high-level communities by accounting for spatial contiguity and cohesiveness using regionalization methods. Figure 3a illustrates a high-level mobility community structure for April 3 (a holiday). Transit flows between these high-level communities are mapped to depict an overview of aggregated transit flows across the study region. High-level community structure is favored for global travel pattern discovery and analysis. When zooming in to the low-level, detailed community structures are visualized with different colors representing different cluster types (Figure 3b). With interactive community maps presented in figures, users can perform global pattern discovery task 1 to identify the hierarchical mobility community structure and visualize inter-community interactions conveniently.
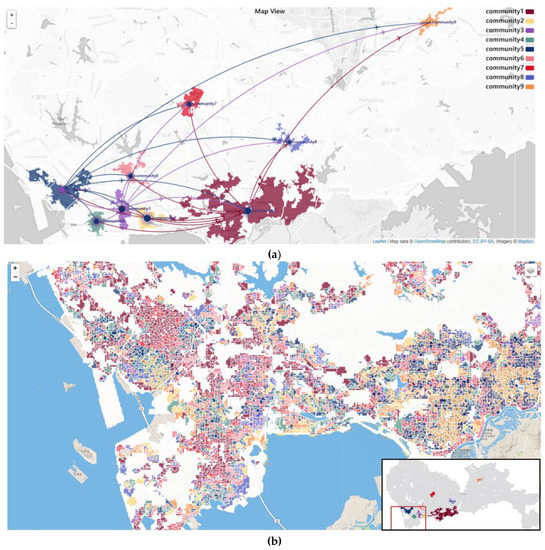
Figure 3.
Transit-based mobility community structure on a holiday. (a) High-level community flow map; (b) low-level community clusters.
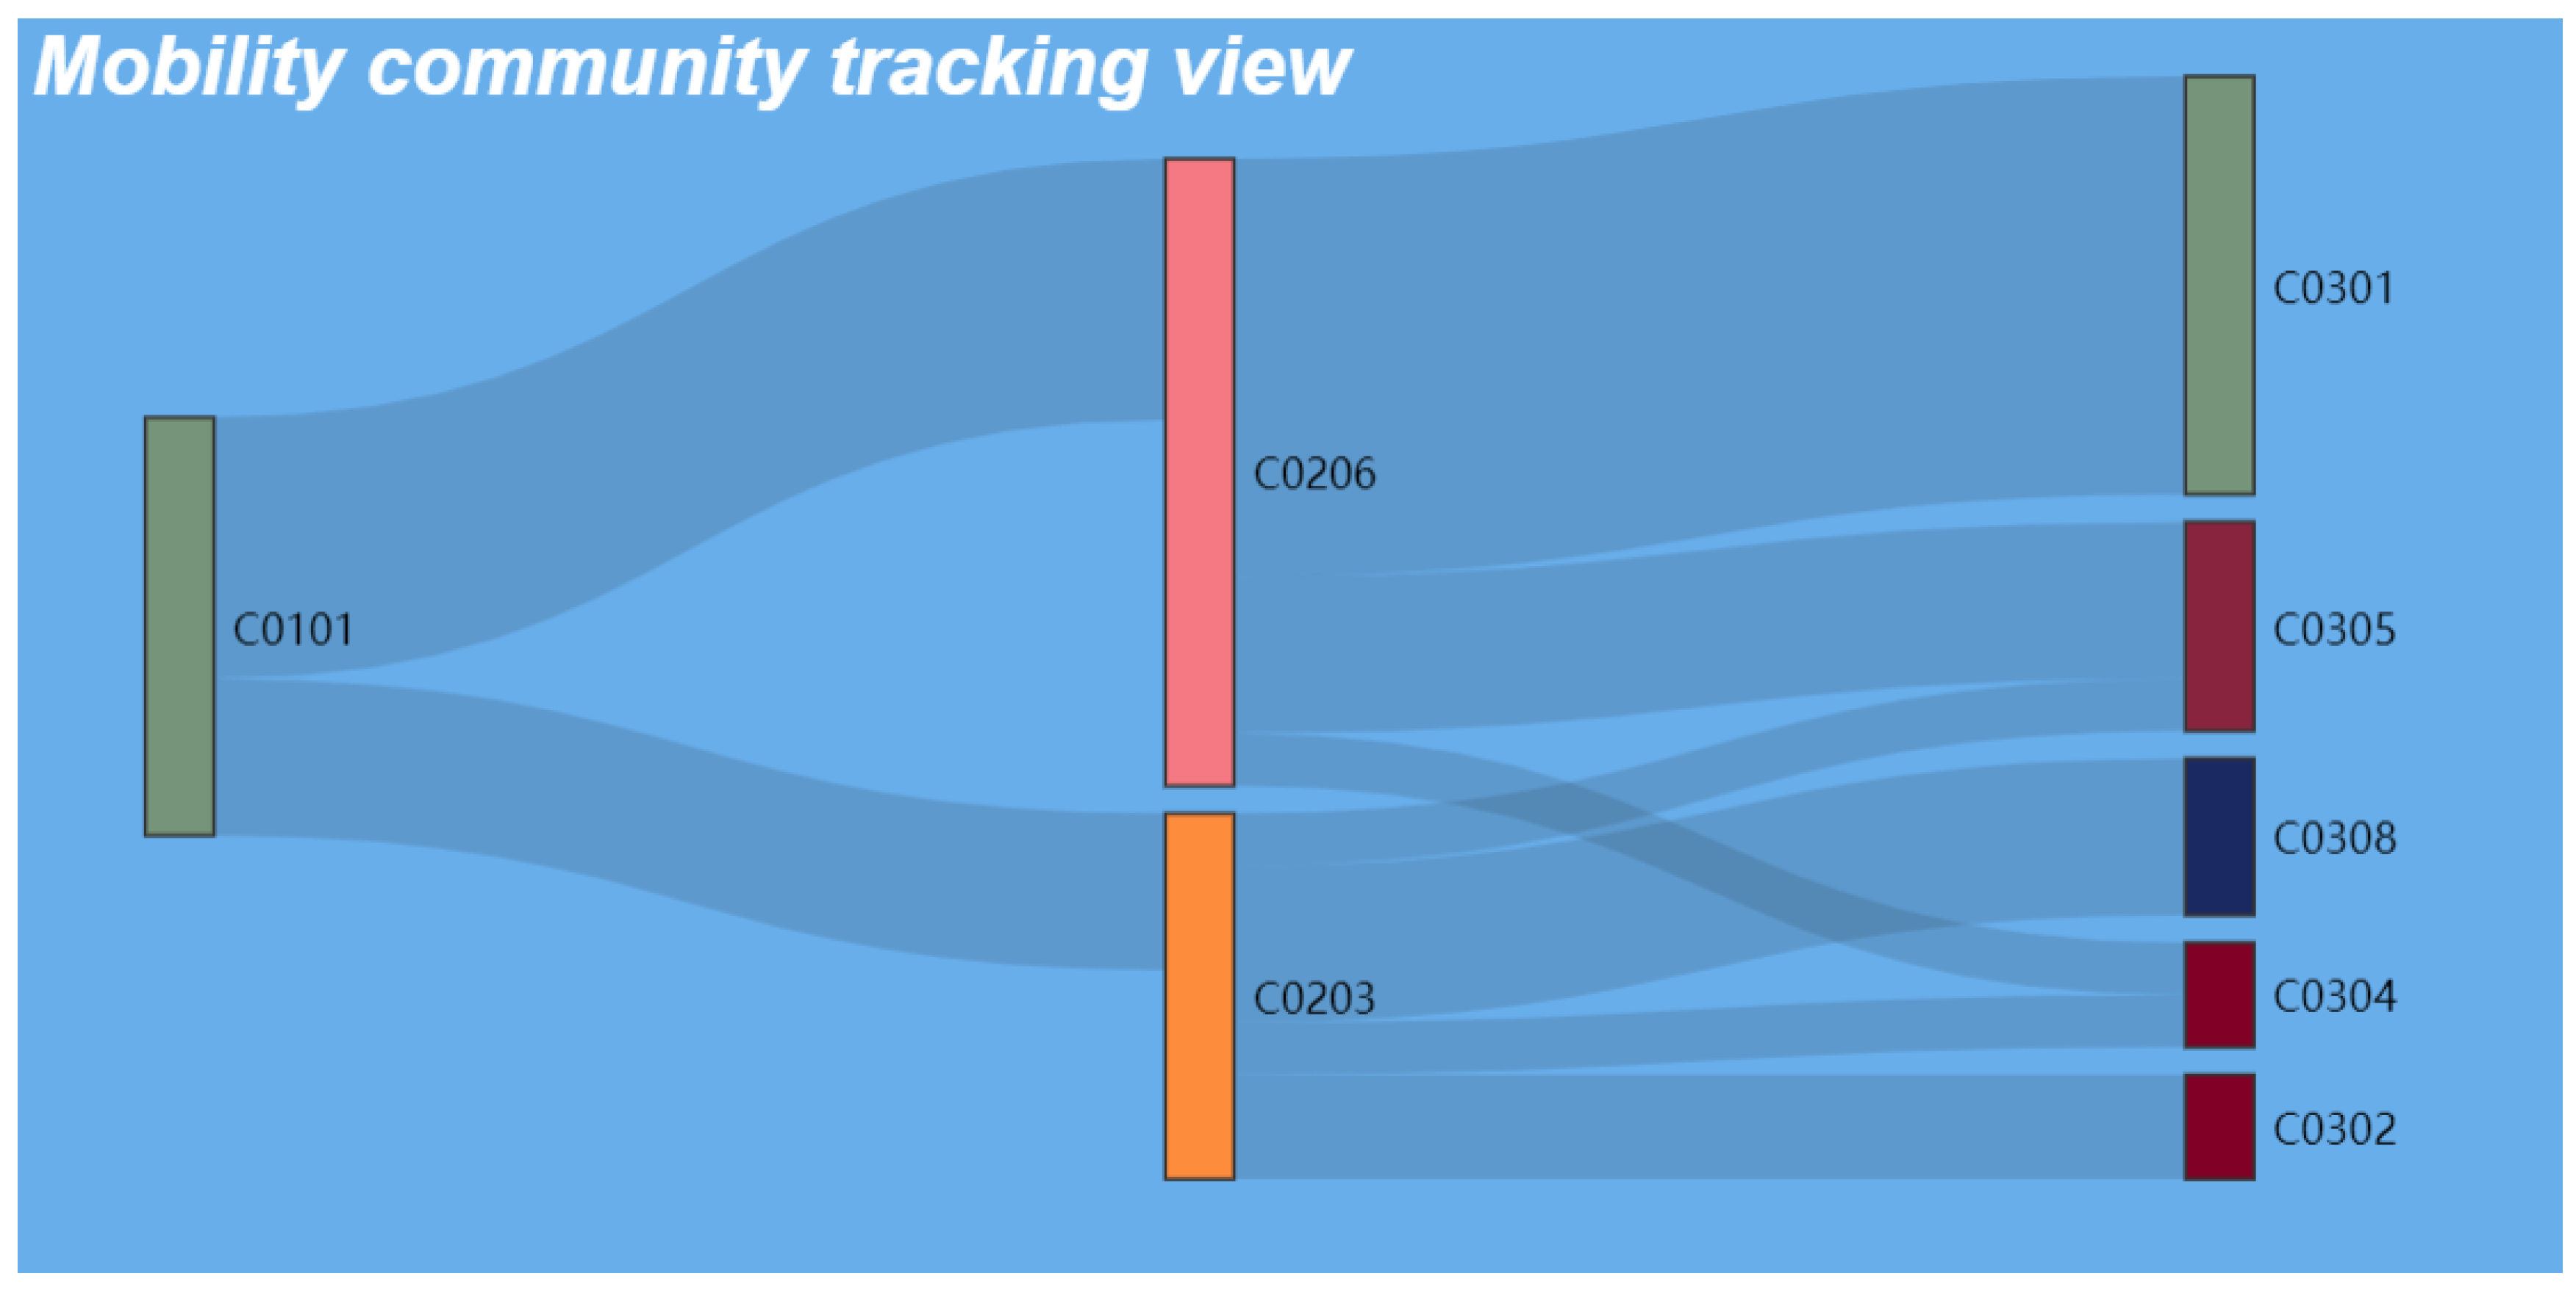
In the mobility community tracking view, one can select (from the map) one specific mobility community and track the temporal changes in its shape and flows between itself and other nearby communities (Figure 4). As the detected community structures evolve over time, a community may undergo different changes, including splitting into separate communities or merging with other communities. Each community is represented by a vertical bar, the height of which is proportional to the number of transit trips of the community. Ribbons connecting bars between different times represent transit flows between communities. Wide (narrow) ribbons indicate high (low) volumes of transit trips. The vertical positions of the bottom of bars also indicate the topological relations of communities from adjacent dates. Bars that are far away from each other correspond to communities that are also distant on the map. As we fix the position of the original selected bar, the overlapping relations can also be revealed by their relative vertical positions between two bars from adjacent dates. As community structure undergoes constant changes, users can conduct local pattern exploration task 2 to track the evolving trend of any chosen communities and gain a deep understanding of the mobility structure of the study region.
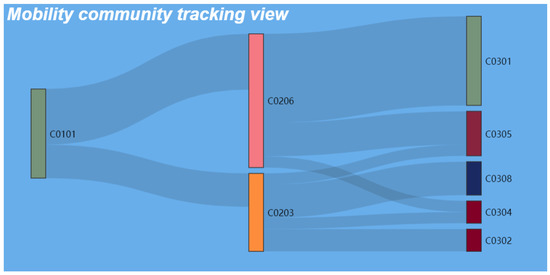
Figure 4.
Mobility community tracking view. We can observe that the selected community “C0101” (indicating a detected community on April 1) has a significant number of transit trips connecting it and two communities on April 2 (“C0206” and “C0203”). These two are further connected with five communities (C0301, C0302, C0304, C0305, and C0308) on April 3. We can see that “C0101” is strongly connected with “C0206” and “C0301”, as indicated by the width of ribbons between these communities.
3.5.2. Corridors
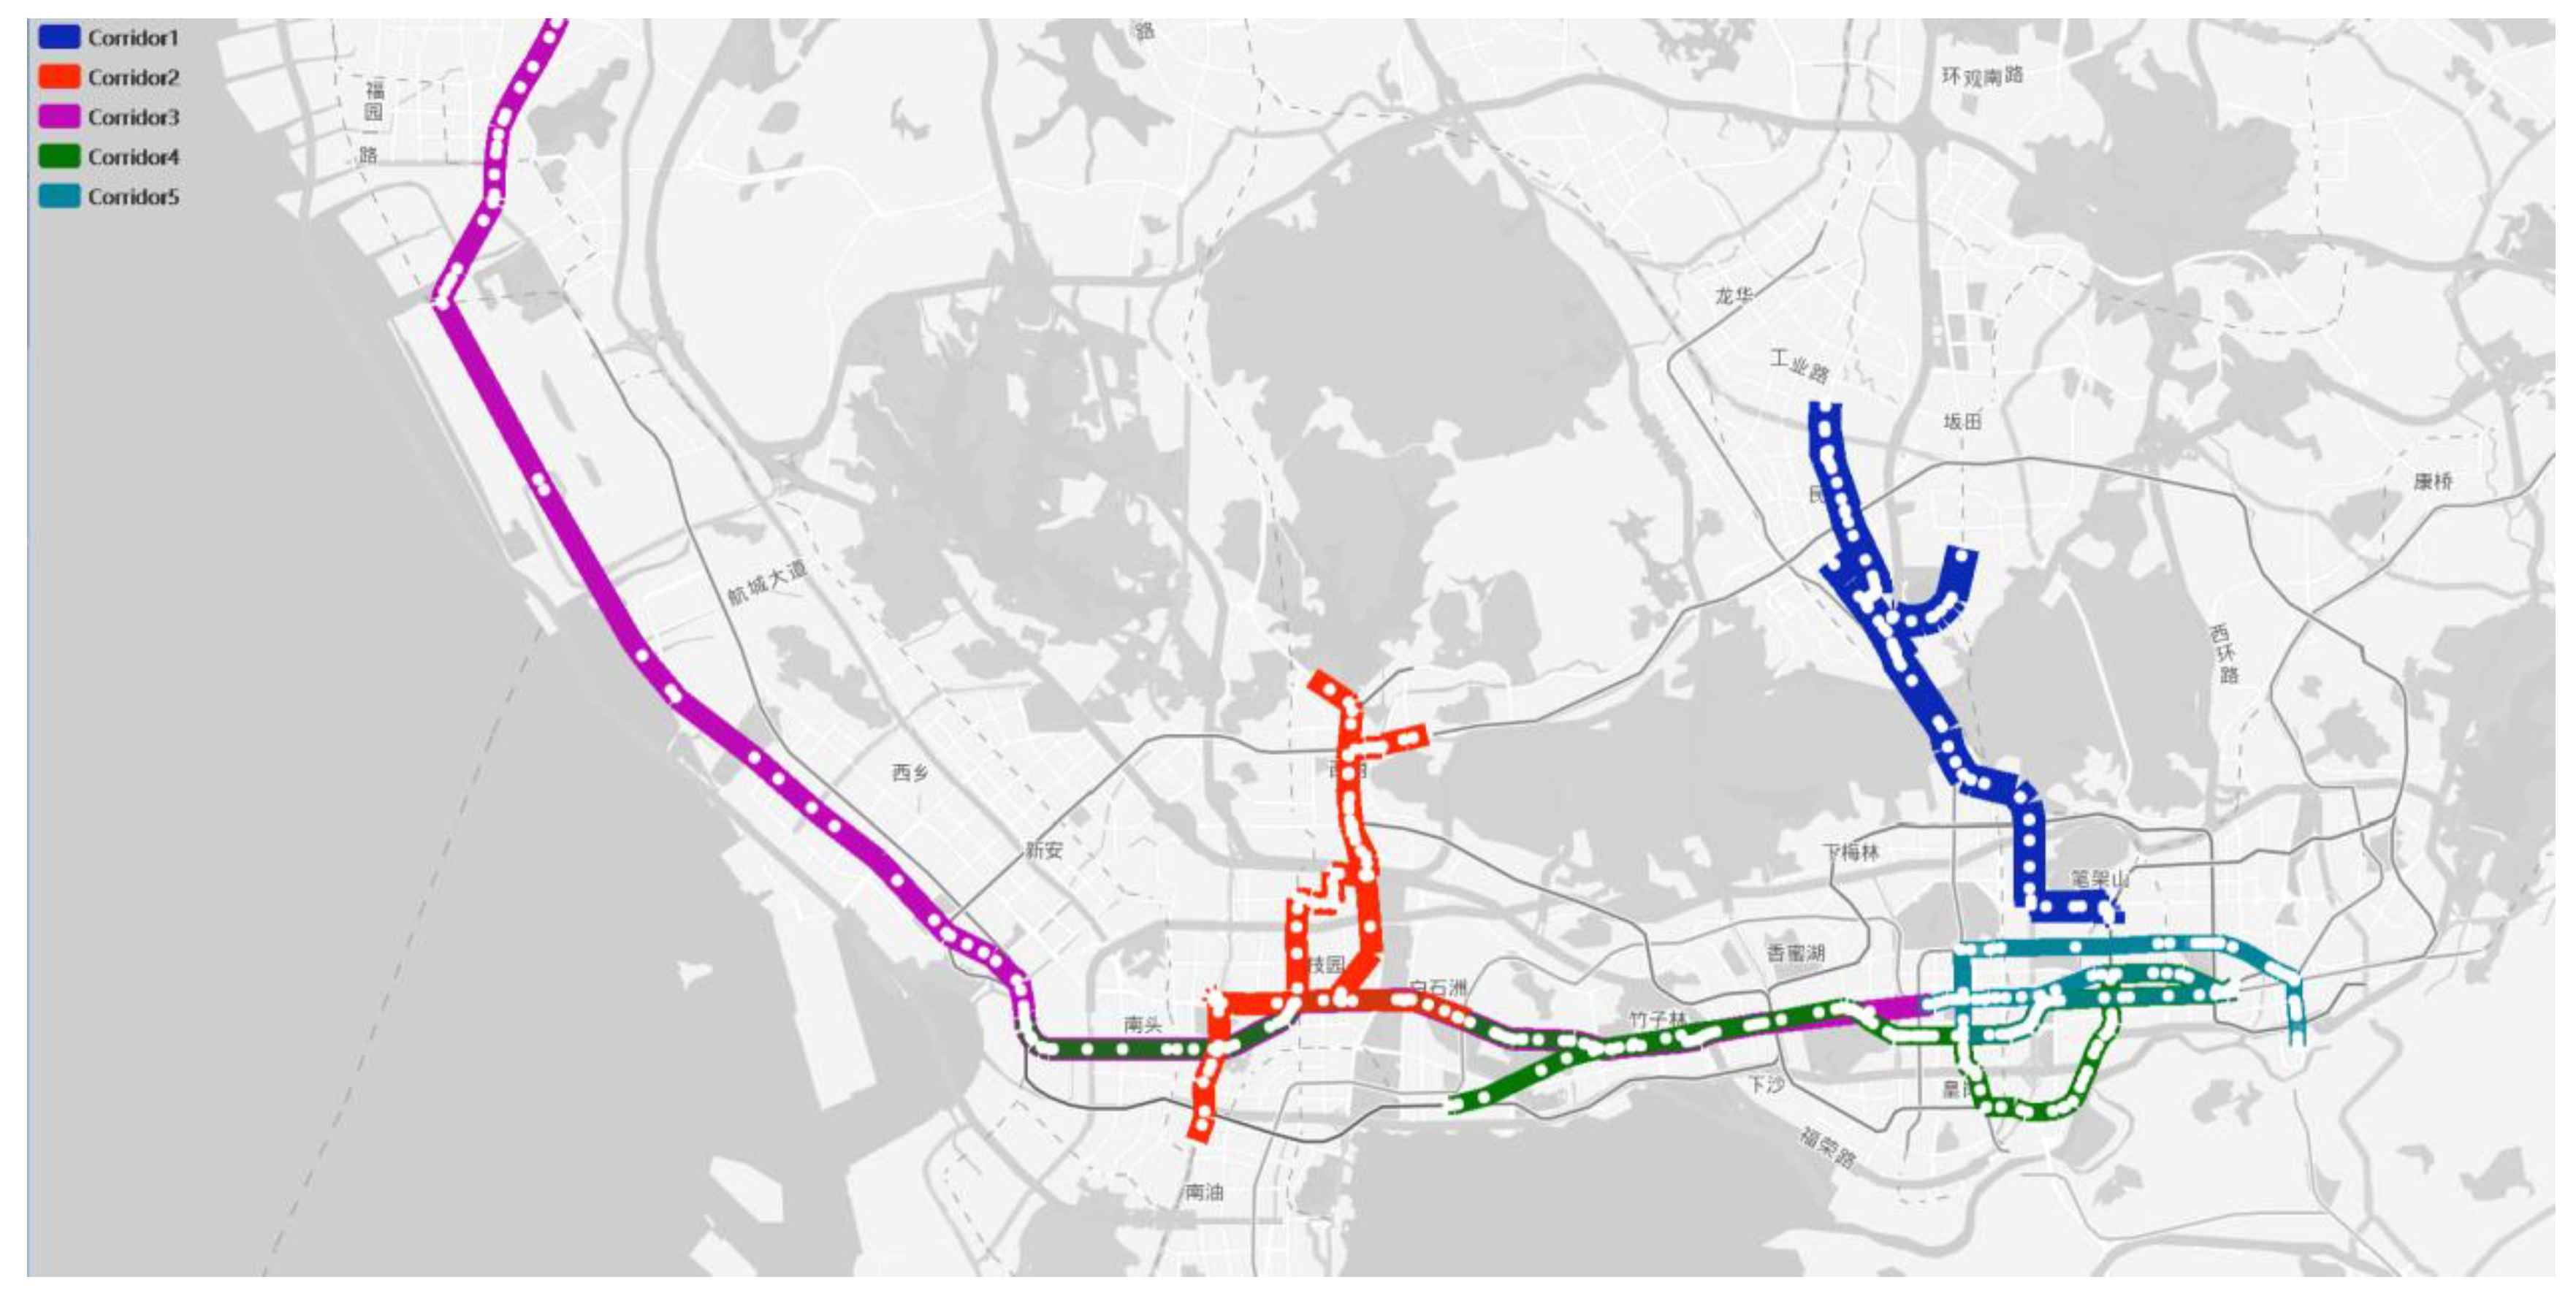
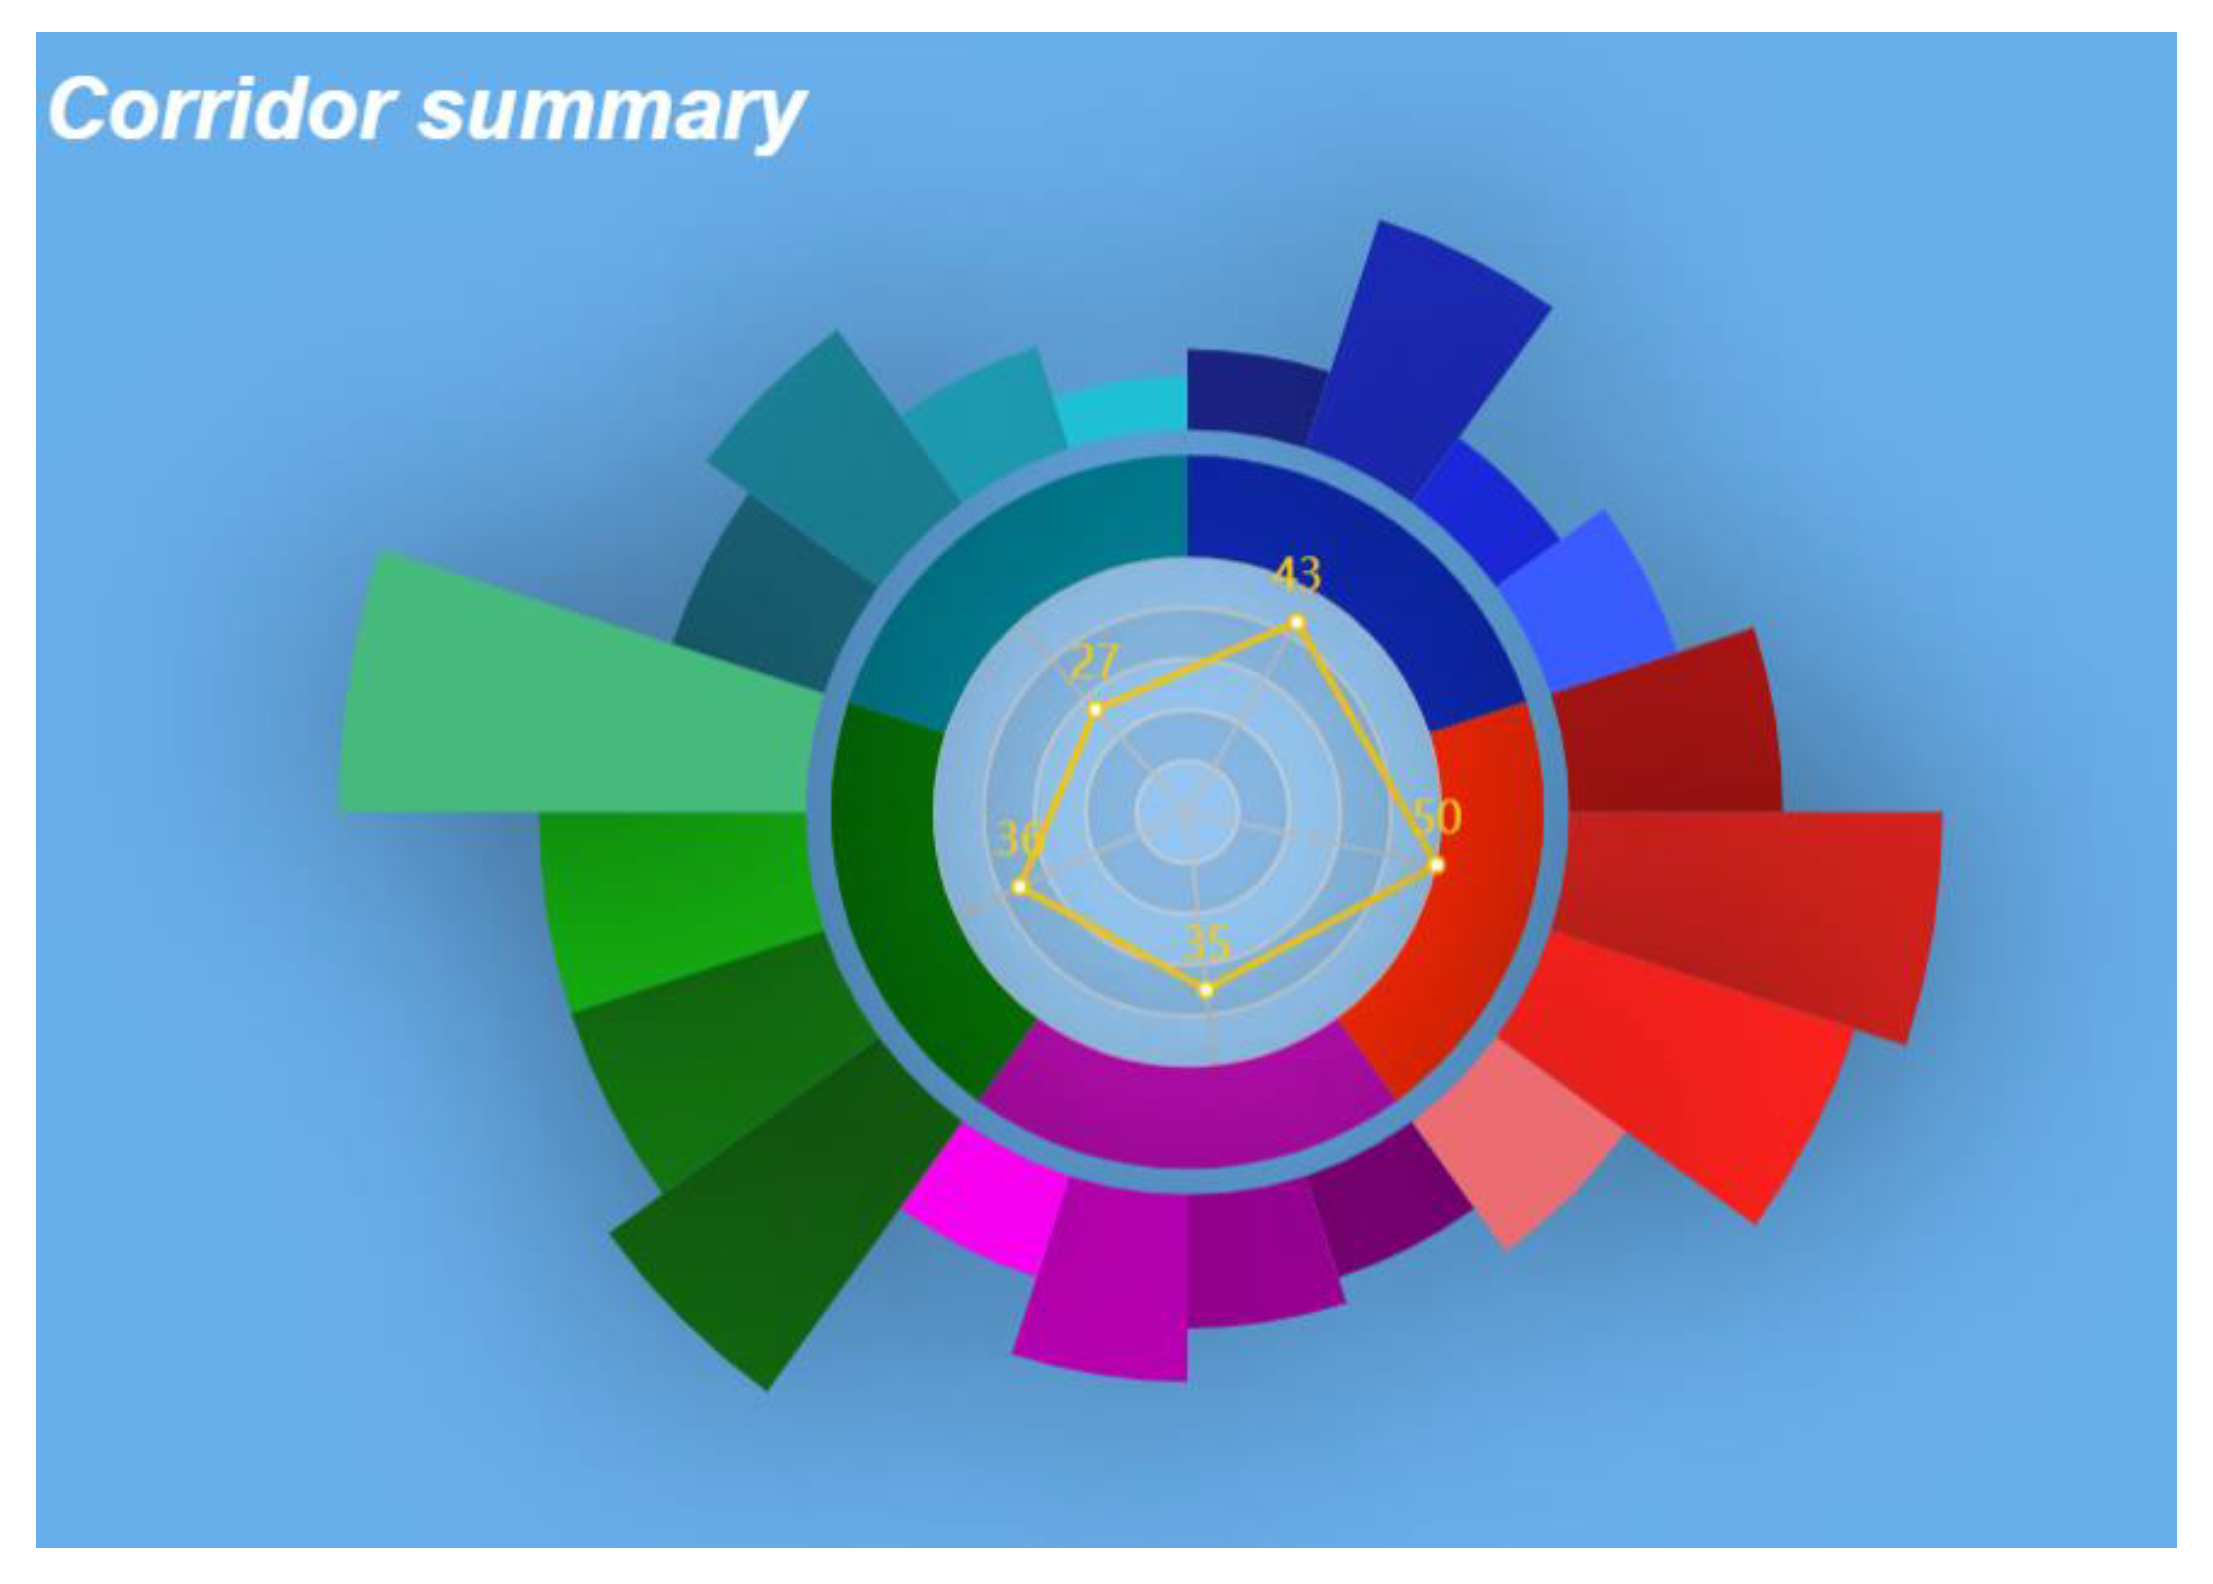
Figure 5 shows five discovered corridors on weekdays on the map. The width of corridors represents the size of transit flows. The flow direction is shown by animated particles [43]. A dedicated summary glyph in the statistics view is also designed to present a compact summary of all corridors in a radial layout, in which each segment corresponds to a corridor (Figure 6). For each corridor, the number of boardings and alightings within a corridor are divided into four categories: only trip origins fall within the corridor (destinations are outside); only trip destinations are located within the corridors (origins are not); both origins and destinations are within the corridors; and both origins/destinations are outside the corridor. Four bars are used to represent these four types of trips. Bar heights are proportional to the trip counts. The overall performance of the corridors is also represented by a line of dots in the inner circle. The performance is computed as the ratio (percentage) of on-vehicle time versus overall travel time of a transit trip. Dots close to the circle center indicate low performance. Based on this corridor overview map, users can perform global pattern discovery task 2 and examine the distribution of primary transit corridors.
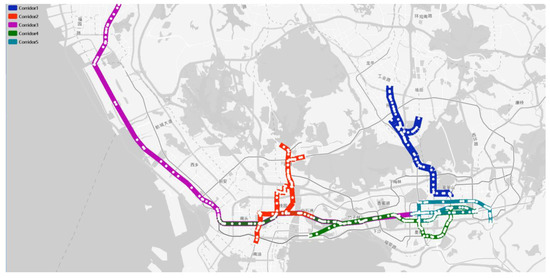
Figure 5.
Public transit corridors for weekday peak hours (8:00AM–10:00AM).
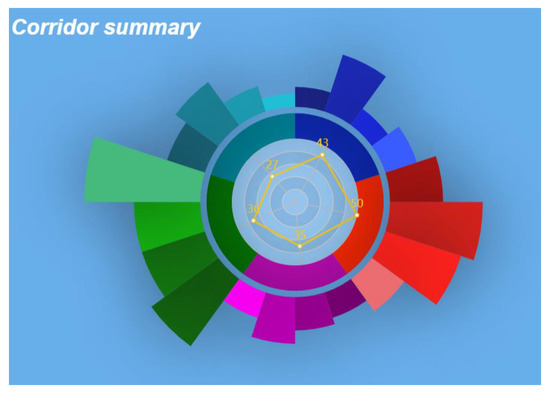
Figure 6.
Corridor summary glyph.
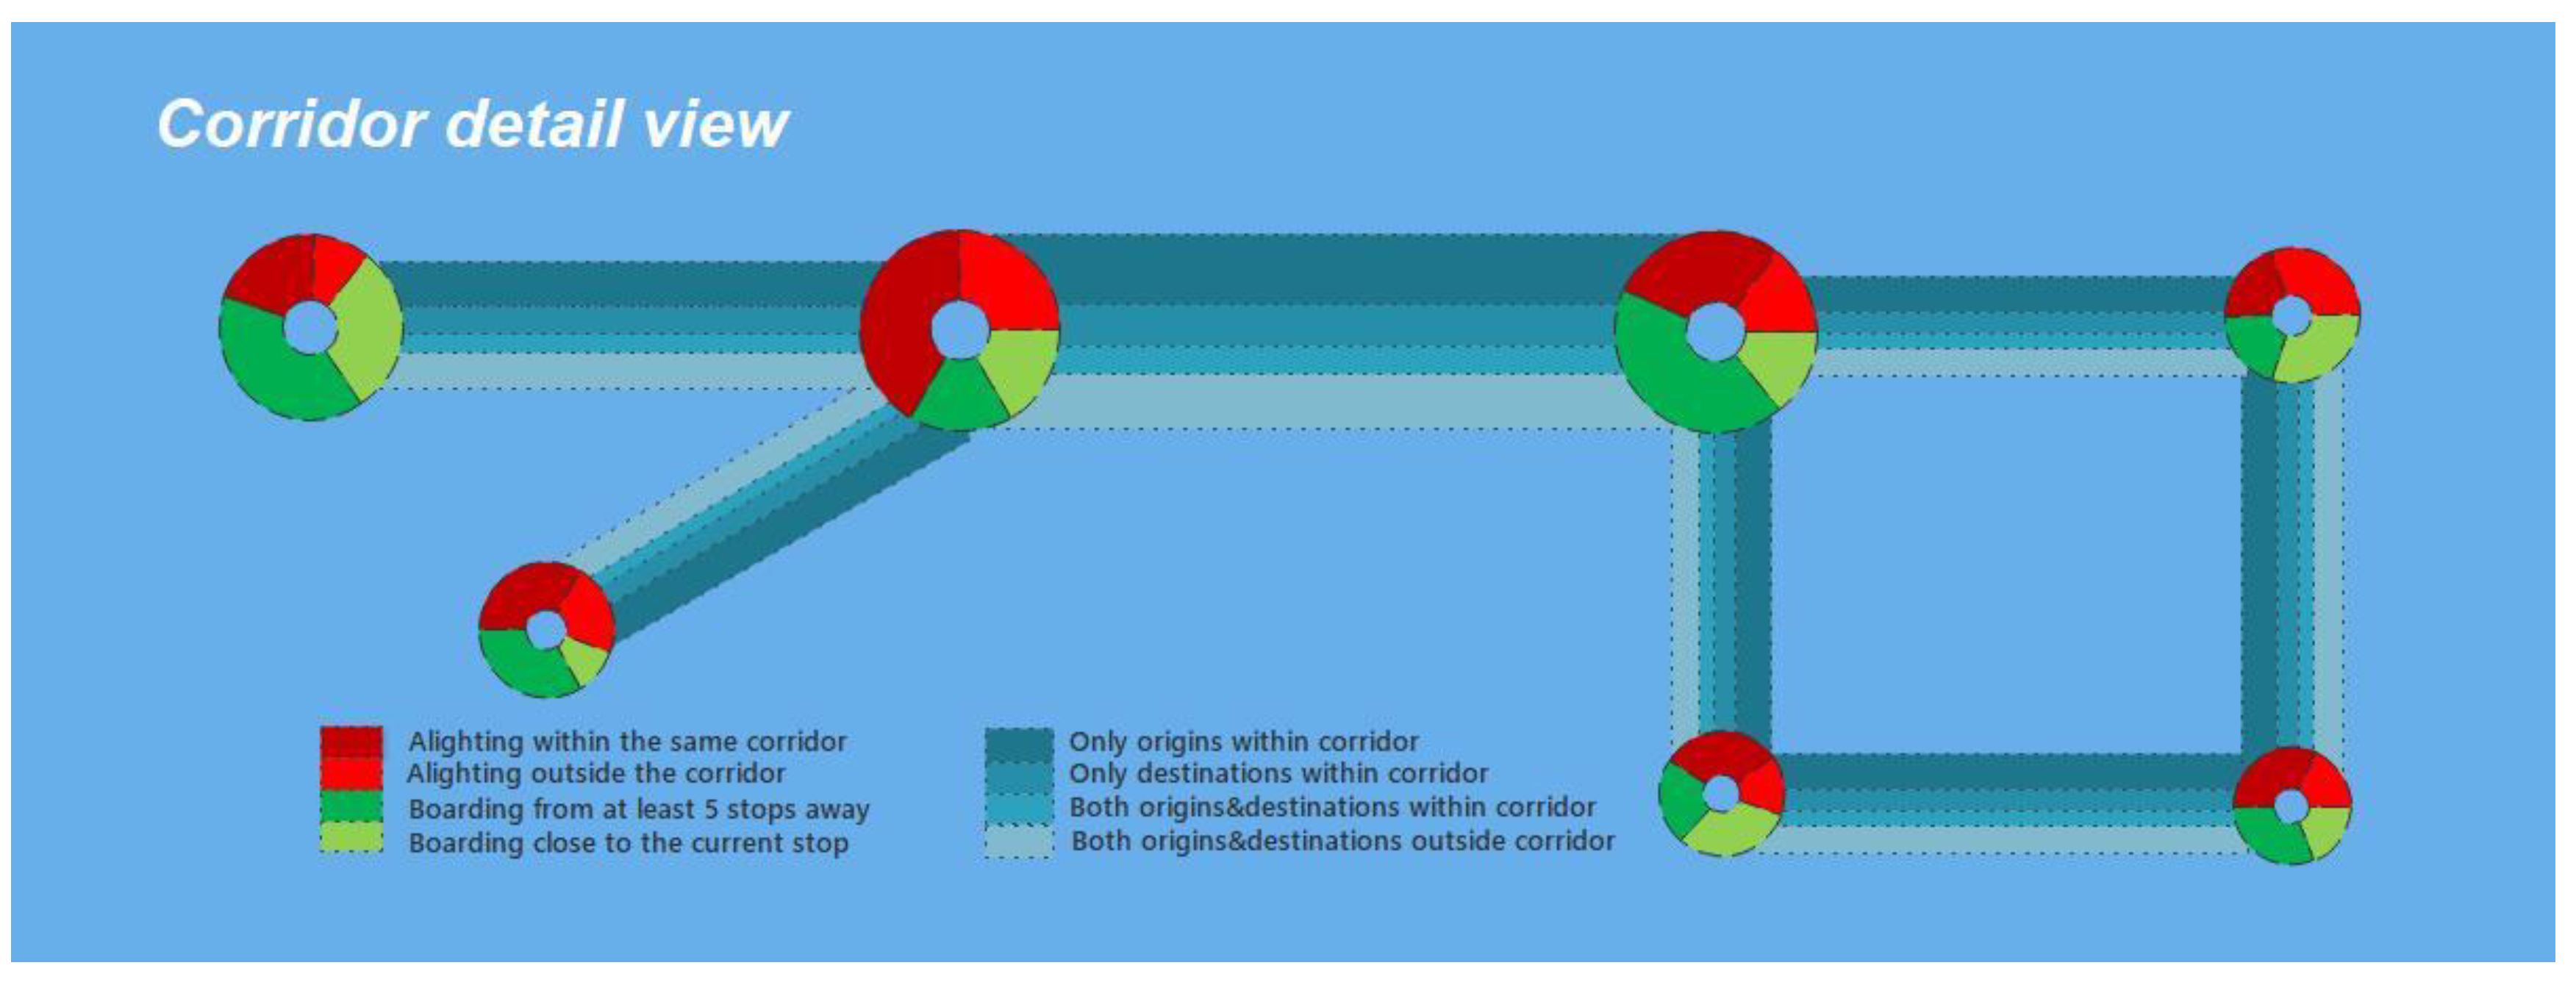
Users can select and observe details of a corridor (Figure 7). The layout of a corridor is simplified in a schematic form to retain only topological connections (similar to metro maps). The above-mentioned four types of trips are visualized for the selected corridor: each ribbon that connects two adjacent stops is divided into four components, and the width represents flow counts. Key stops within a corridor are depicted as rings, with red/green representing boarding/alighting counts. Passengers boarding at a stop are further categorized into two groups: those who will be alighting within the same corridor and those who will be alighting outside the corridor. The two groups are denoted by dark and light red, respectively. Similarly, passengers who alight at a stop are divided into two groups: “boarding from at least 5 stops away” and “boarding close to the current stop”. Dark- and light-green colors are used to denote the two groups. When selecting a particular corridor and observing its details in the corridor detail view, users can conduct local pattern exploration task 1 to fetch boarding, alighting, origin, and destination information in a compact visualization form.
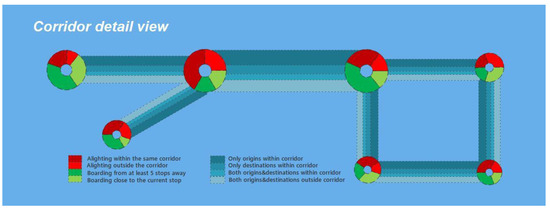
Figure 7.
Corridor detail view.
3.5.3. Transit Stops
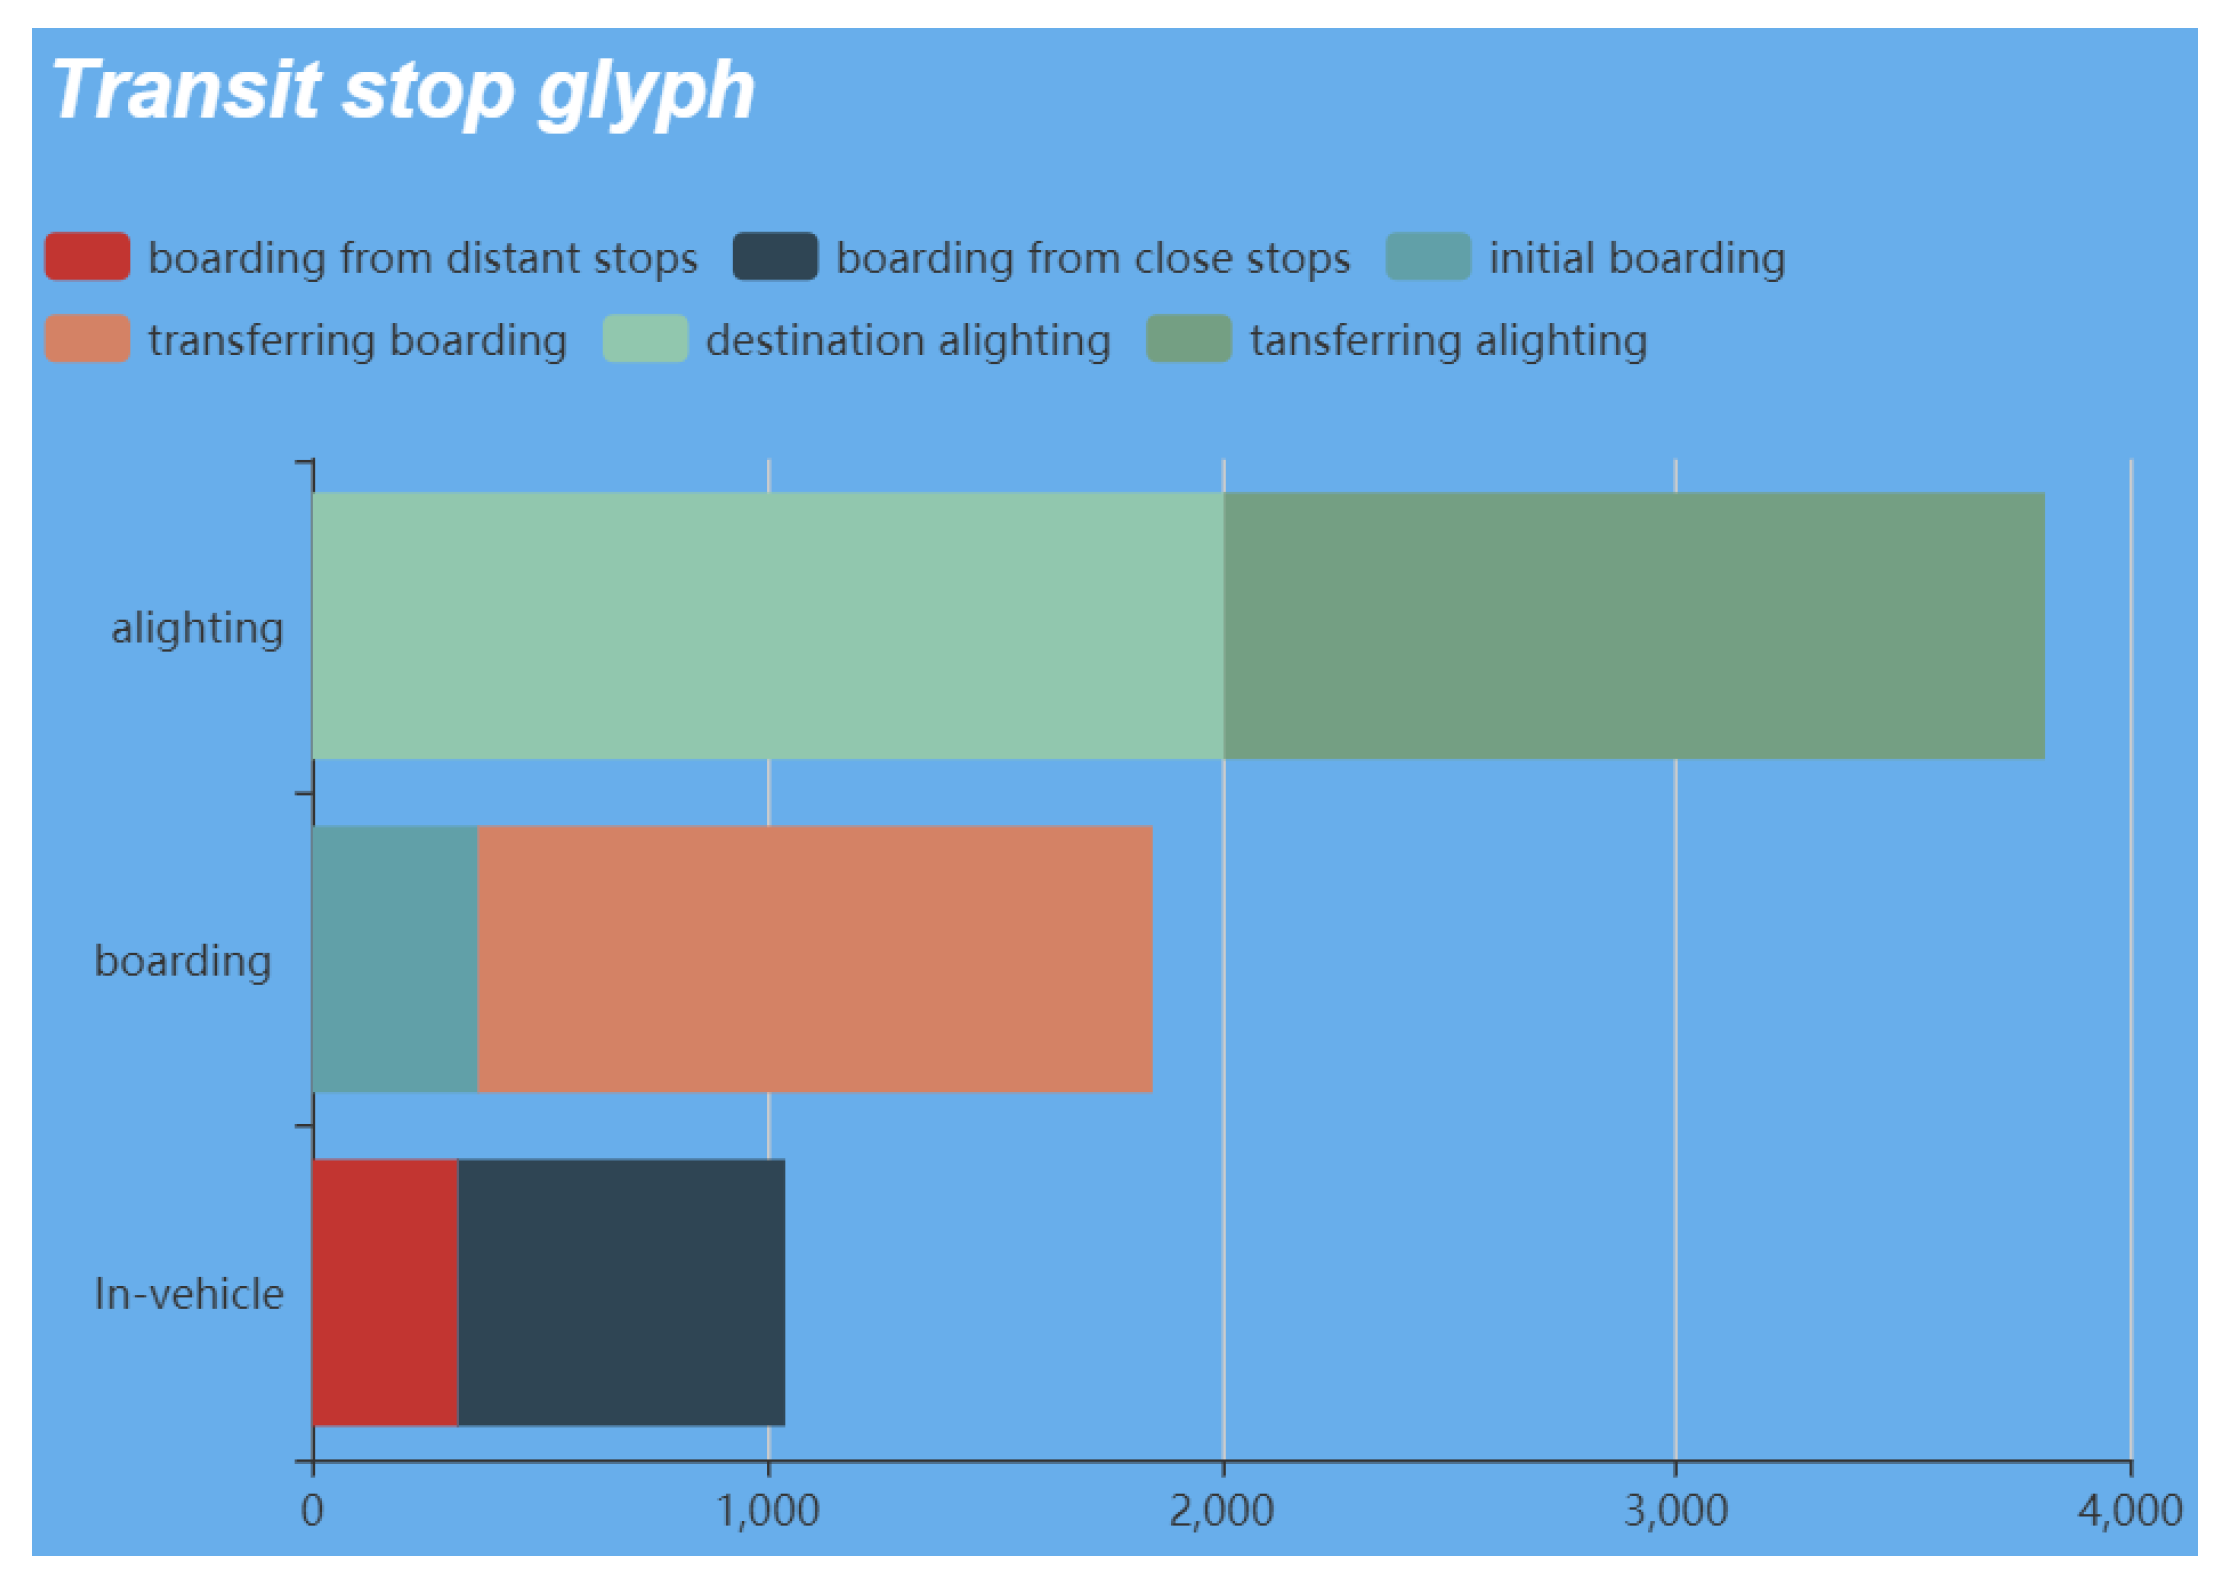
The trip information of individual transit stops is plotted in a glyph when users click on a stop on the map. Figure 8 shows that the stop glyph can visualize in-vehicle, boarding, and alighting passenger numbers. In-vehicle passengers can be further divided into boarding from distant and nearby stops. Boarding passengers consist of initial boarding and transferring passengers. Alighting passengers comprise those who finish their trips and those who transfer at this stop. One can easily tell the role played by this stop for the whole transit network: it could be an important origin stop, destination stop, or a transfer stop.
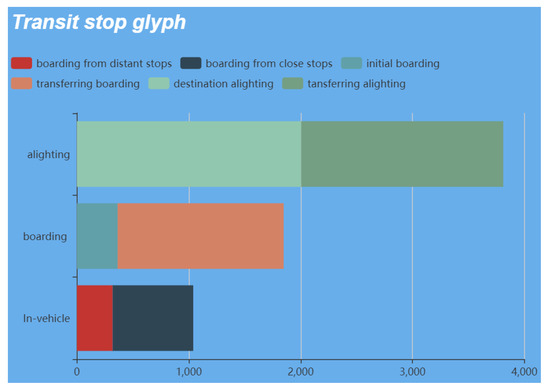
Figure 8.
Transit stop glyph.
3.5.4. Correlations between Corridors and Communities
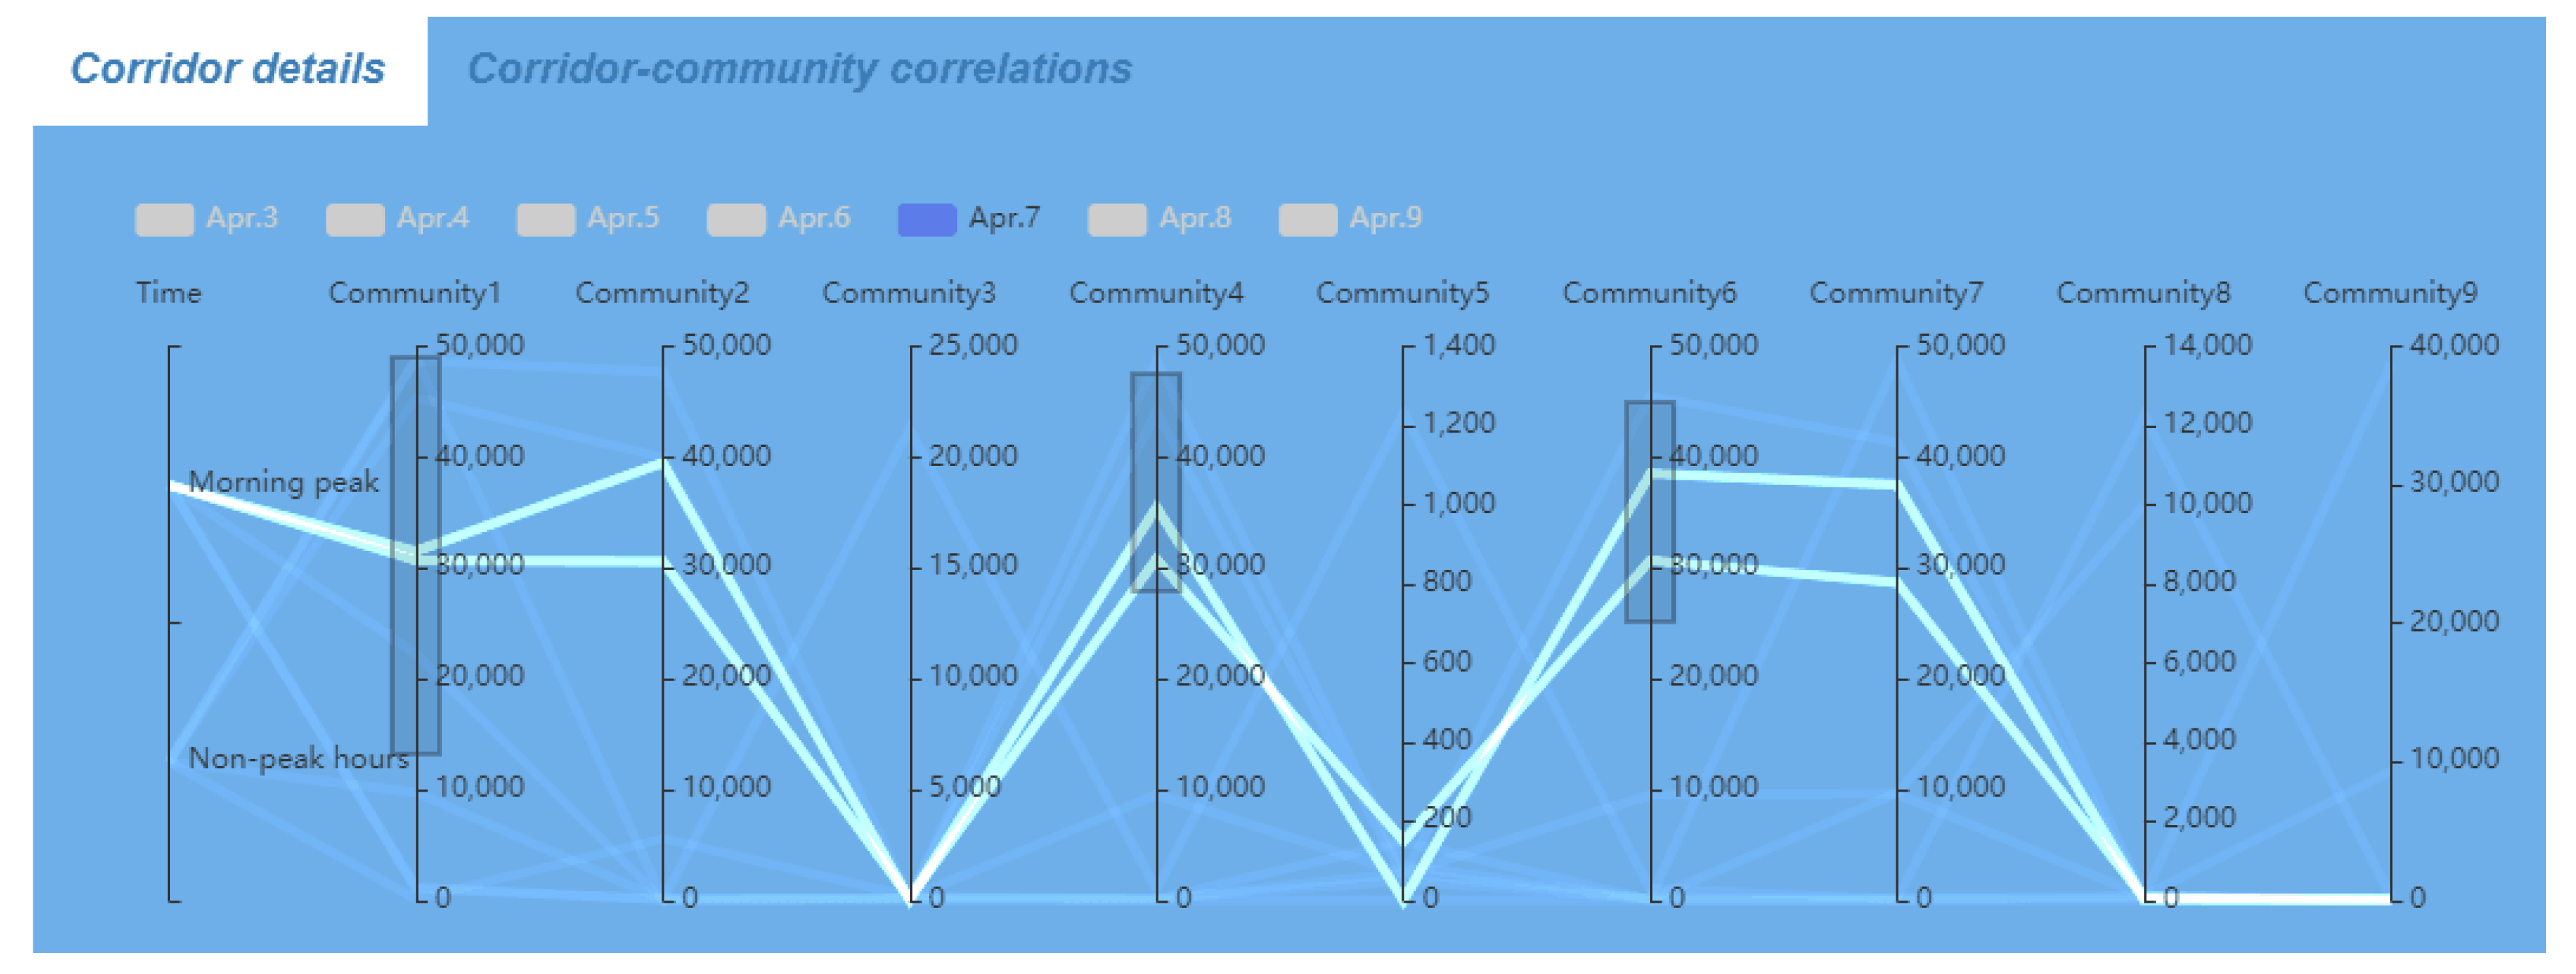
In the previous sections, we introduced our approaches to discover primary transit corridors with significant travel demands and mobility communities with similar travel patterns. Furthermore, geovisual analytics can be performed to examine correlations between these two identified time-varying mobility representations. An integrated parallel coordinate plot is designed to describe their correlations. For any pre-specified time interval, we can draw identified corridors as polylines and represent discovered communities as vertical parallel axes. For each corridor (i.e., polyline), the intersection point on an axis (i.e., a community) indicates the number of transit passengers who originate from the community towards the corridor. In this way, spatio-temporal correlations between each corridor and each community can be illustrated in a compact manner. We can easily find which community contributes the biggest portion of transit flow to a particular corridor or identify which corridor is the most correlated one for a specific community. We can also get to know the composition of any corridor or community. For example, the parallel coordinate plot can reveal whether most trips from a community are correlated to a few corridors or are evenly distributed over a number of corridors across the city. Note that these correlations are not equivalent to intersection relations between corridors and communities, which are explicit on maps. As long as the origins of constituent trips for a corridor can be traced to a community, the corridor and the community establishes a correlation. The number of these correlations represents the intensity of interactions between a corridor–community pair. For each vertical axis, a filtering box can be specified to find corridors that meet the transit flow number search range criterion. Multiple filtering boxes on different axes can be interactively designated to further identify corridors that are correlated to selected communities based on specified transit flow ranges (Figure 9). This geovisual analytics tool enables users to undertake the comprehensive analysis task to mine correlation knowledge between corridors and mobility communities.
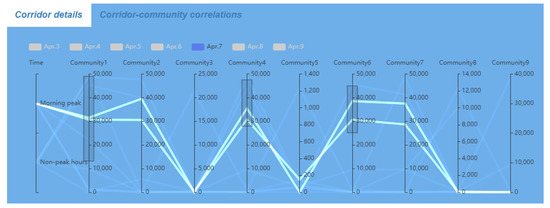
Figure 9.
Parallel coordinate plot to illustrate correlations between transit corridors and mobility communities. Corridors discovered for April 7 are shown in the figure. After setting three filtering boxes, four corridors can be discovered and highlighted in the plot.
4. Implementation and Prototype
The trip reconstruction and corridor discovery algorithms were implemented in C++. The corridor extraction and community detection algorithms were performed on a desktop computer with an Intel™ Xeon E3-1240@3.70 GHz processor and 16GB of memory, running on a Microsoft Window 10 operating system.
We selected stops that have 85–90th percentile of traffic flow counts as corridor seeds. The “shared transit flow” threshold (st) was set as the 50th percentile of the transit flow counts. The “shared accumulated transit flow” threshold (sa) can be set between −15% and 25%.
Mobility community structures were extracted using a hierarchical clustering tool implemented in the SciPy package based on network embedding results produced by a structural deep network embedding (SDNE) method [27]. The graph-embedding algorithm was implemented using TensorFlow 1.14.0 by Python 3.6. The clustering was performed based on Euclidean distance. The autoencoder network contains three layers: the input layer contains 18,109 neurons, which correspond to 18,109 grid groups in the study region; the hidden layer has 2000 neurons; and the output layer produces a 128 dimensional vector as the final embedding result for each graph node. Deeper layers would lead to performance degradation, as demonstrated by our tests. The model parameter initialization was based on a Gaussian distribution (with mean μ = 1 and standard deviation σ = 0.01). The weight in the joint loss function (Equation (5) was set as 0.2 since this delivered the best performance. The learning rate was set as 0.001. In order to produce cohesive and contiguous high-level communities, we applied a regionalization algorithm, REDCAP [44], based on the communities produced by SciPy.
We compared the performance of our community detection algorithm with a classical community detection algorithm developed by Newman and Leicht [45]. To evaluate the performance, we used the modularity metric proposed by Newman and Girvan [46].
As indicated by Table 1, our graph-embedding algorithm outperformed Newman and Leicht’s algorithm by a large margin. Note that our case study is different from the regular community detection problem, in which higher modularity values indicate good community partitions. Since we encourage a community to have dense inter-community transit trips and sparse intra-community trips, lower modularity values are better.

Table 1.
Performance comparison of community detection using the modularity metric (low-level communities).
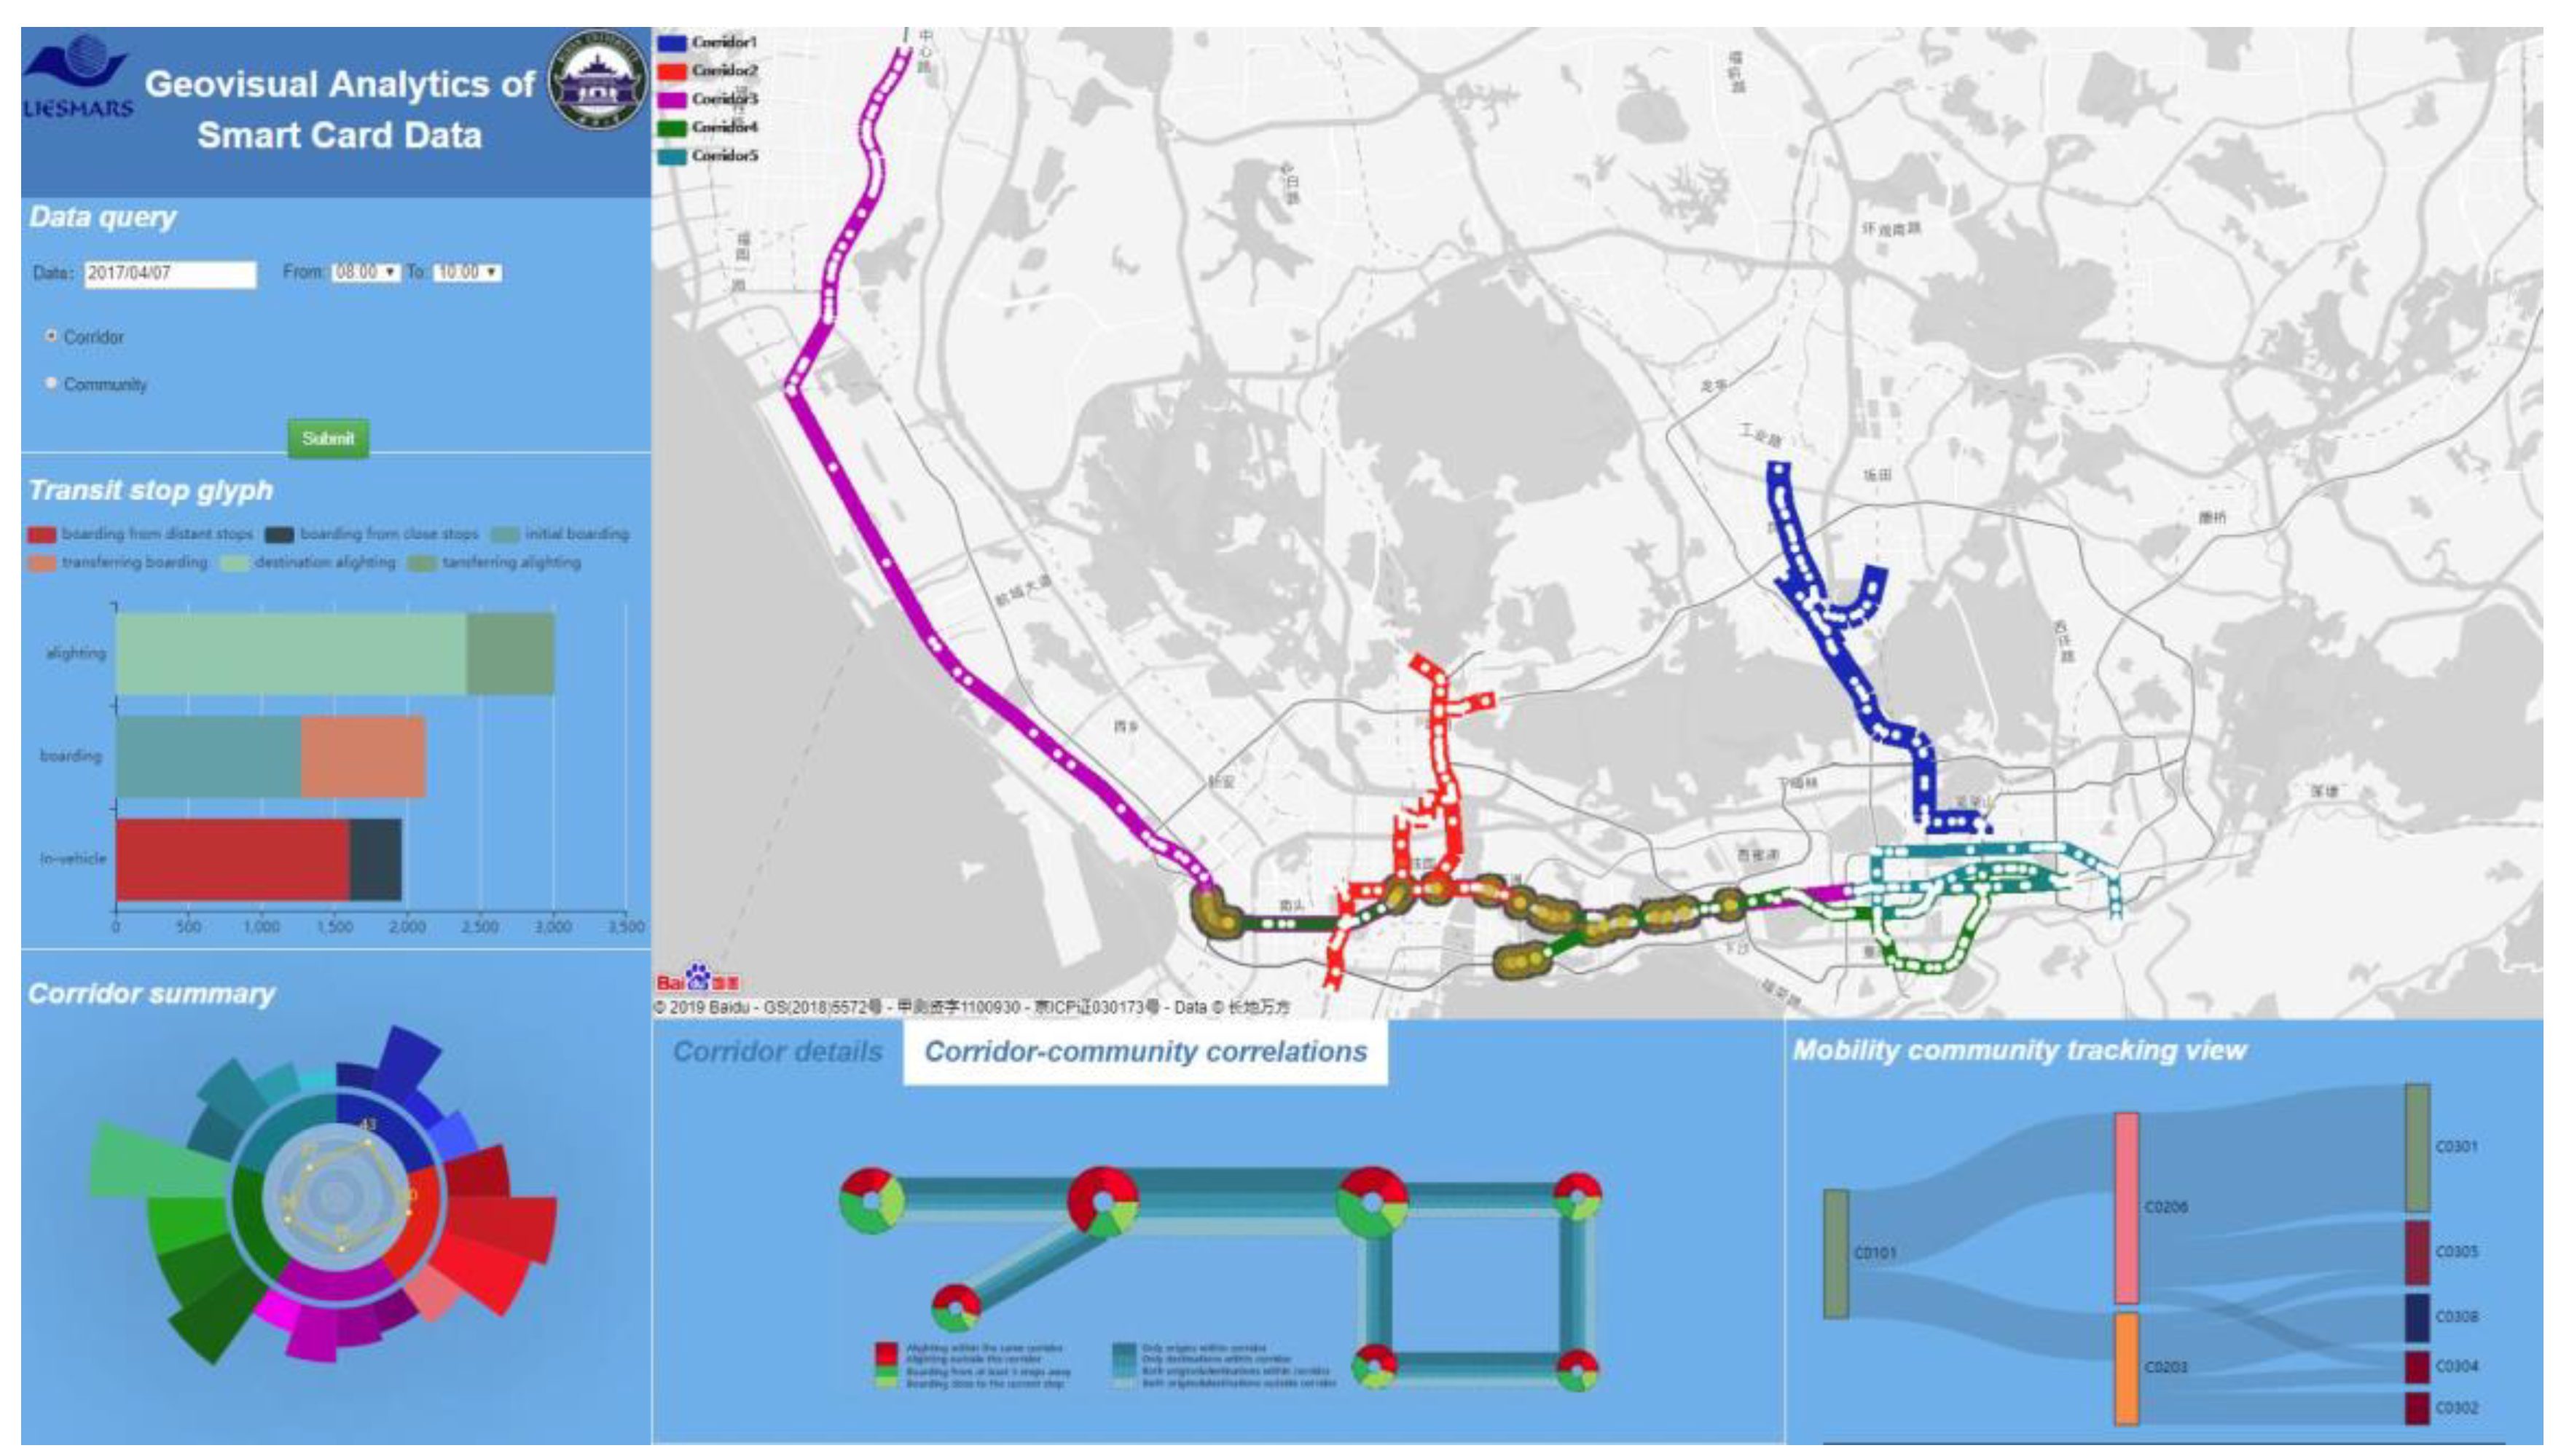
The visual designs were implemented in a web-based prototype, which was developed with PyCharm Pro 2018.3.1 on a Windows 10 operating system. Major visualization modules were developed in JavaScript following the standards of HTML5 and CSS3. The user interfaces comprises four major components (Figure 10): (1) query view in the upper-left portion; (2) map view in the upper right; (3) statistics view in the bottom-left corner; and (4) focus views for corridors and communities in the bottom-right region. In the query view, users can specify the time range and select SCD falling within this range for analysis. The map view depicts discovered corridors and mobility community structures. Different corridors are differentiated by distinct colors. The map view embeds a Baidu Map as the background map. Flow maps can be produced to describe primary transit flows between major communities. Focus views illustrate three types of detailed displays: corridor detail view, community tracking view, and corridor–community correlation view. All of these views are dynamically linked. User interactions within any view will apply to other linked views for the same data (community, transit stop, or corridor).
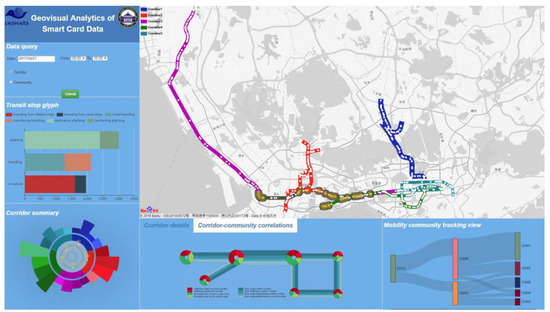
Figure 10.
Web-based prototype user interface.
5. Analysis and Discussion
5.1. Geovisual Analytics Workflow and Examples
Typically, a user can first specify the time range of SCD for analysis. For example, she can focus on morning peak hours of a weekday and invoke back-end algorithms to extract mobility structure and primary transit corridors. Then, both corridors and community structures can be visualized in multiple linked views to enable further examination. The integration of flow map and corridor map with community map at two scales can help users understand the overall transit mobility structure of the city. At a glance, users can identify the major origin/destination areas and how many passengers travel between these areas. Meanwhile, the statistics view presents summary information on all corridors, which allows users to compare the extracted corridors in terms of their trip types and performance. Furthermore, users can select a corridor and visualize it in the detailed view to gain more information on its constituent trips. Users can also select any transit stop to see the decomposition of its boarding and alighting trips. The prototype also allows users to examine the evolution of any chosen mobility community in the detail view. With all these linked views, users can perform the comprehensive analysis task to discover global and local transit travel patterns across the city over time.
For example, users can discover high-level mobility communities for any date. Figure 3a presents these communities for a holiday. The identified community structure synthesizes transit travel patterns that are much easier to understand than original massive transit footprints. The largest community (No. 1) is located on the east side of the downtown area, which is served by multiple subway lines and dozens of subway stations. This community attracts a large amount of leisure-oriented trips that originate from all over the city. In the west side of downtown, three separate communities (Nos. 2, 3, and 4) can be observed, and each attracts short trips close to it. Other communities are distributed over the suburbs, which are mostly residential areas. Many passengers living in these suburb communities travel to downtown areas for leisure purposes on the holiday.
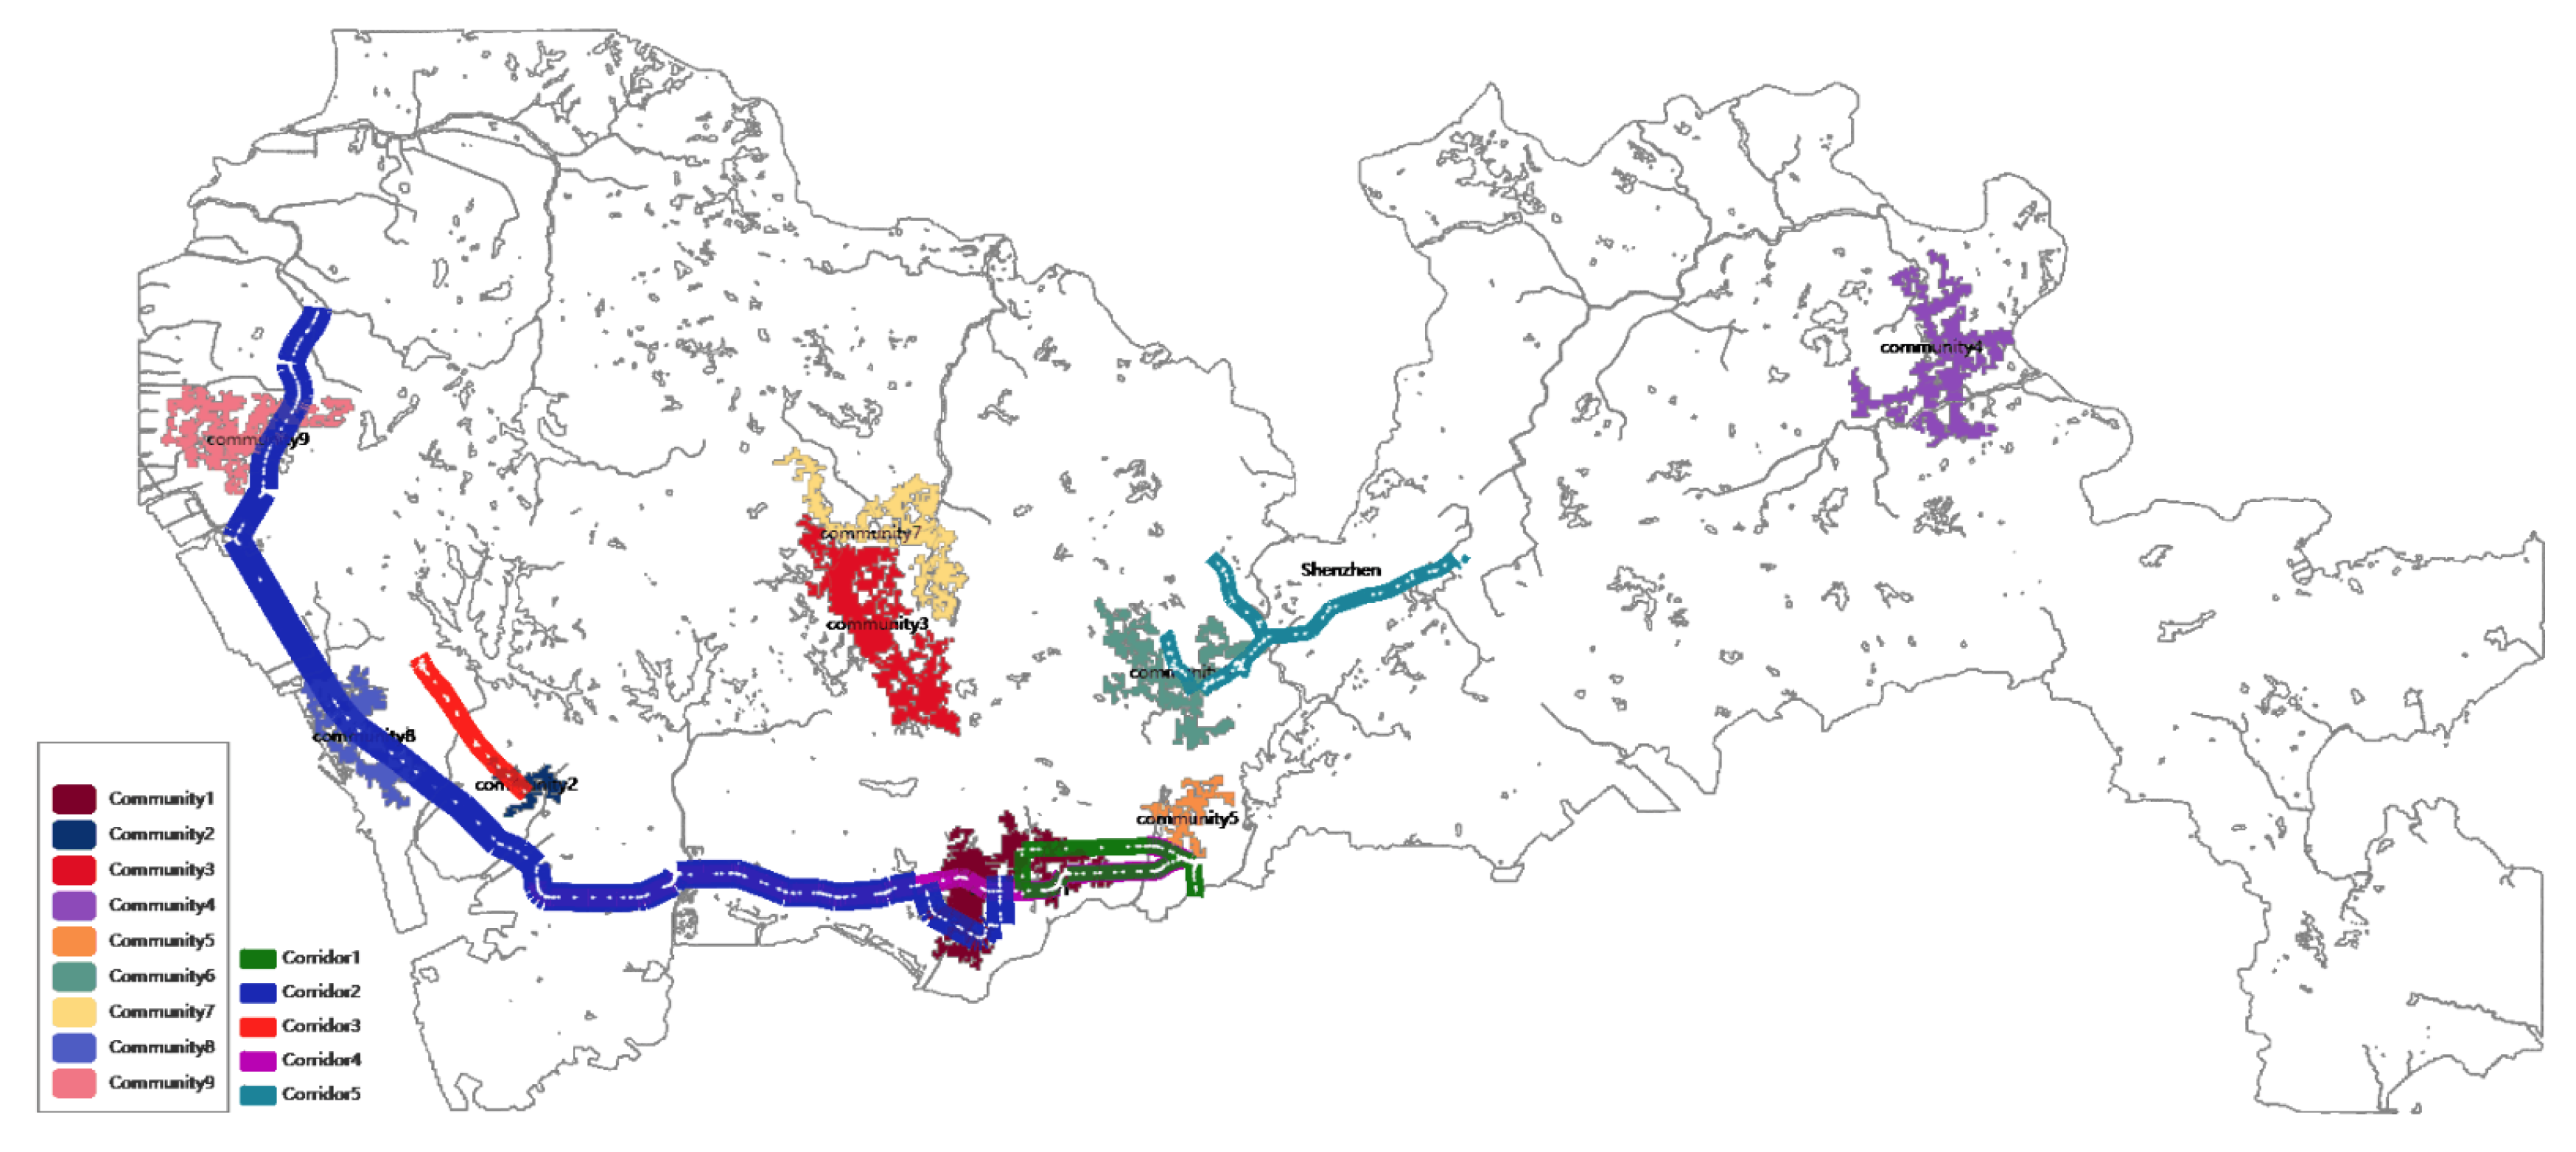
Figure 11 shows that it can beneficial to examine intrinsic travel patterns by integrating transit corridors with mobility communities. It can be observed that the most salient corridor connects community Nos. 8 and 9 and community No. 1, which have the most job opportunities in the city. Based on the flow direction of the corridor (shown by animated particles), we can find that a large number of commuters travel towards community No. 1 for work in the morning. Another corridor in the Northeast indicates that many passengers who live in remote outskirts make trips towards community No. 6, which features many industrial parks and high-technology companies. With these interactive maps, both corridor and community information can be combined to further investigate the travel origins and destinations for different times and dates, thereby deepening our understanding of evolving movement patterns across the city. These integrated maps can also contribute to the explanation of the interactions between transit corridors and mobility communities.
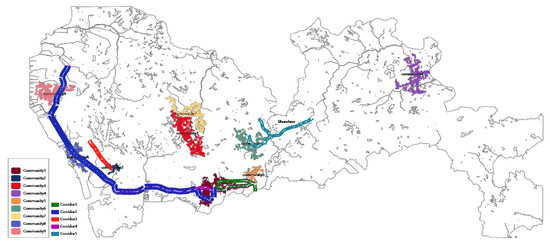
Figure 11.
Discovered corridors and mobility communities for 11:00AM–1:00PM on weekdays.
5.2. User Evaluation
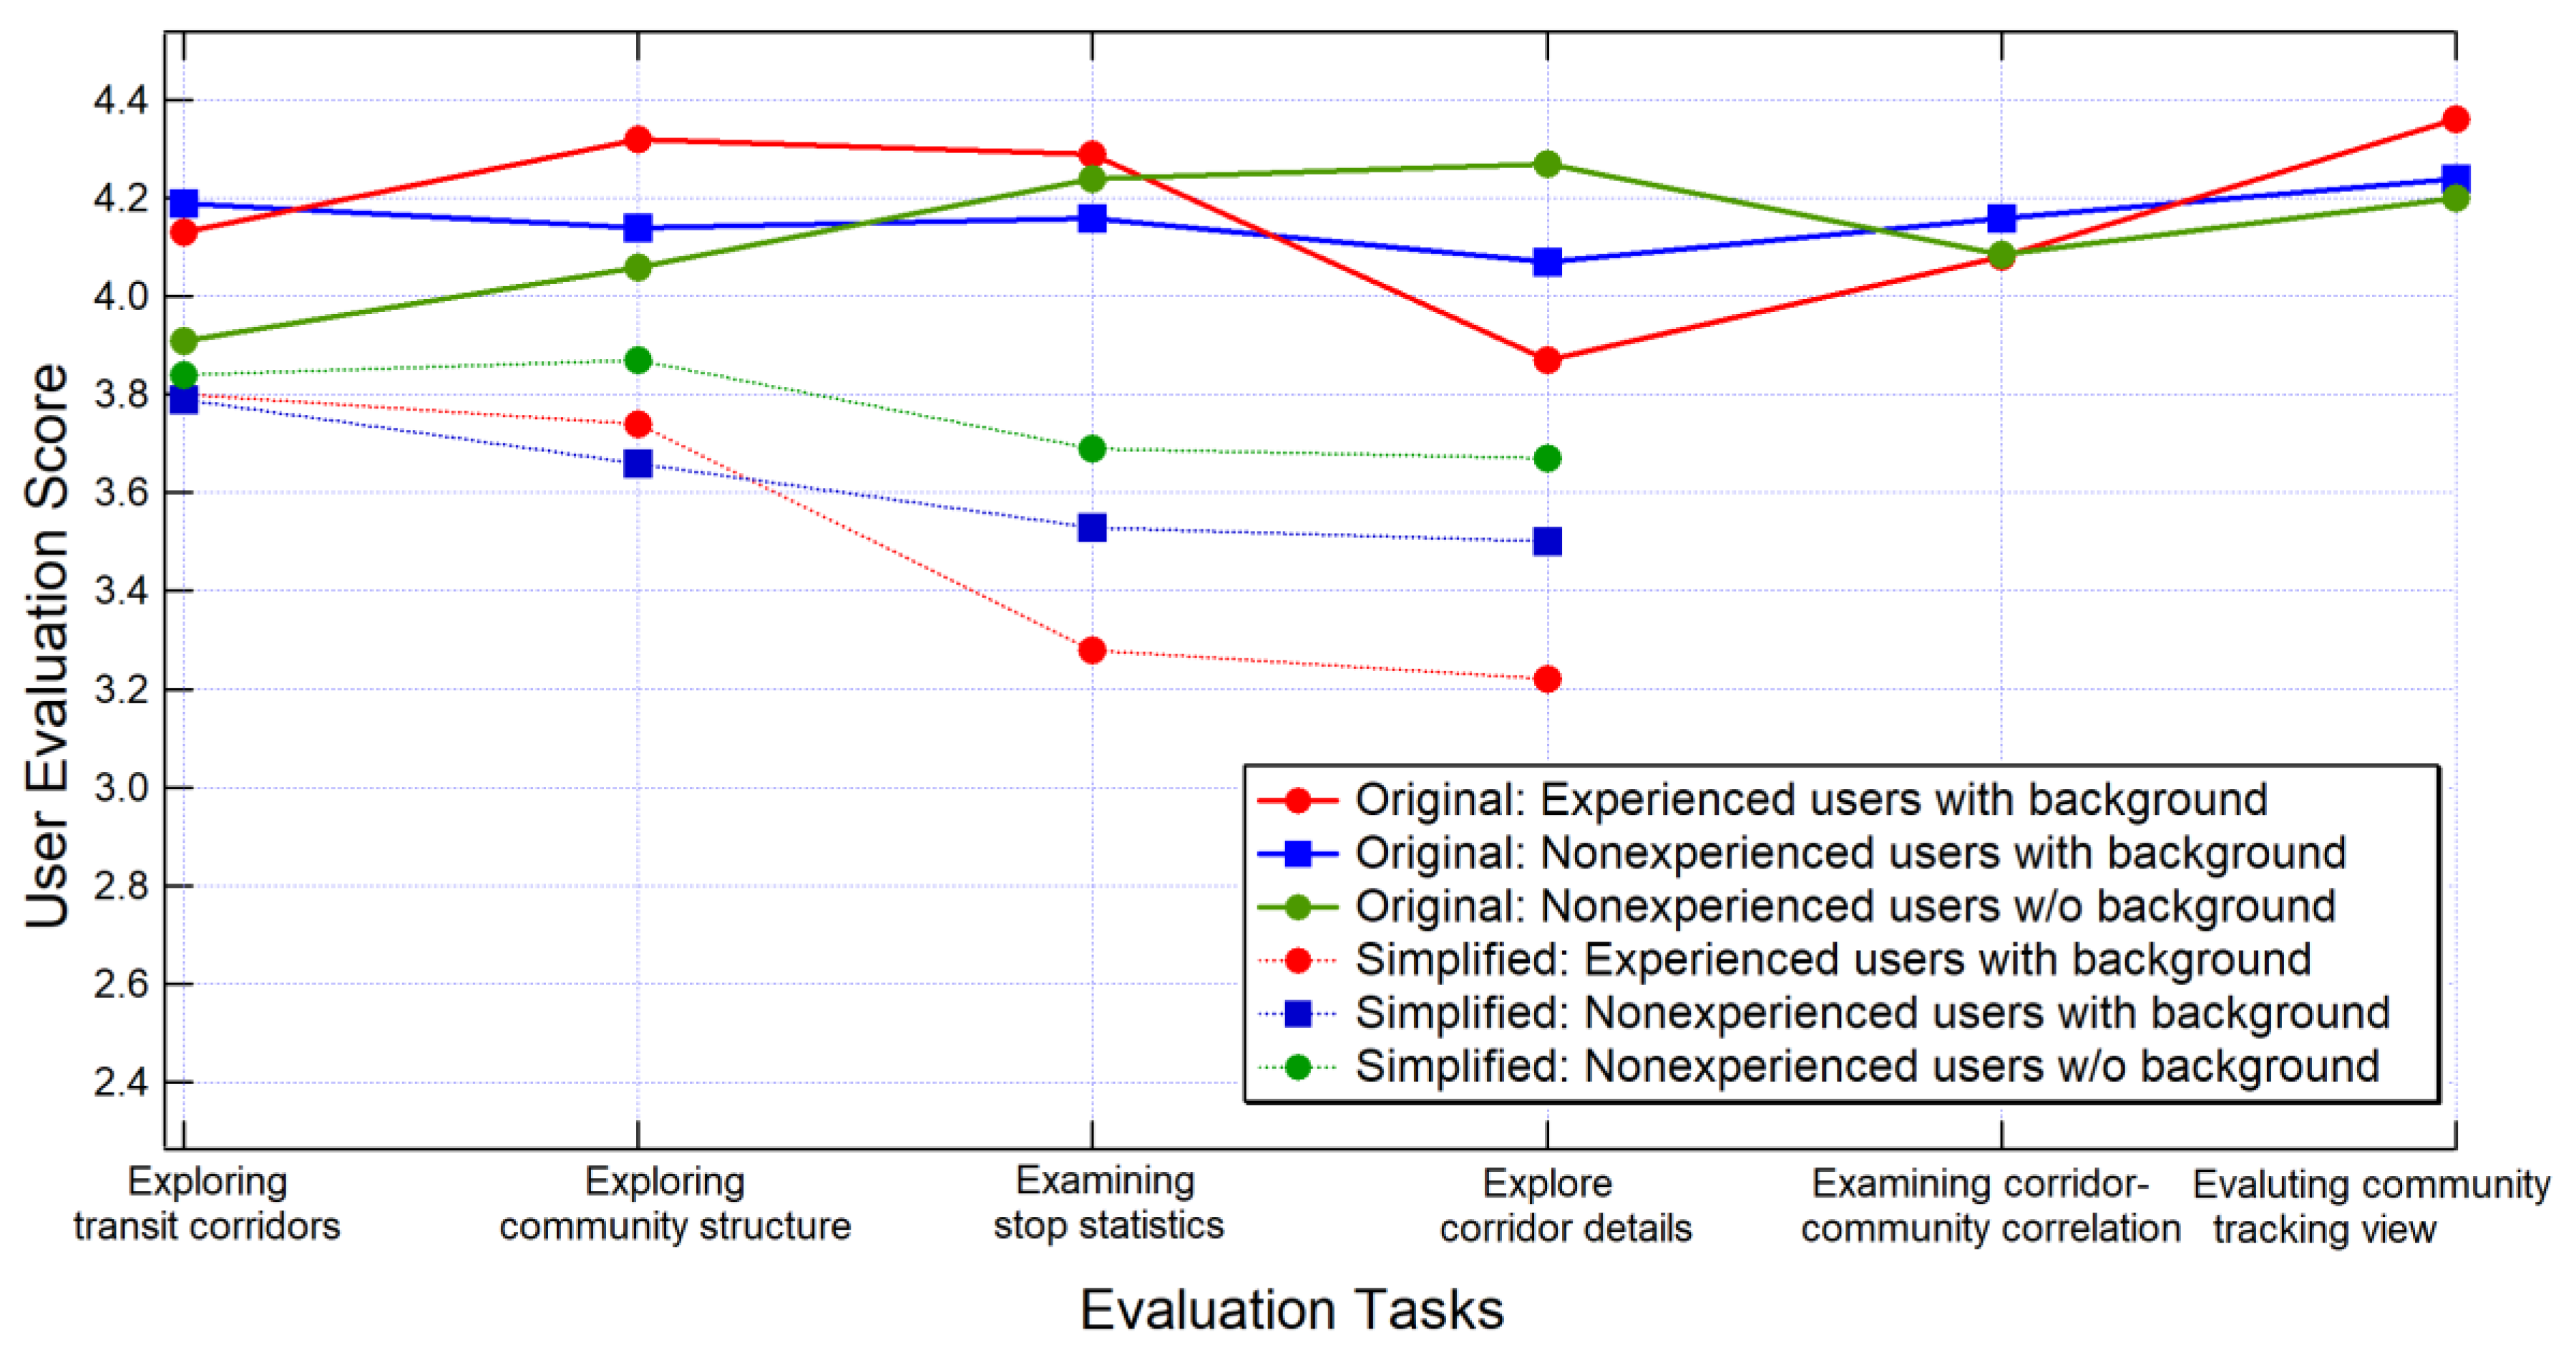
Twenty-three users were interviewed to obtain comments and feedback on our geovisual analytics approach based on their experience using the prototype. Sixteen of them are experts in public transportation, and among them, nine have geovisual analytics development knowledge (experienced users). The users can be classified into three groups: (1) experienced users with background knowledge (9 users); (2) non-experienced users with background knowledge (7 users); and (3) non-experienced users without background knowledge (7 users). Before allowing them to use the prototype, we introduced the proposed geovisual analytics approach and the web-based prototype. We asked users to evaluate 6 geovisual analytics tasks: (1) to discover and visualize transit corridors; (2) to extract and visualize mobility community structure; (3) to obtain transit stop summary statistics information; (4) to evaluate the corridor detailed view; (5) to evaluate the mobility community tracking view; (6) to evaluate the corridor–community correlation view. Numeric scores were obtained from questionnaires, with “0” indicating the worst user experience and “5” indicating the best. Figure 12 summarizes the scores of interviewed users.
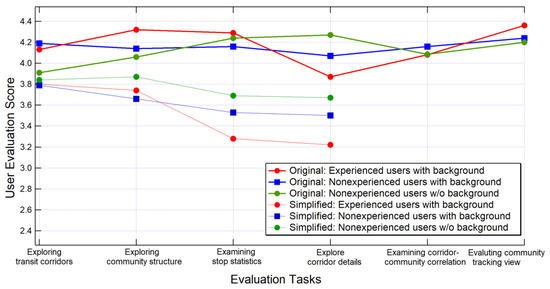
Figure 12.
Average evaluation scores for 6 selected geovisual analytics tasks.
According to ratings and comments, different groups of users agreed that our integrated analytics approach and web-based prototype deliver an interesting and applicable solution for human mobility pattern discovery given massive transit data and complex transit networks. As shown in Figure 12, experienced users and users with background knowledge tended to give more positive ratings than non-experienced users or users without any background knowledge for most evaluation tasks. It may take more time for the third group users to understand the interfaces and functions of the system, thereby reducing their time to fully explore all of the views and leading to lower scores. Evaluation tasks (1) and (4) had relatively low ratings, probably due to the unfamiliar concept of transit corridors for some users. Users may have had difficulties selecting and examining particular corridors between different views, which was confirmed by subsequent feedback interviews. The corridor detail view is also not intuitive to use, according to the users’ comments, since it requires users to switch their focus between the map view and the detail view frequently.
We also implemented a simplified web-based version for user evaluation. Compared to the original version, the simplified prototype only has an integrated map view to show discovered corridors and community structure. It does not implement linked views and only has limited visualizations (e.g., without animated particles to show the flow direction in corridors, without individual transit stop glyphs and corridor detail views).
With such a simplified system, we conducted user evaluation interviews with the same three groups of users. The same evaluation interview procedure was conducted to solicit their scores and feedback. Note that only four evaluation tasks were evaluated, namely, exploring transit corridors, exploring community structures, examining stop statistics, and exploring corridor details. The average evaluation scores for the simplified system are also shown in Figure 12. As we can see, these evaluation scores are significantly lower than scores obtained based on the original prototype for the evaluated four tasks.
5.3. Discussion
This study adopted the concepts of community structure and transit corridor to construct high-level aggregate mobility knowledge from massive SCD and other urban data. The results of community detection and corridor discovery algorithms were integrated into an interactive visualization interface that consists of multiple linked views to enable efficient visual analysis of spatio-temporal transit mobility patterns at multiple scales and resolutions. The map view offers an overview interface to help users preserve context information when they focus on a particular corridor, community, or stop visualizations. Specific views such as corridor detail view, mobility community tracking view, and a parallel coordinate correlations plot, along with summary glyphs (including a transit stop glyph and corridor summary glyph) complement the map view to provide intuitive geovisual analytics tools for the discovery of detailed knowledge of any specific component of the public transit system. The advantages of integrating machine learning with interactive visualization can be summarized as follows:
- (1)
- It offers an efficient and effective method to explore a massive amount of transit trips, which is otherwise challenging to analyze and visualize. Based on discovered corridors and mobility communities, we can focus on the most significant travel patterns while still having the capability to explore the details of any stop.
- (2)
- It delivers an intuitive user interface to combine multiple views that allows regular users to analyze complex transit travel behaviors from different perspectives. For example, corridors present high-level representations of concentrated trips based on road networks, whereas mobility communities are produced to synthesize similar travel characteristics over the partition of the study region.
- (3)
- It is beneficial for many transit management applications, such as demand modeling, transit planning, and daily operations, since they provide an applicable approach to highlight aggregated movement patterns at multiple spatial and temporal resolutions. The prototype can also be used by regular passengers to plan their transit trips and choose their residence or work place.
For most city residents, transit travel follows a weekly rhythm: they commute to work on every weekday and enjoy their leisure time on weekends. One-week data could then be sufficient to extract typical transit movement patterns for the study area. In the literature, we can also find other researchers also using one-week public transit data (i.e., smart card data) for their studies. For example, Long and Thill [47] examined job–housing relationships in Beijing with one-week bus-based SCD. Alsger et al. [48] validated origin-destination estimation algorithms based on one-week SCD in Southeast Queensland, Australia. If we can access SCD and GPS trajectory data from other time periods, the same geovisual analytics approach can be readily applied.
6. Conclusions and Further Work
In this study, we applied two machine learning methods, including a clustering algorithm to extract transit corridors and a graph-embedding algorithm to discover mobility community structure. These high-level representations are visualized in a web-based interactive interface to allow users to examine massive SCD in a highly aggregated and efficient manner. Our prototype demonstrates that the proposed visual analytics approach can offer a scalable and effective solution for discovering meaningful travel patterns across a big metropolitan area. We plan to improve the usability of the prototype based on users’ comments in the near future. It is favorable to allow users to designate algorithm configurations in the graphic user interface, which contributes to a better understanding of the underpinning machine learning algorithms, and this will be implemented in the near future.
Author Contributions
Conceptualization, T.Z.; Methodology, T.Z.; J.W.; Software, C.C.; Y.L. (Yicong Li), W.H.; Formal Analysis, C.C.; Y.L. (Yicong Li); Data Curation, C.C.; Q.Q.; Writing-Original Draft Preparation, T.Z.; Writing-Review & Editing, J.W., Q.Q.; Visualization, J.W.; C.C.; Project Administration, Y.L. (Yonghua Lu); Funding Acquisition, T.Z.; Y.L. (Yonghua Lu).
Funding
This research was funded by the Special Fund for the Development of Strategic Emerging Industries in Shenzhen, grant number JSGG20170412170711532, the National Natural Science Foundation of China, grant number 41871308, and the Basic Scientific Research Fund Program of the Chinese Academy of Surveying and Mapping, grant number 7771820.
Conflicts of Interest
The authors declare no conflict of interest. The funders had no role in the design of the study; in the collection, analyses, or interpretation of data; in the writing of the manuscript, or in the decision to publish the results.
References
- Pelletier, M.-P.; Trepanier, M.; Morency, C. Smart card data use in public transit: A literature review. Transp. Res. Part C 2011, 19, 557–568. [Google Scholar] [CrossRef]
- Sun, L.; Axhausen, K. Understanding urban mobility patterns with a probabilistic tensor factorization framework. Transp. Res. Part B 2016, 91, 511–524. [Google Scholar] [CrossRef]
- Zhao, J.; Qu, Q.; Zhang, F.; Xu, C.; Liu, S. Spatio-temporal analysis of passenger travel patterns in massive smart card data. IEEE Trans. Intell. Transp. Syst. 2017, 18, 3135–3146. [Google Scholar] [CrossRef]
- El Mahrsi, M.; Come, E.; Oukhellou, L.; Verleysen, M. Clustering smart card data for urban mobility analysis. IEEE Trans. Intell. Transp. Syst. 2017, 18, 712–728. [Google Scholar] [CrossRef]
- Kieu, L.; Ou, Y.; Cai, C. Large-scale transit market segmentation with spatial-behavioural features. Transp. Res. Part C 2018, 90, 97–113. [Google Scholar] [CrossRef]
- Trépanier, M.; Habib, K.; Morency, C. Are transit users loyal? Revelations from a hazard model based on smart card data. Can. J. Civ. Eng. 2012, 39, 610–618. [Google Scholar] [CrossRef]
- Li, T.; Sun, D.; Jing, P.; Yang, K. Smart card data mining of public transport destination: A literature review. Information 2018, 9, 18. [Google Scholar] [CrossRef]
- Wang, Y.; Correia, G.; Romph, E.; Timmermans, H. Using metro smart card data to model location choice of after-work activities: An application to Shanghai. J. Transp. Geogr. 2017, 63, 40–47. [Google Scholar] [CrossRef]
- Çolak, S.; Lima, A.; González, M.C. Understanding congested travel in urban areas. Nat. Commun. 2016, 7, 10793. [Google Scholar] [CrossRef]
- Toole, J.L.; Herrera-Yaqüe, C.; Schneider, C.M.; González, M.C. Coupling human mobility and social ties. J. R. Soc. Interface 2015, 12, 20141128. [Google Scholar] [CrossRef]
- Schneider, C.M.; Rudloff, C.; Bauer, D.; González, M.C. Daily travel behavior: Lessons from a week-long survey for the extraction of human mobility motifs related information. In Proceedings of the 2nd ACM SIGKDD International Workshop on Urban Computing, Chicago, IL, USA, 11 August 2013. Article No. 3. [Google Scholar]
- Hedayatifar, L.; Bar-Yam, Y.; Morales, A.J. Social fragmentation at multiple scales. arXiv 2018, arXiv:1809.07676. [Google Scholar]
- Mazimpaka, J.; Timpf, S. Trajectory data mining: A review of methods and applications. J. Spat. Inf. Sci. 2016, 13, 61–99. [Google Scholar] [CrossRef]
- Toch, E.; Lerner, B.; Ben-Zion, E.; Ben-Gal, I. Analyzing large-scale human mobility data: A survey of machine learning methods and applications. Knowl. Infor. Syst. 2019, 58, 501–523. [Google Scholar] [CrossRef]
- Xie, R.; Ji, Y.; Yue, Y.; Zuo, X. Mining individual mobility patterns from mobile phone data. In Proceedings of the 2011 International Workshop on Trajectory Data Mining and Analysis, Beijing, China, 18 September 2011; pp. 37–44. [Google Scholar]
- Khoroshevsky, F.; Lerner, B. Human mobility-pattern discovery and next-place prediction from GPS data. In Multimodal Pattern Recognition of Social Signals in Human-Computer-Interaction; Schwenker, F., Scherer, S., Eds.; Lecture Notes in Computer Science; Springer: Cham, Switzerland, 2017; Volume 10183, pp. 24–35. [Google Scholar]
- Chen, X.; Shi, D.; Zhao, B.; Liu, F. Mining individual mobility patterns based on location history. In Proceedings of the IEEE First International Conference on Data Science in Cyberspace (DSC), Changsha, China, 13–16 June 2016. [Google Scholar]
- Ouyang, X.; Zhang, C.; Zhou, P.; Jiang, H. DeepSpace: An online deep learning framework for mobile big data to understand human mobility patterns. arXiv 2016, arXiv:1610.07009. [Google Scholar]
- Kim, D.; Song, H. Method of predicting human mobility patterns using deep learning. Neurocomputing 2018, 280, 56–64. [Google Scholar] [CrossRef]
- Wang, C.; Ma, L.; Li, R.; Durrani, T.; Zhang, H. Exploring trajectory prediction through machine learning methods. IEEE Access 2019, 7, 101441–101452. [Google Scholar] [CrossRef]
- Chen, R.; Chen, M.; Li, W.; Wang, J.; Yao, X. Mobility modes awareness from trajectories based on clustering and a convolutional neural network. ISPRS Int. J. Geo-Inf. 2019, 8, 208. [Google Scholar] [CrossRef]
- Ben-Zion, E.; Lerner, B. Identifying and predicting social lifestyles in people’s trajectories by neural networks. EPJ Data Sci. 2018, 7, 45. [Google Scholar] [CrossRef]
- Gonzalez, M.C. Transportation Model in the Boston Metropolitan Area from Origin Destination Matrices Generated with Big Data; New England University Transportation Center Year 24 Final Report (MITR24-5); Massachusetts Institute of Technology: Cambridge, MA, USA, 2016. [Google Scholar]
- Di Lorenzo, G.; Sbodio, M.; Calabrese, F.; Berlingerio, M.; Pinelli, F.; Nair, R. AllAbroad: Visual exploration of cellphone mobility data to optimise public transport. IEEE Trans. Vis. Comput. Graph. 2016, 22, 1036–1050. [Google Scholar] [CrossRef]
- Zhou, Z.; Yu, J.; Guo, Z.; Liu, Y. Visual exploration of urban functions via spatio-temporal taxi OD data. J. Vis. Lang. Comput. 2018, 48, 169–177. [Google Scholar] [CrossRef]
- Kim, S.; Jeong, S.; Woo, I.; Jang, Y.; Maciejewski, R.; Ebert, D. Data flow analysis and visualization for spatiotemporal statistical data without trajectory information. IEEE Trans. Vis. Comput. Graph. 2017, 24, 1287–1300. [Google Scholar] [CrossRef] [PubMed]
- Tao, S.; Rohde, D.; Corcoran, J. Examining the spatial-temporal dynamics of bus passenger travel behaviour using smart card data and the flow-comap. J. Transp. Geogr. 2014, 41, 21–36. [Google Scholar] [CrossRef]
- Zeng, W.; Fu, C.-W.; Arisona, S.; Schubiger, S.; Burkhard, R.; Ma, K.-L. Visualizing the relationship between human mobility and points of interest. IEEE Trans. Intell. Transp. Syst. 2017, 18, 2271–2284. [Google Scholar] [CrossRef]
- Von Landesberger, T.; Brodkorb, F.; Roskosch, P.; Andrienko, N.; Andrienko, G.; Kerren, A. MobilityGraphs: Visual analysis of mass mobility dynamics via spatio-temporal graphs and clustering. IEEE Trans. Vis. Comput. Graph. 2016, 22, 11–20. [Google Scholar] [CrossRef] [PubMed]
- Sun, Y.; Shi, J.; Schonfeld, P. Identifying passenger flow characteristics and evaluating travel time reliability by visualizing AFC data: A case study of Shanghai Metro. Public Transp. 2016, 8, 341–363. [Google Scholar] [CrossRef]
- Palomo, C.; Guo, Z.; Silva, C.; Freire, J. Visually exploring transportation schedules. IEEE Trans. Vis. Comput. Graph. 2016, 22, 170–179. [Google Scholar] [CrossRef] [PubMed]
- Zeng, W.; Fu, C.-W.; Arisona, S.; Erath, A.; Qu, H. Visualizing mobility of public transportation system. IEEE Trans. Vis. Comput. Graph. 2014, 20, 1833–1842. [Google Scholar] [CrossRef]
- Song, Y.; Fan, Y.; Li, X.; Ji, Y. Multidimensional visualization of transit smartcard data using space-time plots and data cubes. Transportation 2018, 45, 311–333. [Google Scholar] [CrossRef]
- Zhang, T.; Li, Y.; Yang, H.; Cui, C.; Li, J.; Qiao, Q. Identifying primary public transit corridors using multi-source big transit data. Int. J. Geogr. Inf. Sci. 2019, 1–25. [Google Scholar] [CrossRef]
- Primerano, F.; Taylor, M.; Pitaksringkarn, L.; Tisato, P. Defining and understanding trip chaining behaviour. Transportation 2008, 35, 55–72. [Google Scholar] [CrossRef]
- Nassir, N.; Hickman, M.; Ma, Z. Activity detection and transfer identification for public transfer fare card data. Transportation 2015, 42, 683–705. [Google Scholar] [CrossRef]
- Carr, J.; Dixon, C.; Meyer, M. Guidebook for Corridor-Based Statewide Transportation Planning; Transportation Research Board: Washington, DC, USA, 2010. [Google Scholar]
- Yildirimoglu, M.; Kim, J. Identification of communities in urban mobility networks using multi-layer graphs of network traffic. Transp. Res. Part C 2018, 89, 254–267. [Google Scholar] [CrossRef]
- Newman, M. Communities, modules, and large-scale structure in networks. Nat. Phys. 2011, 8, 25–31. [Google Scholar] [CrossRef]
- Fortunato, S.; Hric, D. Community detection in networks: A user guide. Phys. Rep. 2016, 659, 1–44. [Google Scholar] [CrossRef]
- Perozzi, B.; Al-Rfou, R.; Skiena, S. Deepwalk: Online learning of social representations. In Proceedings of the 20th ACM SIGKDD International Conference on Knowledge Discovery and Data Mining, New York, NY, USA, 24–27 August 2014; pp. 701–710. [Google Scholar]
- Wang, D.; Cui, P.; Zhu, W. Structural deep network embedding. In Proceedings of the KDD ’16, 22nd ACM SIGKDD International Conference on Knowledge Discovery and Data Mining, San Francisco, CA, USA, 13–17 August 2016. [Google Scholar]
- Scheepens, R.; Hurter, C.; van de Wetering, H.; van Wijk, J. Visualization, selection, and analysis of traffic flows. IEEE Trans. Vis. Comput. Graph. 2016, 22, 379–388. [Google Scholar] [CrossRef] [PubMed]
- Guo, D. Regionalization with dynamically constrained agglomerative clustering and partitioning (REDCAP). Int. J. Geogr. Inf. Sci. 2008, 22, 801–823. [Google Scholar] [CrossRef]
- Newman, E.; Leicht, E. Mixture models and exploratory analysis in networks. Proc. Natl. Acad. Sci. USA 2007, 104, 9564–9569. [Google Scholar] [CrossRef] [PubMed]
- Newman, E.; Girvan, M. Finding and evaluating community structure in networks. Phys. Rev. E 2004, 69, 026113. [Google Scholar] [CrossRef]
- Long, Y.; Thill, J. Combining smart card data and household travel survey to analyze jobs–housing relationships in Beijing. Comput. Environ. Urban Syst. 2015, 53, 19–35. [Google Scholar] [CrossRef]
- Alsger, A.; Assemi, B.; Mesbah, M.; Ferreira, L. Validating and improving public transport origin-destination estimation algorithm using smart card fare data. Transp. Res. Part C 2016, 68, 490–506. [Google Scholar] [CrossRef]
© 2019 by the authors. Licensee MDPI, Basel, Switzerland. This article is an open access article distributed under the terms and conditions of the Creative Commons Attribution (CC BY) license (http://creativecommons.org/licenses/by/4.0/).

