Article

Measuring Spatial Mismatch between Public Transit Services and Regular Riders: A Case Study of Beijing

1
Institute of Geographic Sciences and Natural Resources Research, Chinese Academy of Sciences, Beijing 100101, China
2
Department of Index, Beijing Transportation Information Center, Beijing 100073, China
3
College of Resources and Environment, University of Chinese Academy of Sciences, Beijing 100049, China
*
Author to whom correspondence should be addressed.
ISPRS Int. J. Geo-Inf. 2019, 8(4), 186; https://doi.org/10.3390/ijgi8040186
Submission received: 30 January 2019 / Revised: 2 March 2019 / Accepted: 31 March 2019 / Published: 9 April 2019

Abstract

:
Public transit services should favor space equity, and the concern of this study is how the allocation of public transportation resources corresponds to the needs of transit users. Identifying mismatches between urban transit resources and regular transit users benefits the transportation resource allocation policy. This study introduces a location maximum likelihood estimation method and a cell space collector mechanism to explore distribution differences of regular transit riders and transit stations based on data mining. In Beijing, 5.37 million regular transit users were identified, and their first-morning transit stations were found to be within 2 km from their last transit stations used the day before. As their locations were estimated, differences in ratios of the regular transit riders to residents were found among areas. Most regular transit users were located in the suburban areas of 5–20 km from the center of Beijing, and the spatial distribution of transit stations declined from the center to the peripheral urban areas. This mismatch between public transit services and regular transit riders sheds light on urban transportation policies.

1. Introduction

Bus and metro rail systems play a significant role in urban areas and are regarded as effective means to promote urban development [1]. Because investment in public transportation is usually based on public expenditures, public transit systems should serve the public equally [2]. Spatial equity in public transit services is viewed as an essential component of the overall transportation planning and management process [3]. A growing number of people rely on public transit systems, perceiving them as environmentally friendly and equitable [4]. Researchers have always related public transport transits to resident population distribution. However, for socio-economic reasons, a few resident groups use public transit systems more frequently than others [5]. Measuring the mismatch between public transit services and regular transit riders is important, and a reliable estimation of regular transit users’ demands favors transit systems and urban development [6]. It is a considerable challenge to provide efficient methods to measure how public transit services match public transit users [7]. Conventional methods such as inhabitant surveys [8] and household interviews are often used to identify regular transit users and their locations [9]. Due to its high efficiency, data mining of smart card data can be applied to identify commuting transit users [10], but few existing studies manage to match regular users with transportation resources.
This study aims to measure the mismatch between the distribution of transit stations and regular users, using a location maximum likelihood estimation (L-MLE) method and a mechanism of cell space collector (CSC). L-MLE is introduced to identify regular public transit riders and their locations from transit data. CSC is a mechanism based on which different data can be compared. A case study was conducted in Beijing that included transit, population census, and location data of bus stops and metro stations. Regular transit riders’ locations were estimated, projected into cell space collectors, and compared with the public transit station distribution. The resulting mismatch was discussed from a policy making perspective. The paper is structured as follows: Section 2 gives a review of existing literature; Section 3 describes data, the methods of L-MLE the mechanism of SCC, and data description; Section 4 details the results of the case study; and Section 5 discusses the conclusions, policy implications, and limitations of this work.

2. Literature Review

2.1. Mismatch Between Public Transit Services and Regular Transit Riders

Equity of public transit services can be related to population to some extent, as well as spatial and social equity [11]. Areas where residents heavily depend on the transit system often lack sufficient funding on transit [12]. Improving the equity of public transit service is important to urban livability [13]. Early studies used resident population data as the main reference in public transit service resource allocation, generally neglecting the fact that the frequency of using public transit systems differs among groups and areas [14]. However, residents’ need for public transport vary in different areas [15]. Recent researchers have reported that elderly, low-income, and no-car households use public transport services more frequently [16,17]. Low-income and medium-income populations tend to use the public transit system [9]. Public transit users tend to choose to live in places where house prices are relatively low [18]. Discrepancies in residents’ transit behavior in different areas need to be explored [19]. If an area is found to have high regular transit users with low transit service resources, attention should be paid to that place. It is either a place working class people prefer to live in or a place where the transit service resources are insufficient. Efforts to identify equity of public transit services will help policymakers discern overloaded areas in public transit service, adjust and rearrange transport assess points, and improve the accessibilities and equities of public transit service [20]. Generally, there should be a balance between supply in public transit services and demands generated by residents [21]. The literature indicates the significance of assessing the consistency of transit services with the distribution of regular transit riders.

2.2. Methods of Assessing Mismatch

Traditional estimations of public transport demands are primarily based on survey data [22], and the procedures are time-consuming and expensive to carry out [23]. A few have obtained data from open sources to avoid tedious procedures. However, these data are limited in recognizing regular public transit users [15]. There should be more efficient mechanisms than surveys and interviews to evaluate transit demands as well as service conditions in spatial perspectives. The use of data mining of smartcard data is becoming increasingly popular [24]. Data mining of transit logs has proven useful in transit service demand estimation [25]. Identifying regular public transit riders and locations using data mining is sufficiently addressed.
Studies show that human trajectories display a high degree of temporal and spatial regularity; each is characterized by a significant probability to return to a few frequent locations [26]. According to Torsten Hägerstrand’s theory of capability constraints, an individual needs a sheltered place to sleep at night, and one’s activities are bound to certain places [27]. However, the theory of capability constraints has not been fully employed to estimate the location of regular public transit riders based on bus and metro data. Another issue is comparing transit service resources with transit users. The distribution of bus stops and metro stations is an important indicator of public transit service assessment from the perspective of spatial equity [28]. Spatial distribution of public transit services can be calculated based on the location of public transit stations available [29]. Nevertheless, the data on transit service conditions and the data on transit riders’ locations are available in different formats. The resident data are usually based on administrative borders, while the locations of transit stops are coordinate points. A spatial analysis tool can be designed to establish a connection between public transit demands and public transit service [30].

3. Methods and Data

3.1. About the Data

Beijing has been chosen as the study area, as it relies highly on the public transit system. Transit data of August 2016 were collected, which included boarding stations, boarding time, alighting stations, and alighting time. Daily bus transit traffic volume and daily metro transit traffic volume added to a maximum of 20 million commuters on a single day. The Beijing Municipal Administration and Communication Card (commonly known as Yikatong) is the only smart card accepted in Beijing public transit system. Although transit riders use Yikatong anonymously, each anonymous card has a unique identification number. The cardholders’ daily commute can be tracked, and whether a card is frequently used can be easily judged. Thus, the frequent locations of the transit riders can be analyzed. Approximately 16 million active Yikatong IDs were found in a month, with the population of Beijing being approximately 20 million people. It is estimated that approximately 80% of the population have Yikatong cards.
Resident distribution data were also collected as denominators to calculate the ratios of the regular transit riders to residents. The Sixth National Population Census of the People’s Republic of China, also referred to as the 2010 Chinese Census, was conducted by the National Bureau of Statistics of the People’s Republic of China in November 2010. The census data were used to check whether regular transit riders are distributed in the same pattern as resident distribution. The census data showed the residential population as 19,612,368, for 306 sub-districts (towns) in Beijing. Unfortunately, information on age, gender, or income was not available for the researchers. The 306 sub-districts have different sizes and shapes, as shown in Table 1. As the shapes and sizes of the 306 sub-districts are not identical, the mechanism used to handle differences is essential in the procedure.
Data from bus stops and metro stations were also collected as public transit resources. By the end of 2016, there were about 1020 bus lines and 19 subway lines in Beijing, with more than 20,000 bus stops and 345 subway stations (source: www.bjbus.com, www.bjsubway.com), as shown in Figure 1. Information about the stops and stations contains names, types, longitudes, and latitudes was available. Metro transits and bus transits were treated as equal transits. Further, the bus stops are now listed by the line number. When a stop has two or more bus lines, the stops will be counted twice or more times. This is important, because the more bus lines are available in one stop, the more transit services are allocated there. Stops of the bus lines that connect Beijing to its surrounding towns were also used, while bus stops located outside of Beijing in the inter-city lines were ruled out.
Generally, the location of Tiananmen is perceived as the city center. A circle within 10 km from the center is seen as the center area, and the near suburbs (periphery) are the belt 10~30 km from the center. Areas beyond 30 km are generally perceived as remote suburbs. Wang et al. (2011) argue that house prices decline from the center to the periphery in Beijing, and working class people are more likely choose to live in the near suburbs where they can find a balance between house prices and commuting efforts [12].

3.2. Location Maximum Likelihood Estimation (L-MLE)

The method of L-MLE is designed to identify locations of regular transit riders based on Torsten Hägerstrand’s theories on capability constraints. Transit riders making only a single (once a day) journeys on public transit are not perceived as regular riders and have been discarded from this study. Bus transits and metro transit are integrated into transit diaries for all the transit riders. The regular return places of public transit riders at night are likely to be their private residences and can be recognized by analyzing the transit logs. The last station each rider uses and the first station on the next day are selected, and the distance calculated. The distance between the two stations is an overnight displacement, represented by λ. If λ < λt, (λt is the threshold distance individuals usually travel on foot), the two stations are perceived to be close to the rider’s residential location. A technique of maximum likelihood estimation is used to calculate the riders’ perceived locations based on their usual return places in transit logs. If a transit rider’s night stays are random, the rider’s location is not recognizable. Since existing research has proved public transit users seldom use transit stations beyond 2 km away [31], the threshold number λt = 2 km in the case study. Only those who return to places within 2 km are perceived recognizable. The whole procedure is shown in Figure 2.
The geographic coordinates of last alighting station on a day is [longia, latia] for a certain rider, and the first boarding station coordinate on the next day is [longib, latib]. [longii, latii] is the midpoint, as follows:
[longii, latii] = ([longib, latib] + [longia, latia])/2,
L-MLE was used to estimate the rider’s location [longiMLE, latiMLE], as follows:
[ l o n g i MLE ,   l a t i MLE ] = [ n 1 i = 1 n l o n g i i , n 1 i = 1 n l a t i i ] ,
where n is the total number of the midpoints indexed by i.

3.3. Cell Space Collector (CSC)

The mechanism of CSC is introduced to solve the inconsistency of data in type and format, as it hinders the research while comparing the spatial distributions of transit users and public transit resources. Data of residents’ locations are based on polygon spaces, while data of bus stops and metro stops are based on points. Under the framework of CSC, the whole study area is sliced into many cell spaces, and the points are projected into these cell spaces. If a point falls into a cell space, the logical value is ω = 1; otherwise, ω = 0. Then, the number of points located in the cell space number k is added as follows:
φk = ∑iωki,
where i is the index number of points and k is the index number of cell spaces.
Data of riders’ locations are not polygon based; gridded spaces are used as well as administrative borders. Coordinates of the points are used as the basis of judging their locations when the study area is sliced into gridded cell spaces. For an area sliced into m by n gridded cell spaces, whether a point [longi, lati] is located in a cell space whose latitude is in the range of [latiMIN, latiMAX] and longitude is in the range of [longiMIN, longiMAX] can be judged by logical operation calculation, as follows:
lati > latiMIN + (latiMAXlatiMIN) (i − 1)/m & latii < latiMIN + (latiMAXlatiMIN) i/m,
and longi > longiMIN + (longiMAXlongiMIN) (i − 1)/m & longi < longiMIN + (longiMAXlongiMIN) i/m,
where ‘&’ means formulas on both the sides are true.
It should be noted that the grids are not perfect rectangles, since the earth is a sphere. If the cell grids are small, the error ε of the area of the grid can be approximated by
ε = 1 c o s ( l a t i M A X ) c o s ( l a t i M I N ) ,
where latiMAX and latiMIN are the maximum and minimum latitudes in the study area.
Gridded cell spaces in latitude similar to Beijing with dimensions of 1 × 1 km has an error ε = 0.023,7 compared with the rectangles. Thus, grids based on latitudes and longitudes are treated as equal in size, especially in cities with low and medium latitudes.

4. Results

4.1. The Recognition of Regular Riders

In the dataset of 10 days transit log (7–16 August), 31,062,866 transits remained after riders making single transit a day were discarded. For approximately one third (11,495,322) of the transit riders’, overnight displacement was λ = 0 km, which means their last alighting stops of the day were exactly the next days’ first boarding stops. When the histogram of the 19,567,544 records with λ ∈ (0, 5 km] was made, a peak was found at approximately λ = 0.8 km (Figure 3a). This meant if a rider could not make a transit at the last station he/she used, he/she was likely to find another station approximately 800 m while making the first transit of the day. Approximately half of the transit records (18,005,108) fell into the zone of λ < 2 km, and these transits were made by 5,737,663 regular riders. As the M-LME method was applied, the locations of the 5,737,663 riders were recognizable. Figure 3b shows that many of the regular transit riders returned to their estimated places. 78.0% of the regular transit riders were found to make their first transits from their estimated places before 09:00, and approximately 3.3 million of them made night returns (after 18:00) more than once.
The regular transit riders also accounted for a good proportion of everyday transit users. During a week-long period from August 7th to 13th, 66.5%–77.5% in the 5.37 million regular transit riders were daily riders (Table 2). This implies that the identified regular transit riders are mainly active daily transit users.

4.2. Spatial Differences of Regular Rider Proportion to Resident Population

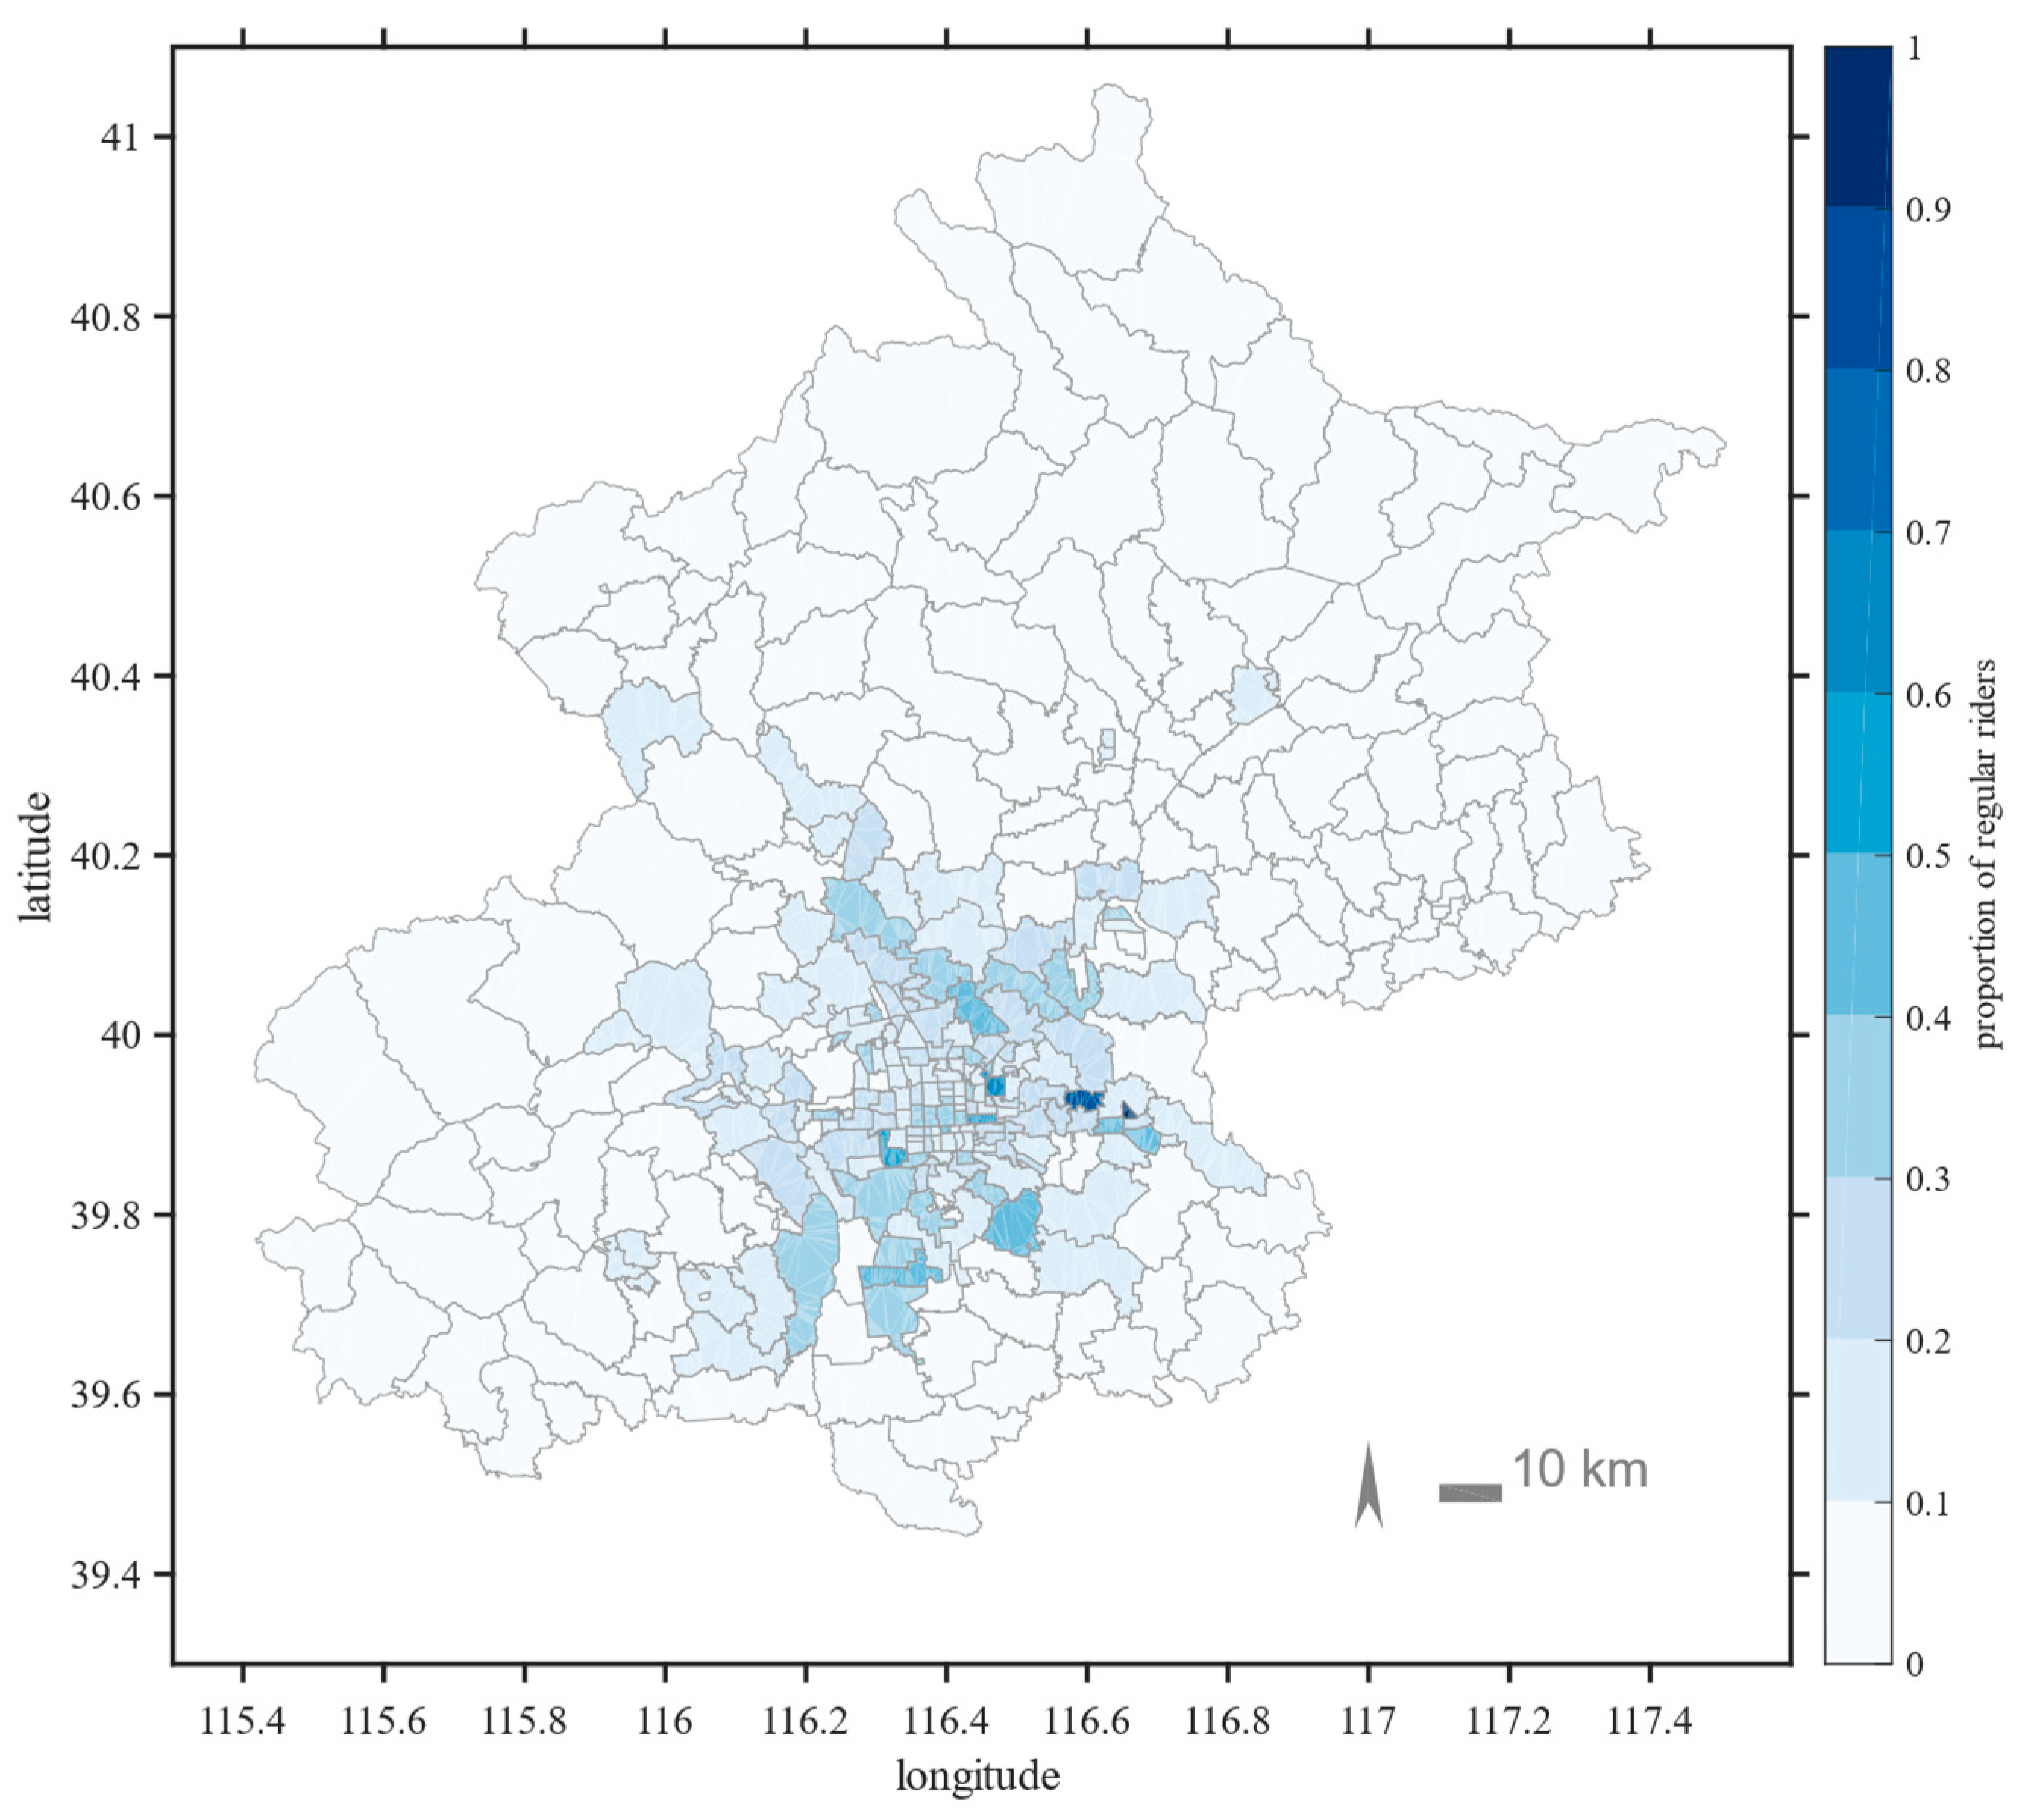
When the CSC was applied using sub-district borders, all the regular transit riders’ locations were projected into 306 cell zones same as Beijing’s 306 sub-districts. Ratios of the regular transit riders to residents were calculated in each cell zone, and the results were found to be different among sub-districts (Figure 4). The result shows it is unfair to use residential distribution as the basis of transit service planning. Ratios of the regular transit riders to residents are lower in the center areas than the near-suburban areas, contrary to our general intuition. This result obtained by data mining is consistent with the survey data used by Wang et al. (2011) [18]. Further examination is needed to explore whether the existing transit services fit the demands well.
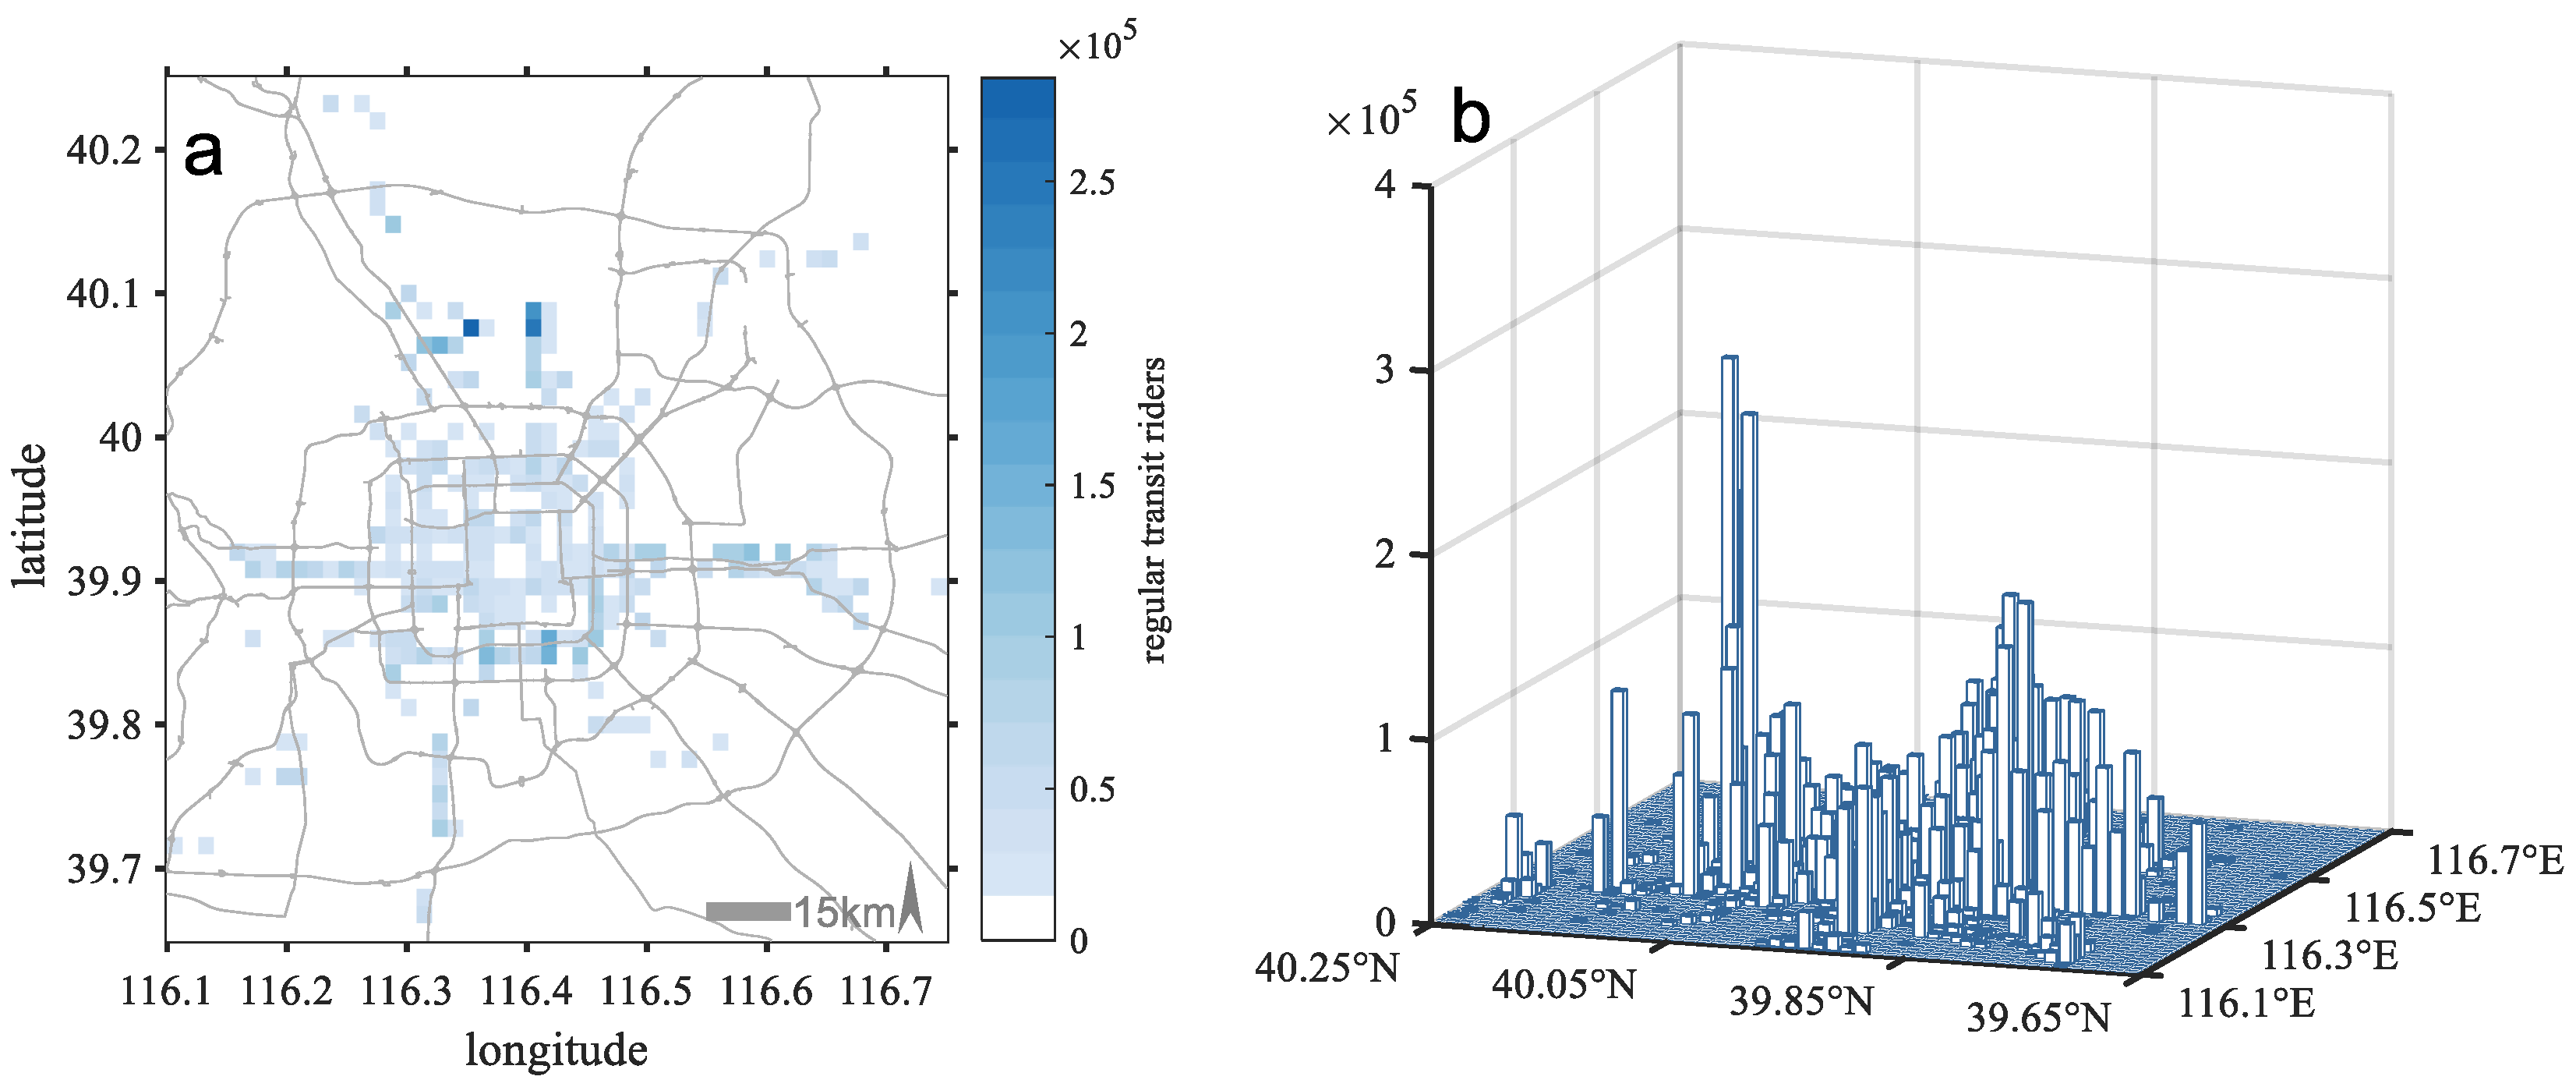
CSC based on sub-districts are limited, because the sub-districts are not in the same sizes and shapes. A gridded CSC was conducted to collect the regular riders with parameters m = 50, n = 50, [latiMIN, latiMAX] = [39.65, 40.25], and [longiMIN, longiMAX] = [116.1, 116.75]. As the spatial distribution of the regular riders was visualized in a closer view with the help of gridded CSC, the overall trend of regular transit riders’ numbers in cell zones did not decline straightly from the center to the periphery. Most riders were found distributed 5–20 km from the city center (Figure 5), and the top three cells of the sampling fishnets were approximately 20 km away from the city center.

4.3. Uncovering of Mismatched Public Transit Services

All the bus stops and metro stations were also projected in the same gridded cell zones as the regular transit riders as shown in Figure 6a. A declining trend was observed from center to periphery mode in Figure 6b.
The distribution patterns of regular transit riders and public transit stations signified a distinct mismatch between residents’ transit needs (Figure 5b) and public transit resources (Figure 6b). Two clear mismatches of regular riders and transit resources were found. The first region was located in the north of Beijing (20 km from the center), known as Tiantongyuan–Huilongguan Residential Area (near [E116.5, N40.07]), with regular transit riders being highly distributed, whereas the amount of transit service resources was small. The second region was the central areas of Beijing, in a radius of approximately 10 km, with transit resources being highly distributed and few regular riders living there. Ma et al. (2017) conducted a research on commuting patterns of Beijing transit users, and they found that Tiantongyuan–Huilongguan and another inner-city place named Fangzhuang (near [E116.4, N39.85]) had most commuting transit users [10]. However, they did not give further information about the condition of the transit service resources in these places. This study shows Tiantongyuan–Huilongguan has less public transport resources than Fangzhuang, and the former area needs be strengthened in transit service.
This mismatch is detailed in a bubble graph (Figure 7). The largest bubble represents a zone that has 220 thousand regular transit riders, and its position shows its distance to the city center and the ratio of regular transit riders to residents. In the heart of the city (within 5 km to the center), regular riders were smaller in number and ration than residents compared to the areas 5–20 km from the city center. Thus, in the most resource distributed heart areas, residents’ willingness to use public transit was relatively low. This work was unable to uncover reasons behind the phenomenon, but it is unreasonable to have the best-facilitated place with a relatively small number of regular users.

5. Conclusions and Implications

5.1. Conclusions

The method of L-MLE may serve as a useful solution to recognize regular transit users and their locations based on data mining. The mechanism of CSC is helpful in locating places where transit services mismatch regular users. The two tools can generate up-to-date demand analyses for researchers when transit data permit.
The proportions of residents who use public transit systems differ among sub-districts of Beijing. Over 5.37 million regular transit riders were recognized by the L-LME method, accounting for 74.5% of daily transit users in a week. Transit demands generated by regular transit riders require more attention.
The number of regular transit riders is large in the near-suburban areas (5–20 km to the center). In remote suburbs (> 30 km to the center), fewer residents are regular transit riders. In the heart of the city (< 5 km to the center), regular transit riders are not as high as in near-suburban areas.
Based on the mechanism of CSC, the spatial distribution of public transit resources declines straightly from the center to the periphery. This trend mismatches the distribution of regular transit riders in Beijing.

5.2. Implications for Transportation Policies and Limitations

In the near-suburban areas of Beijing, since both the number and proportion of regular transit riders are high, more attention should be paid to the problems of overload, resource shortage, and service shortage in the public transit system. The total number of regular transit riders in the remote suburbs of Beijing is small, constituting a small proportion of the total resident population. Therefore, a blunt increase of public transit investment should be avoided in the remote suburbs. The central areas of Beijing already have an advantage in public transit resources, so planners need to be cautious of making repeat investments in the central areas.
Data mining of transit data may provide fast analysis in transport management. However, some limitations to this approach also exist. Although the distribution of metro stations was found to be similar to that of bus stops, the differences in service ability between bus stops and metro stations were not considered. Only the transit demands generated by regular transit riders from their residential perspective are discussed, while the demands generated by their workplaces have not been addressed. Transit riders may choose to move to places with better transit service resources and affordable house prices, so decisions of transit resource allocation should not be simply made based on the mismatch condition. Further study is needed to improve the approach taken, and to address the causes of the aforementioned mismatches.

Author Contributions

Conceptualization, Haitao Jin and Fengjun Jin; Methodology and Technical Realization, He Zhu and Haitao Jin; Writing, Haitao Jin and He Zhu.

Funding

The work in this paper was supported by the Strategic Priority Research Program of the Chinese Academy of Sciences (Grant No. XDA19040402, XDA19040403) and National Natural Science Foundation of China (No. 41771134).

Acknowledgments

The authors are thankful to Zheng Zhi for helping in constructing the paper structure.

Conflicts of Interest

The authors declare no conflict of interest.

References

  1. Cheng, Y.-H.; Chen, S.-Y. Perceived accessibility, mobility, and connectivity of public transportation systems. Transp. Res. Part A 2015, 77, 386–403. [Google Scholar] [CrossRef]
  2. Samuelson, P.A. The Pure Theory of Public Expenditure. Rev. Econ. Stat. 1954, 36, 387. [Google Scholar] [CrossRef]
  3. Taleai, M.; Sliuzas, R.; Flacke, J. An integrated framework to evaluate the equity of urban public facilities using spatial multi-criteria analysis. Cities 2014, 40, 56–69. [Google Scholar] [CrossRef]
  4. Murray, A.T. Strategic analysis of public transport coverage. Socio-Econ. Plan. Sci. 2001, 35, 175–188. [Google Scholar] [CrossRef]
  5. Hodkinson, G. Equity in Sydney’s Public Transport. (Transport Preprints of Papers); Institution of Engineers: Barton, ACT, Australia, 1985; pp. 14–19. [Google Scholar]
  6. Boyle, D.K.; Foote, P.J.; Karash, K.H. Public transportation marketing and fare policy. Transportation in the New Millennium. Available online: http://onlinepubs.trb.org/onlinepubs/millennium/00093.pdf (accessed on 4 December 2018).
  7. Nutley, S. Urban Transport, Environment and Equity: The case for developing countries by E. Vasconcellos. Geography 2002, 4, 373–374. [Google Scholar]
  8. Ta, N.; Chai, Y.; Zhang, Y.; Sun, D. Understanding job-housing relationship and commuting pattern in Chinese cities: Past, present and future. Transp. Res. D: Transp. Environ. 2017, 52, 562–573. [Google Scholar] [CrossRef]
  9. Zhao, P.; Lu, B.; De Roo, G. Impact of the jobs-housing balance on urban commuting in Beijing in the transformation era. J. Transp. Geogr. 2011, 19, 59–69. [Google Scholar] [CrossRef]
  10. Ma, X.; Liu, C.; Wen, H.; Wang, Y.; Wu, Y.-J. Understanding commuting patterns using transit smart card data. J. Transp. Geogr. 2017, 58, 135–145. [Google Scholar] [CrossRef]
  11. Martens, K.; Golub, A.; Robinson, G. A justice-theoretic approach to the distribution of transportation benefits: Implications for transportation planning practice in the United States. Transp. Res. Part A 2012, 46, 684–695. [Google Scholar] [CrossRef] [Green Version]
  12. Iseki, H. Equity in Regional Public Transit Finance: Tradeoffs between Social and Geographic Equity. J. Plan. Dev. 2016, 142, 4016010. [Google Scholar] [CrossRef]
  13. Georgiadis, G.; Politis, I.; Papaioannou, P. Measuring and improving the efficiency and effectiveness of bus public transport systems. Res. Transp. Econ. 2014, 48, 84–91. [Google Scholar] [CrossRef]
  14. Sinha, K.C.; Parsons, J.N.; Barnum, D.T.; Sharaf, E.A. Development and implementation of a performance-based state transit subsidy allocation formula for indiana. Transp. Res. Rec. 1986, 1076, 30–38. [Google Scholar]
  15. Forkenbrock, D.J. Transit assistance allocation: Further research findings. Transp. Res. A: Gen. 1981, 15, 363–365. [Google Scholar] [CrossRef]
  16. Ricciardi, A.M.; Xia, J.C.; Currie, G. Exploring public transport equity between separate disadvantaged cohorts: A case study in Perth, Australia. J. Transp. Geogr. 2015, 43, 111–122. [Google Scholar] [CrossRef]
  17. Chowdhury, S.; Govender, D.; Govender, D.; Ceder, A.A. Assessing Connectivity Equity of a Regional Public Transport Network. In Proceedings of the Transportation Research 96th Annual Meeting, Washington, DC, USA, 8 January 2017. [Google Scholar]
  18. Wang, E.; Song, J.; Xu, T. From “spatial bond” to “spatial mismatch”: An assessment of changing jobs–housing relationship in Beijing. Habitat Int. 2011, 35, 398–409. [Google Scholar] [CrossRef]
  19. De Vos, J.; Derudder, B.; Van Acker, V.; Witlox, F. Reducing car use: Changing attitudes or relocating? The influence of residential dissonance on travel behavior. J. Transp. Geogr. 2012, 22, 1–9. [Google Scholar] [CrossRef]
  20. Gebresselassie, M.; Sanchez, T.W. “Smart” Tools for Socially Sustainable Transport: A Review of Mobility Apps. Urb. Sci. 2018, 2, 45. [Google Scholar] [CrossRef]
  21. Guzman, L.A.; Oviedo, D.; Rivera, C. Assessing equity in transport accessibility to work and study: The Bogotá region. J. Transp. Geogr. 2017, 58, 236–246. [Google Scholar] [CrossRef]
  22. Chu, K.K.A.; Chapleau, R. Augmenting transit trip characterization and travel behavior comprehension: Multiday location-stamped smart card transactions. Transp. Res. Rec.: J. Transp. Res. Board 2010, 2183, 29–40. [Google Scholar] [CrossRef]
  23. Munizaga, M.A.; Palma, C. Estimation of a disaggregate multimodal public transport Origin–Destination matrix from passive smartcard data from Santiago, Chile. Transp. Res. C: Emerg. Technol. 2012, 24, 9–18. [Google Scholar] [CrossRef]
  24. Trépanier, M.; Morency, C. Assessing transit loyalty with smart card data. In Proceedings of the 12th World Conference on Transport Research, Lisbon, Portugal, 11–15 July 2010. [Google Scholar]
  25. Pelletier, M.-P.; Trepanier, M.; Morency, C. Smart card data use in public transit: A literature review. Transp. Res. C: Emerg. Technol. 2011, 19, 557–568. [Google Scholar] [CrossRef]
  26. Hägerstraand, T. What about people in regional science? Reg. Sci. 1970, 24, 7–24. [Google Scholar] [CrossRef]
  27. Simini, F.; González, M.C.; Maritan, A.; Barabasi, A.-L. A universal model for mobility and migration patterns. Nature 2012, 484, 96–100. [Google Scholar] [CrossRef] [Green Version]
  28. Kaplan, S.; Popoks, D.; Prato, C.G.; Ceder, A. (Avi) Using connectivity for measuring equity in transit provision. J. Transp. Geogr. 2014, 37, 82–92. [Google Scholar] [CrossRef]
  29. Jang, S.; An, Y.; Yi, C.; Lee, S. Assessing the spatial equity of Seoul’s public transportation using the Gini coefficient based on its accessibility. Int. J. Urb. Sci. 2017, 21, 91–107. [Google Scholar] [CrossRef]
  30. El-Geneidy, A.; Levinson, D.; Diab, E.; Boisjoly, G.; Verbich, D.; Loong, C. The cost of equity: Assessing transit accessibility and social disparity using total travel cost. Transp. Res. Part A 2016, 91, 302–316. [Google Scholar] [CrossRef]
  31. Durand, C.P.; Tang, X.; Gabriel, K.P.; Sener, I.N.; Oluyomi, A.O.; Knell, G.; Kohl III, H.W. The association of trip distance with walking to reach public transit: Data from the California household travel survey. J. Transp. Health 2016, 3, 154–160. [Google Scholar] [CrossRef]
Figure 1. Distribution of bus stops and metro stations in Beijing.
Ijgi 08 00186 g001
Figure 2. The procedure of discerning regular transit riders.
Ijgi 08 00186 g002
Figure 3. (a) Overnight displacements and (b) night return times of regular riders.
Ijgi 08 00186 g003
Figure 4. Spatial differences of regular transit rider ratios.
Ijgi 08 00186 g004
Figure 5. (a) Spatial distribution of regular transit riders and (b) 3D visualization.
Ijgi 08 00186 g005
Figure 6. (a) Distribution of transit resources and (b) 3D visualization.
Ijgi 08 00186 g006
Figure 7. Center–periphery distribution of regular transit riders in number and ratios.
Ijgi 08 00186 g007
Table 1. Information of 306 sub-districts in Beijing.
MinMaxMeanStandard DeviationQuartile 1MedianQuartile 3
area (km2)0.92 382.05 53.61 66.98 5.48 30.82 76.00
residents (10 000)0.20 35.94 6.07 5.44 2.20 4.50 8.40
density (person/km2)16.57 45058.30 8189.66 10555.29 380.83 1910.42 15018.27
Table 2. Coverage of identified regular transit riders.
Aug. 7thAug. 8thAug. 9thAug. 10thAug. 11thAug. 12thAug. 13th
Daily users 3279116489894549762104840163472105847638733411117
Regular riders2181937369057237702703726535365704836507992372743
Coverage66.5%75.3%75.8%77.0%77.5%76.6%69.6%