Eye-tracking Evaluation of Weather Web Maps


Abstract
:1. Introduction
1.1. Weather Maps
1.2. Geovisualization Methods
2. Materials and Methods
2.1. Materials – Description of Selected Web Maps
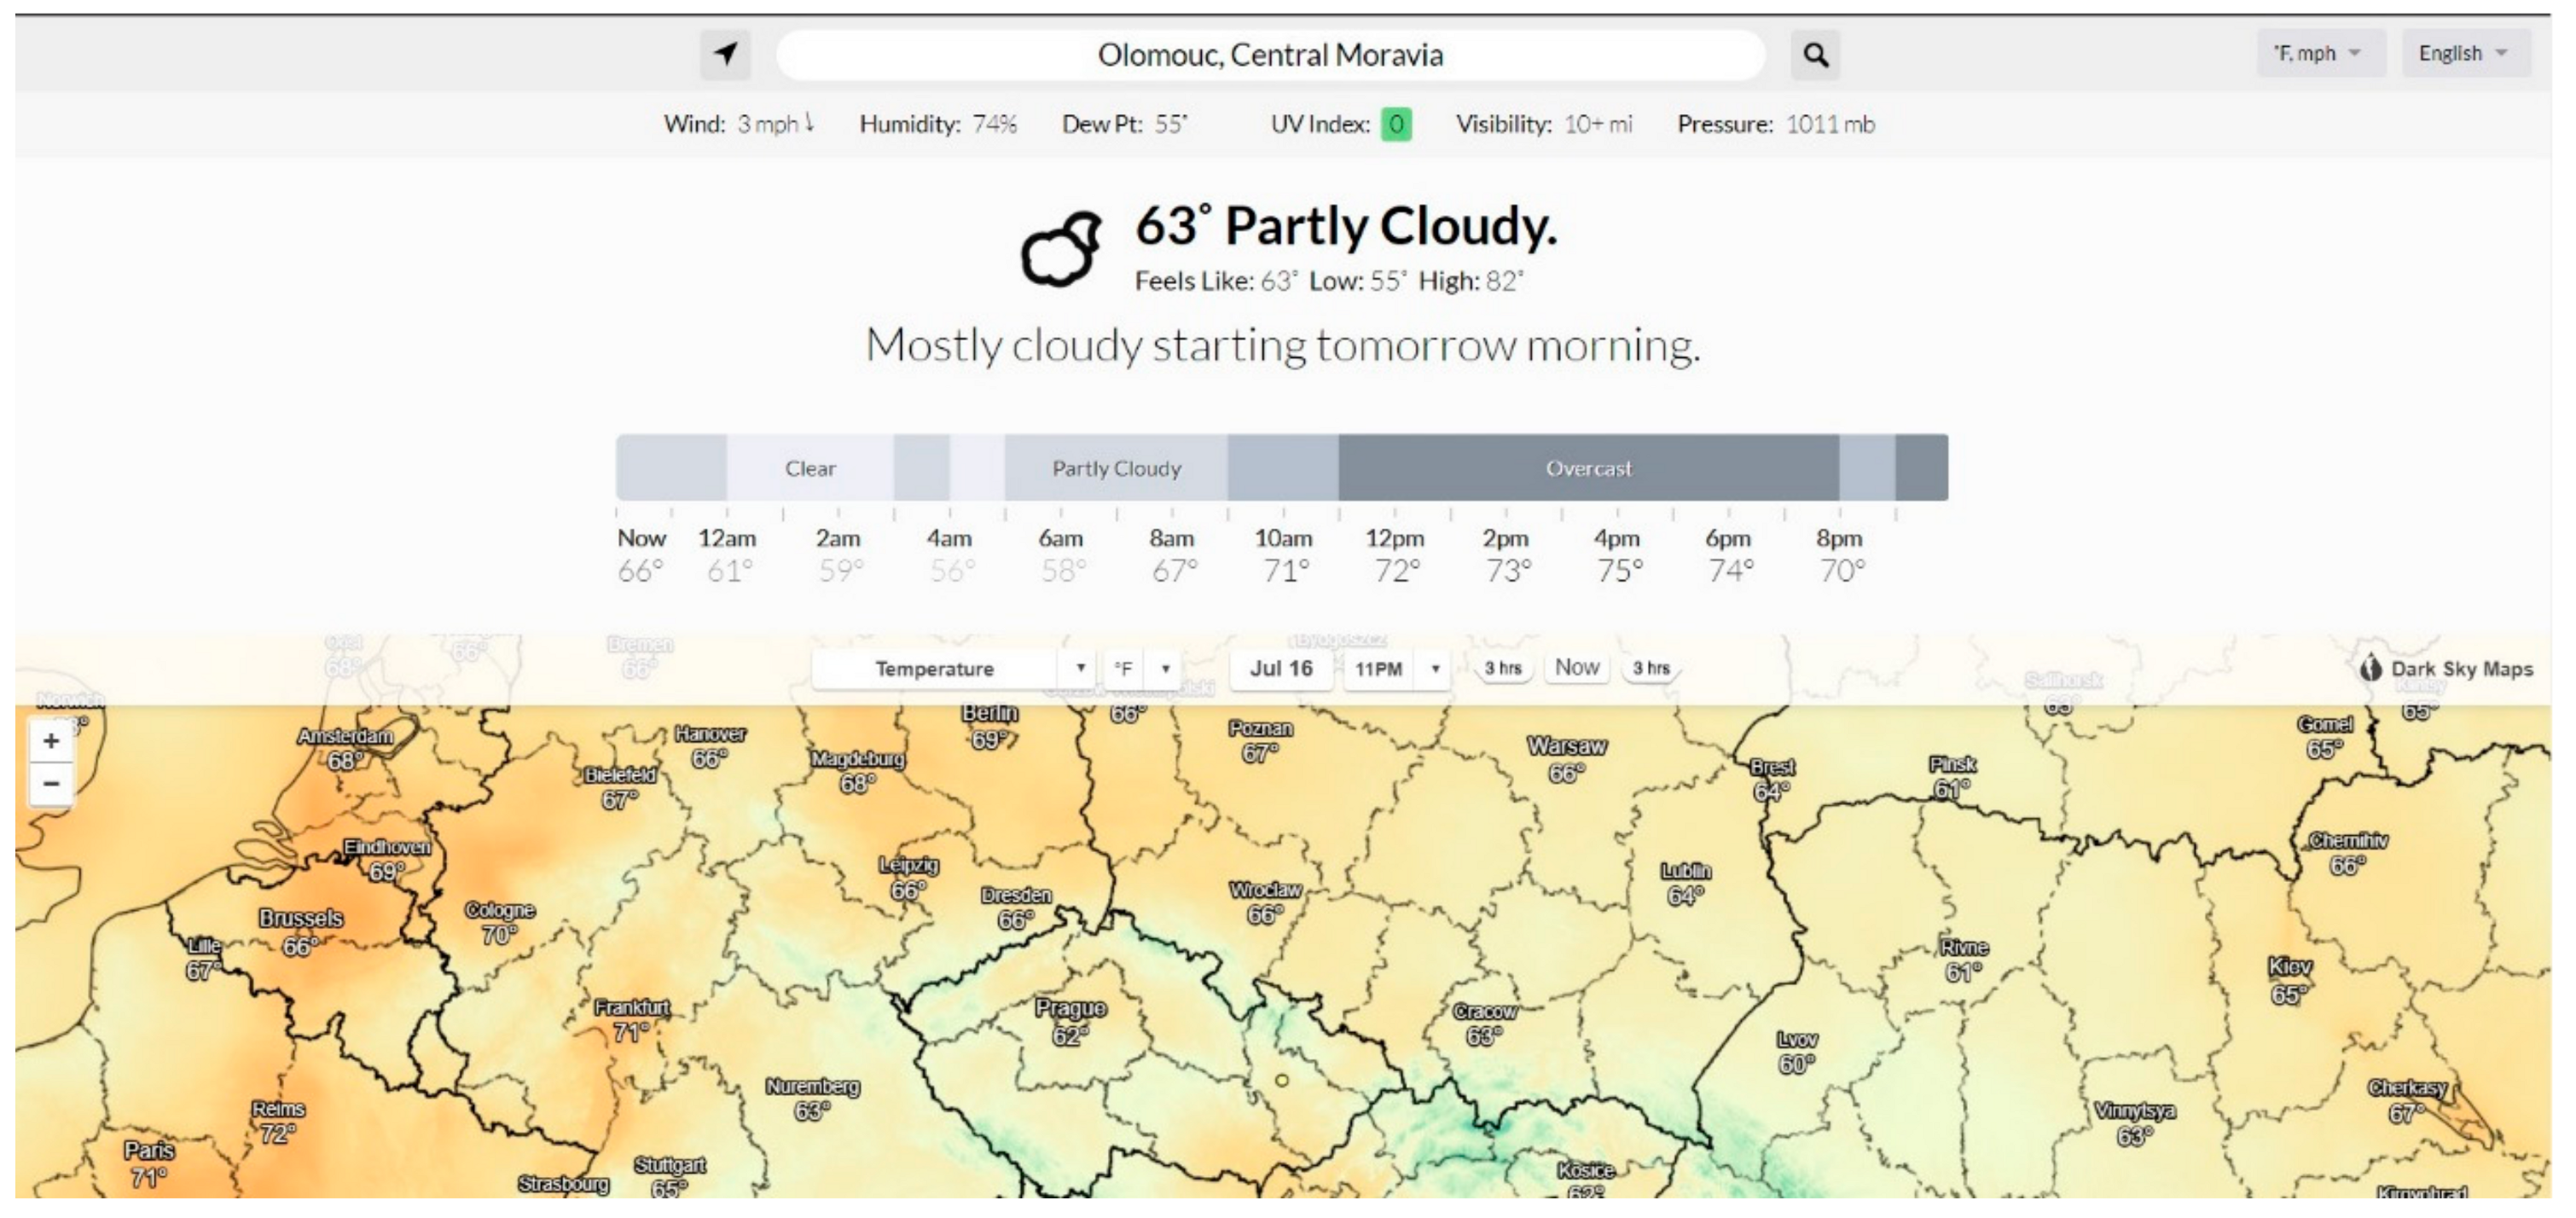
2.1.1. Dark Sky
2.1.2. Windy
2.1.3. In-Počasí
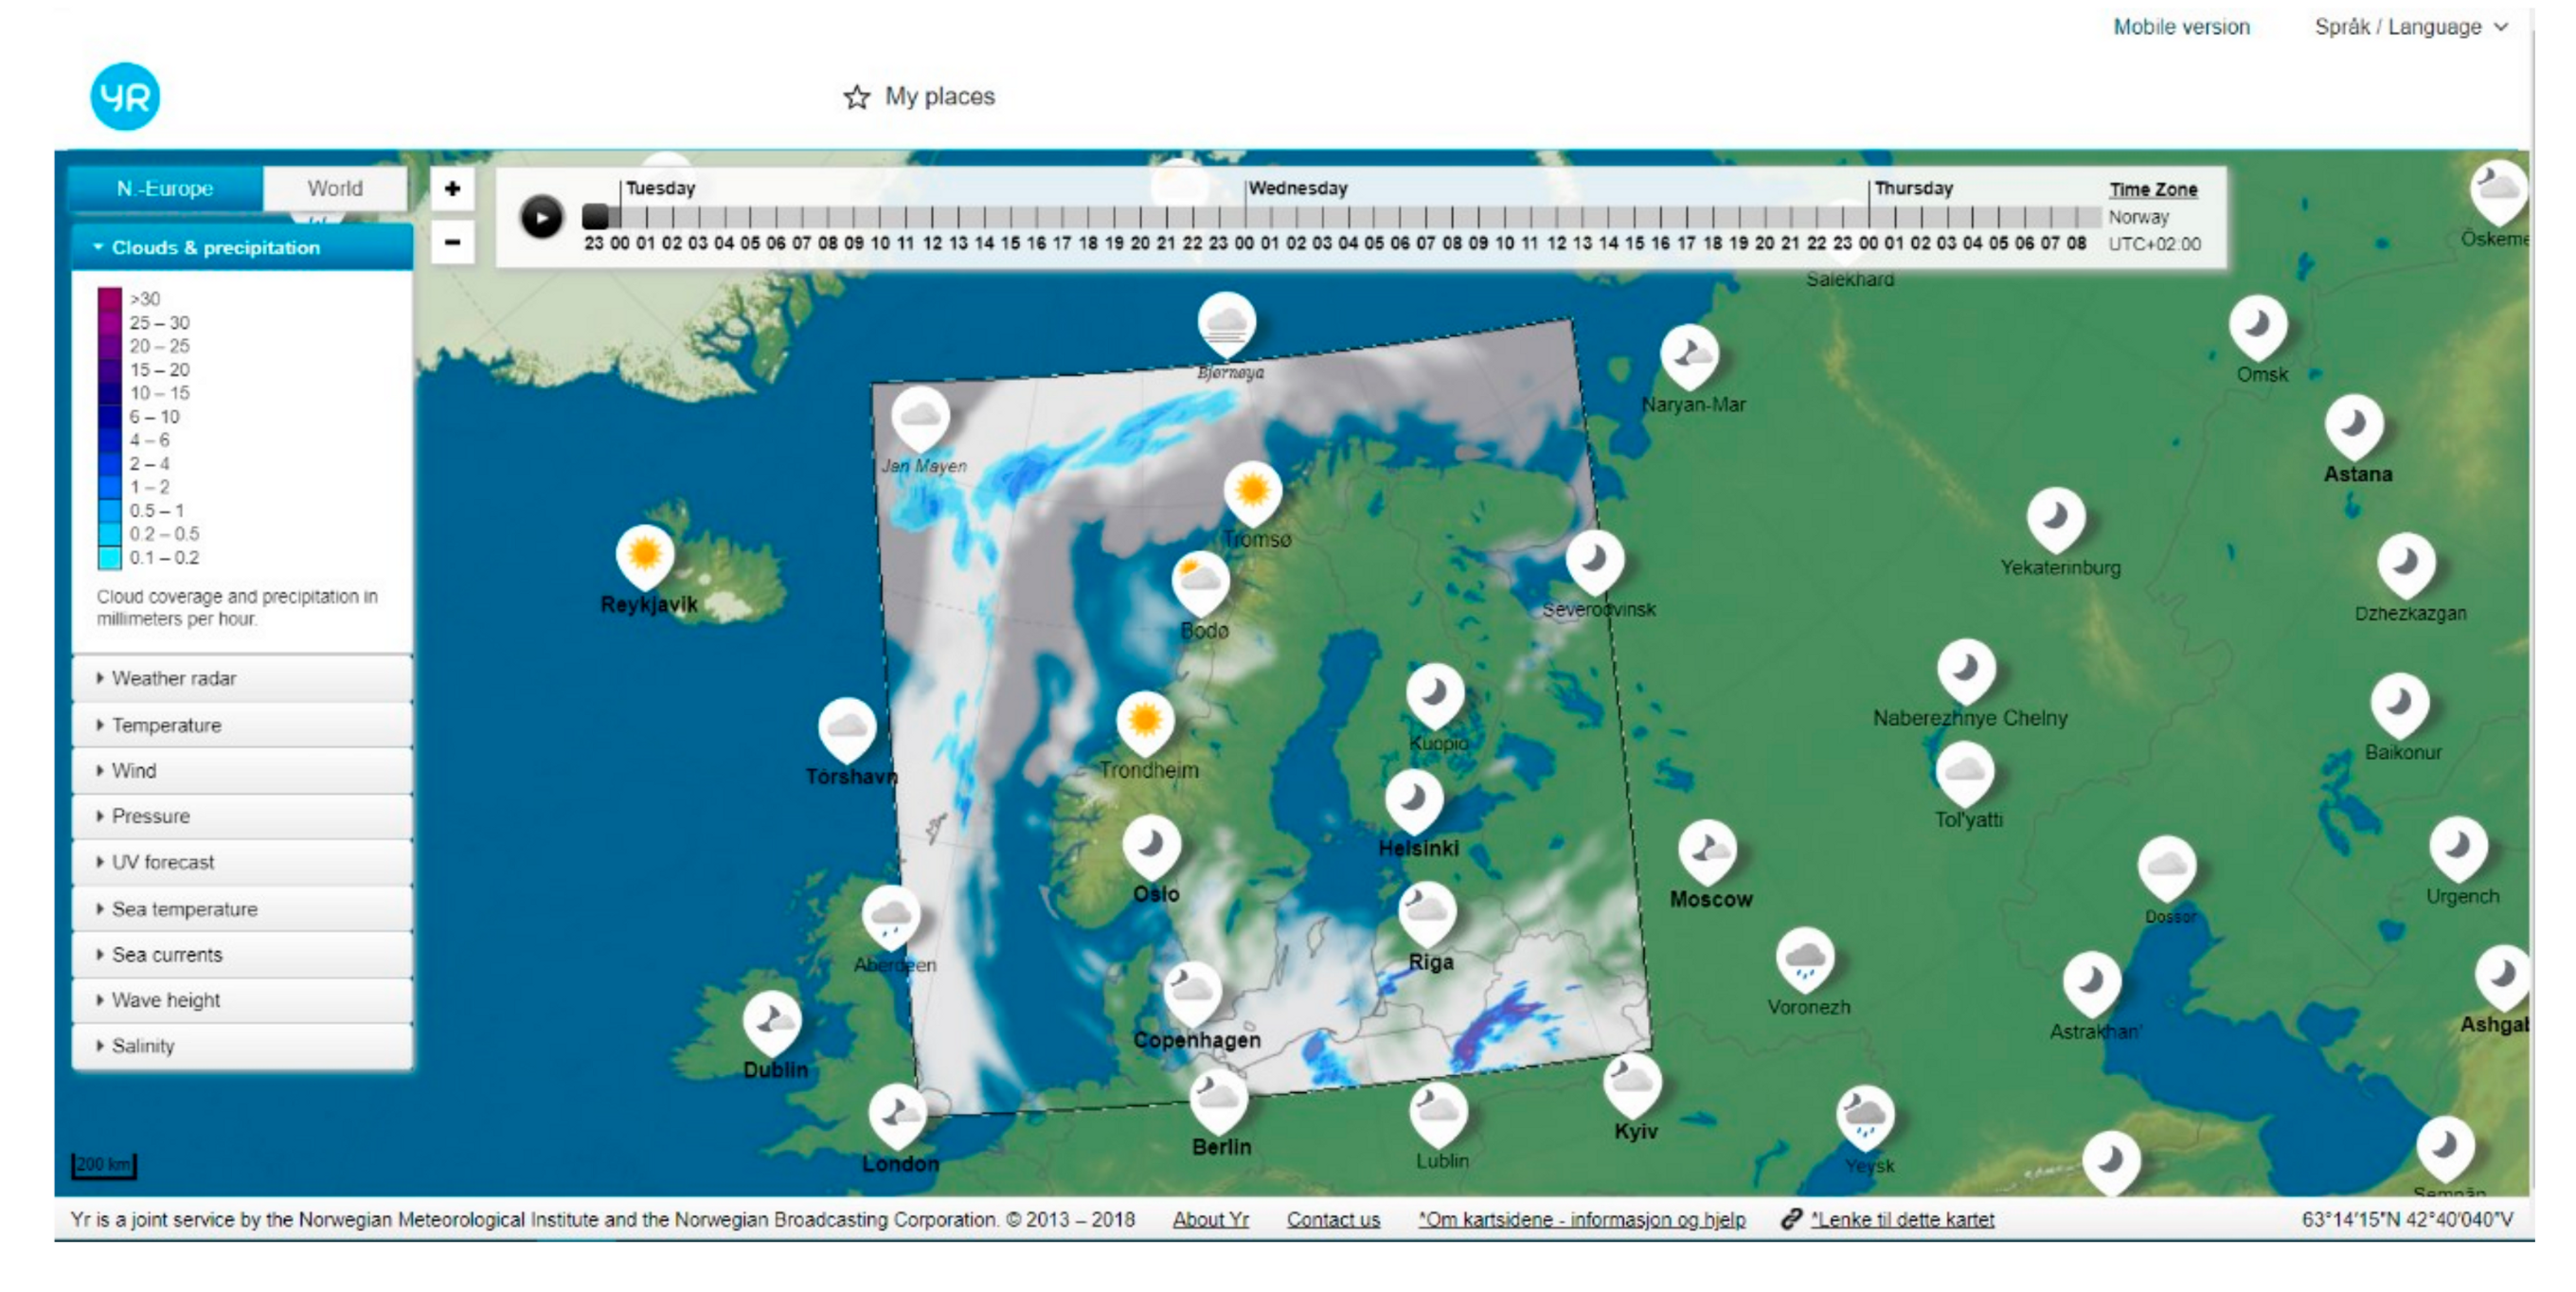
2.1.4. YR.no
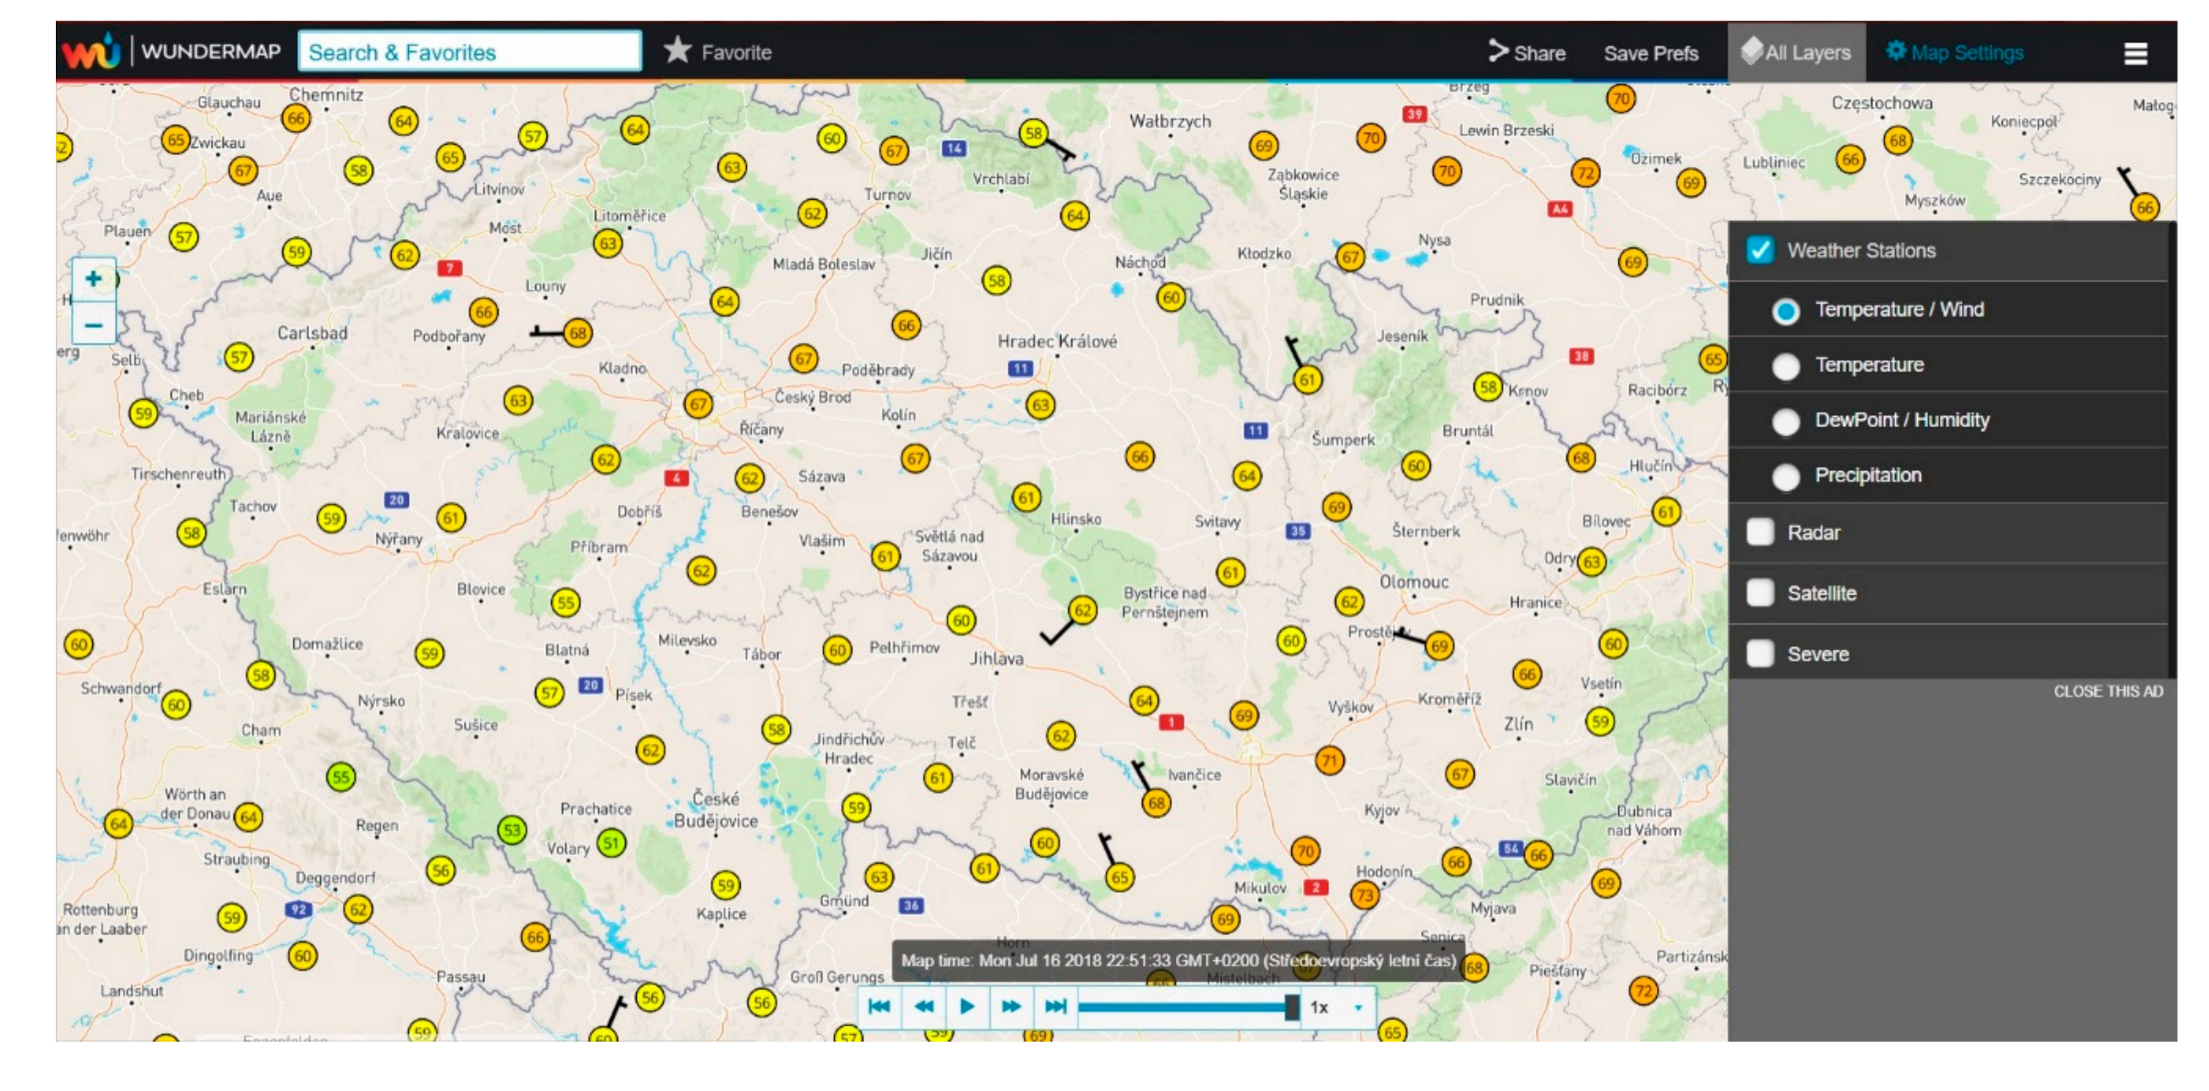
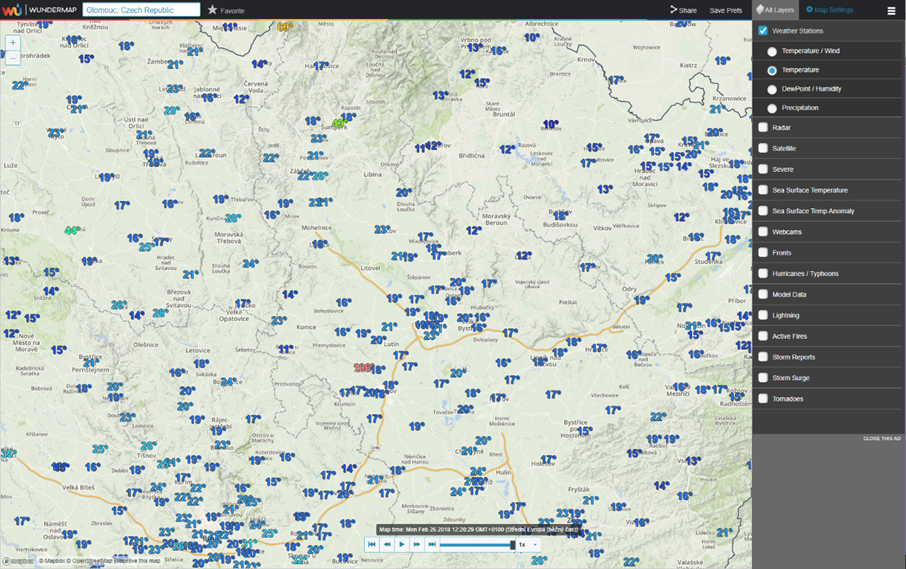
2.1.5. Wundermap
2.2. Methods
2.2.1. Design of the Experiment
2.2.2. Respondents
2.2.3. Analytical Methods
3. Results
3.1. Accuracy of Answers
3.2. Eye-tracking Results
3.2.1. Introductory Test Section Results
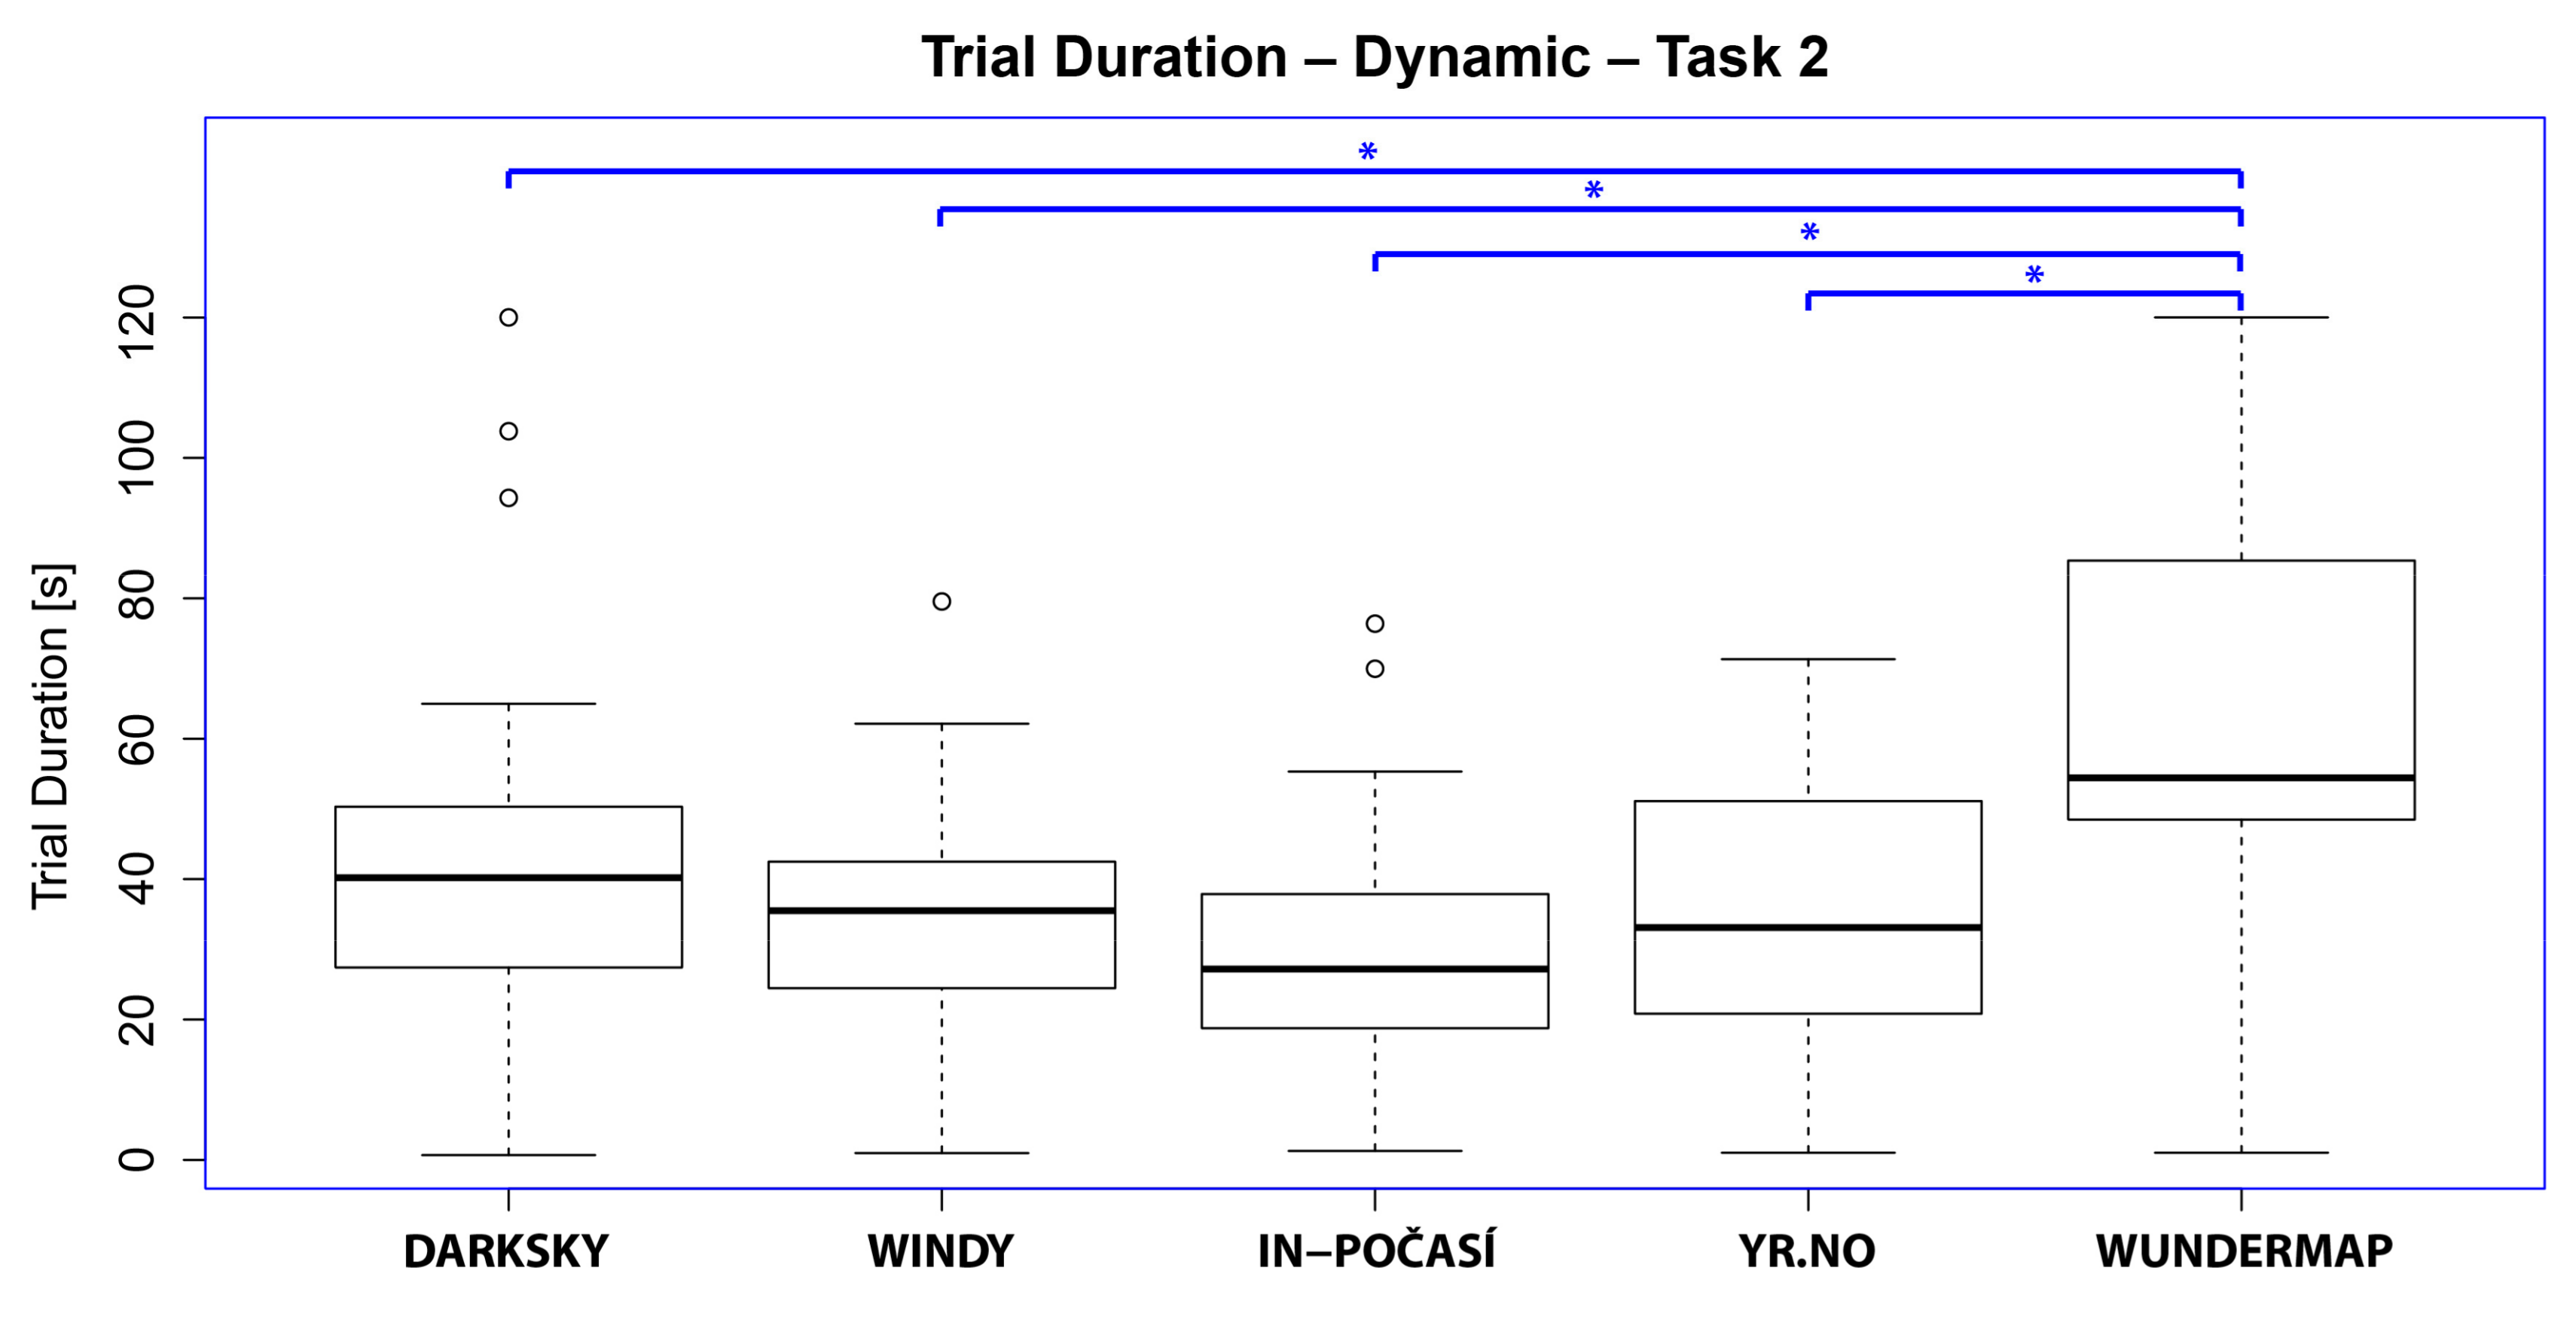
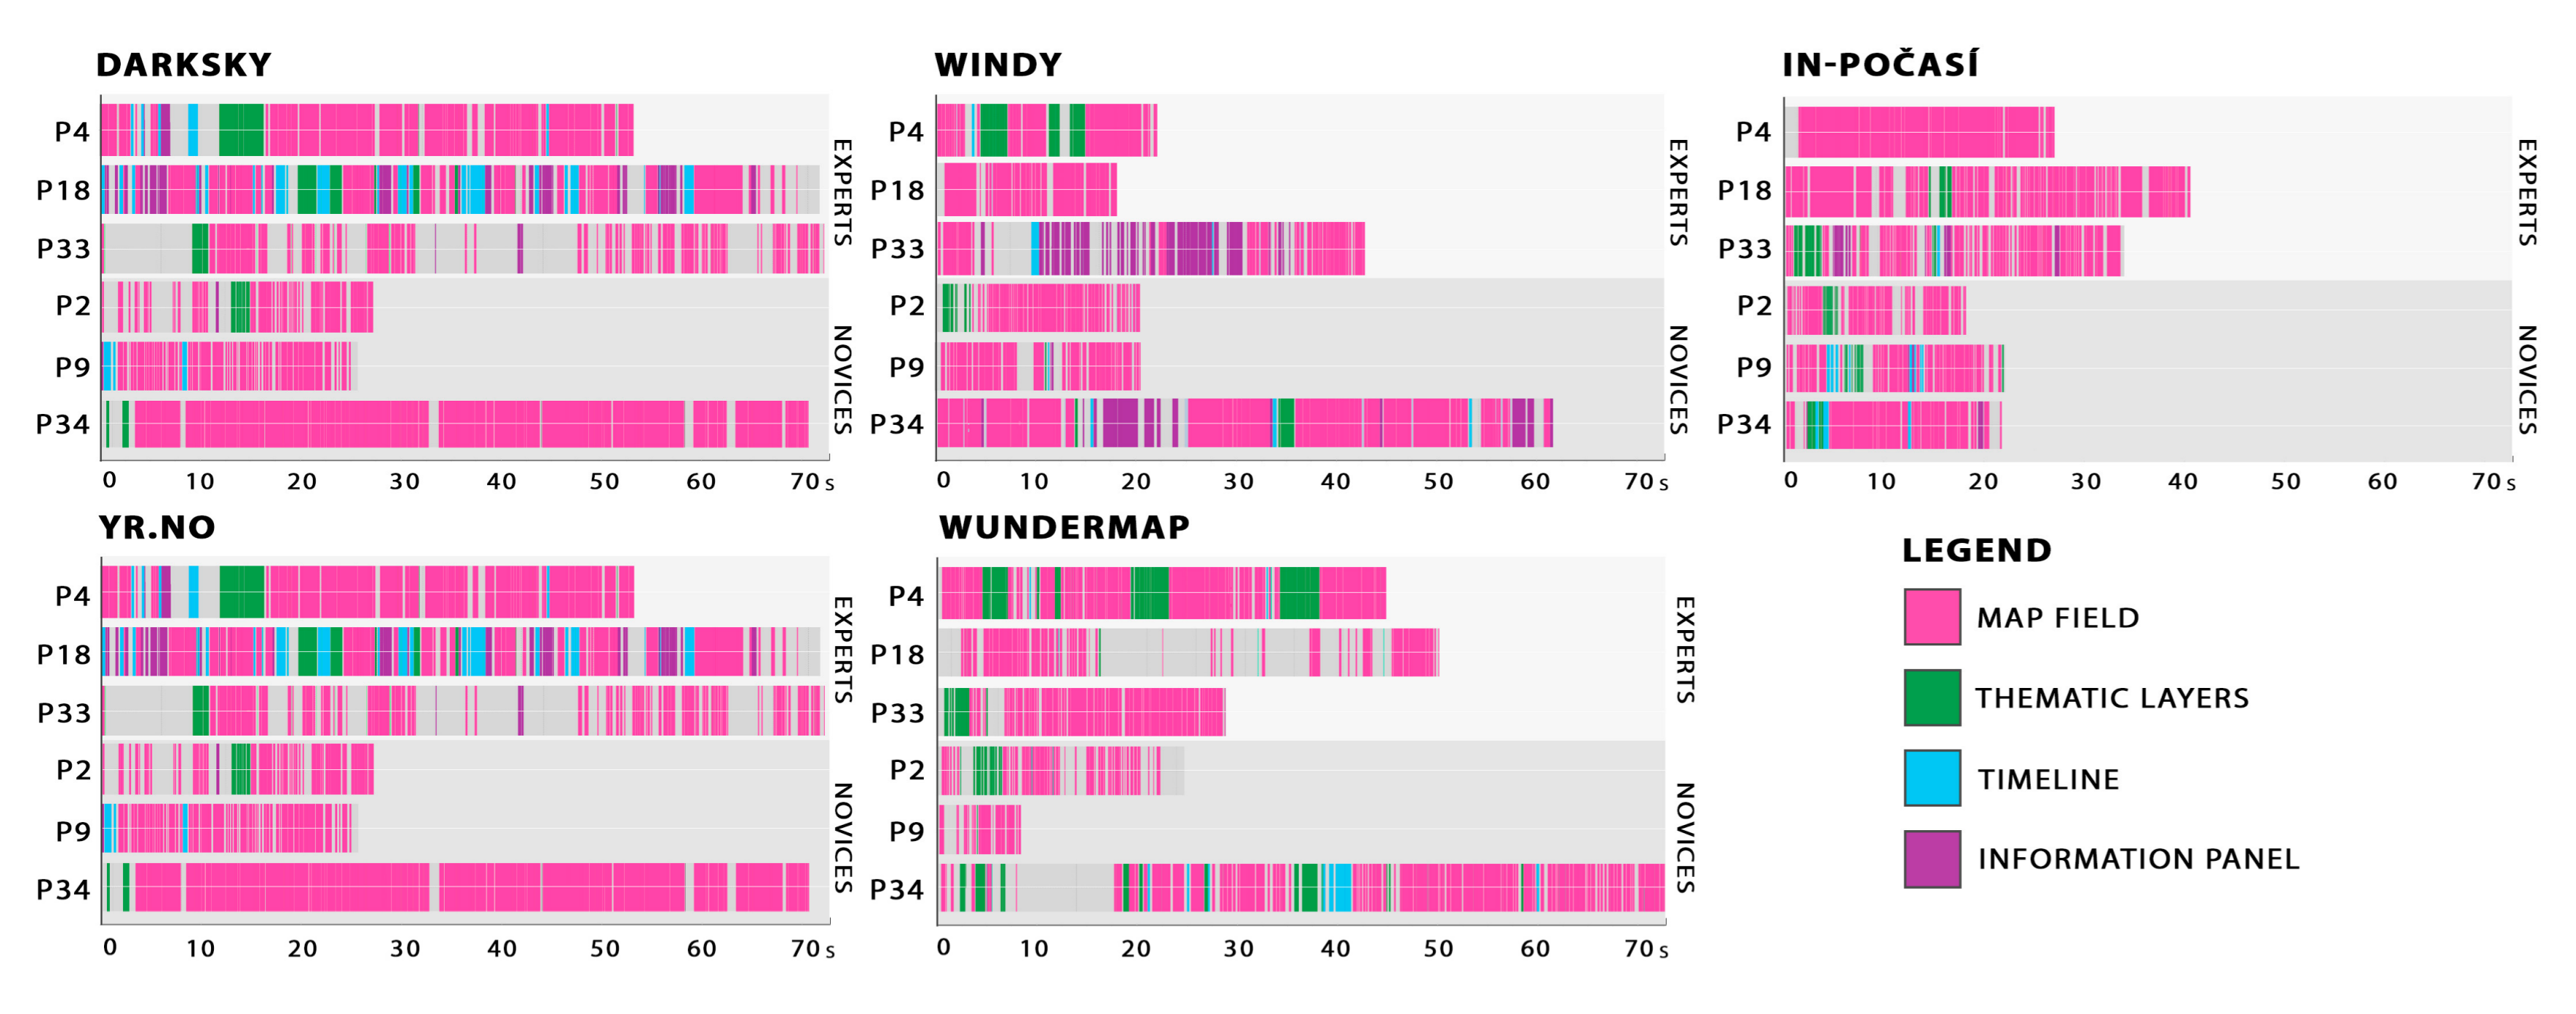
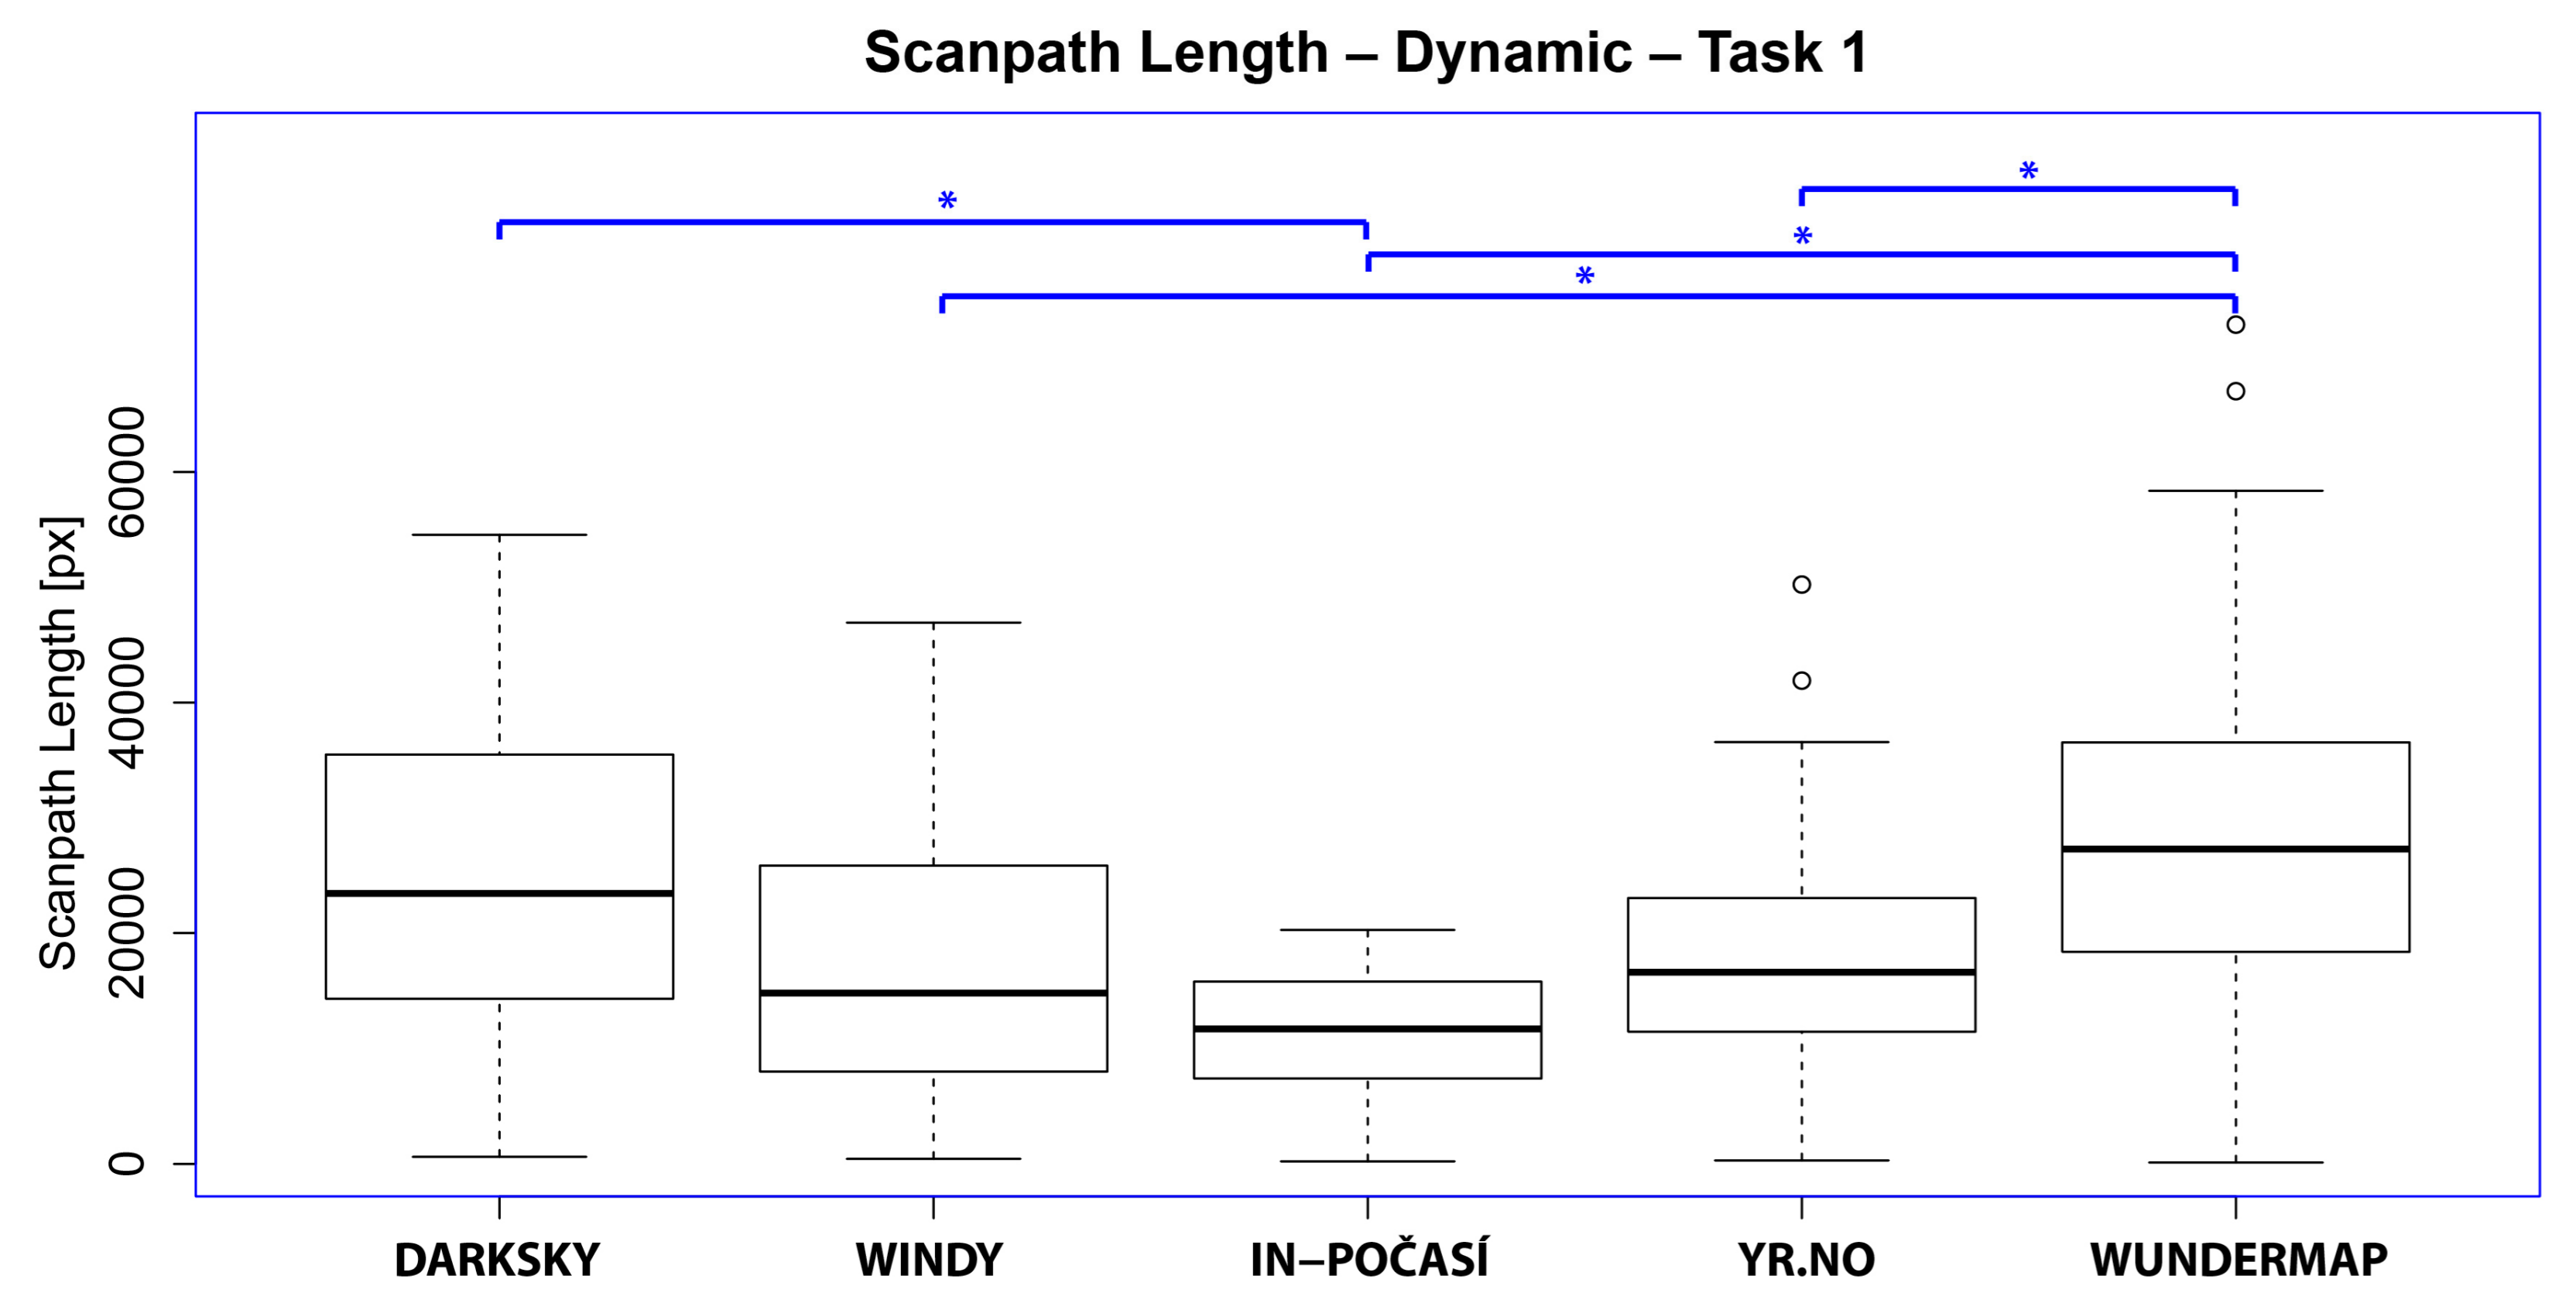
3.2.2. Dynamic Test Section Results
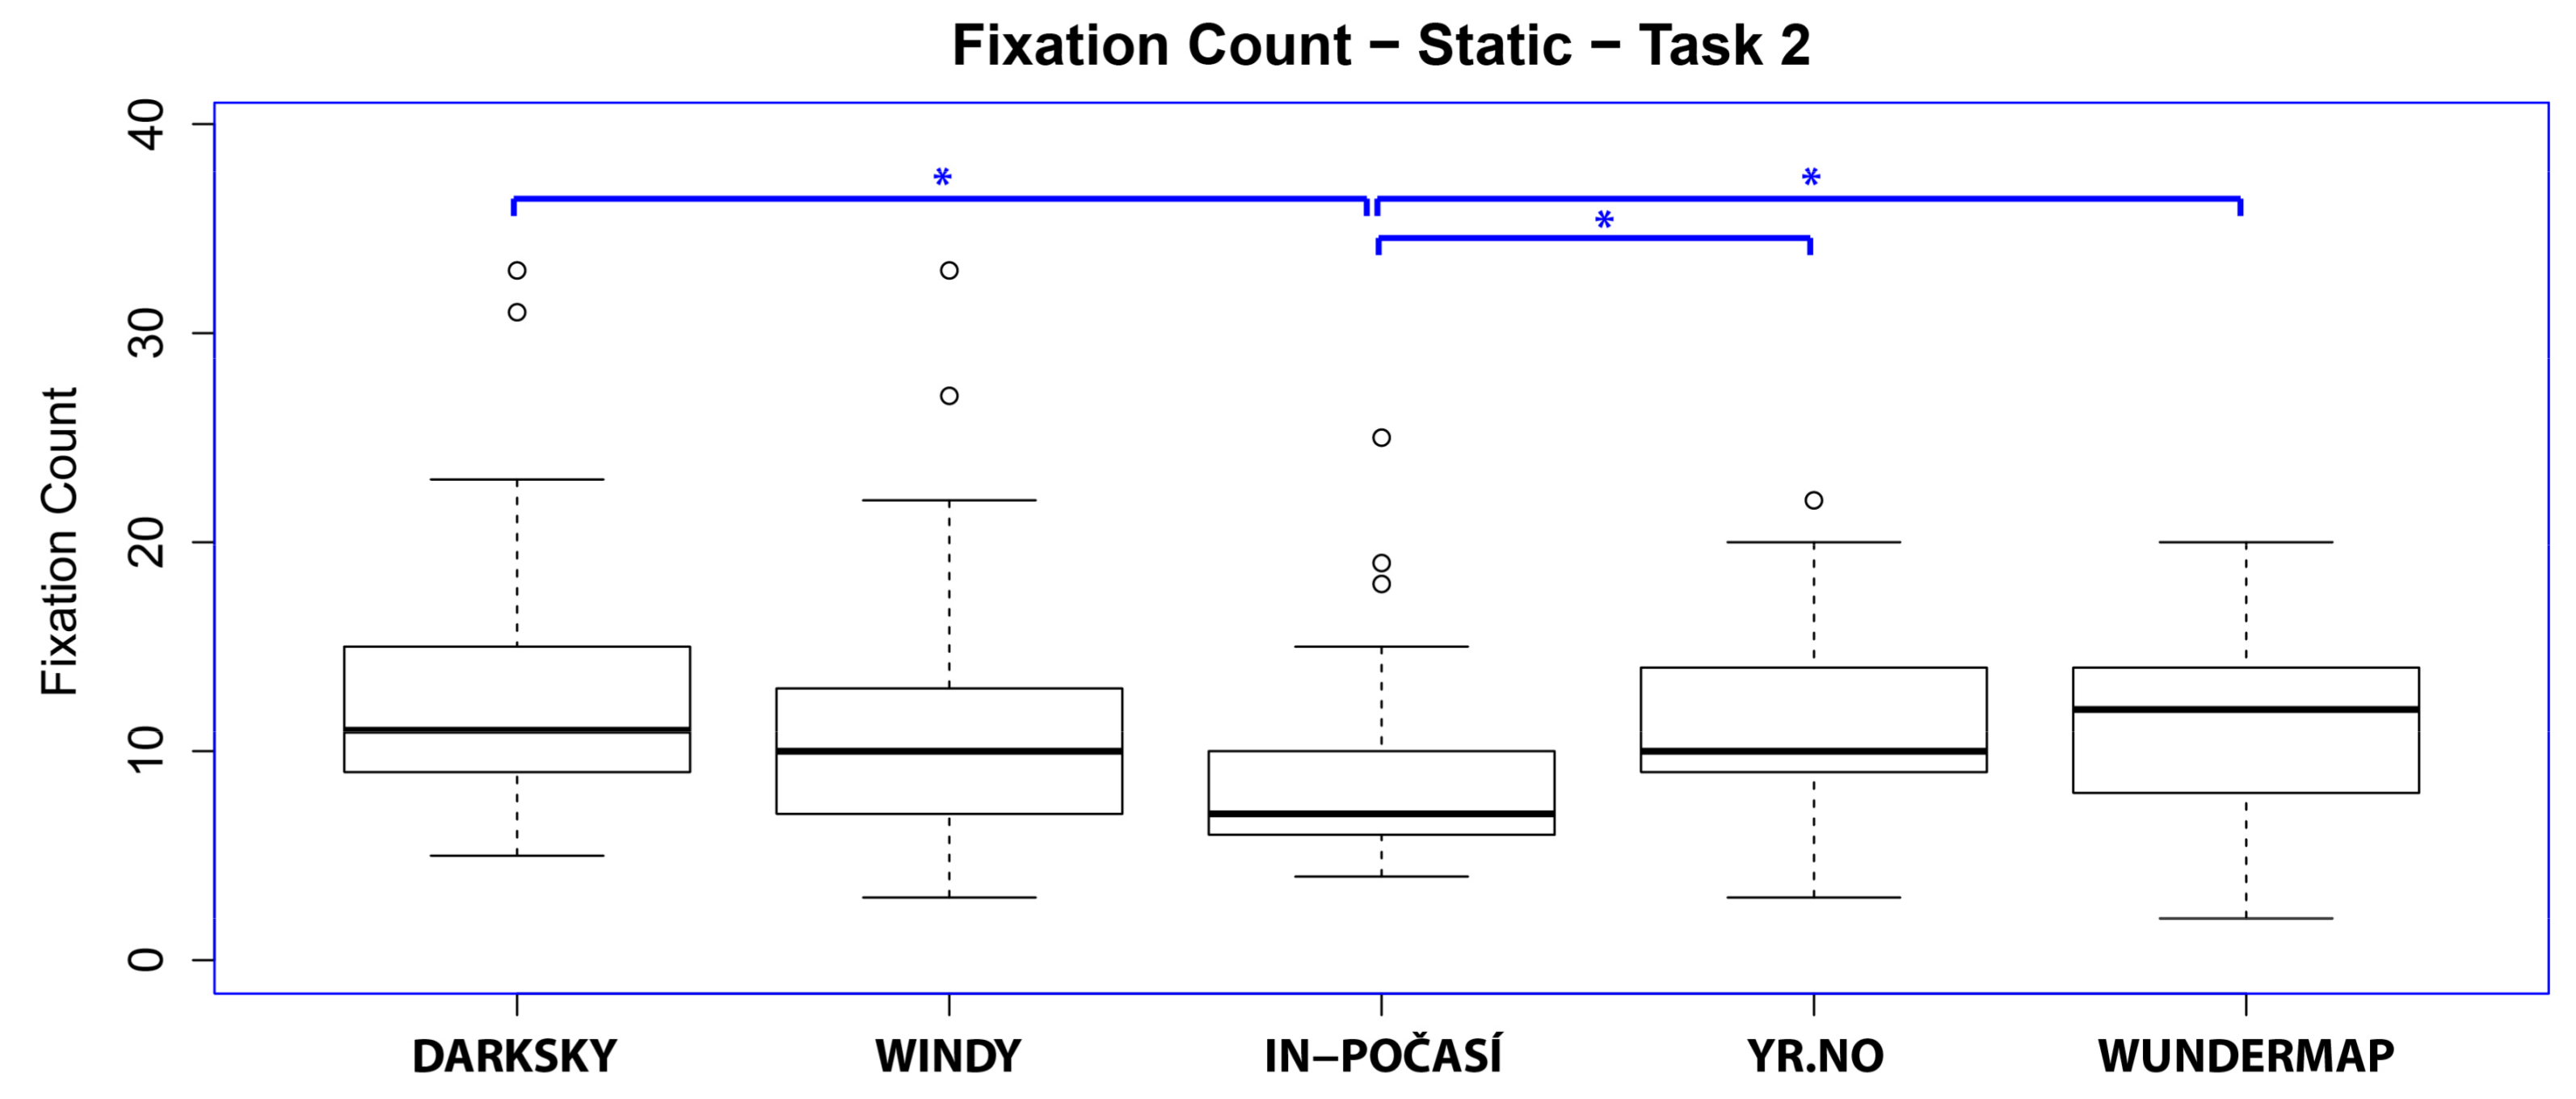
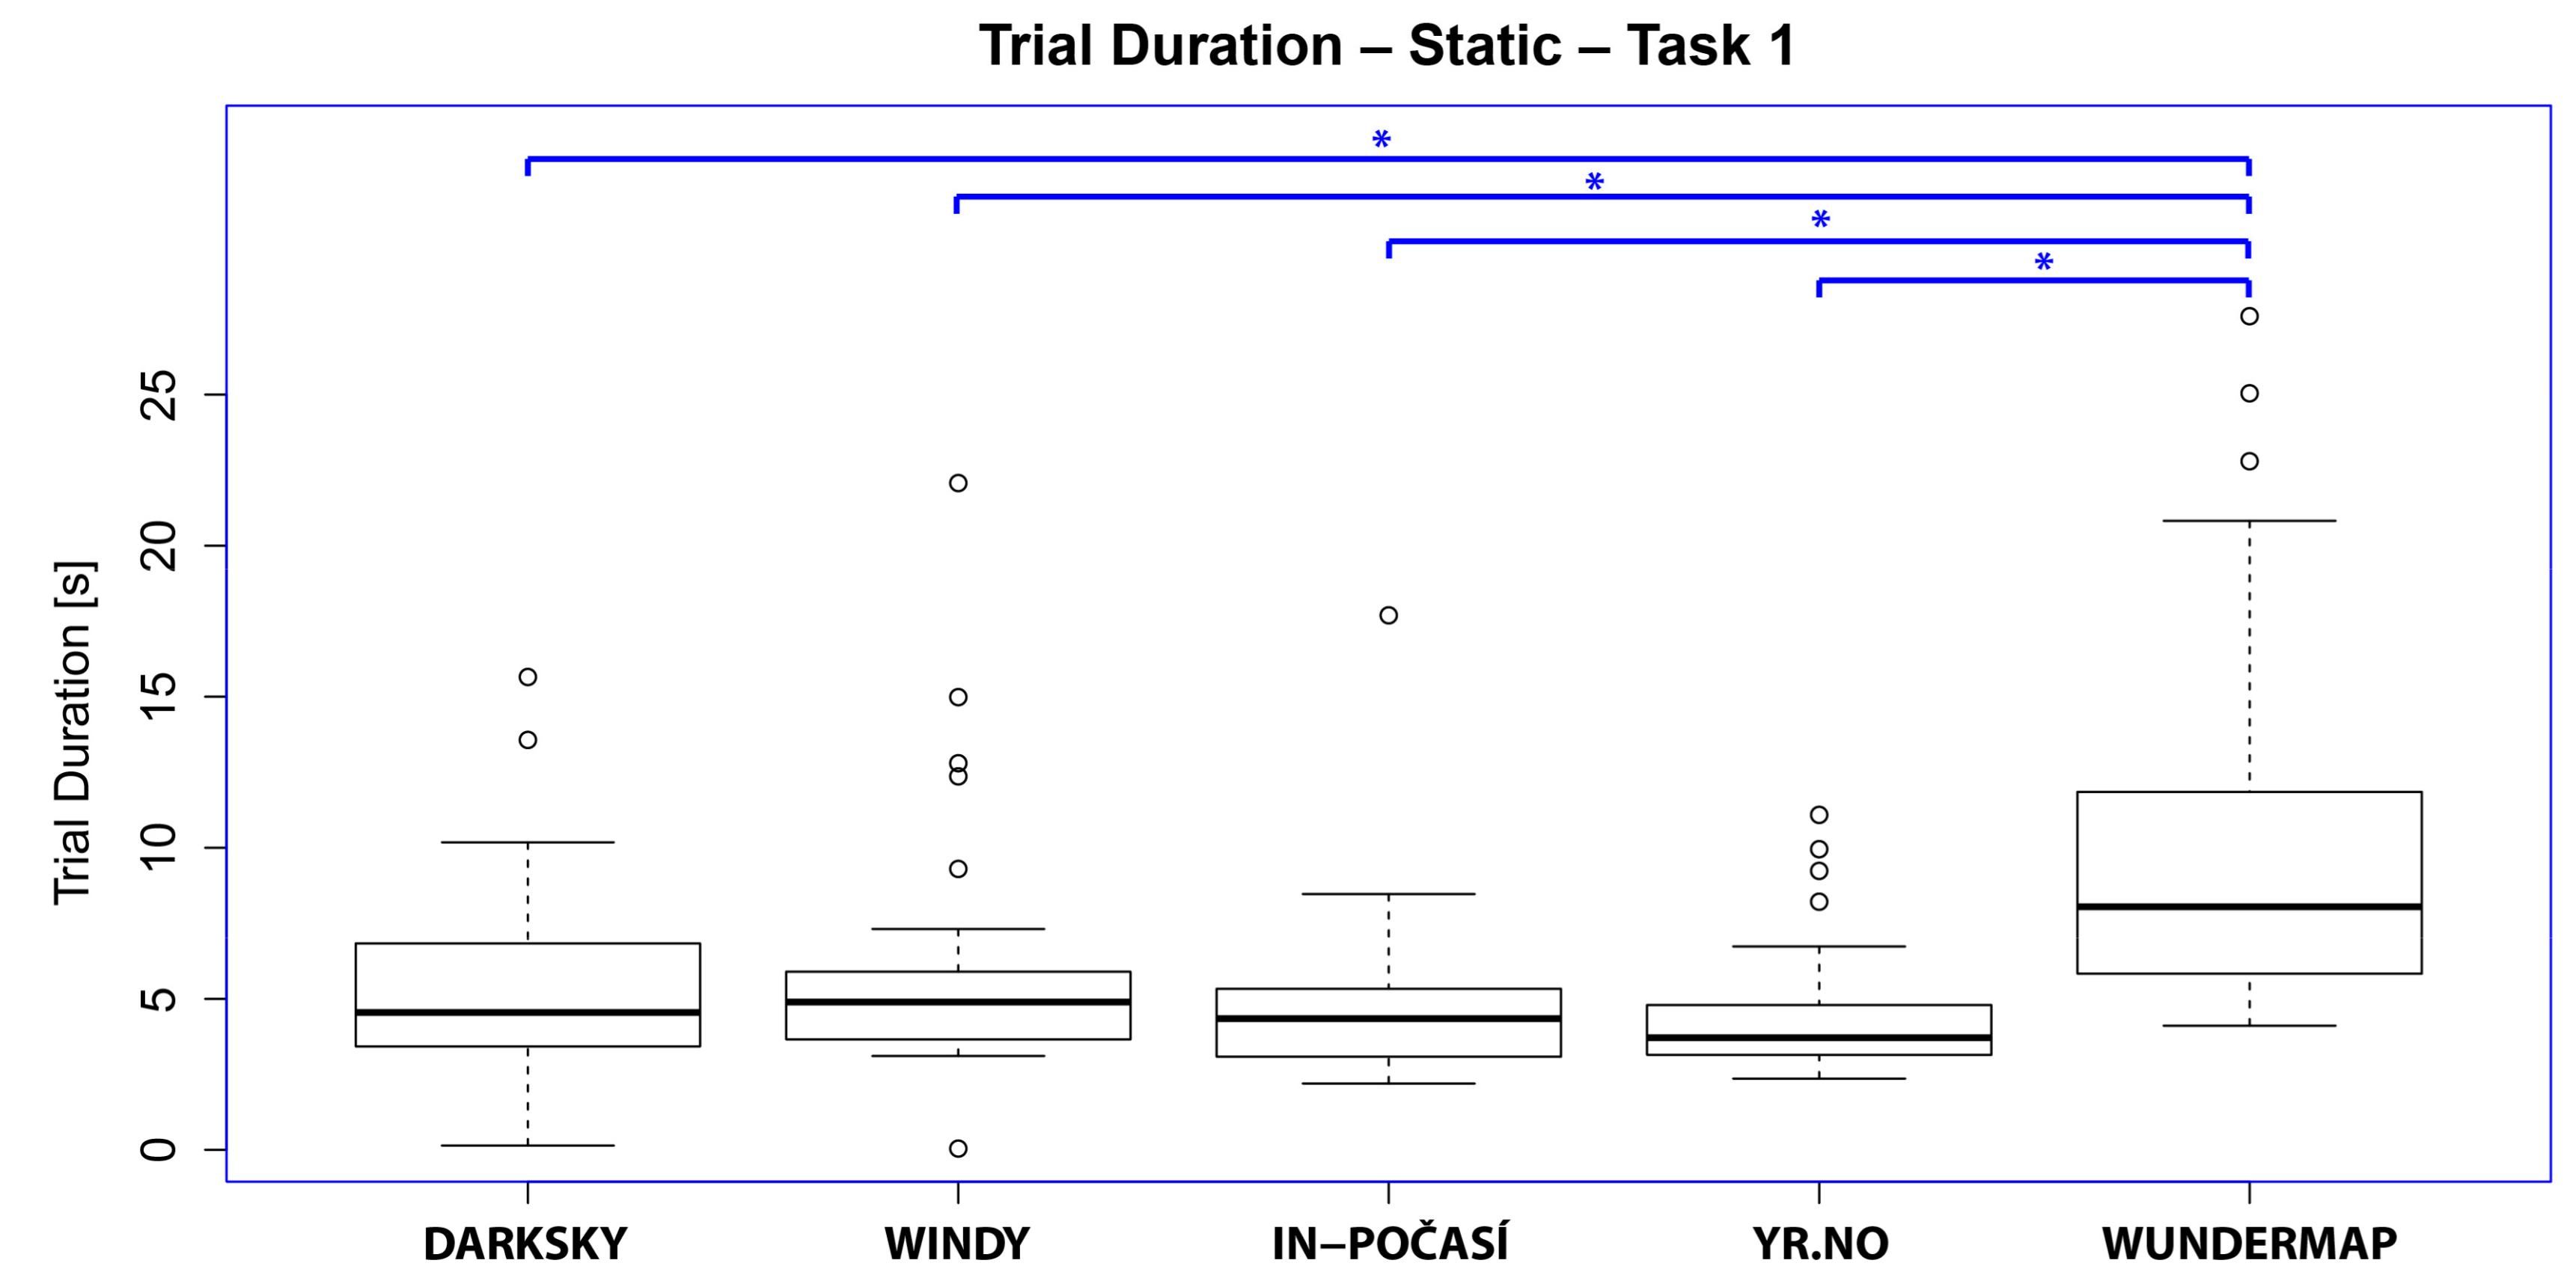
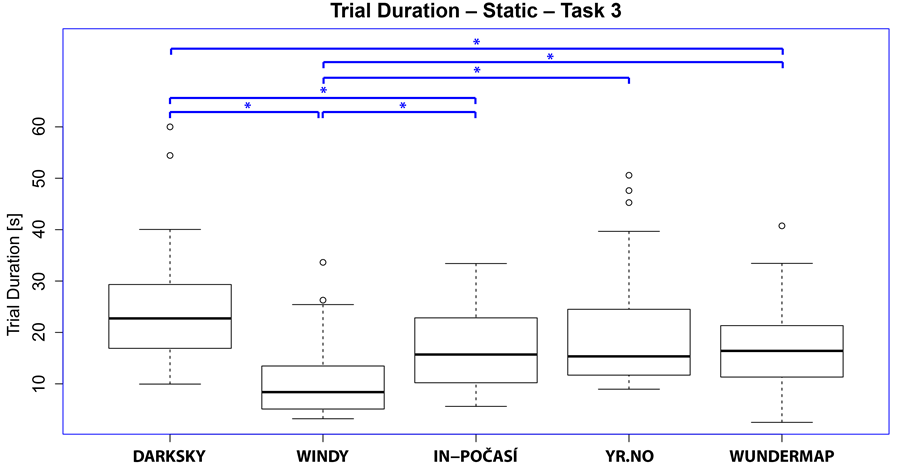
3.2.3. Static Test Section Results
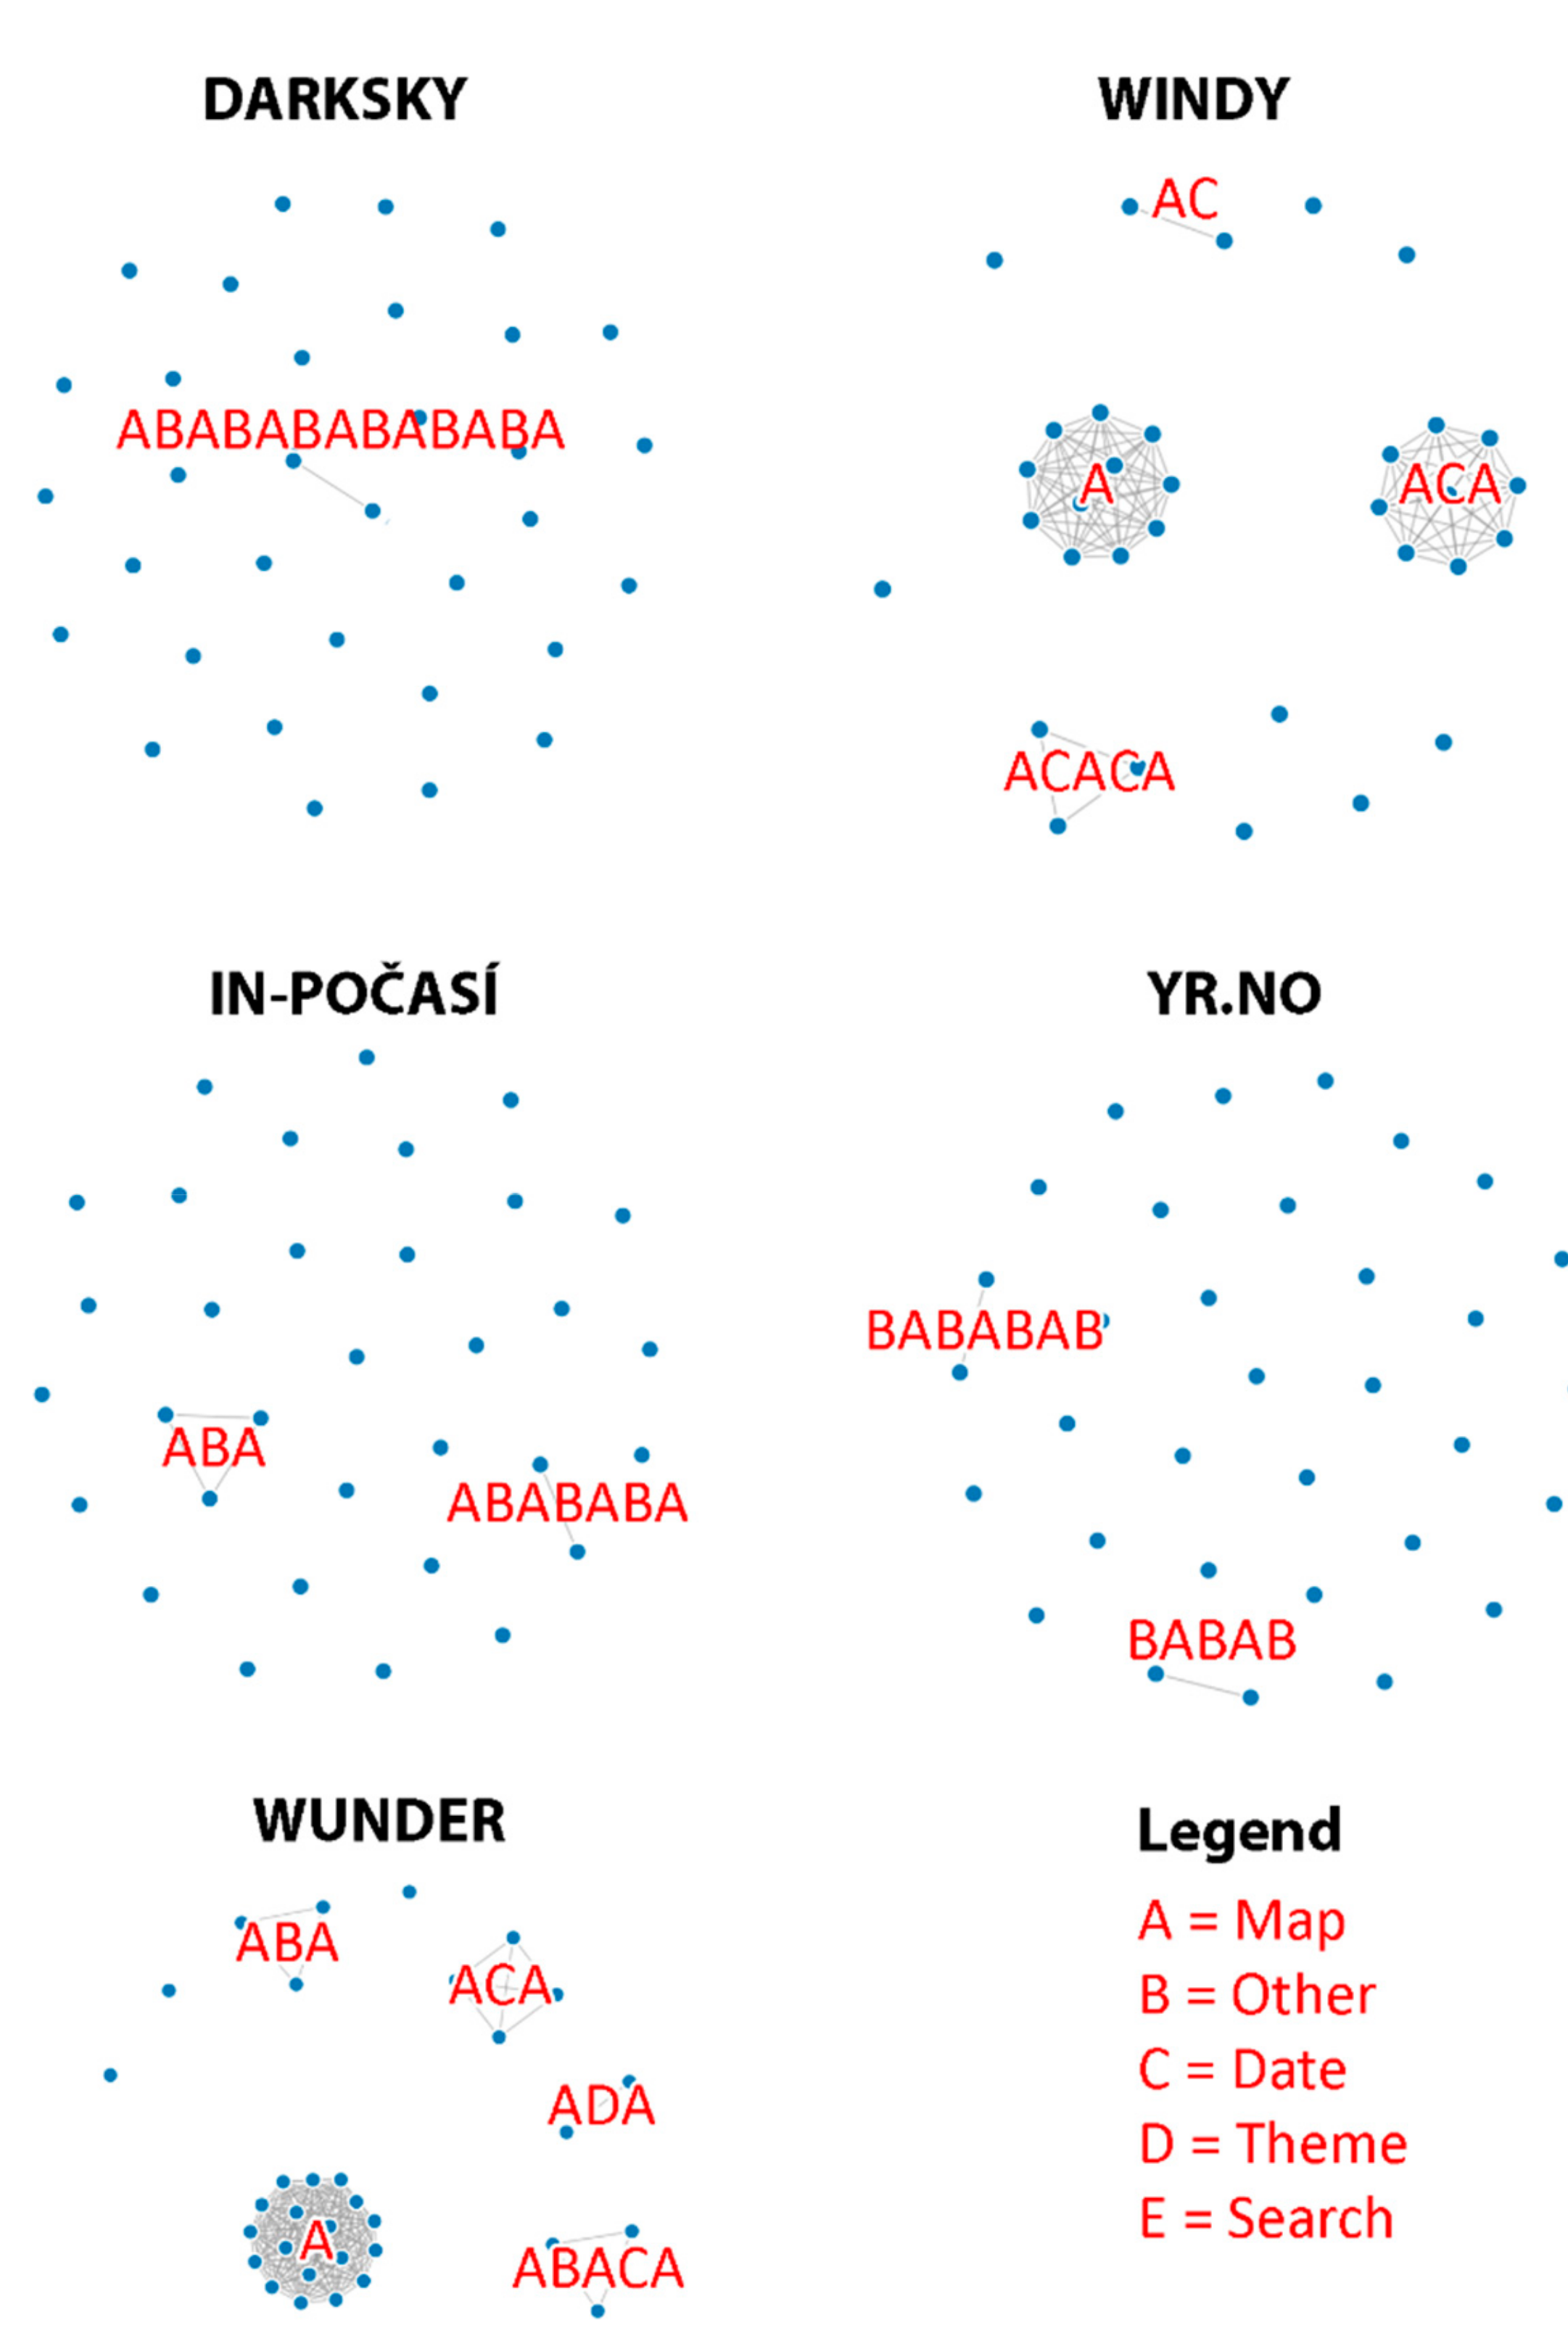
3.3. Think-Aloud Results
- DarkSky:
- “I’m trying to zoom in, but it’s not possible using a mouse. Well, here I found some information on the map that’s in Hradec Králové, because there are lower numbers than everywhere else, but I can’t read it from the colours. However, do you want general information or rather point values? As a map user, I would go after that number, so I clicked on Hradec Kralove.”
- Windy:
- “I’ll find the wind. So, the information here is in degrees, and it’s in the cities, and I would have to go here by colour and click somewhere near Olomouc. Also, when I click on it, I’ll get the information with the exact number.”
- In-Počasí:
- “Here, I would go to the border of the three regions, finding it by colour.”
- YR:
- “Here, I have to study this strange colour scale for a long time to find out that it’s the lightest green, and I’d like to see it somewhere near Zlín.”
- Wundermap:
- “The wind is hidden somehow strangely here in the layer. So, I want to find the highest number, but what does that number show? Well, it’s according to Fahrenheit, but it is the temperature, yet it’s strange. Trying to right-click the legend, but I just can’t see it. Well, look at this, I’m missing the legend, and it’s been redrawn on another layer. Well, I can’t find the highest one, so let’s say here, because it’s so green and there has to be that temperature. It’s totally stupid to me.”
- DarkSky:
- “So, cloud cover can be clicked here. I wrote Prague into the search here, it’s even listed here. So today at 10 pm, it will be cloudy and partly cloudy. I ignored the map and found it up there in that information.”
- Windy:
- “So I switch to clouds. Here, I switched to clouds, and here found ten o’clock, and now I’m going to look at the map. Well, the answer is that it won’t be overcast, but there will be some cloud.”
- In-Počasí:
- “Clouds are already there, here, it doesn’t lead me to a location, but when I load it, there is not much of a base layer here, so I’m looking for a location not very well and estimate it will be covered by 50% or so, clouds will be there.”
- YR:
- “So precipitation, here, I’m misled and cannot find the clouds, but it is right in the icons, so that I can find the time and the place. Now I thought it would hit me and the meteogram would start, and at 8 o’clock it won’t be cloudy. Clouds only arrive later.”
- Wundermap:
- “Help me. Here there might be a clue, I could find it there. Why does it load so slowly that I have to wait? We want it for 7 pm, but the map only shows now. How does the timescale change there, probably not. It may be because it is slow. So, when I click on the map, it will probably not work out anything. It stopped me from looking, so I won’t even look for it.”
- DarkSky:
- “I see that I’m not the first to find it through search. So here I am, switching the date to tomorrow after I found the place. Well, it will rain there, but I’m not quite sure now if that’s tomorrow. Well, I’m only a little bit confident that the contents of the map will switch to tomorrow, but not at all with the strip above with information. So, I have to look at the map, and it won’t rain tomorrow. However, I’m not quite sure.”
- Windy:
- “So we want tomorrow again. So, it makes me think of the maps as they move, and yes it will rain.”
- In-Počasí:
- “I’m clicking on Friday and crashing. I know roughly where Paris is, but I would rather write it, and now I see it. Again, the times go through, and I can see that the showers will come, and more rain will come in the evening.”
- YR:
- “I’m starting to move here on that timeline, and I see that tomorrow it should be raining.”
- Wundermap:
- “I have to find it here, but there is a very slow server here. I was trying to select it, but the menu has been stuck. So, disappear. This is a pain. I want to know if it’s going to rain. Well, here I can see only the current, and here’s just a chart for today. I won’t find out about tomorrow. I have a feeling I’m not going to find out about tomorrow.”
3.4. Summary of Results
4. Discussion
5. Conclusions
Author Contributions
Funding
Acknowledgments
Conflicts of Interest
References
- Haklay, M.; Singleton, A.; Parker, C. Web mapping 2.0: The neogeography of the GeoWeb. Geogr. Compass 2008, 2, 2011–2039. [Google Scholar] [CrossRef]
- Roth, R.E.; Donohue, R.G.; Sack, C.M.; Wallace, T.R.; Buckingham, T. A process for keeping pace with evolving web mapping technologies. Cartogr. Perspect. 2015, 25–52. [Google Scholar] [CrossRef]
- Peterson, M.P. Maps and the Internet; Elsevier: Amsterdam, The Netherlands, 2003. [Google Scholar]
- Kraak, M.-J.; Brown, A. Web Cartography: Developments and Prospects; Taylor & Francis: New York, NY, USA, 2001. [Google Scholar]
- Nivala, A.-M.; Brewster, S.; Sarjakoski, T.L. Usability evaluation of web mapping sites. Cartogr. J. 2008, 45, 129–138. [Google Scholar] [CrossRef]
- Harrower, M.; Keller, C.P.; Hocking, D. Cartography on the Internet: Thoughts and a preliminary user survey. Cartogr. Perspect. 1997, 27–37. [Google Scholar] [CrossRef]
- MacEachren, A.M.; Boscoe, F.P.; Haug, D.; Pickle, L.W. Geographic visualization: Designing manipulable maps for exploring temporally varying georeferenced statistics. In Proceedings of the IEEE Symposium on Information Visualization, Triangle Park, NC, USA, 19–20 October 1998; pp. 87–94. [Google Scholar]
- Arleth, M. Problems in Screen Map Design. In Proceedings of the 19th International Cartographic Conference, Ottawa, ON, Canada, 14–21 August 1999; pp. 849–857. [Google Scholar]
- Schnur, S.; Bektaş, K.; Çöltekin, A. Measured and perceived visual complexity: A comparative study among three online map providers. Cartogr. Geogr. Inf. Sci. 2018, 45, 238–254. [Google Scholar] [CrossRef]
- Wu, H.; Li, Z.; Zhang, H.; Yang, C.; Shen, S. Monitoring and evaluating the quality of Web Map Service resources for optimizing map composition over the internet to support decision making. Comput. Geosci. 2011, 37, 485–494. [Google Scholar] [CrossRef]
- Alacam, Ö.; Dalci, M. A Usability Study of WebMaps with Eye Tracking Tool: The Effects of Iconic Representation of Information. In New trends in Human-Computer Interaction; Springer: Berling, Germany, 2009; pp. 12–21. [Google Scholar]
- You, M.; Chen, C.-W.; Liu, H.; Lin, H. A usability evaluation of web map zoom and pan functions. Int. J. Des. 2007, 1, 15–25. [Google Scholar]
- Buscher, G.; Dumais, S.T.; Cutrell, E. The Good, the bad, and the Random: An Eye-Tracking Study of Ad Quality in Web Search. In Proceedings of the 33rd International ACM SIGIR Conference on Research and Development in Information Retrieval, Athens, Greece, 24–28 July 2000; pp. 42–49. [Google Scholar]
- Juřík, V.; Herman, L.; Kubíček, P.; Stachoň, Z.; Šašinka, Č. Cognitive aspects of collaboration in 3d virtual environments. Int. Archives Photogram. Remote Sens. Spatial Inf. Sci. 2016, 41, 663. [Google Scholar] [CrossRef]
- Šašinka, Č.; Morong, K.; Stachoň, Z. The Hypothesis Platform: An Online Tool for Experimental Research into Work with Maps and Behavior in Electronic Environments. ISPRS Int. J. Geo-Inf. 2017, 6, 1–22. [Google Scholar]
- Coltekin, A.; Heil, B.; Garlandini, S.; Fabrikant, S.I. Evaluating the effectiveness of interactive map interface designs: A case study integrating usability metrics with eye-movement analysis. Cartogr. Geogr. Inf. Sci. 2009, 36, 5–17. [Google Scholar] [CrossRef]
- Dong, W.; Liao, H.; Xu, F.; Liu, Z.; Zhang, S. Using eye tracking to evaluate the usability of animated maps. Sci. China Earth Sci. 2014, 57, 512–522. [Google Scholar] [CrossRef]
- Burian, J.; Popelka, S.; Beitlova, M. Evaluation of the Cartographical Quality of Urban Plans by Eye-Tracking. ISPRS Int. J. Geo-Inf. 2018, 7, 192. [Google Scholar] [CrossRef]
- Herman, L.; Popelka, S.; Hejlova, V. Eye-tracking Analysis of Interactive 3D Geovisualization. J. Eye Movement Res. 2017, 10, 1–15. [Google Scholar] [CrossRef]
- Kurzhals, K.; Weiskopf, D. Space-Time Visual Analytics of Eye-Tracking Data for Dynamic Stimuli. Vis. Comput. Gr. IEEE Trans. 2013, 19, 2129–2138. [Google Scholar] [CrossRef] [PubMed]
- Ramloll, R.; Trepagnier, C.; Sebrechts, M.; Beedasy, J. Gaze data visualization tools: Opportunities and challenges. In Proceedings of the Eight International Conference on Information Visualisation, London, UK, 11–14 July 2017; pp. 173–180. [Google Scholar]
- Tsang, H.Y.; Tory, M.; Swindells, C. eSeeTrack—Visualizing Sequential Fixation Patterns. Vis. Comput. Gr. IEEE Trans. 2010, 16, 953–962. [Google Scholar] [CrossRef] [PubMed]
- Hegarty, M.; Canham, M.S.; Fabrikant, S.I. Thinking about the weather: How display salience and knowledge affect performance in a graphic inference task. J. Exp. Psychol. Learn. Memory Cognit. 2010, 36, 37. [Google Scholar] [CrossRef]
- Blok, C. Chapter 11: Web maps and weather. Web Cartography; Taylor & Francis: London, UK, 2003; pp. 145–162. [Google Scholar]
- Opach, T.; Popelka, S.; Dolezalova, J.; Rod, J.K. Star and Polyline Glyphs in a Grid Plot and on a Map Display: Which Perform Better? Cartogr. Geogr. Inf. Sci. 2017, 1–20. [Google Scholar] [CrossRef]
- Roth, R.E.; Çöltekin, A.; Delazari, L.; Filho, H.F.; Griffin, A.; Hall, A.; Korpi, J.; Lokka, I.; Mendonça, A.; Ooms, K. User studies in cartography: Opportunities for empirical research on interactive maps and visualizations. Int. J. Cartogr. 2017, 3, 61–89. [Google Scholar] [CrossRef]
- Nossum, A.S. Semistatic animation–Integrating past, present and future in map animations. Cartogr. J. 2012, 49, 43–54. [Google Scholar] [CrossRef]
- Harrower, M. The cognitive limits of animated maps. Cartogr. Int. J. Geogr. Inf. Geovis. 2007, 42, 349–357. [Google Scholar] [CrossRef]
- Maggi, S.; Fabrikant, S.I.; Imbert, J.-P.; Hurter, C. How do display design and user characteristics matter in animations? An empirical study with air traffic control displays. Cartogr. Int. J. Geogr. Inf. Geovis. 2016, 51, 25–37. [Google Scholar] [CrossRef]
- Opach, T.; Nossum, A. Evaluating the Usability of Cartographic Animations with Eye-Movement Analysis. In Proceedings of the 25th International Cartographic Conference, Paris, France, 3–8 July 2011; pp. 1–11. [Google Scholar]
- Ishikawa, T.; Barnston, A.G.; Kastens, K.A.; Louchouarn, P.; Ropelewski, C.F. Climate forecast maps as a communication and decision-support tool: An empirical test with prospective policy makers. Cartogr. Geogr. Inf. Sci. 2005, 32, 3–16. [Google Scholar] [CrossRef]
- Kerpedjiev, S.M. Transformation of weather forecasts from textual to cartographic form. Comput. Phys. Commun. 1990, 61, 246–256. [Google Scholar] [CrossRef]
- Herman, L.; Juřík, V.; Stachoň, Z.; Vrbík, D.; Russnák, J.; Řezník, T. Evaluation of User Performance in Interactive and Static 3D Maps. ISPRS Int. J. Geo-Inf. 2018, 7, 415. [Google Scholar] [CrossRef]
- Fabrikant, S.I.; Lobben, A. Introduction: Cognitive issues in geographic information visualization. Cartogr. Int. J. Geogr. Inf. Geovis. 2009, 44, 139–143. [Google Scholar] [CrossRef]
- Staněk, K.; Friedmannová, L.; Kubíček, P.; Konečný, M. Selected issues of cartographic communication optimization for emergency centers. Int. J. Digital Earth 2010, 3, 316–339. [Google Scholar] [CrossRef]
- Field, K. Cartography; Esri Press: Redlands, CA, USA, 2018; 576p. [Google Scholar]
- Roth, R.E. Cartographic interaction primitives: Framework and synthesis. Cartogr. J. 2012, 49, 376–395. [Google Scholar] [CrossRef]
- Vondrakova, A.; Popelka, S. The use of eye-tracking for the evaluation of various cartographic tasks. In Proceedings of the Geoconference on Informatics, Geoinformatics and Remote Sensing, Albena, Bulgaria, 17–26 June 2014; Volume III, pp. 981–988. [Google Scholar]
- Voženílek, V.; Kaňok, J. Metody Tematické Kartografie: Vizualizace Prostorových Jevů; Univerzita Palackého v Olomouci pro katedru geoinformatiky: Olomouc, Czech Republic, 2011. [Google Scholar]
- Muehlenhaus, I. Web Cartography: Map Design for Interactive and Mobile Devices; CRC Press: Boca Racaton, FL, USA, 2013. [Google Scholar]
- Lewis, J.R. Evaluation of procedures for adjusting problem-discovery rates estimated from small samples. Int. J. Human-Comput. Interact. 2001, 13, 445–479. [Google Scholar] [CrossRef]
- Popelka, S. Optimal eye fixation detection settings for cartographic purposes. In Proceedings of the 14th SGEM GeoConference on Informatics, Geoinformatics and Remote Sensing, Albena, Bulgaria, 17–26 June 2014; pp. 705–712. [Google Scholar]
- Dolezalova, J.; Popelka, S. ScanGraph: A Novel Scanpath Comparison Method Using Visualisation of Graph Cliques. J. Eye Mov. Res. 2016, 9. [Google Scholar] [CrossRef]
- Goldberg, J.H.; Kotval, X.P. Computer interface evaluation using eye movements: Methods and constructs. Int. J. Ind. Ergon. 1999, 24, 631–645. [Google Scholar] [CrossRef]
- Goldberg, J.H.; Stimson, M.J.; Lewenstein, M.; Scott, N.; Wichansky, A.M. Eye tracking in web search tasks: Design implications. In Proceedings of the 2002 Symposium on Eye Tracking Research & Applications, New Orleans, LA, USA, 25–27 March 2002; pp. 51–58. [Google Scholar]
- Aanstoos, C. The think aloud method in descriptive research. J. Phenomenol. Psychol. 1983, 14, 243. [Google Scholar] [CrossRef]
- Popelka, S.; Brychtova, A.; Brus, J. Advanced Map Optimalization Based on Eye-Tracking; IntechOpen: London, UK, 2012; p. 38305. [Google Scholar]
- Vondráková, A.; Voženílek, V. User preferences in image map using. Int. Arch. Photogramm. Remote Sens. Spat. Inf. Sci. 2016, XLI-B4, 599–603. [Google Scholar] [CrossRef]


| Trial Duration | Longer time needed to solve a task indicates a problem with user interface or higher complexity of the task. |
| Fixation Count | A higher number of fixations indicates a low level of search efficiency or an inappropriate user interface of the evaluated application [44]. |
| Scanpath Length | A longer scanpath indicates less efficient searching (perhaps due to a sub-optimal layout) [45]. |

© 2019 by the authors. Licensee MDPI, Basel, Switzerland. This article is an open access article distributed under the terms and conditions of the Creative Commons Attribution (CC BY) license (http://creativecommons.org/licenses/by/4.0/).
Share and Cite
Popelka, S.; Vondrakova, A.; Hujnakova, P. Eye-tracking Evaluation of Weather Web Maps. ISPRS Int. J. Geo-Inf. 2019, 8, 256. https://doi.org/10.3390/ijgi8060256
Popelka S, Vondrakova A, Hujnakova P. Eye-tracking Evaluation of Weather Web Maps. ISPRS International Journal of Geo-Information. 2019; 8(6):256. https://doi.org/10.3390/ijgi8060256
Chicago/Turabian StylePopelka, Stanislav, Alena Vondrakova, and Petra Hujnakova. 2019. "Eye-tracking Evaluation of Weather Web Maps" ISPRS International Journal of Geo-Information 8, no. 6: 256. https://doi.org/10.3390/ijgi8060256
APA StylePopelka, S., Vondrakova, A., & Hujnakova, P. (2019). Eye-tracking Evaluation of Weather Web Maps. ISPRS International Journal of Geo-Information, 8(6), 256. https://doi.org/10.3390/ijgi8060256