Revealing the Correlation between Population Density and the Spatial Distribution of Urban Public Service Facilities with Mobile Phone Data

Abstract
:1. Introduction
2. Data and Methodology
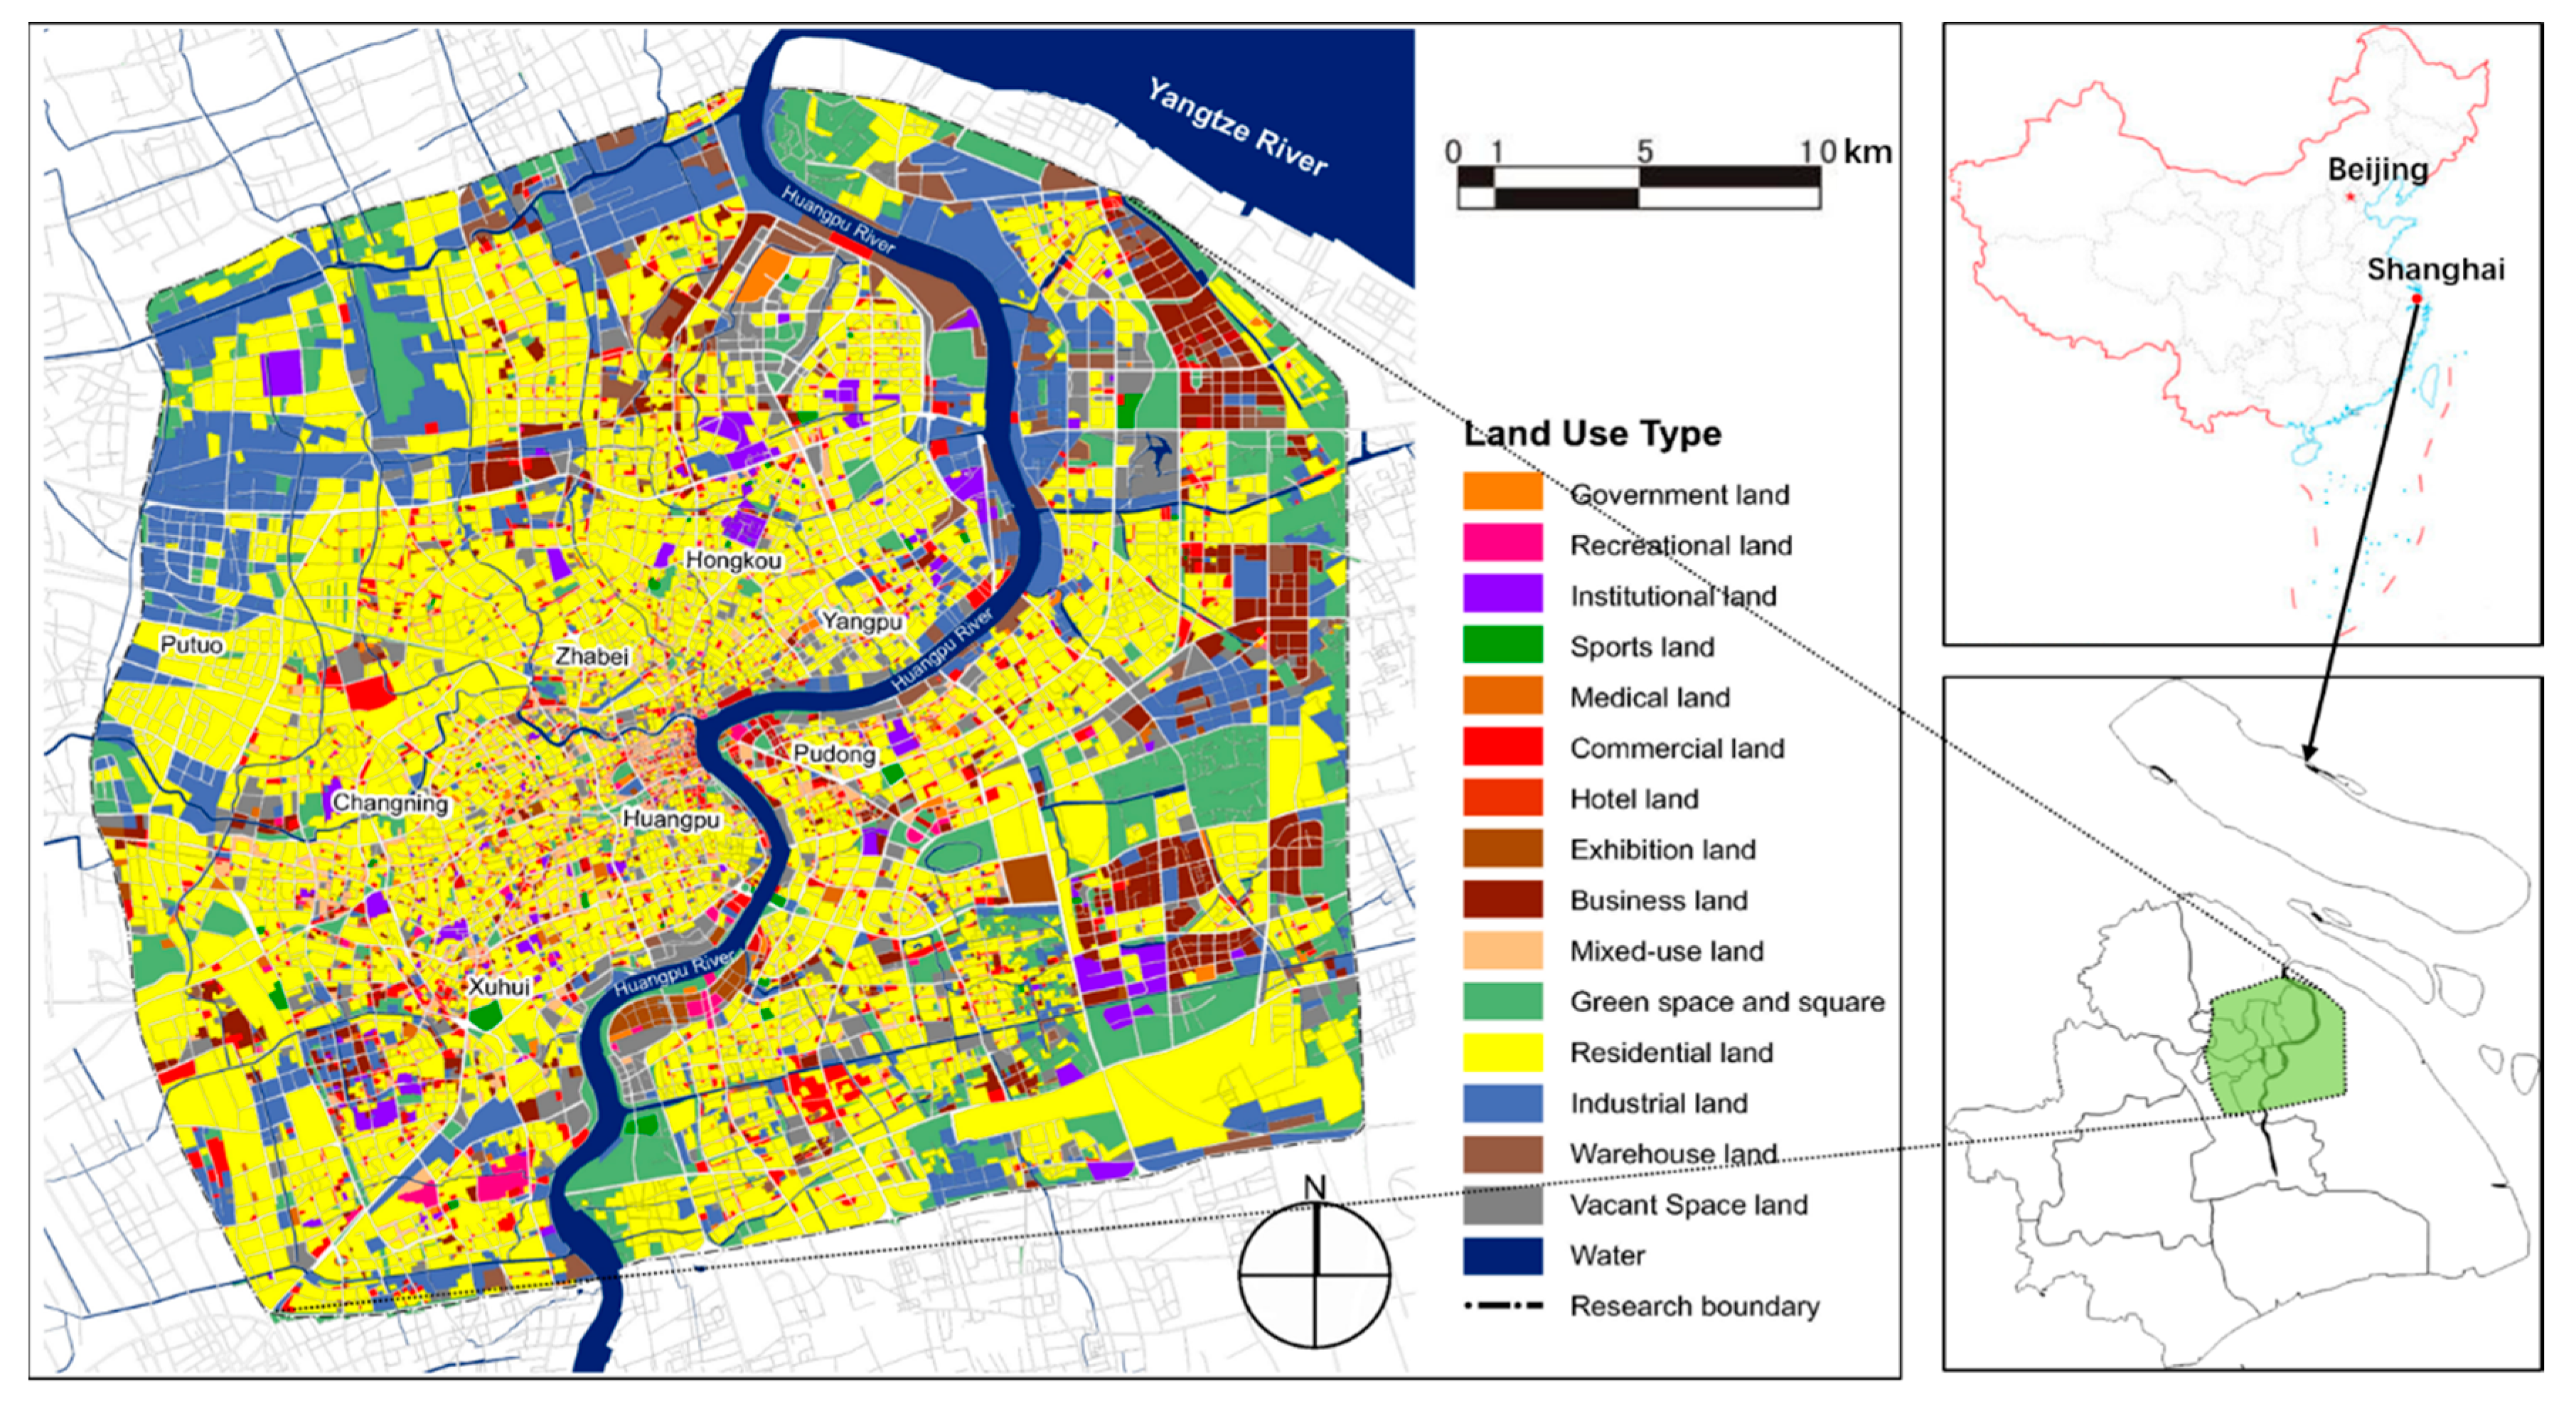
2.1. Research Area
2.2. Data
2.2.1. Mobile Phone Data
2.2.2. Service Facilities Data
2.3. Methodology
2.3.1. Population Density Index
2.3.2. Linear Regression Analysis
- The independent variables refer to nonrandom variables that are not interrelated, namely, ;
- Random error terms are independent of each other and follow a normal distribution with the expectation being zero and the standard deviation σ; namely, ; and
- sample number is more than the number of parameters, namely, n > p + 1
3. Characteristics and Results
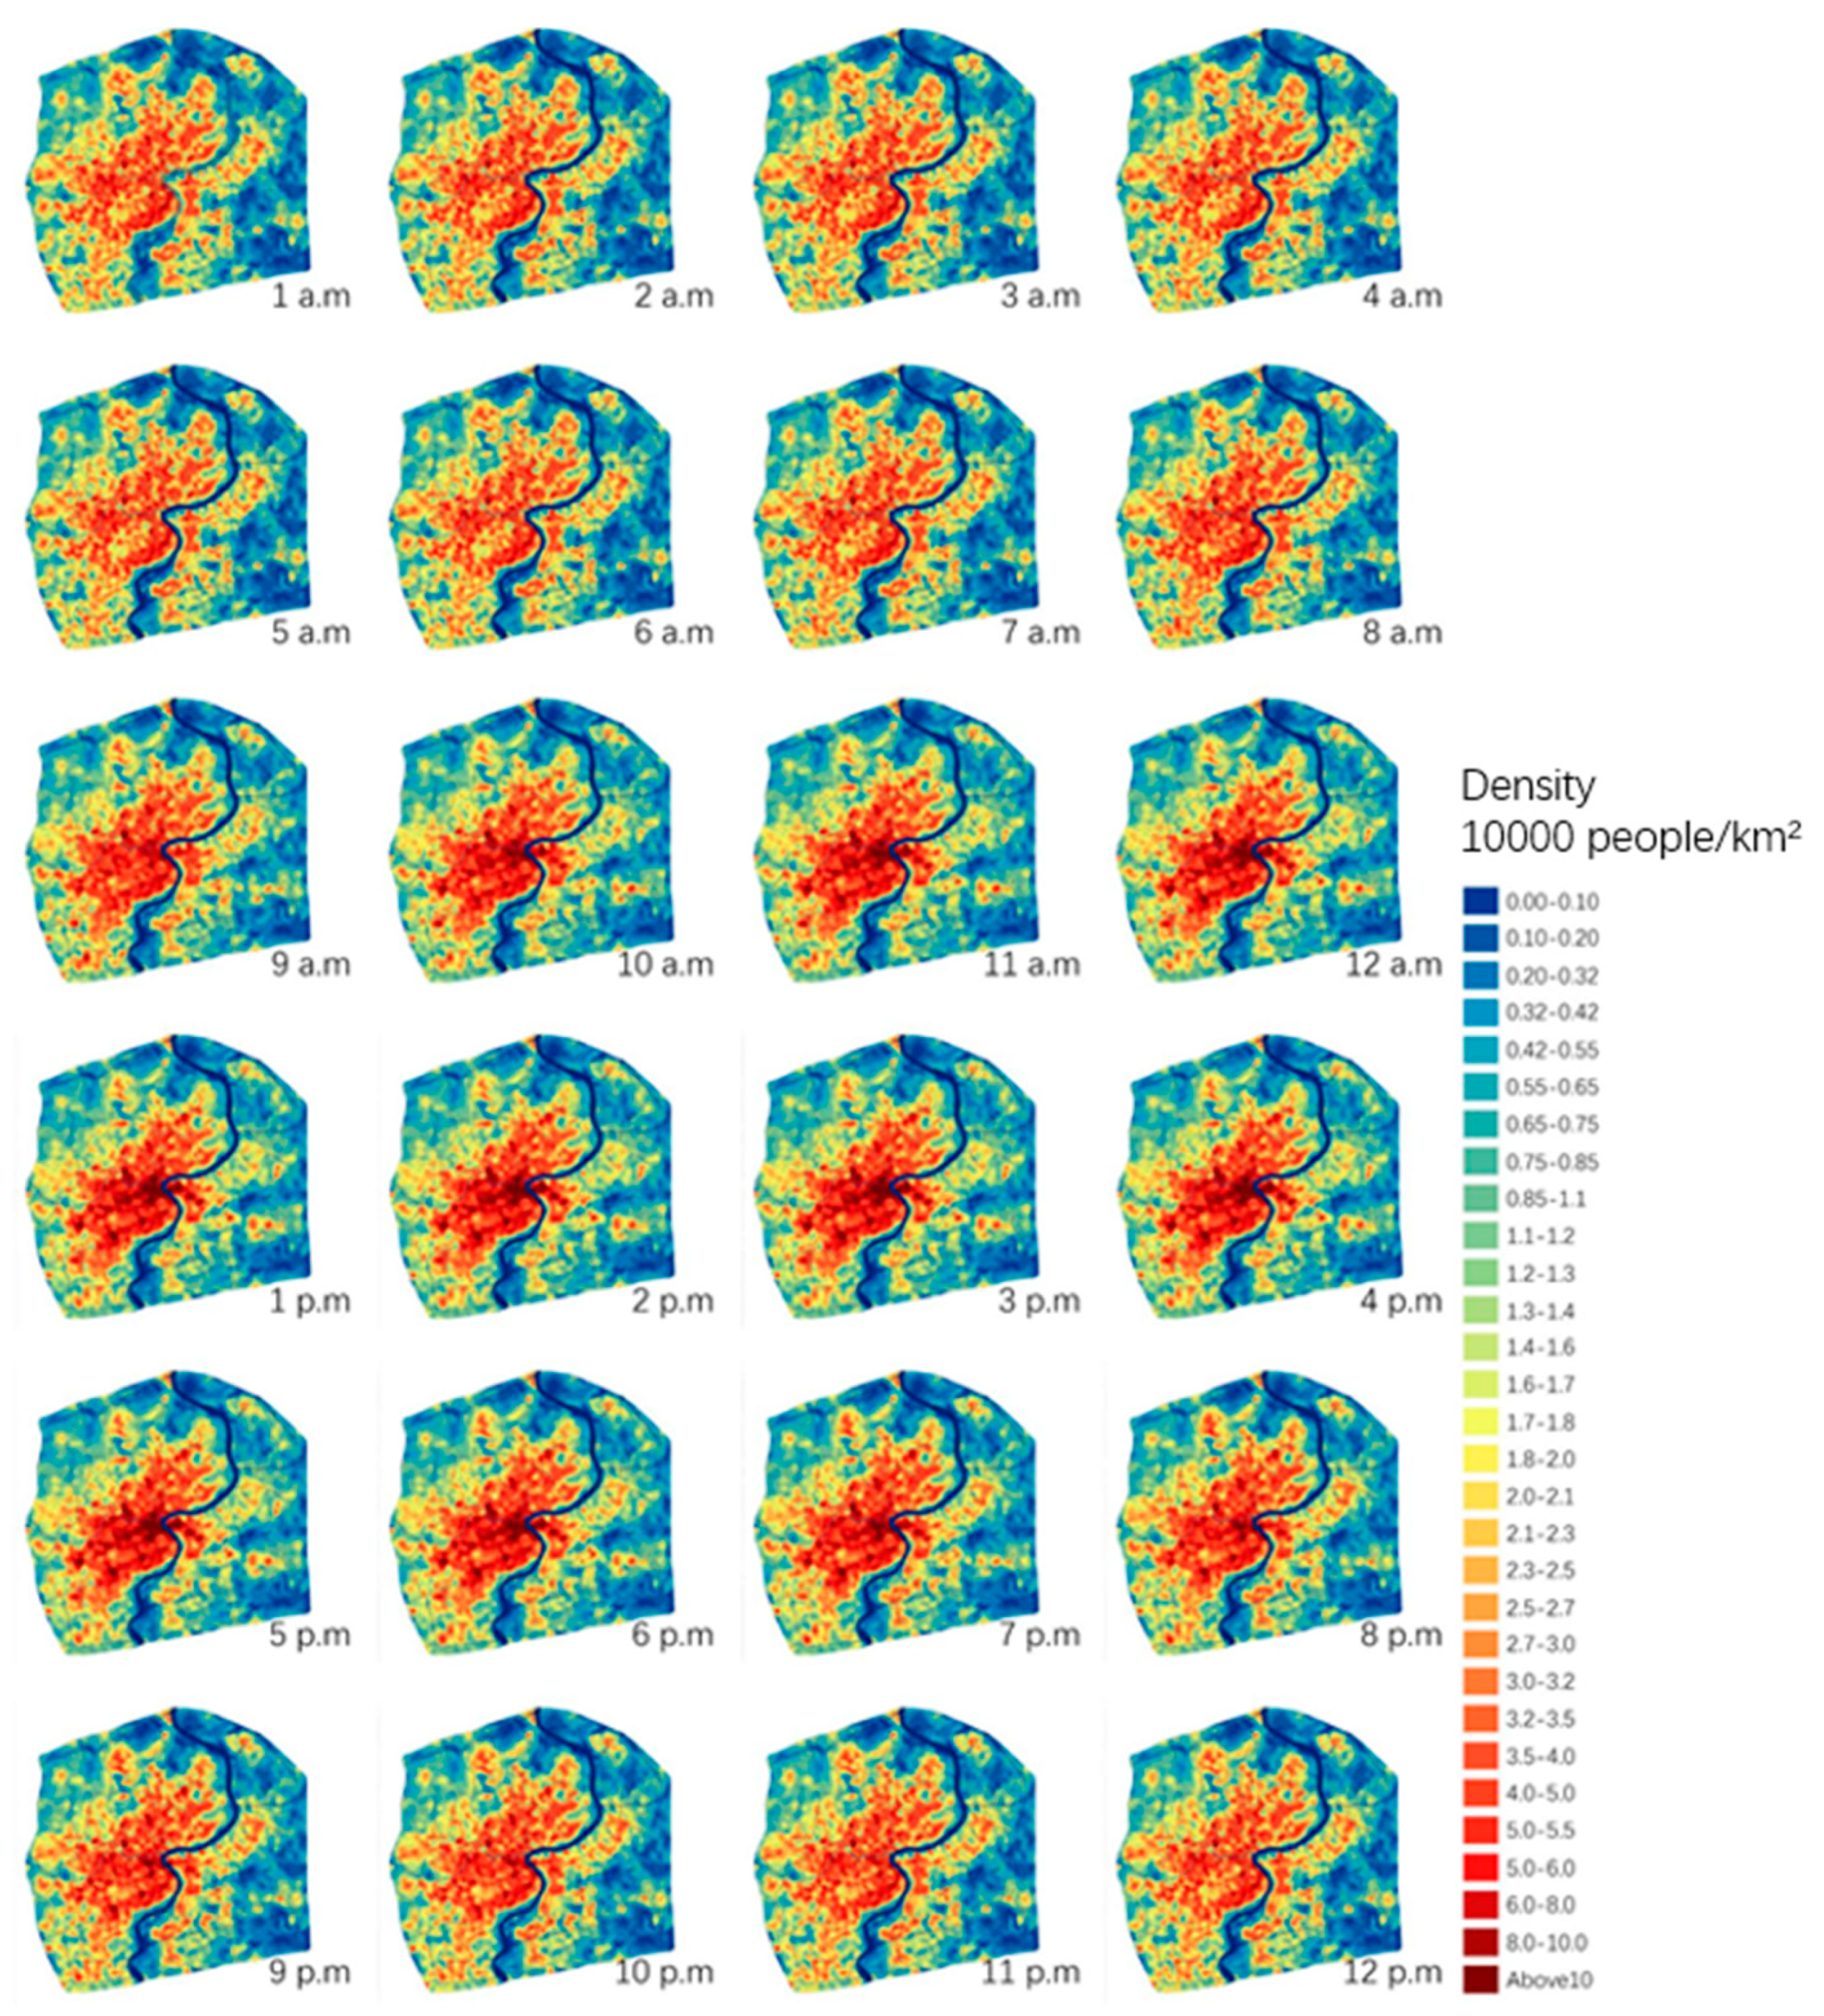
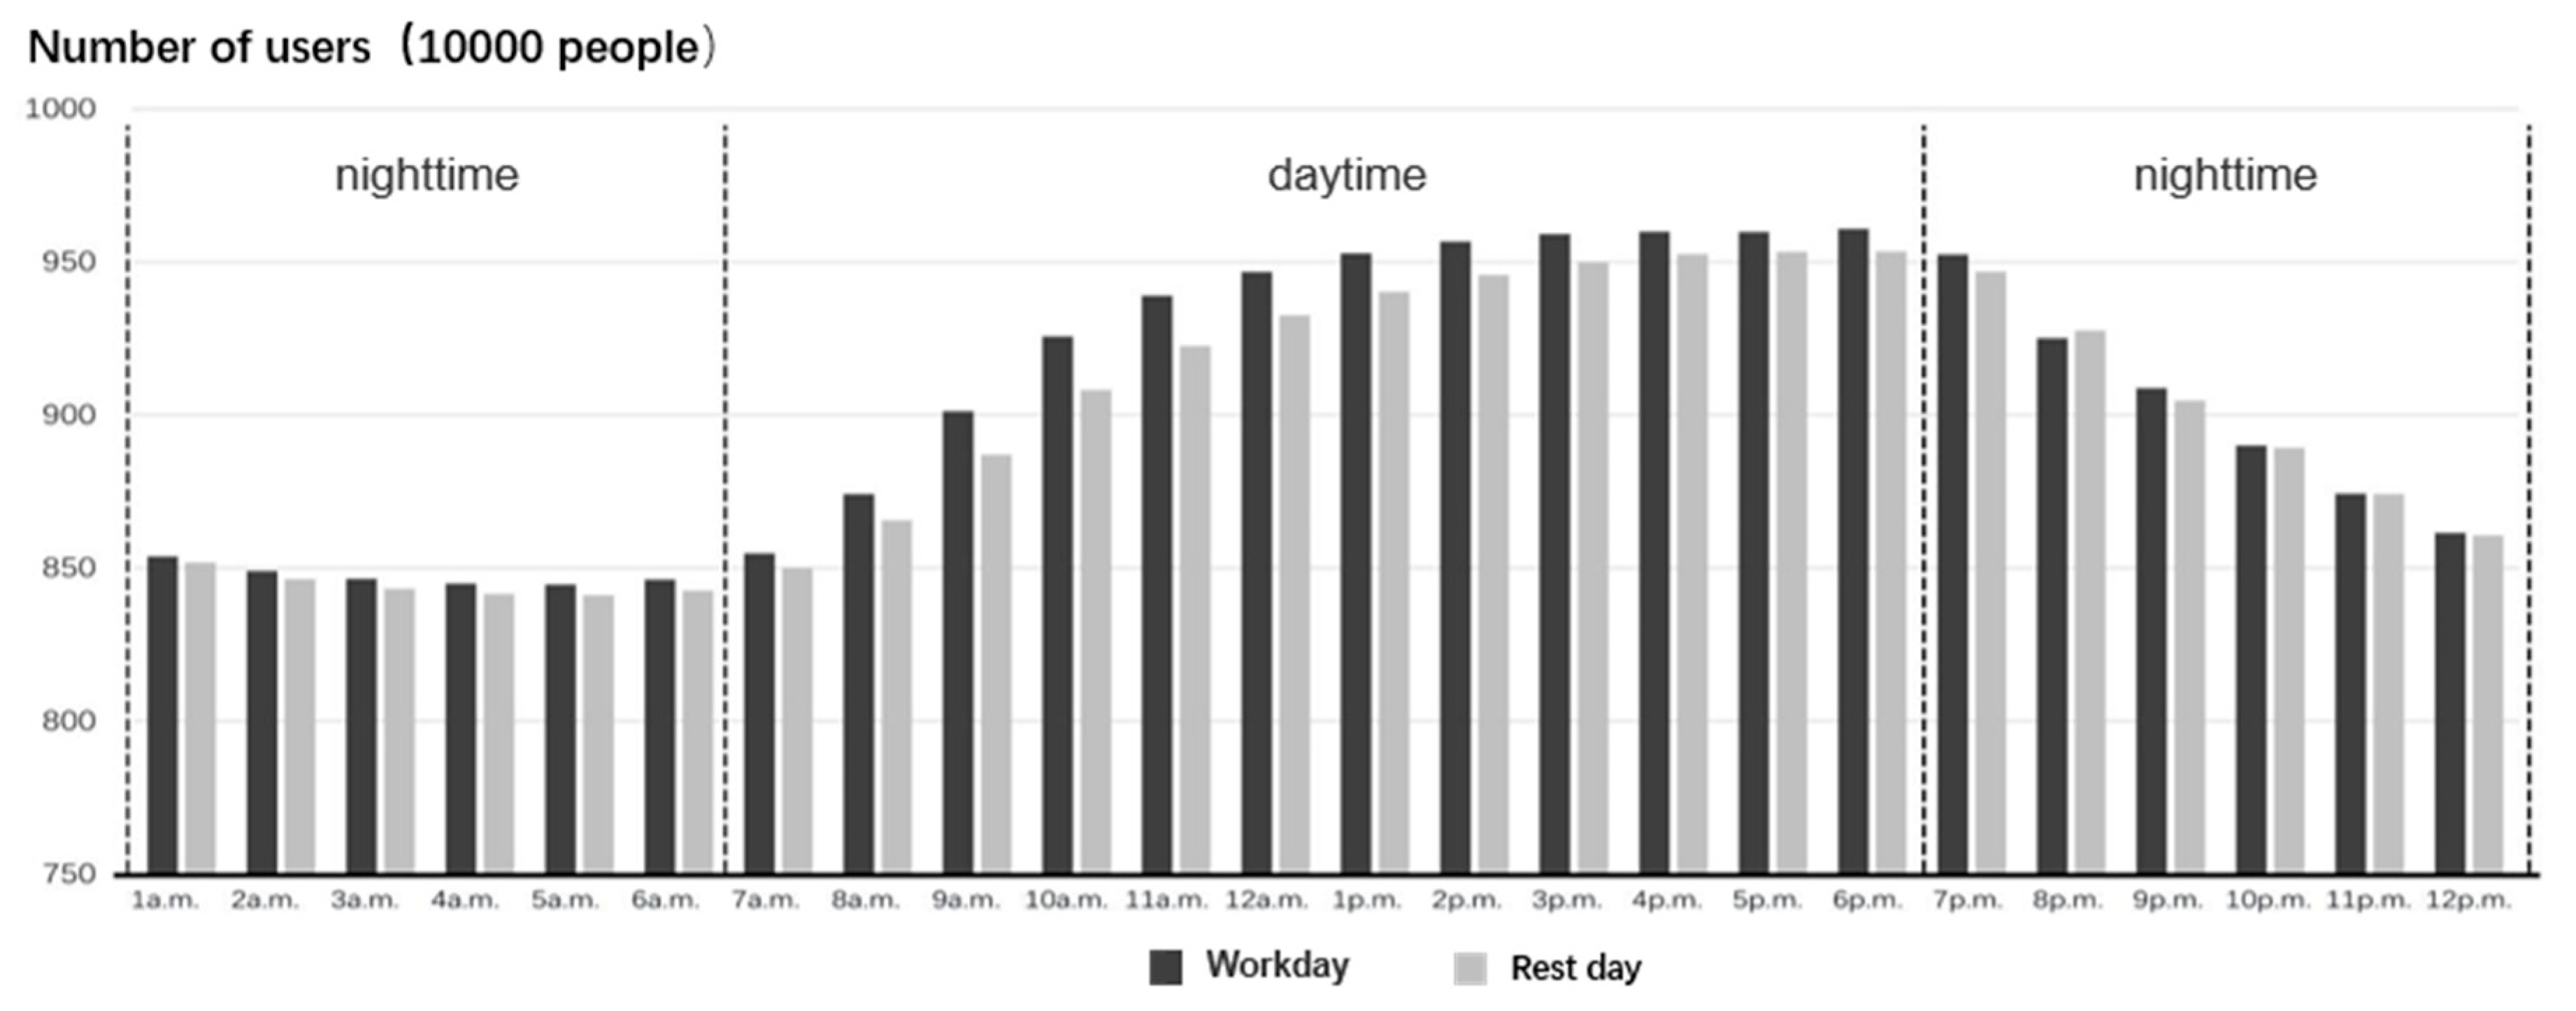
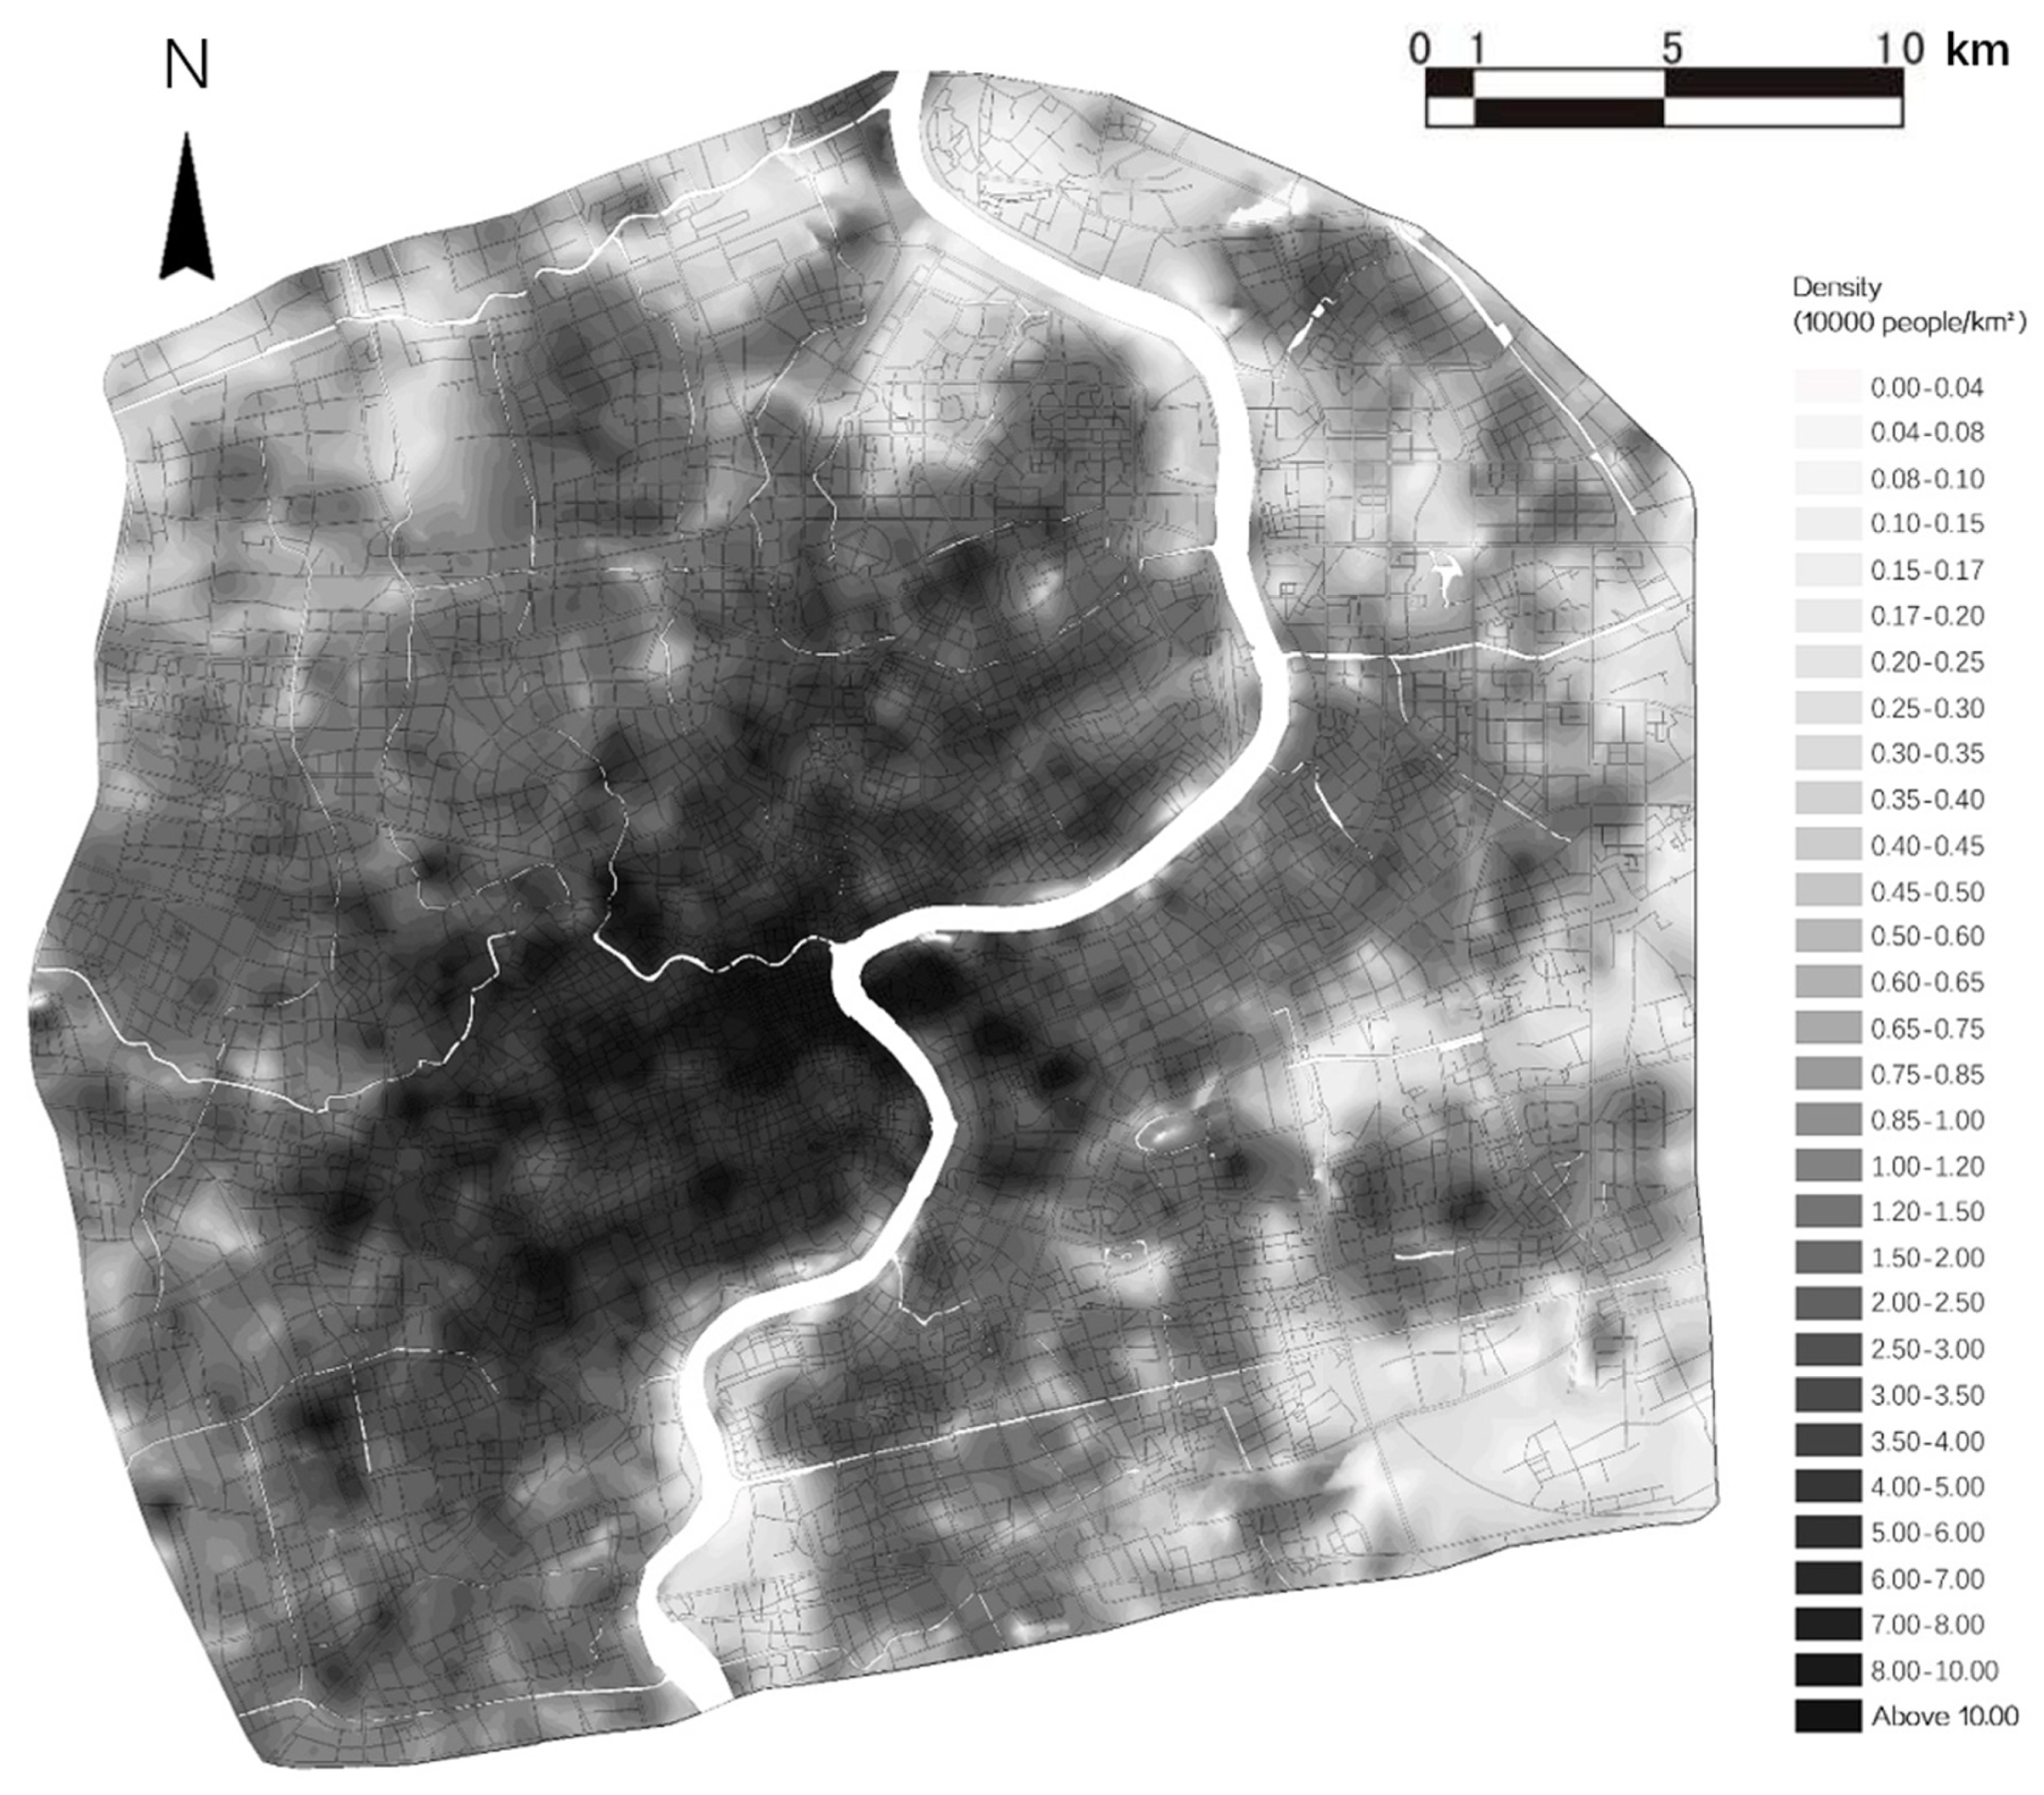
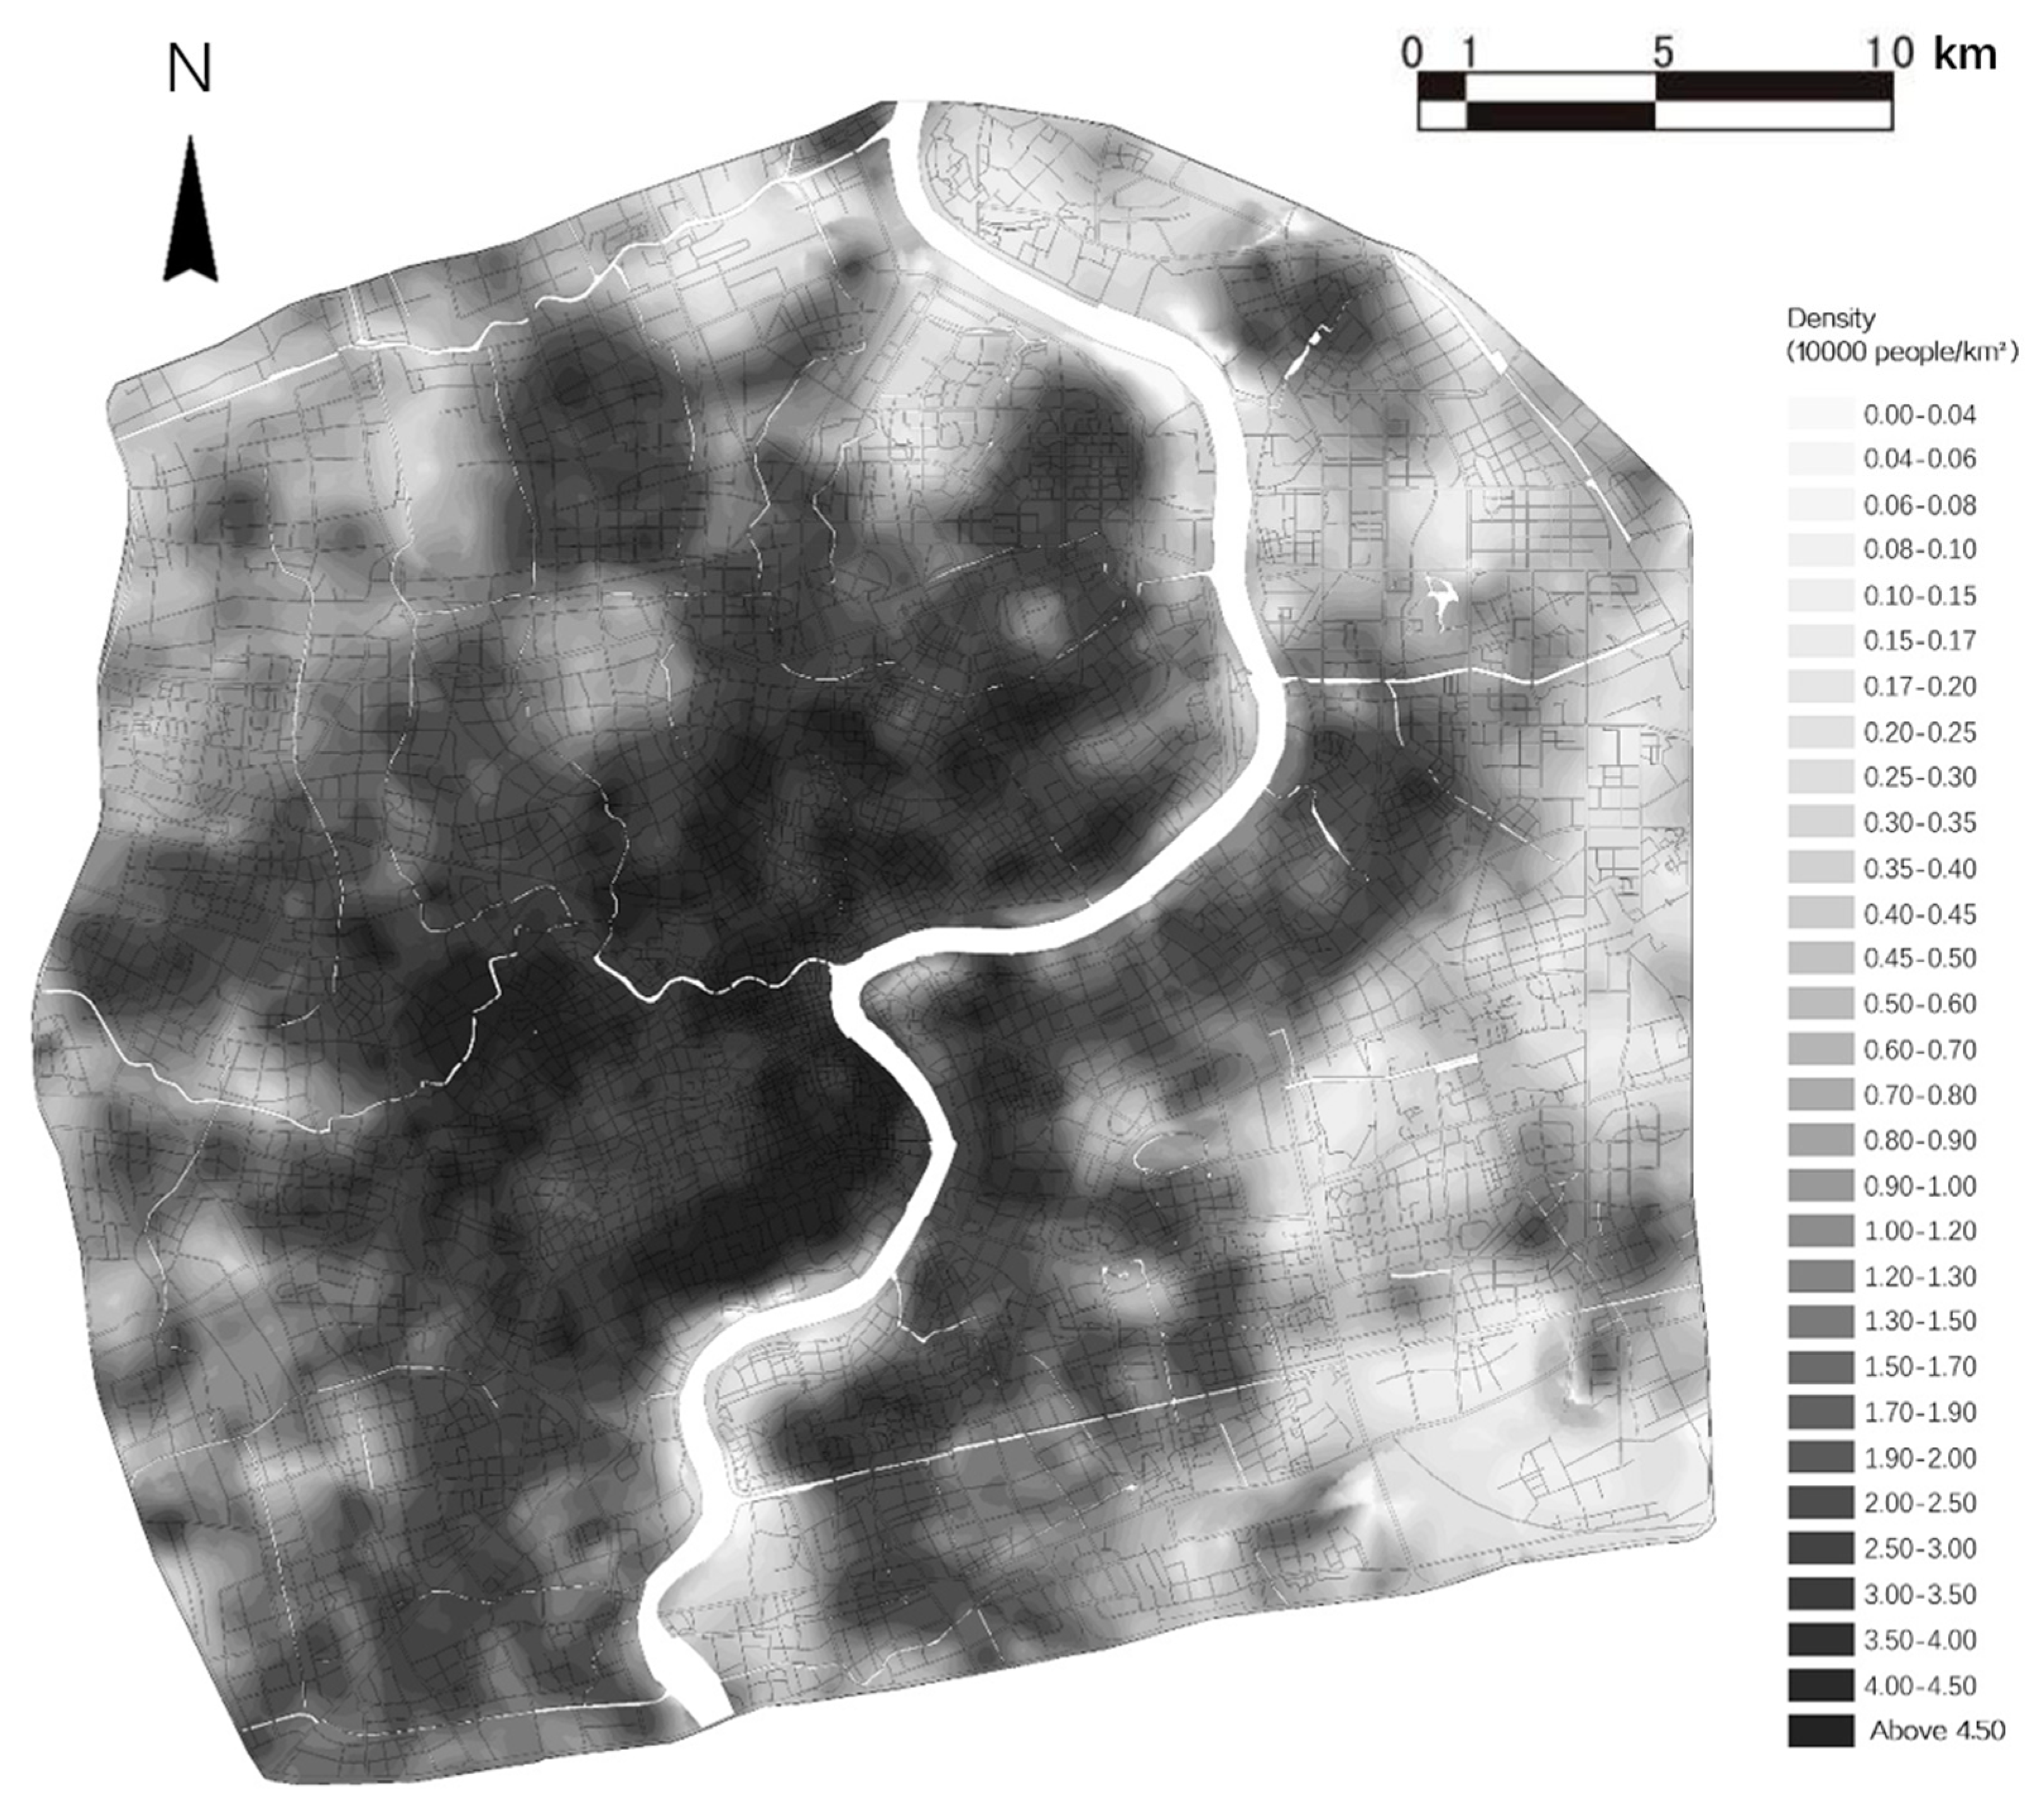
3.1. Characteristics of the Temporal Evolution of Urban Population Density
3.2. Correlation between the FAR and Average Population Density by Day
3.3. Correlation between the FAR of Public Service Facilities and Population Density from Day to Night
3.4. Correlation between the FAR of Non-Public Service Facilities and Population Density from Day to Night
4. Discussion
5. Conclusions
Author Contributions
Funding
Conflicts of Interest
References
- De Verteuil, G. Reconsidering the legacy of urban public facility location theory in human geography. Prog. Hum. Geogr. 2000, 24, 47–69. [Google Scholar] [CrossRef]
- Teitz, M.B. Toward a theory of urban public facility location. Pap. Reg. Sci. Assoc. 1968, 21, 35–51. [Google Scholar] [CrossRef]
- Brueckner, J.K.; Thisse, J.F.; Zenou, Y. Why is central Paris rich and downtown Detroit poor? Eur. Econ. Rev. 1999, 43, 91–107. [Google Scholar] [CrossRef]
- Li, H.; Wei, Y.H.D.; Yu, Z.; Tian, G. Amenity, accessibility and housing values in metropolitan USA: A study of Salt Lake County, Utah. Cities 2016, 59, 113–125. [Google Scholar] [CrossRef]
- Yuan, F.; Wei, Y.D.; Wu, J.W. Amenity effects of urban facilities on housing prices in China: Accessibility, scarcity, and urban spaces. Cities 2020, 96, 102433. [Google Scholar] [CrossRef]
- Setyono, D.A.; Cahyono, D.D.; Helmy, M. Measuring Service Capacity of Public Facilities Based on Supply Aspect (Case Study: Elementary School in Malang City). Procedia Soc. Behav. Sci. 2016, 227, 45–51. [Google Scholar] [CrossRef] [Green Version]
- Tahmasbi, B.; Mansourianfar, M.H.; Haghshenas, H.; Kim, I. Multimodal accessibility-based equity assessment of urban public facilities distribution. Sustain. Cities Soc. 2019, 49, 101633. [Google Scholar] [CrossRef]
- Delbosc, A.; Currie, G. Using Lorenz curves to assess public transport equity. J. Transp. Geogr. 2011, 19, 1252–1259. [Google Scholar] [CrossRef]
- Welch, T.F.; Mishra, S. A measure of equity for public transit connectivity. J. Transp. Geogr. 2013, 33, 29–41. [Google Scholar] [CrossRef]
- Manaugh, K.; Badami, M.G.; El-Geneidy, A.M. Integrating social equity into urban transportation planning: A critical evaluation of equity objectives and measures in transportation plans in North America. Transp. Policy 2015, 37, 167–176. [Google Scholar] [CrossRef]
- Goddard, M.; Smith, P. Equity of access to health care services: Theory and evidence from the UK. Soc. Sci. Med. 2001, 53, 1149–1162. [Google Scholar] [CrossRef]
- Marsh, M.T.; Schilling, D.A. Equity measurement in facility location analysis: A review and framework. Eur. J. Oper. Res. 1994, 74, 1–17. [Google Scholar] [CrossRef]
- McLay, L.A.; Mayorga, M.E. A dispatching model for server-to-customer systems that balances efficiency and equity. Manuf. Serv. Oper. Manag. 2013, 15, 205–220. [Google Scholar] [CrossRef]
- Chang, Z.; Chen, J.Y.; Li, W.F.; Li, X. Public transportation and the spatial inequality of urban park accessibility: New evidence from Hong Kong. Transp. Res. Part D Transp. Environ. 2019, 76, 111–122. [Google Scholar] [CrossRef]
- Dadashpoor, H.; Rostami, F.; Alizadeh, B. Is inequality in the distribution of urban facilities inequitable? Exploring a method for identifying spatial inequity in an Iranian city. Cities 2016, 52, 159–172. [Google Scholar] [CrossRef]
- Chen, A.; Bouferguene, Y.; Shen, M. Assessing accessibility-based service effectiveness (ABSEV) and social equity for urban bus transit: A sustainability perspective. Sustain. Cities Soc. 2019, 44, 499–510. [Google Scholar] [CrossRef]
- Taleai, M.; Sliuzas, R.; Flacke, J. An integrated framework to evaluate the equity of urban public facilities using spatial multi-criteria analysis. Cities 2014, 40, 56–69. [Google Scholar] [CrossRef]
- Jia, P.; Qiu, Y.; Gaughan, A.E. A fine-scale spatial population distribution on the High-resolution Gridded Population Surface and application in Alachua County, Florida. Appl. Geogr. 2014, 50, 99–107. [Google Scholar] [CrossRef]
- Deng, C.; Wu, C.; Wang, L. Improving the housing-unit method for small-area population estimation using remote-sensing and GIS information. Int. J. Remote Sens. 2010, 31, 5673–5688. [Google Scholar] [CrossRef]
- Murray, A.T.; Davis, R.; Stimson, R.J.; Ferreira, L. Public transportation access. Transp. Res. Part D Transp. Environ. 1998, 3, 319–328. [Google Scholar] [CrossRef] [Green Version]
- Pattnaik, S.B.; Mohan, S.; Tom, V.M. Urban bus transit route network design using genetic algorithm. J. Transp. Eng. 1998, 124, 368–375. [Google Scholar] [CrossRef]
- Zhong, W.; Wang, D.; Xie, D.; Yan, L. Dynamic characteristics of Shanghai’s population distribution using cell phone signaling data. Geogr. Res. 2017, 36, 972–984. [Google Scholar]
- Zhang, W. An analysis on the coordination of population distribution and service infrastructure distribution in Beijing. Soc. Sci. Beijing 2004, 1, 78–84. [Google Scholar]
- Yu, L.; Zhang, S.; Han, G. Spatial Feature Analysis of Alternation of Population Distribution in Shanghai. China Popul. Resour. Environ. 2006, 16, 83–87. [Google Scholar]
- Li, Z. Development Research of Tianjin Urban Commercial System and Planning Arrangement Structure. Ph.D. Thesis, Tianjin University, Tianjin, China, 2006. Available online: http://www.cnki.net/ (accessed on 9 January 2006).
- Shen, Q. Spatial Coordination of Population Distribution and Service Infrastructure Distribution in Shanghai. J. Gansu Sci. 2014, 26, 139–142. [Google Scholar]
- Kwon, O. Scaling laws between population and a public transportation system of urban buses. Phys. A 2018, 503, 209–214. [Google Scholar] [CrossRef]
- Reigadinha, T.; Godinho, P.; Dias, J. Portuguese food retailers—Exploring three classic theories of retail location. J. Retail. Consum. Serv. 2017, 34, 102–116. [Google Scholar] [CrossRef] [Green Version]
- Zhao, Z. The Study of Commercial Pattern Development in Changchun since 19th Century. 2014. Available online: http://www.cnki.net/ (accessed on 14 November 2019).
- Tu, W.; Zhu, T.T.; Xia, J.Z.; Zhou, Y.L.; Lai, Y.N.; Jiang, J.C.; Li, Q.Q. Portraying the spatial dynamics of urban vibrancy using multisource urban big data. Comput. Environ. Urban Syst. 2019, 101428. [Google Scholar] [CrossRef]
- He, Q.S.; He, W.S.; Song, Y.; Wu, J.Y.; Yin, C.H.; Mou, Y.C. The impact of urban growth patterns on urban vitality in newly built-up areas based on an association rules analysis using geographical ‘big data’. Land Use Policy 2018, 78, 726–738. [Google Scholar] [CrossRef]
- Rathore, M.M.; Ahmad, A.; Paul, A.; Rho, S.M. Urban planning and building smart cities based on the Internet of Things using Big Data analytics. Comput. Netw. 2016, 101, 63–80. [Google Scholar] [CrossRef]
- Niu, X.Y.; Ding, L.; Song, X.D. Understanding Spatial Structure of Shanghai Central City Based on Mobile Phone data. Urban Plan. Forum 2014, 6, 61–67. [Google Scholar]
- Lee, K.S.; You, S.Y.; Eom, J.K.; Song, J.Y.; Min, J.H. Urban spatiotemporal analysis using mobile phone data: Case study of medium- and large-sized Korean cities. Habitat Int. 2018, 73, 6–15. [Google Scholar] [CrossRef]
- Liu, Y.L.; Fang, F.G.; Jing, Y. How urban land use influences commuting flows in Wuhan, Central China: A mobile phone signaling data perspective. Sustain. Cities Soc. 2020, 53, 101914. [Google Scholar] [CrossRef]
- Guo, S.H.; Song, C.; Pei, T.; Liu, Y.X.; Ma, T.; Du, Y.Y.; Chen, J.; Fan, Z.D.; Tang, X.L.; Peng, Y.; et al. Accessibility to urban parks for elderly residents: Perspectives from mobile phone data. Landsc. Urban Plan. 2019, 191, 103642. [Google Scholar] [CrossRef]
- Anda, C.; Medina, S.A.O.; Fourie, P. Multi-agent urban transport simulations using OD matrices from mobile phone data. Procedia Comput. Sci. 2018, 130, 803–809. [Google Scholar] [CrossRef]
- Calabrese, F.; Ratti, C. Real time Rome. Netw. Commun. Stud. 2006, 20, 247–258. [Google Scholar]
- Pulselli, R.; Ramono, P.; Ratti, C.; Tiezzi, E. Computing urban mobile landscapes through monitoring population density based on cellphone chatting. Int. J. Des. Nat. Ecodynamics 2008, 3, 121–134. [Google Scholar]
- Reades, J.; Calabrese, F.; Sevtsuk, A.; Ratti, C. Cellular census: Explorations in urban data collection. IEEE Pervasive Comput. 2007, 6, 30–38. [Google Scholar] [CrossRef] [Green Version]
- Girardin, F.; Calabrese, F.; Dal, F.F.; Ratti, C.; Blat, J. Digital footprinting: Uncovering tourists with user-generated content. IEEE Pervasive Comput. 2008, 7, 36–43. [Google Scholar] [CrossRef] [Green Version]
- Girardin, F.; Vaccari, A.; Gerber, A.; Biderman, A.; Ratti, C. Towards Estimating the Presence of Visitors from the Aggregate Mobile Phone Network Activity They Generate. In Proceedings of the International Conference on Computers in Urban Planning and Urban Management, Hong Kong, China, 16–18 June 2009. [Google Scholar]
- Isaacman, S.; Becker, R.; Cáceres, R.; Kobourov, S.; Rowland, J.; Varshavsky, A. A Tale of Two Cities. In Proceedings of the Eleventh Workshop on Mobile Computing Systems Applications, Annapolis, MD, USA, 22–23 February 2010; ACM: New York, NY, USA, 2010; pp. 19–24. [Google Scholar]
- Calabrese, F.; Di, L.G.; Liu, L.; Ratti, C. Estimating Origin-Destination flows using opportunistically collected mobile phone location data from one million users in Boston Metropolitan Area. IEEE Pervasive Comput. 2011, 10, 36–44. [Google Scholar] [CrossRef]
- Deville, P.; Linard, C.; Martin, S.; Gilbert, M.; Stevens, F.R.; Gaughan, A.E.; Blondel, V.D.; Tatem, A.J. Dynamic population mapping using mobile phone data. Proc. Natl. Acad. Sci. USA 2014, 111, 15888–15893. [Google Scholar] [CrossRef] [PubMed] [Green Version]
- Janzen, M.; Vanhoof, M.; Smoreda, Z.; Axhausen, K.W. Closer to the total? Long-distance travel of French mobile phone users. Travel Behav. Soc. 2018, 11, 31–42. [Google Scholar] [CrossRef]
- Murphy, R.E.; Vance, J.E. Delimiting the CBD. Econ. Geogr. 1954, 30, 34. [Google Scholar] [CrossRef]
- Yang, J.; Shi, B. Research on the Quantitative Definition Method of Urban Center Boundaries. J. Hum. Settl. West China 2014, 29, 17–21. [Google Scholar]
- Li, J.G.; Li, J.W.; Yuan, Y.G.; Li, G.F. Spatiotemporal distribution characteristics and mechanism analysis of urban population density: A case of Xi’an, Shaanxi, China. Cities 2019, 86, 62–70. [Google Scholar] [CrossRef]
- Kirk, W. Problems of geography. Geography 1963, 48, 357–371. [Google Scholar]
- Horton, F.E.; Reynolds, D.R. Effects of urban spatial structure on individual behavior. Econ. Geogr. 1971, 47, 36–48. [Google Scholar] [CrossRef]
- Golledge, R.G.; Stimson, R.J. Spatial Behavior: A Geographic Perspective; The Guilford Press: New York, NY, USA, 1997. [Google Scholar]
- Chapin, F.S. Human Activity Patterns in the City: Things People Do in Time and in Space; John Wiley Sons: New York, NY, USA, 1974. [Google Scholar]
- Arai, Y. Topological space of life and daily activities. Reg. Dev. 1985, 10, 45–56. [Google Scholar]
- Arai, Y. Basic structure and problem of living activity space in city. J. Econ. Shinshu Univ. 1992, 29, 27–67. [Google Scholar]
- Arai, Y.; Okamoto, K.; Kamiya, H. Taro Kawaguchi: Urban Space and Time-Time Geography of Living Activities; Kokon Shoin: Tokyo, Japan, 1996. [Google Scholar]
- Yeh, A.G.O.; Chow, M.H. An integrated GIS and location-allocation approach to public facilities planning—An example of open space planning. Comput. Environ. Urban Syst. 1996, 20, 339–350. [Google Scholar] [CrossRef]


| Types of Public Service Facilities | Building Area (10,000 m2) |
|---|---|
| Retail | 3858.37 |
| Business | 5674.56 |
| Financial | 735.68 |
| Hotel | 749.48 |
| Conference and Exhibition | 286.82 |
| Wholesale | 293.80 |
| Administration | 396.52 |
| Culture and Art | 290.91 |
| Hospital | 384.08 |
| Sports | 138.78 |
| Research Institution | 1105.72 |
| Total | 13,914.73 |
| Time Density | Time Density | Time Density | …… | Time Density | |
|---|---|---|---|---|---|
| plot | …… | ||||
| plot | …… | ||||
| plot | …… | ||||
| …… | …… | …… | …… | …… | …… |
| plot | …… |
| Dependent Variables | Corresponding Evaluation Factor | Measurement Units |
| FAR | Ratio of total construction area to land use area (%) | |
| FAR of public service facilities | Ratio of construction area of public service facilities to land use area (%) | |
| FAR of non-public service facilities | Ratio of construction area of non-public service facilities to land use area (%) | |
| Independent Variables | Corresponding Evaluation Factor | Measurement Units |
| Daily population density | Per capita/per square meter | |
| Day-time population density (10 a.m.–11 a.m.) | Per capita/per square meter | |
| Night-time population density (4 a.m.–5 a.m.) | Per capita/per square meter |
| Independent Variable | Dependent Variable | R2 | Standardized Coefficient | Sig. |
|---|---|---|---|---|
| daily population density () | FAR () | 0.644 | 0.802 | 0.000 |
| daily population density () | FAR of public service facilities () | 0.653 | 0.808 | 0.000 |
| Daily population density () | FAR of non-public service facilities () | 0.637 | 0.798 | 0.000 |
| Independent Variable | Dependent Variable | R2 | Standardized Coefficients | Sig. |
|---|---|---|---|---|
| Day-time population density () | FAR () | 0.613 | 0.783 | 0.000 |
| Night-time population density () | FAR () | 0.625 | 0.791 | 0.000 |
| Day-time population density () | FAR of public service facilities () | 0.706 | 0.840 | 0.000 |
| Night-time population density () | FAR of public service facilities () | 0.441 | 0.664 | 0.000 |
| Independent Variable | Dependent Variable | R2 | Standardized Coefficients | Sig. |
|---|---|---|---|---|
| Day-time population density () | FAR () | 0.613 | 0.783 | 0.000 |
| Night-time population density () | FAR () | 0.625 | 0.791 | 0.000 |
| Day-time population density () | FAR of non-public service facilities () | 0.585 | 0.765 | 0.000 |
| Night-time population density () | FAR of non-public service facilities () | 0.639 | 0.799 | 0.000 |
© 2020 by the authors. Licensee MDPI, Basel, Switzerland. This article is an open access article distributed under the terms and conditions of the Creative Commons Attribution (CC BY) license (http://creativecommons.org/licenses/by/4.0/).
Share and Cite
Shi, Y.; Yang, J.; Shen, P. Revealing the Correlation between Population Density and the Spatial Distribution of Urban Public Service Facilities with Mobile Phone Data. ISPRS Int. J. Geo-Inf. 2020, 9, 38. https://doi.org/10.3390/ijgi9010038
Shi Y, Yang J, Shen P. Revealing the Correlation between Population Density and the Spatial Distribution of Urban Public Service Facilities with Mobile Phone Data. ISPRS International Journal of Geo-Information. 2020; 9(1):38. https://doi.org/10.3390/ijgi9010038
Chicago/Turabian StyleShi, Yi, Junyan Yang, and Peiyu Shen. 2020. "Revealing the Correlation between Population Density and the Spatial Distribution of Urban Public Service Facilities with Mobile Phone Data" ISPRS International Journal of Geo-Information 9, no. 1: 38. https://doi.org/10.3390/ijgi9010038
APA StyleShi, Y., Yang, J., & Shen, P. (2020). Revealing the Correlation between Population Density and the Spatial Distribution of Urban Public Service Facilities with Mobile Phone Data. ISPRS International Journal of Geo-Information, 9(1), 38. https://doi.org/10.3390/ijgi9010038