Comparison of Post-fire Patterns in Brazilian Savanna and Tropical Forest from Remote Sensing Time Series

 ,
,  ,
,  and
and
Abstract
:
1. Introduction
2. Materials and Methods
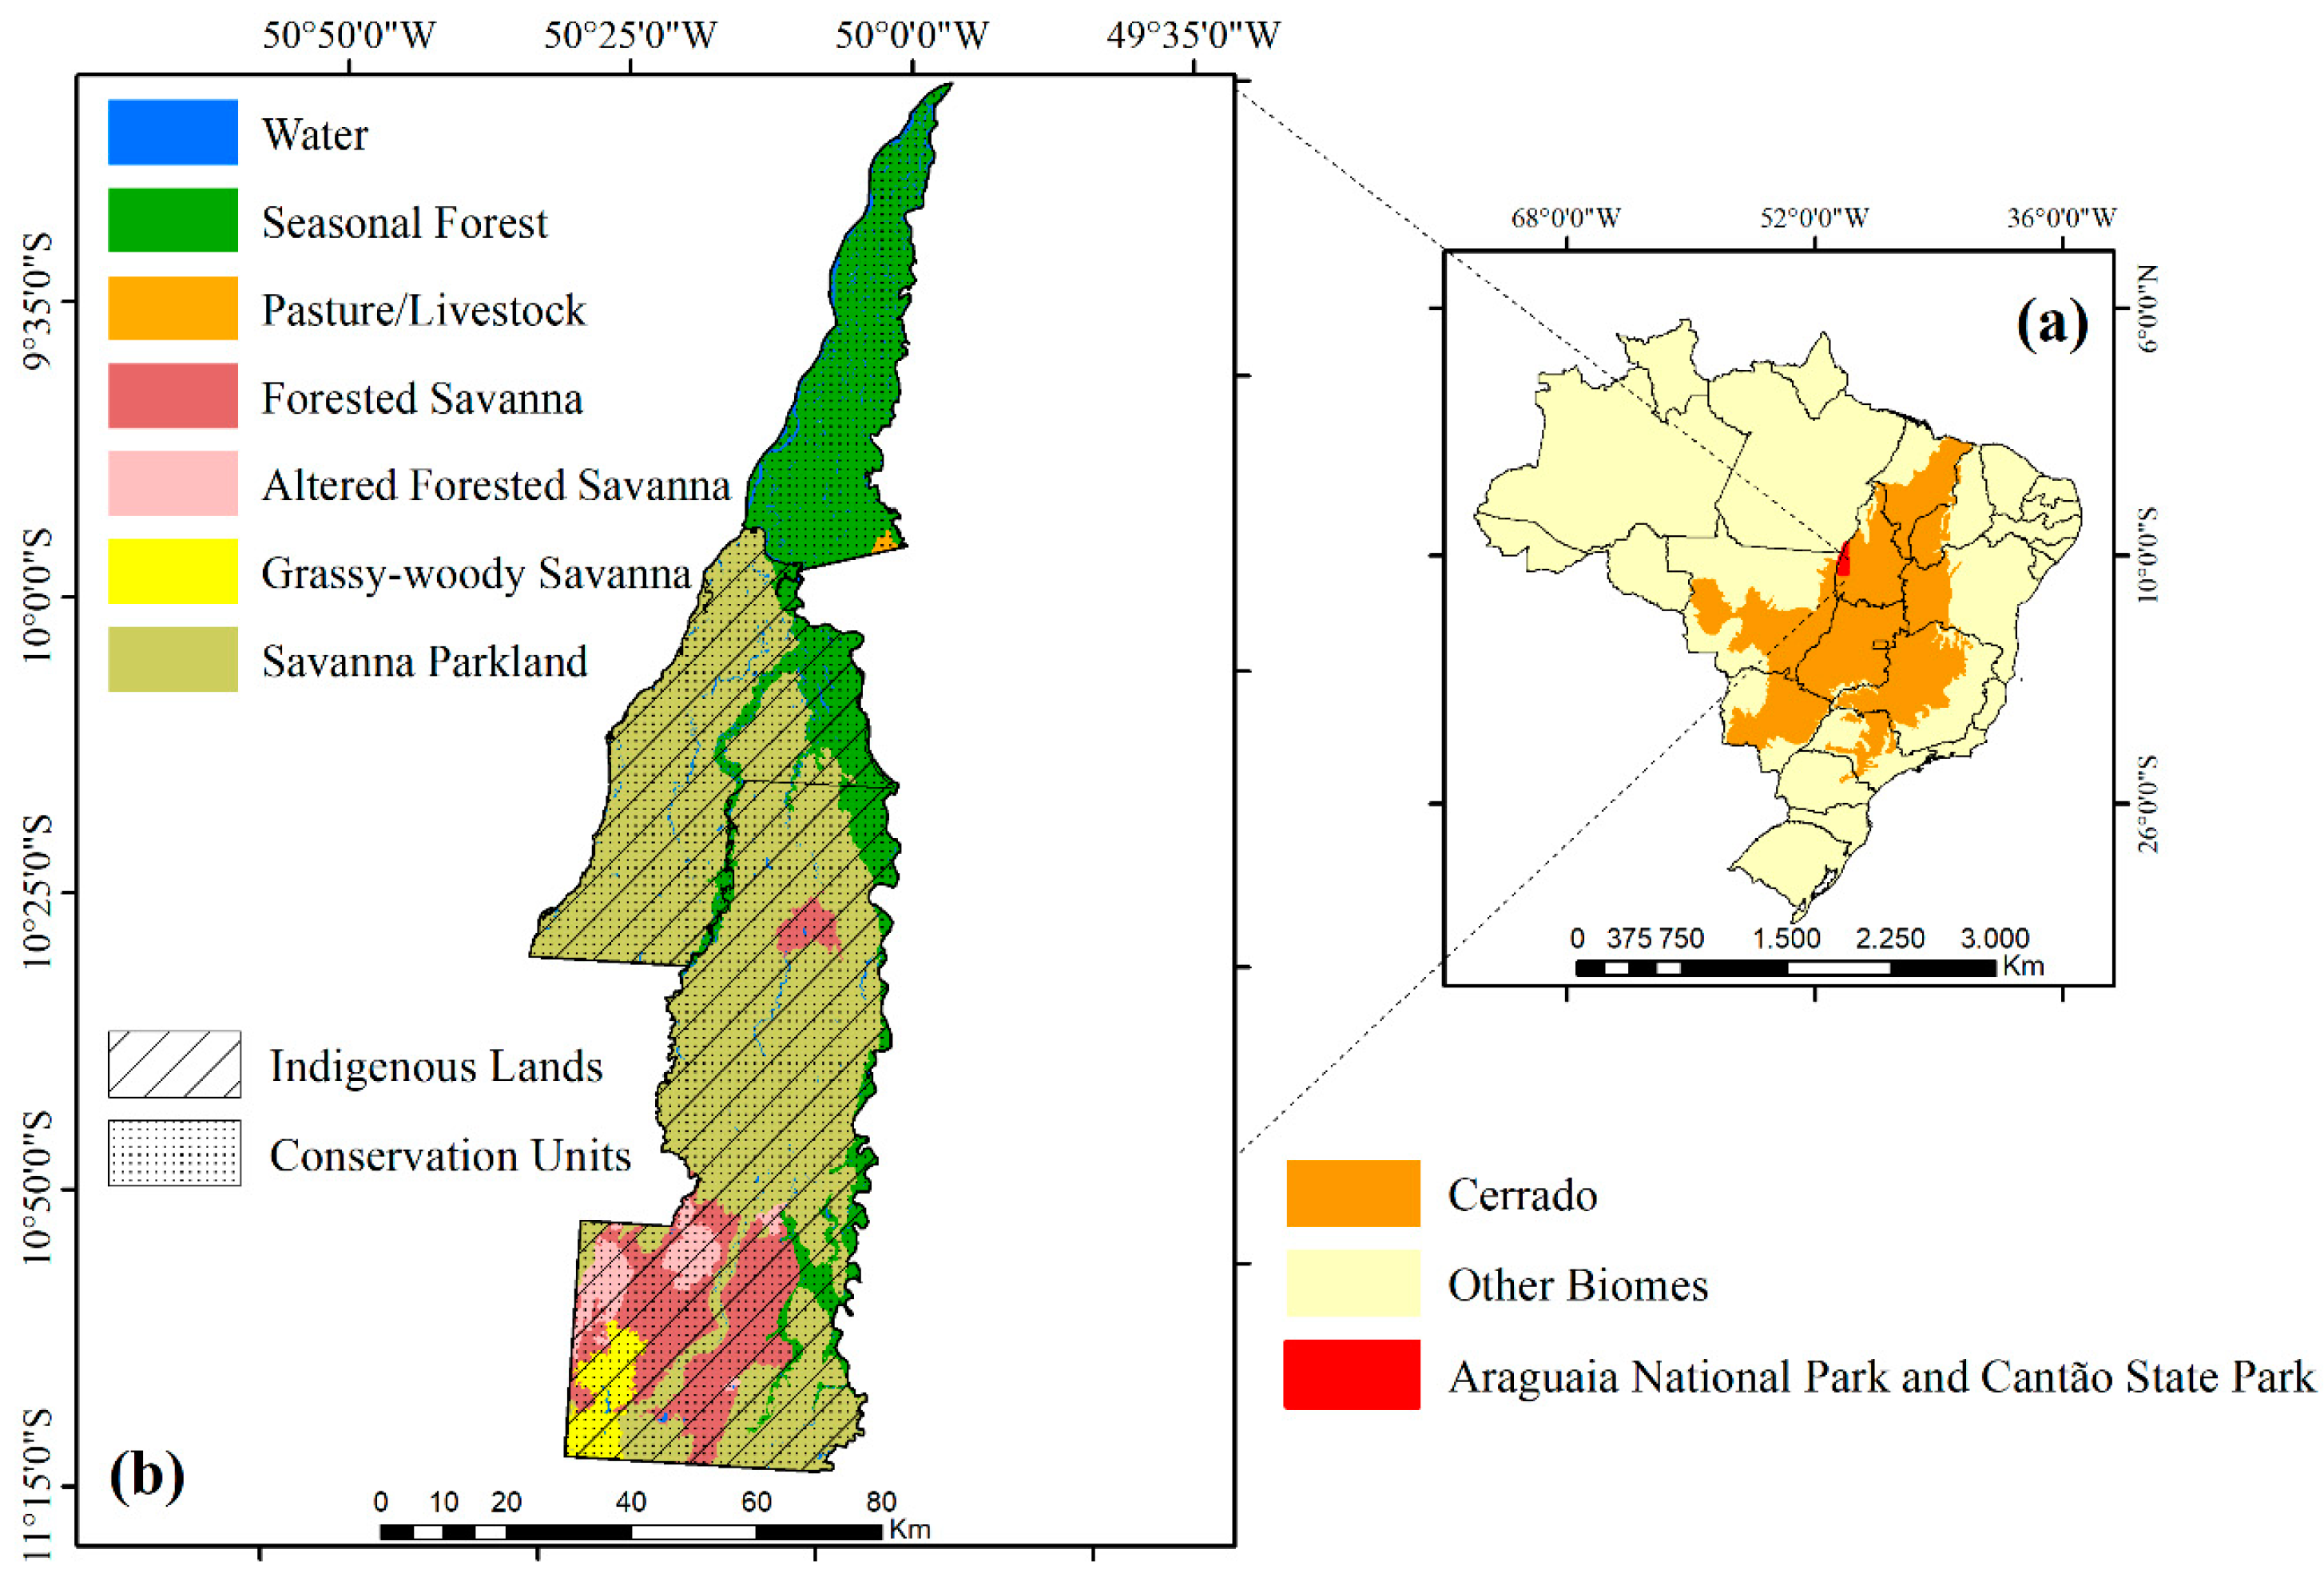
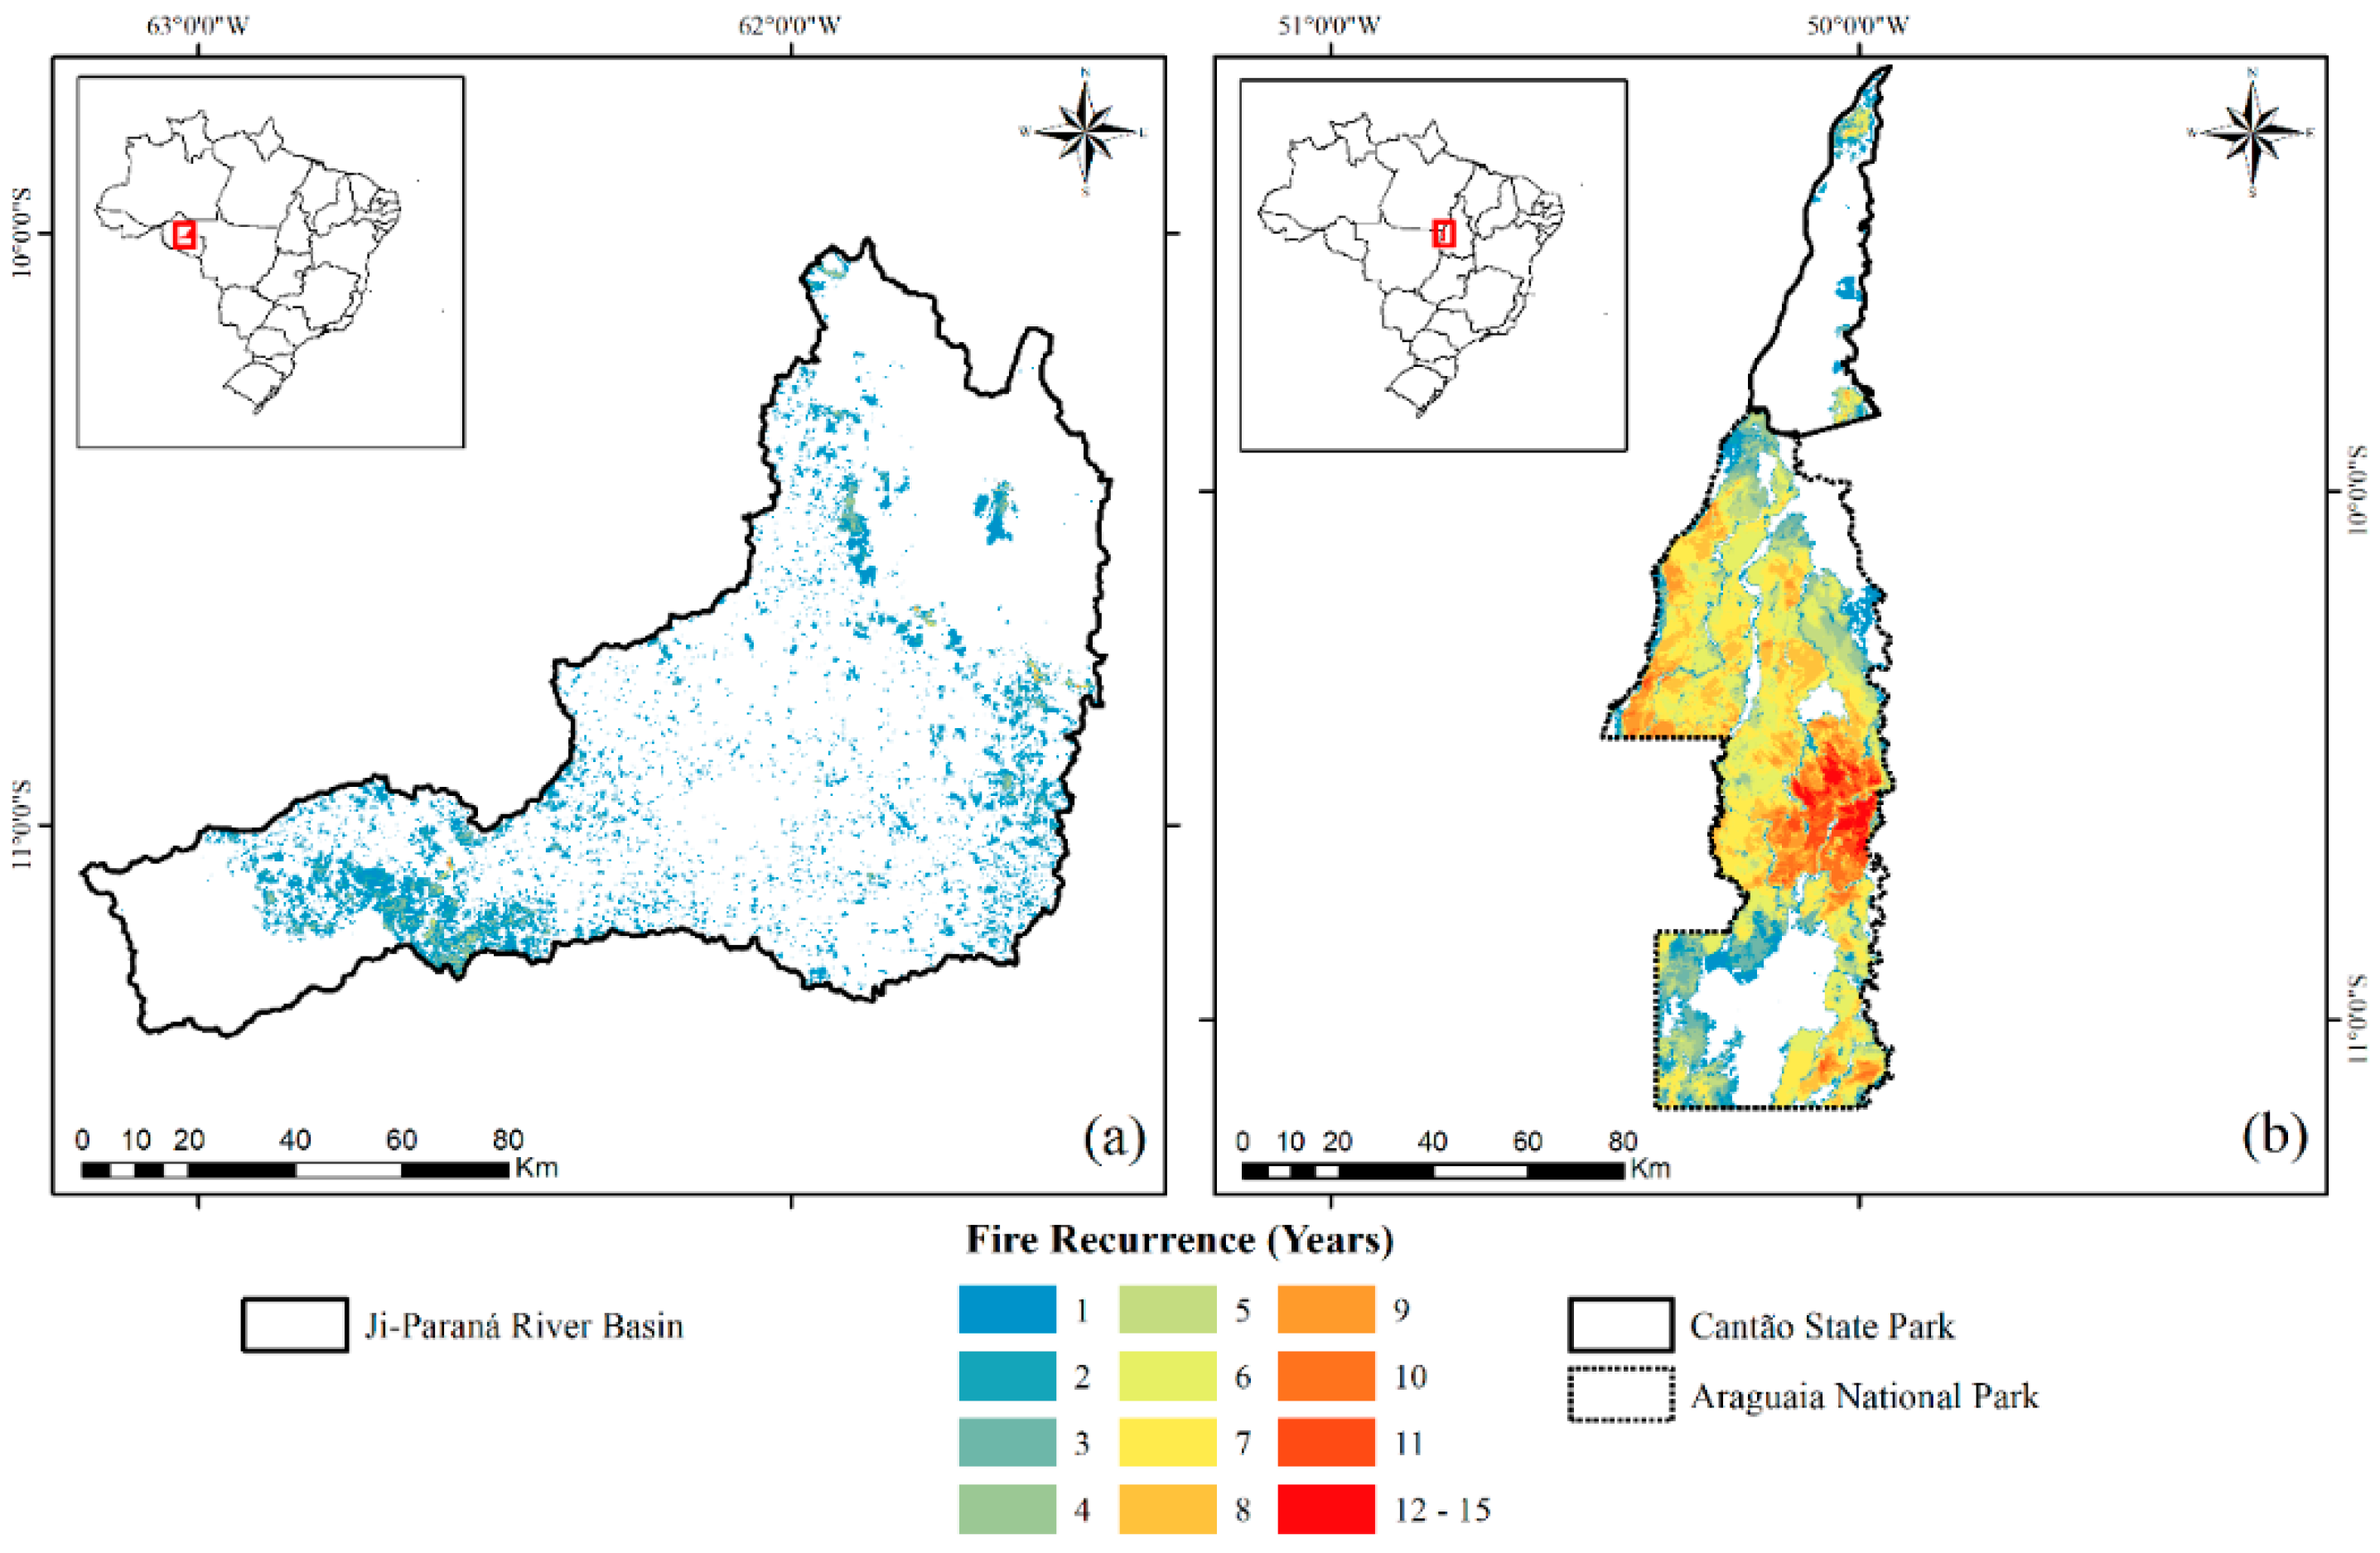
2.1. Study Area
2.2. MODIS Dataset
2.3. Ground Measurements
2.4. Burned Area
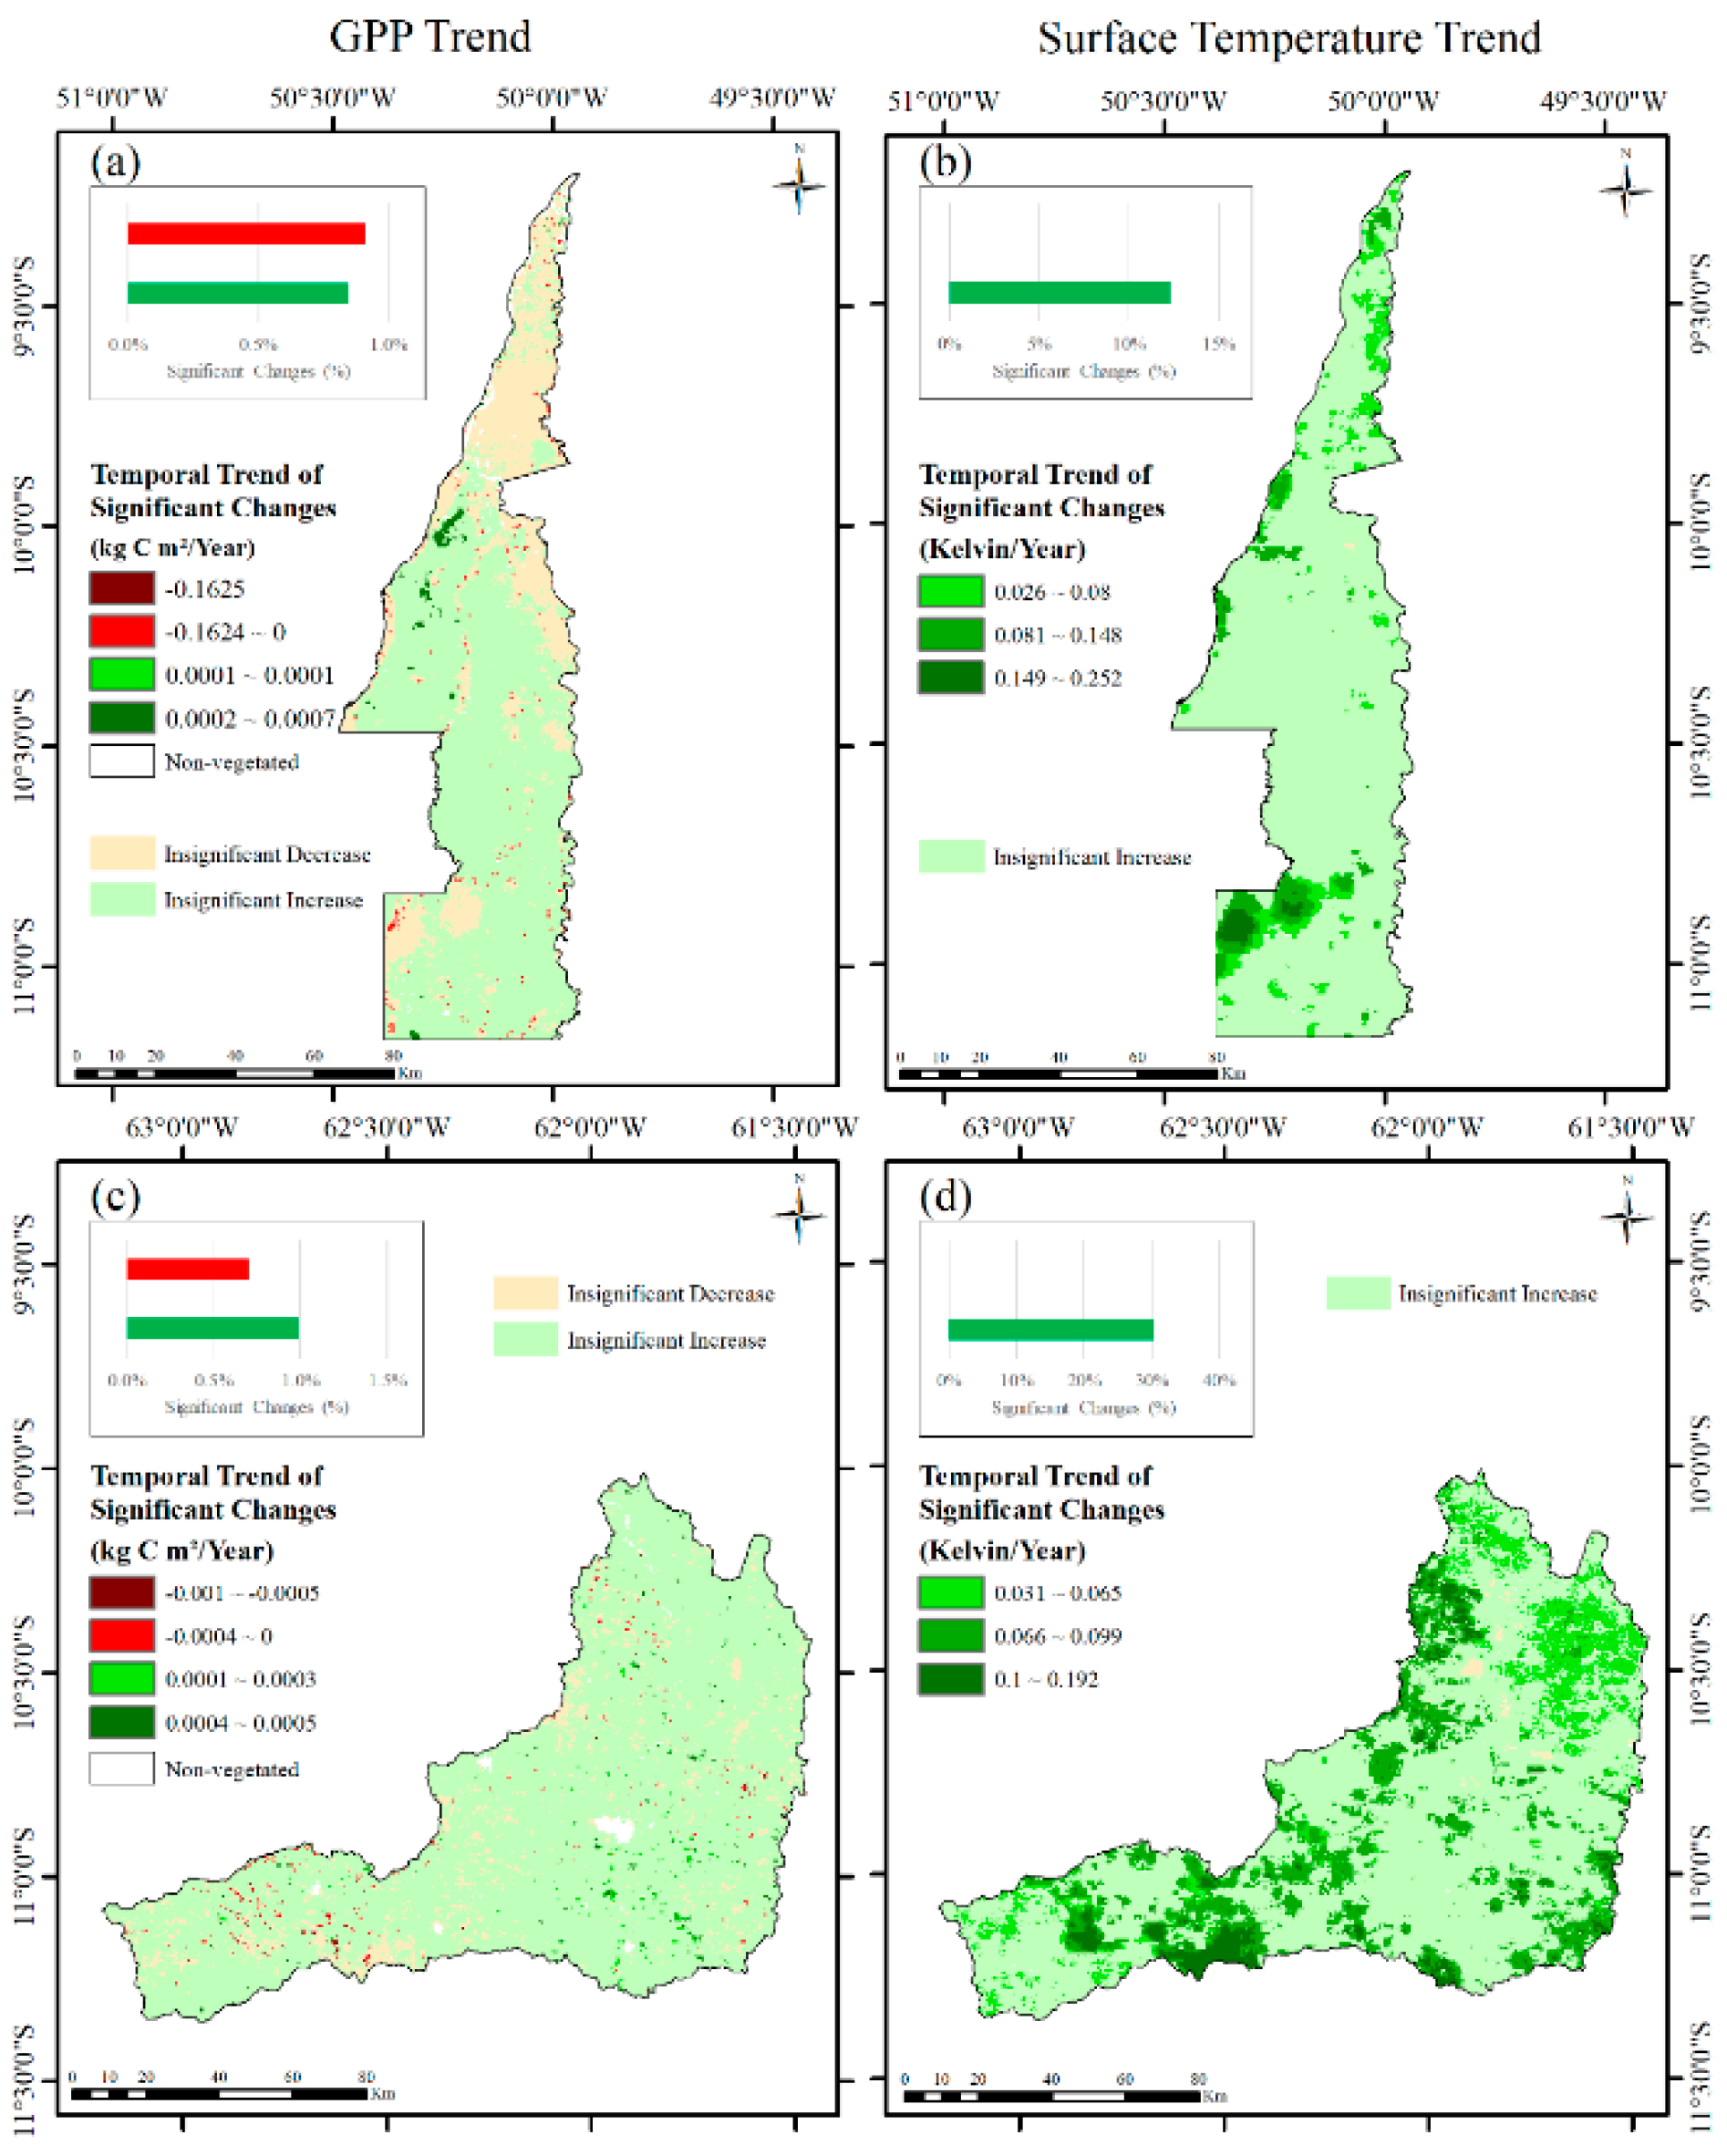
2.5. Temporal Trend
3. Results
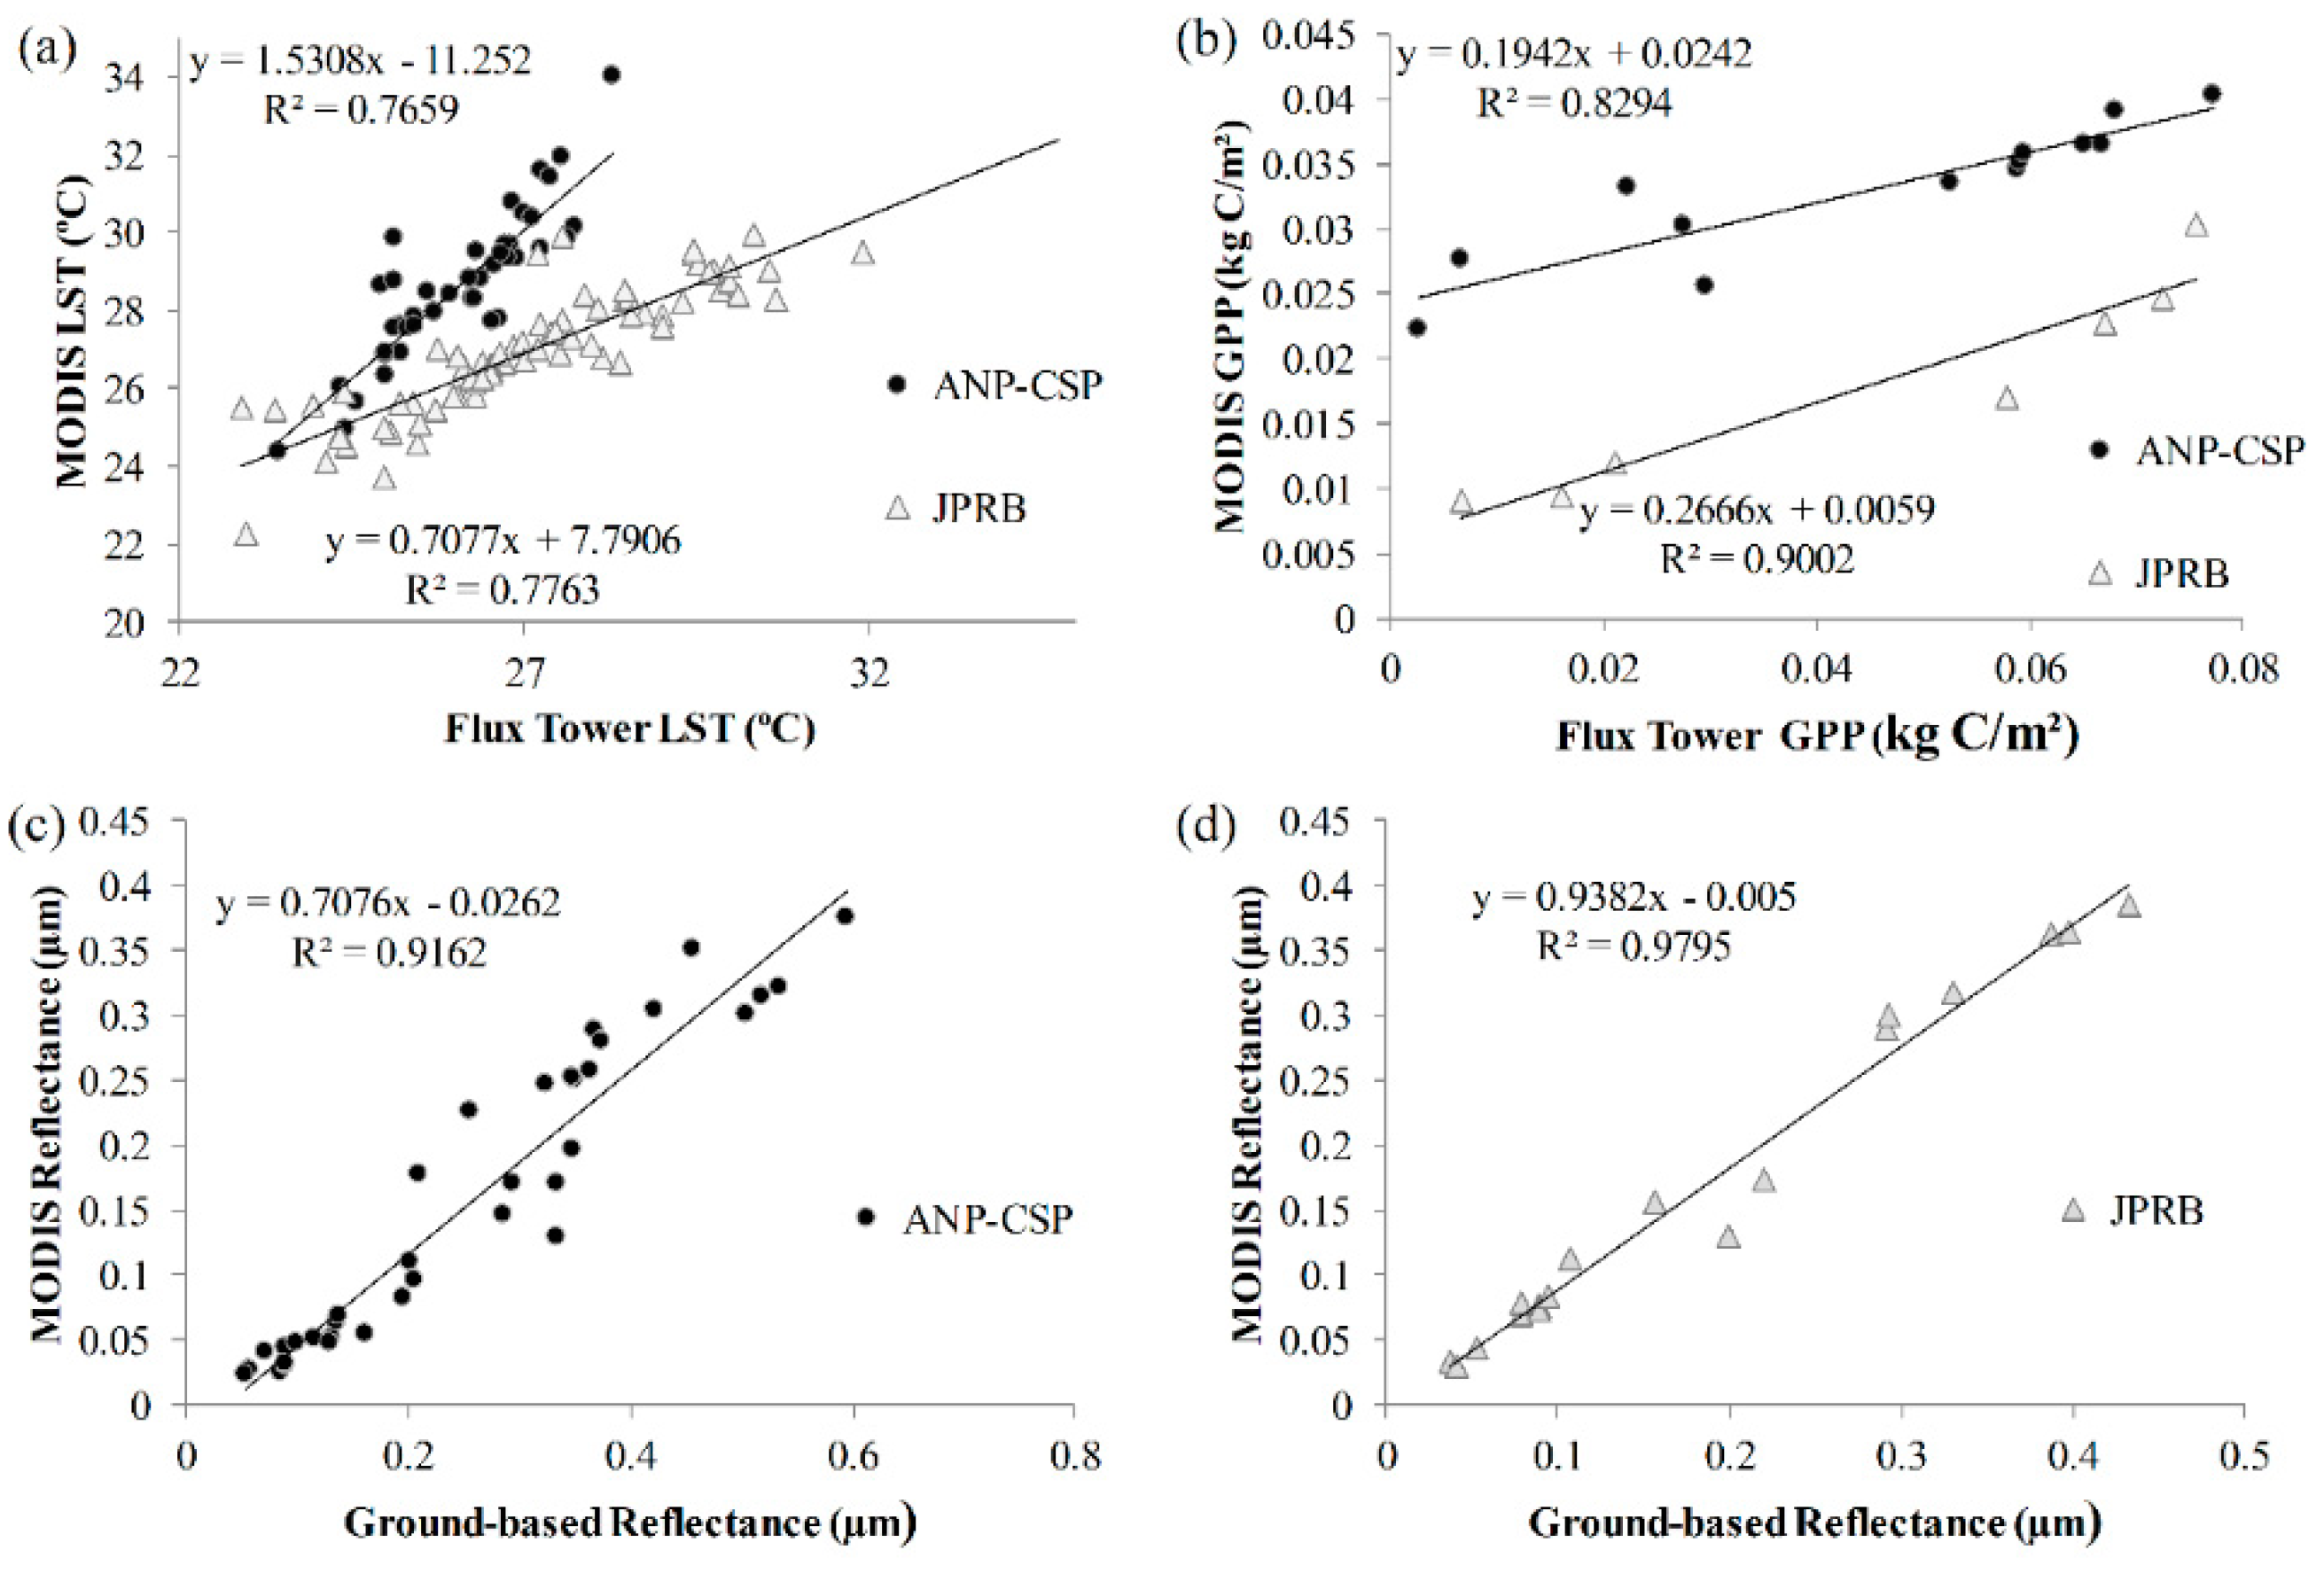
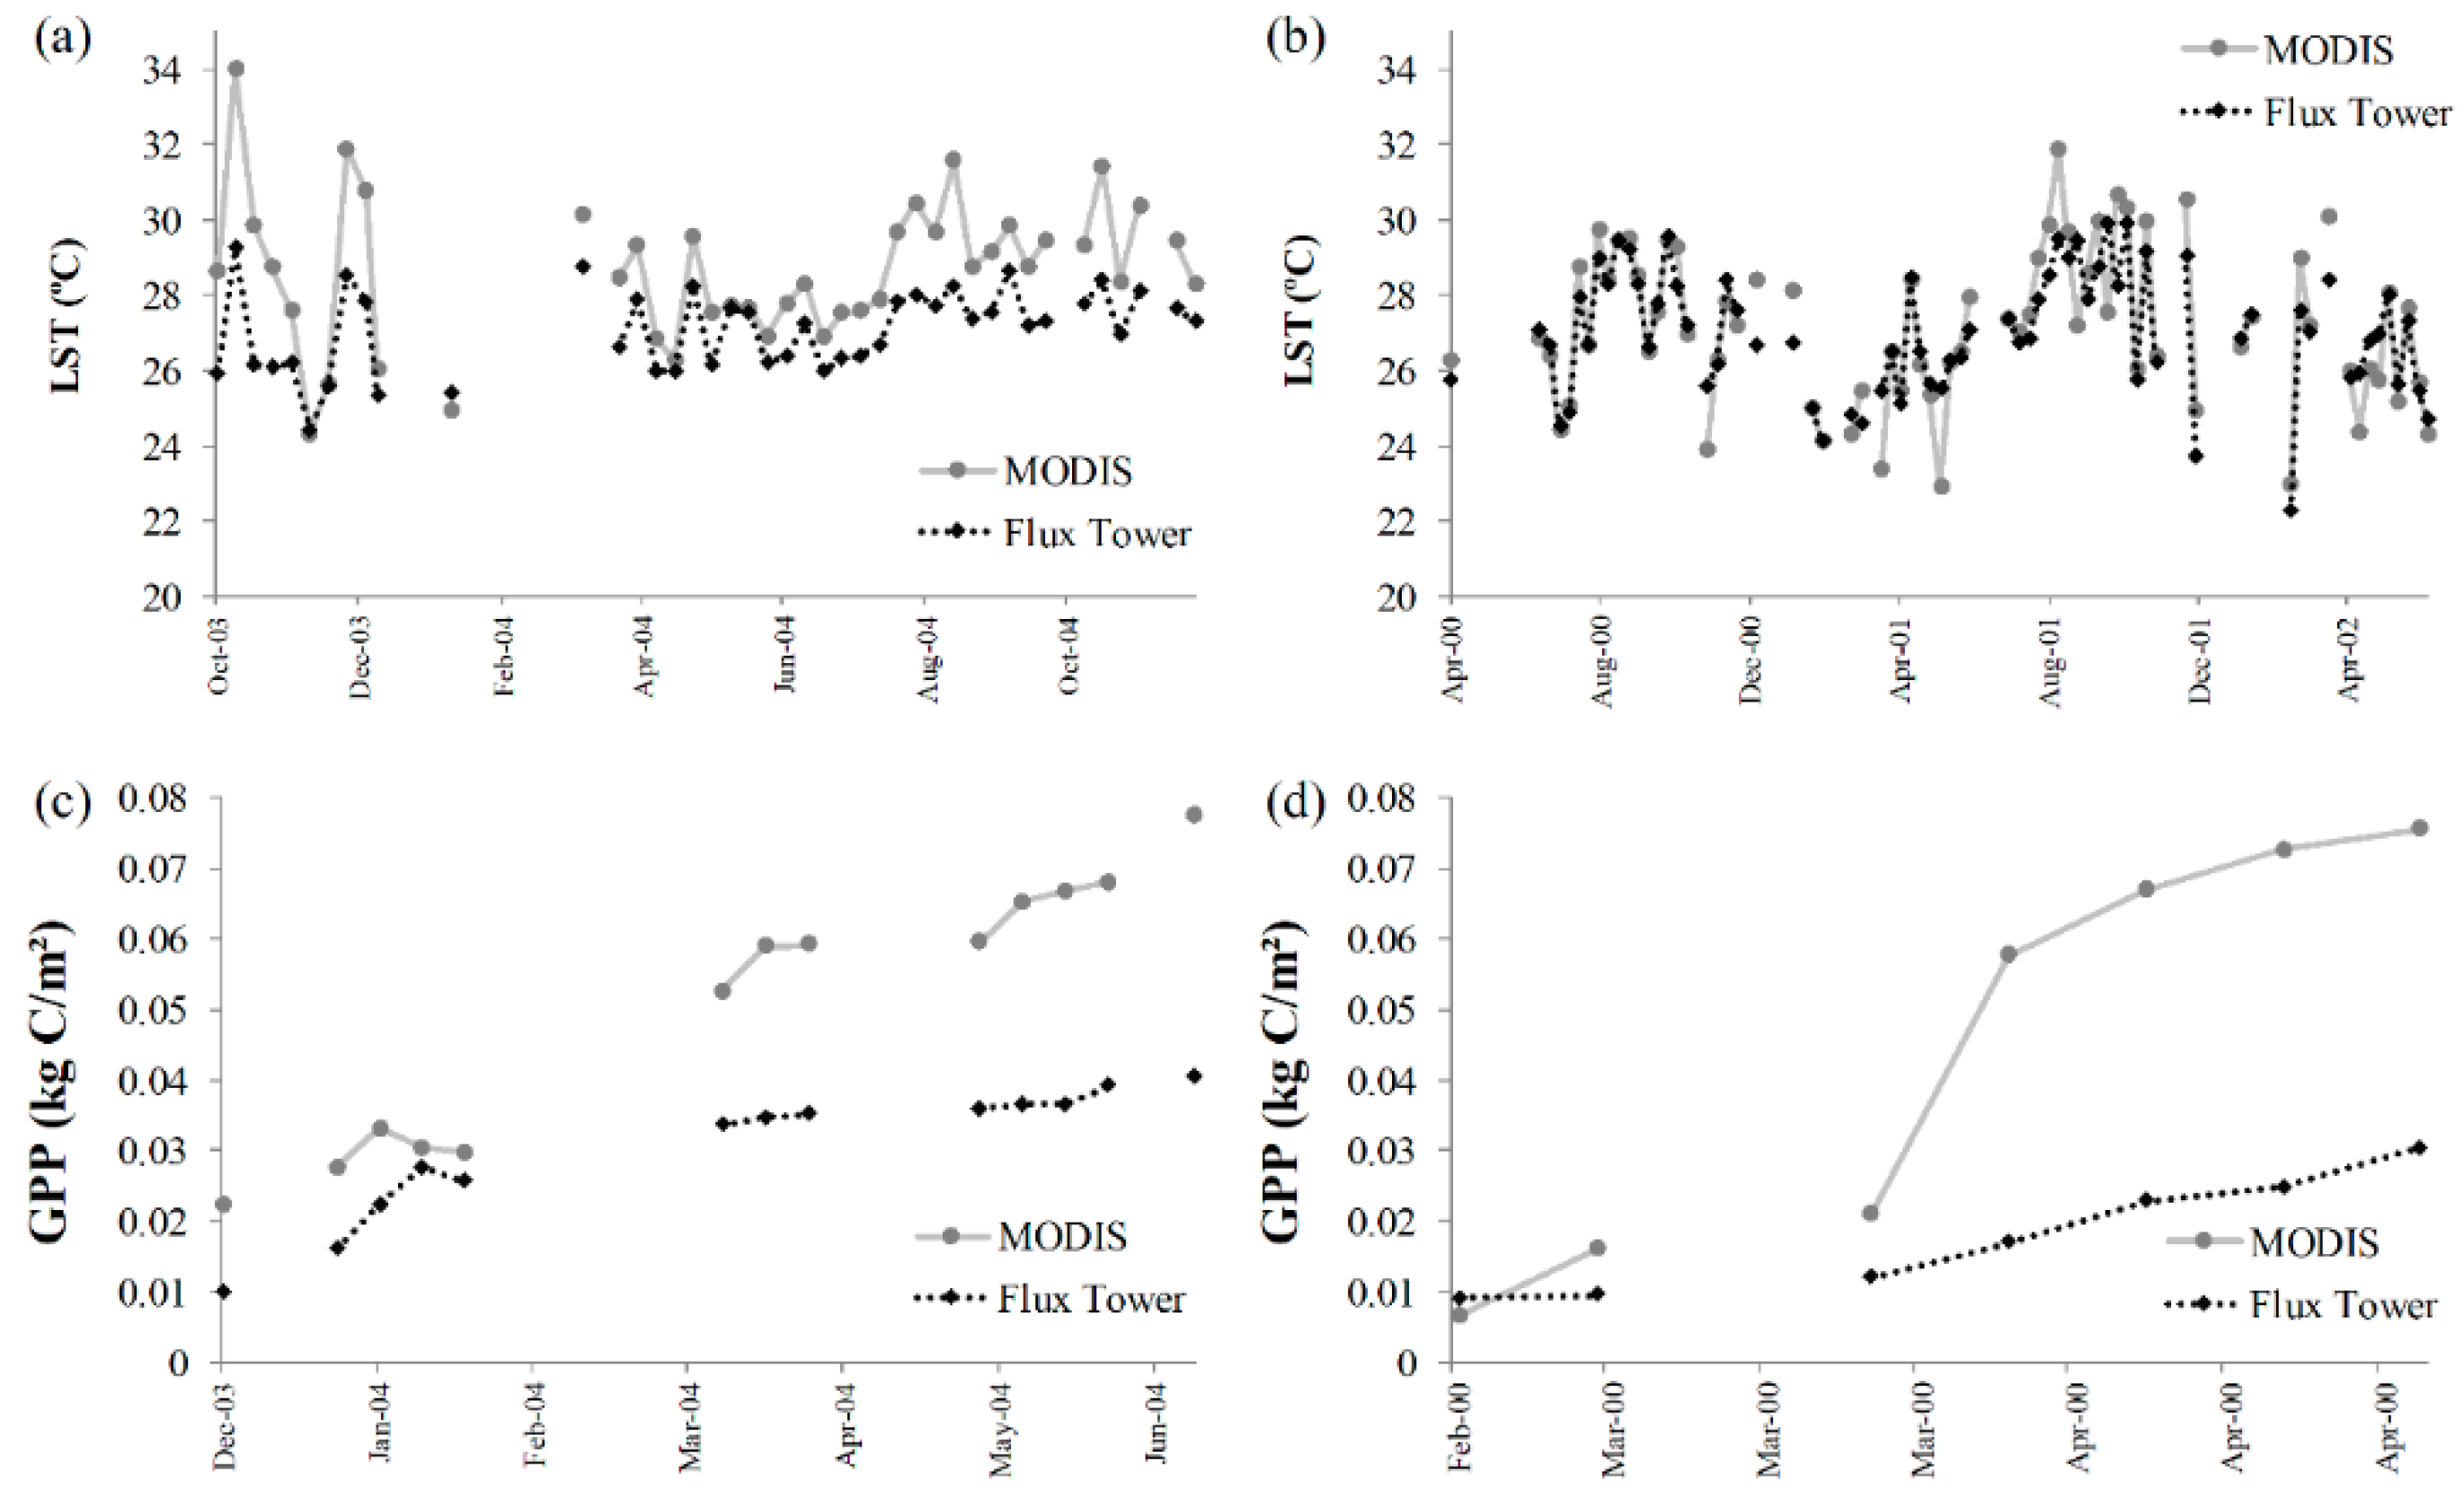
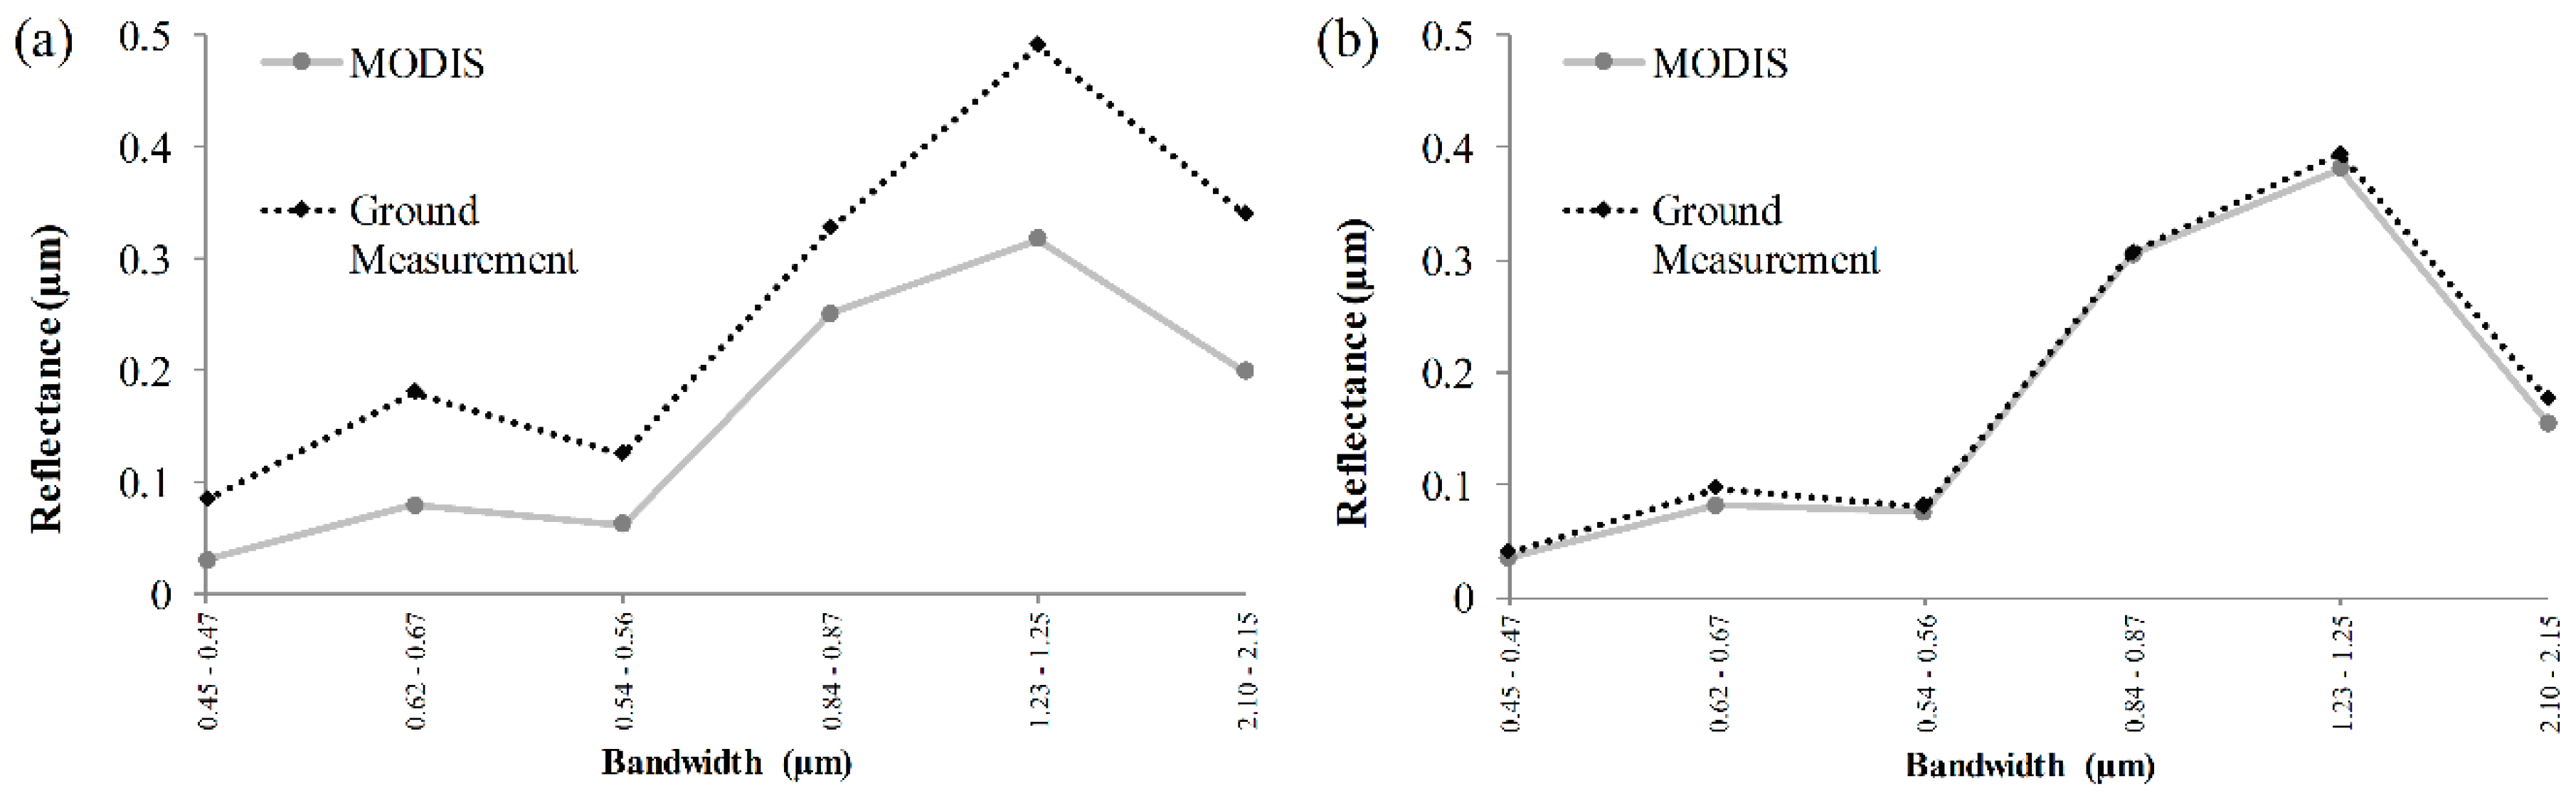
3.1. Validation of MODIS Biophysical Data
3.2. Fire Recurrence
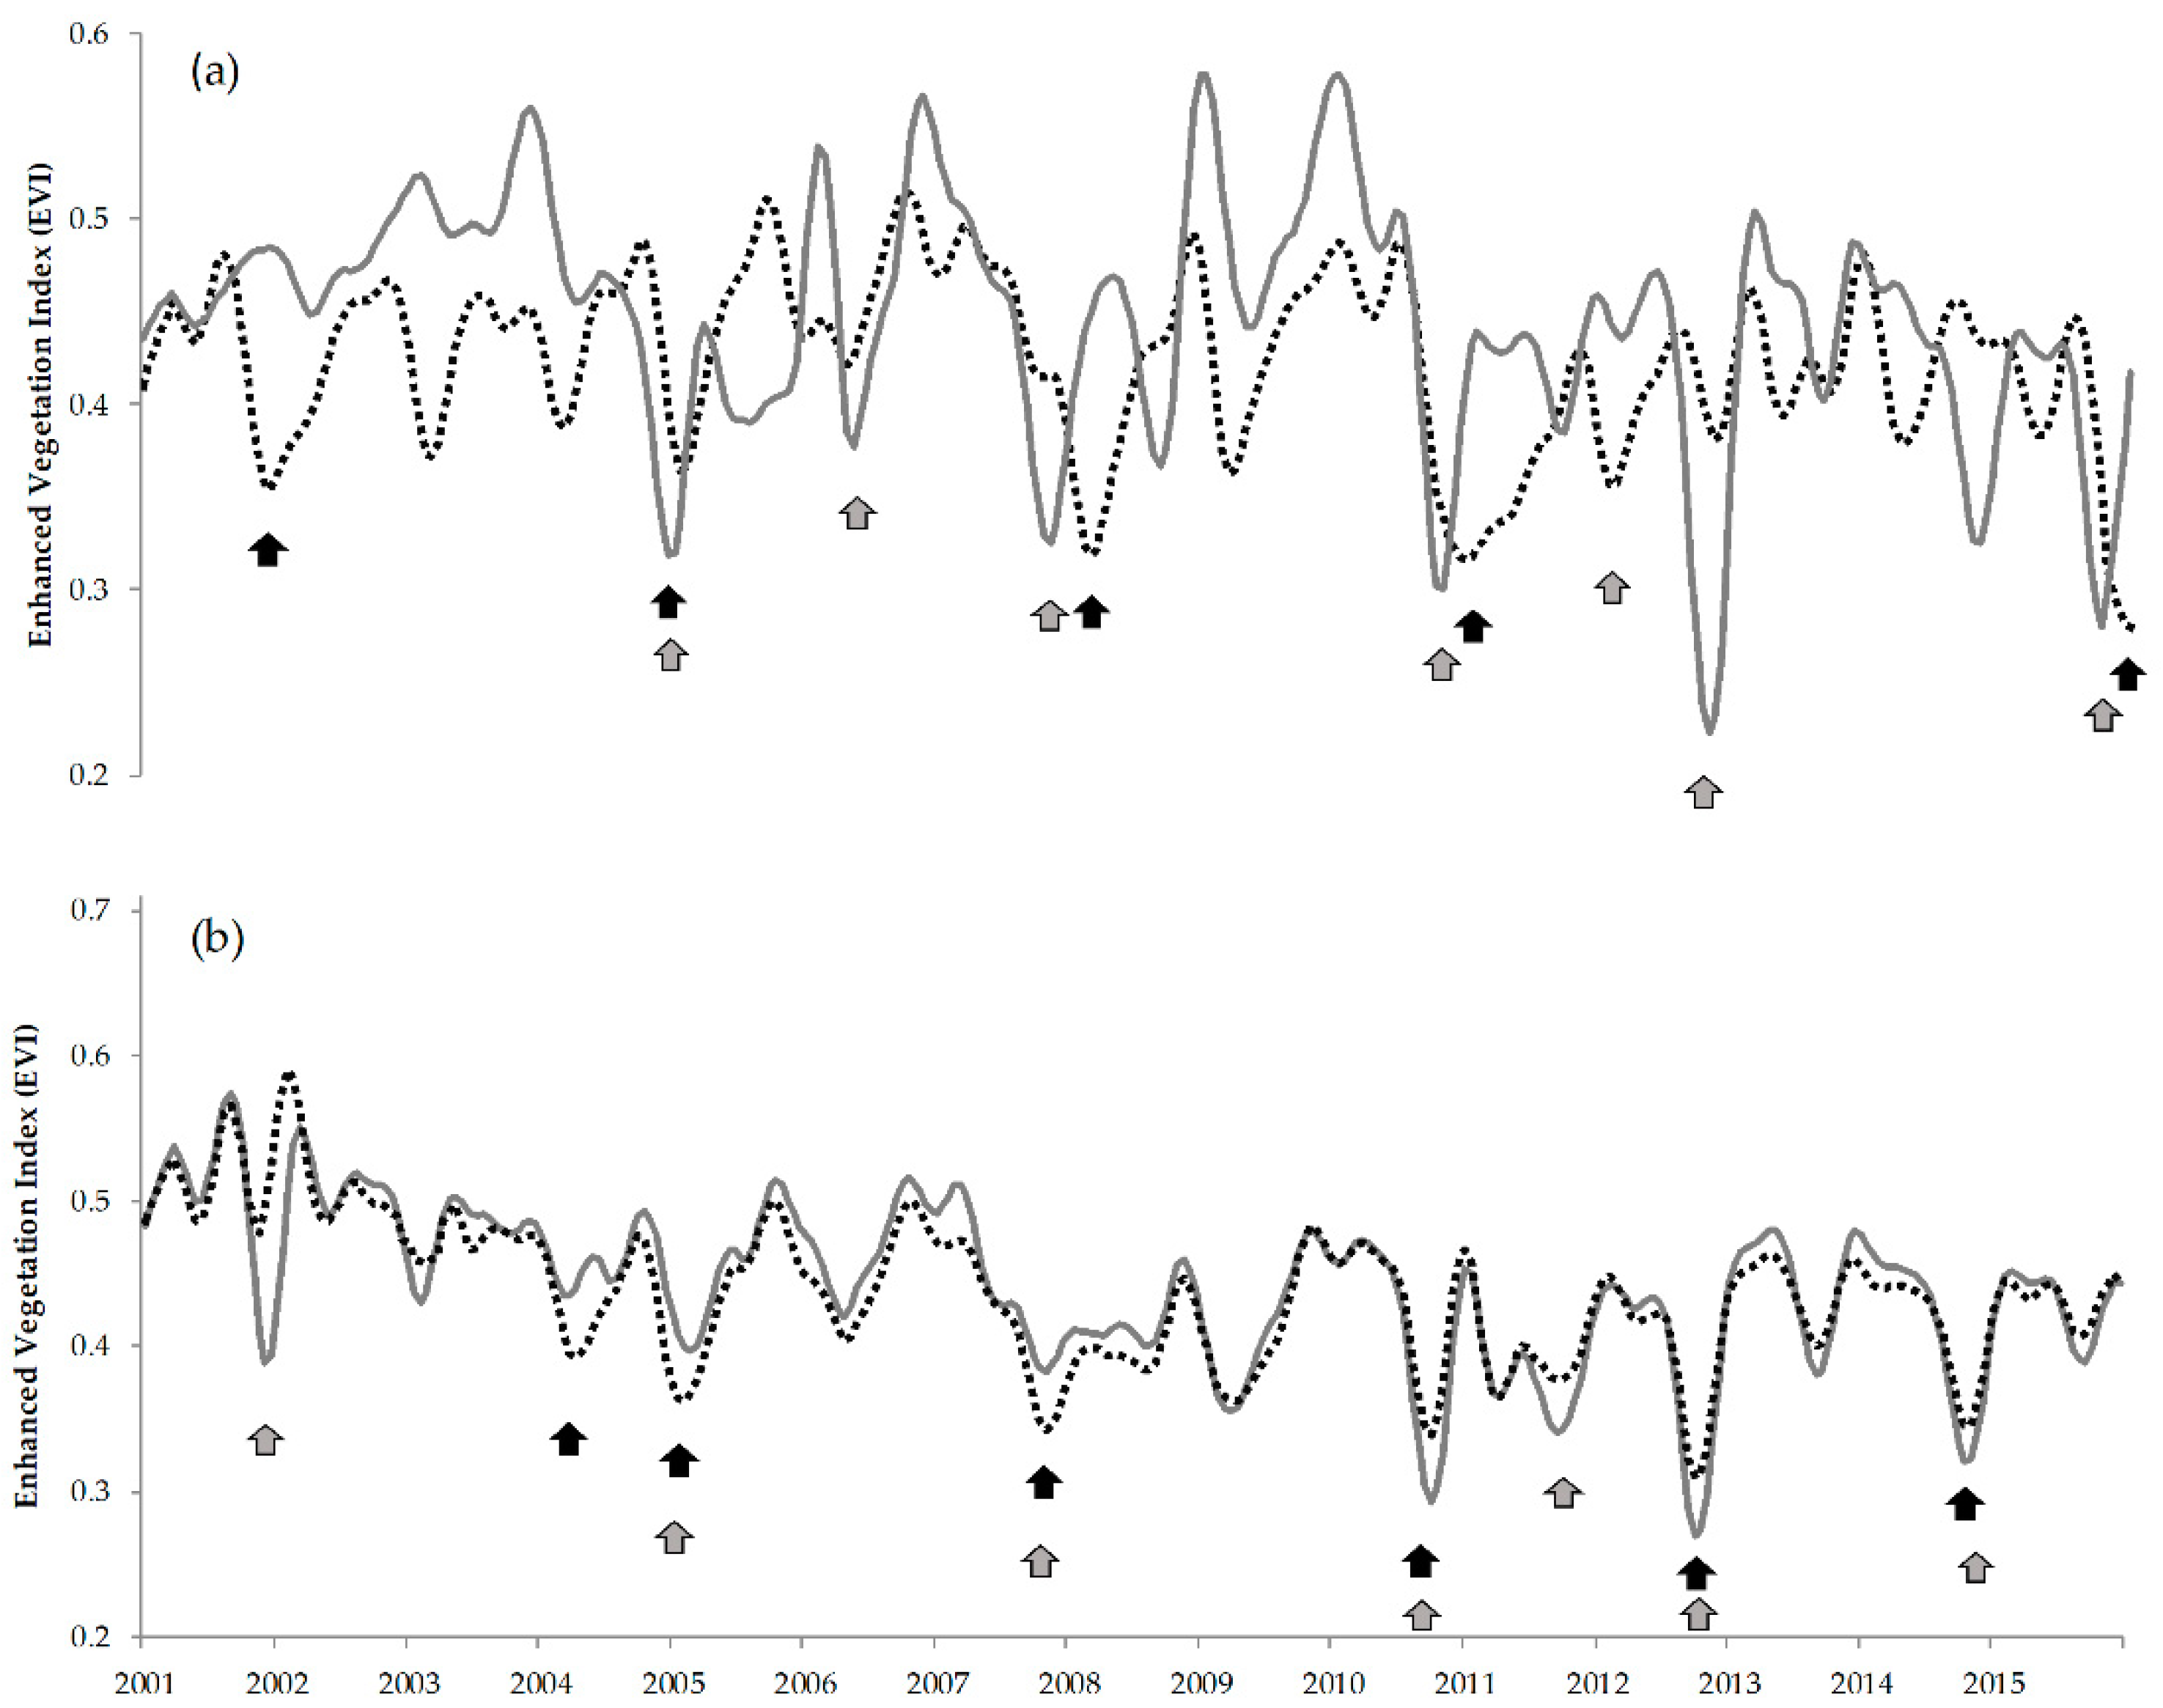
3.3. Vegetation Dynamics
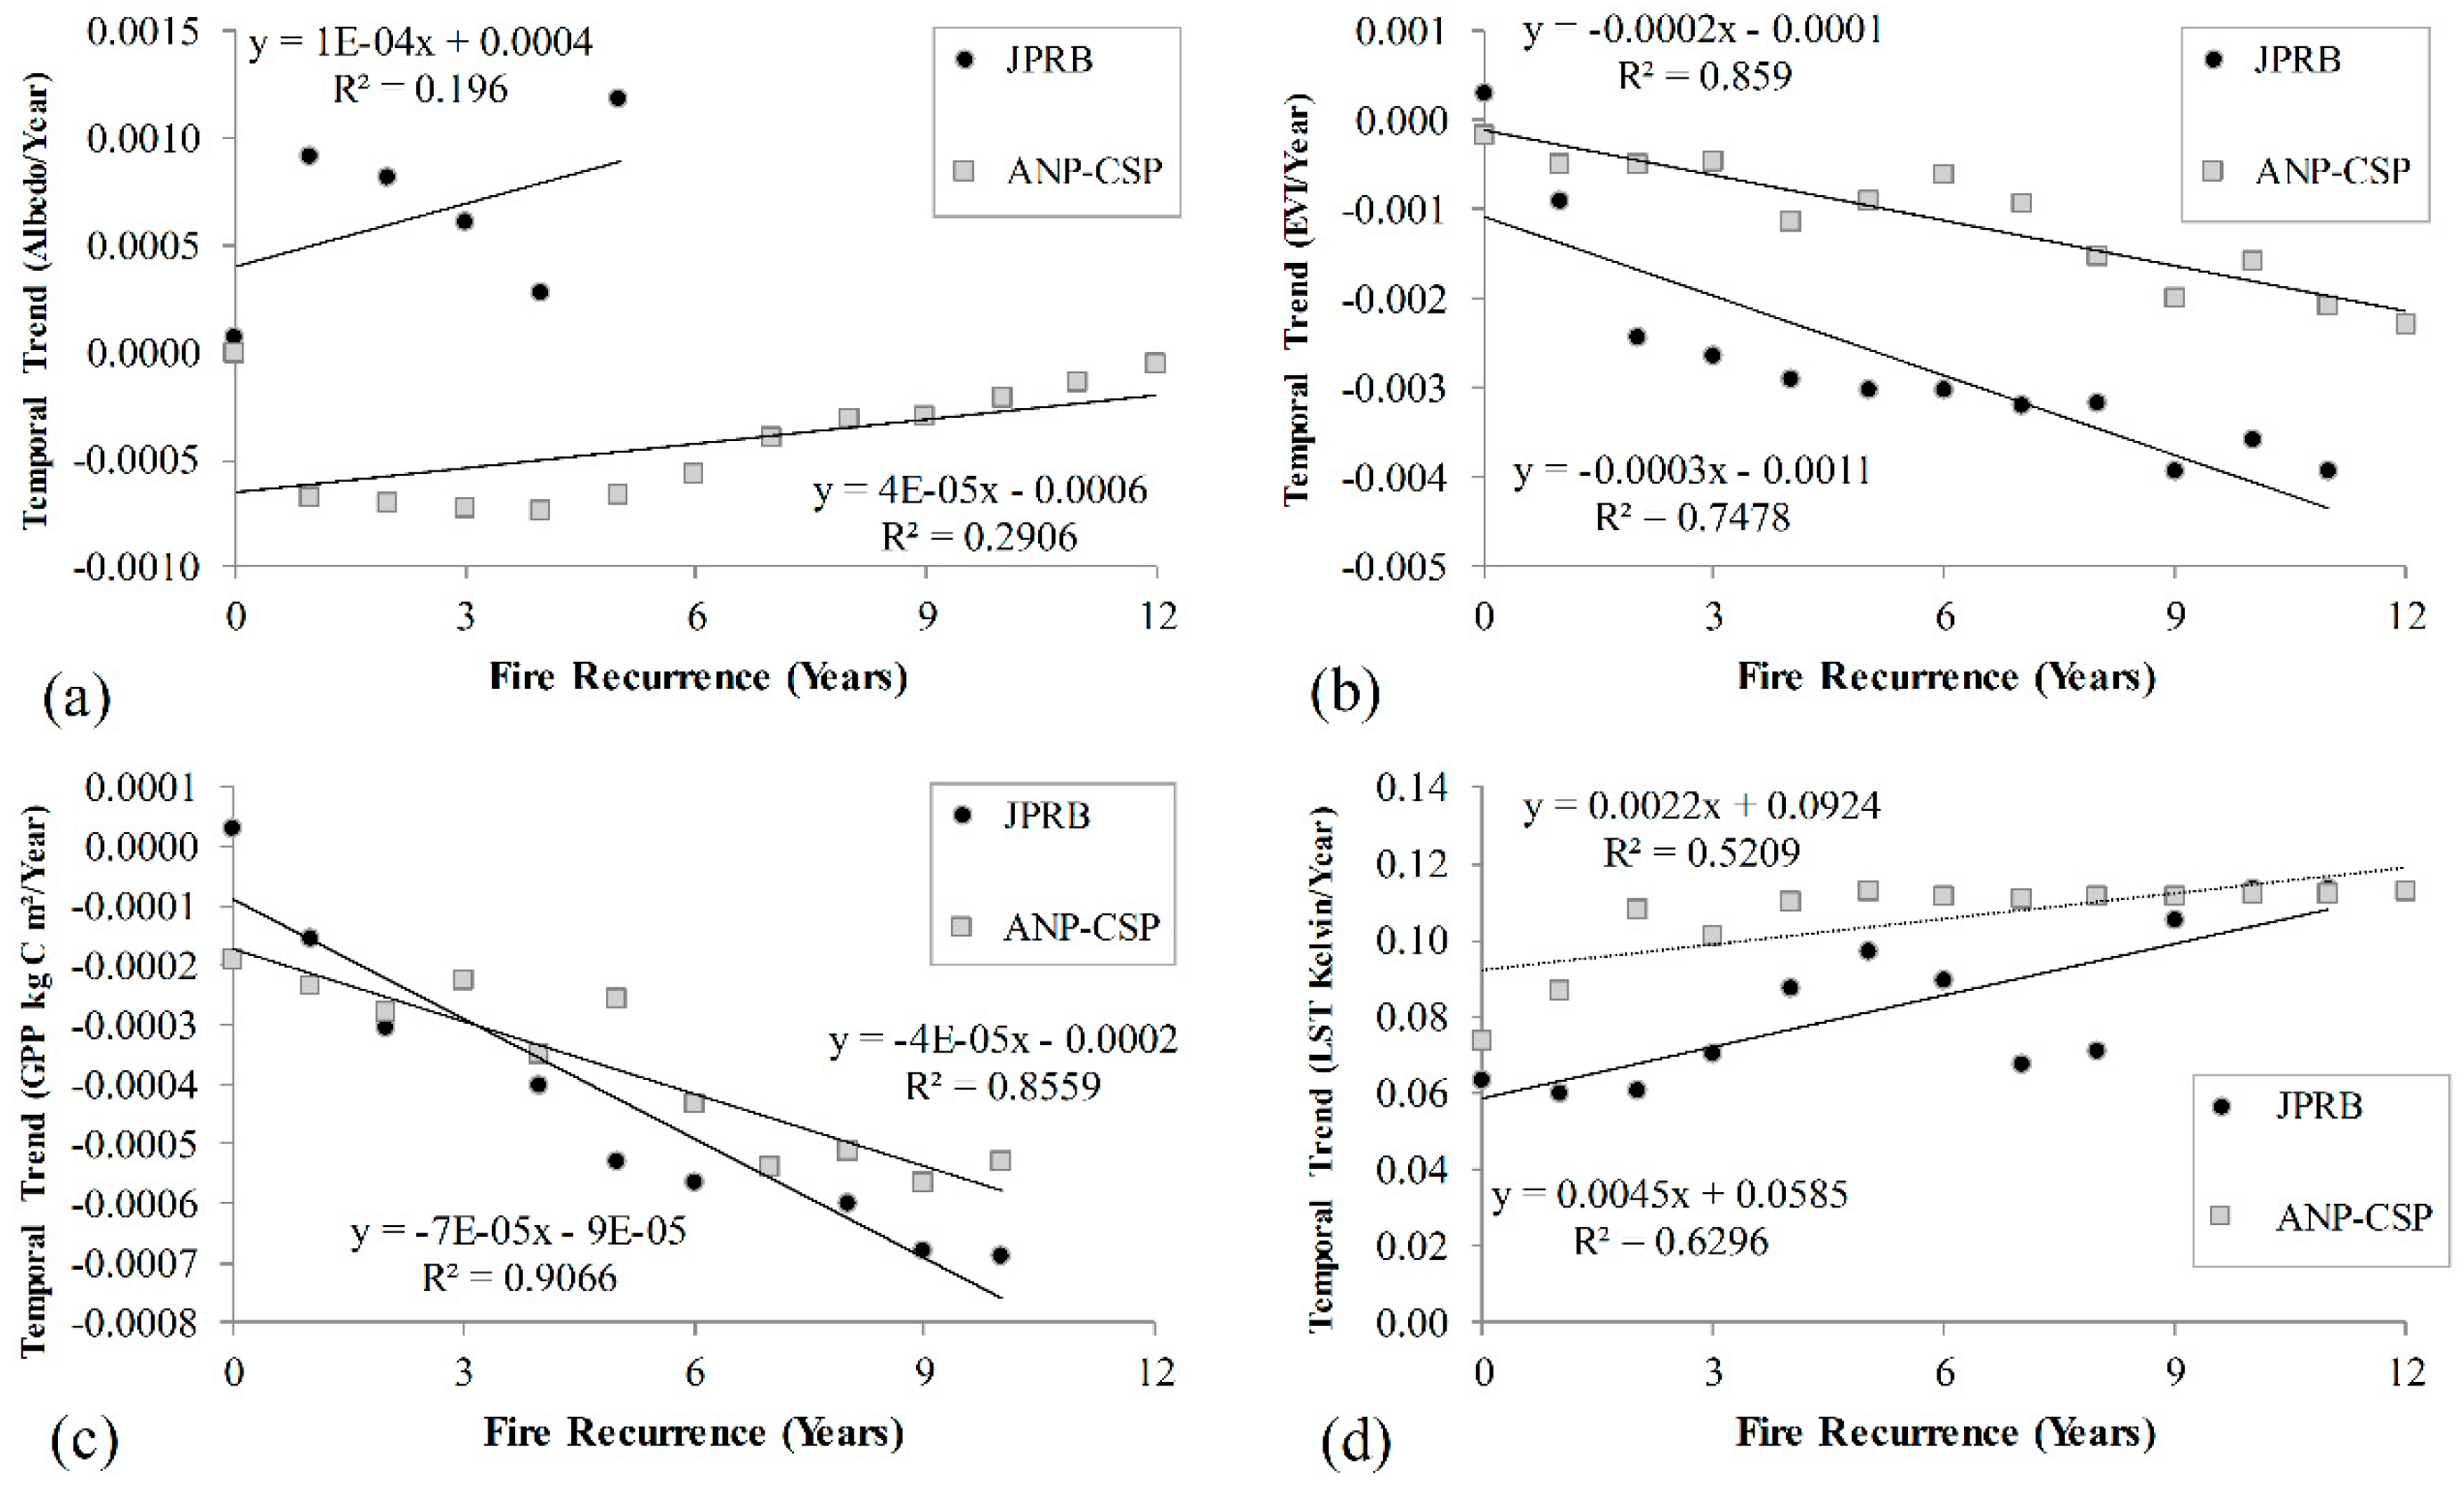
3.4. Biophysical Changes and Recurrence of Fire
4. Discussion
5. Conclusions
Author Contributions
Funding
Acknowledgments
Conflicts of Interest
References
- Bowman, D.M.J.S.; Balch, J.; Artaxo, P.; Bond, W.J.; Cochrane, M.A.; D’Antonio, C.M.; Defries, R.; Johnston, F.H.; Keeley, J.E.; Krawchuk, M.A.; et al. The human dimension of fire regimes on Earth. J. Biogeogr. 2011, 38, 2223–2236. [Google Scholar] [CrossRef] [PubMed] [Green Version]
- Gawryszewski, F.M.; Sato, M.N.; Miranda, H.S. Frequent fires alter tree architecture and impair reproduction of a common fire-tolerant savanna tree. Plant Biol. 2020, 22, 106–112. [Google Scholar] [CrossRef] [PubMed]
- Cochrane, M.A. Fire science for rainforests. Nature 2003, 421, 913–919. [Google Scholar] [CrossRef] [PubMed]
- Pivello, V.R. The use of fire in the cerrado and Amazonian rainforests of Brazil: Past and present. Fire Ecol. 2011, 7, 24–39. [Google Scholar] [CrossRef]
- Archibald, S. Managing the human component of fire regimes: lessons from Africa. Philos. Trans. R. Soc. B Biol. Sci. 2016, 371, 20150346. [Google Scholar] [CrossRef] [PubMed]
- Chambers, S.D.; Beringer, J.; Randerson, J.T.; Chapin, I.S. Fire effects on net radiation and energy partitioning: Contrasting responses of tundra and boreal forest ecosystems. J. Geophys. Res. D Atmos. 2005, 110, 1–9. [Google Scholar] [CrossRef]
- Kasischke, E.S.; Christensen, N.L.; Stocks, B.J. Fire, Global Warming, and the Carbon Balance of Boreal Forests. Ecol. Appl. 1995, 5, 437–451. [Google Scholar] [CrossRef]
- Archibald, S.; Lehmann, C.E.R.; Belcher, C.M.; Bond, W.J.; Bradstock, R.A.; Daniau, A.L.; Dexter, K.G.; Forrestel, E.J.; Greve, M.; He, T.; et al. Biological and geophysical feedbacks with fire in the Earth system. Environ. Res. Lett. 2018, 13, 033003. [Google Scholar] [CrossRef] [Green Version]
- Wittkuhn, R.S.; Lamont, B.B.; He, T. Combustion temperatures and nutrient transfers when grasstrees burn. For. Ecol. Manag. 2017, 399, 179–187. [Google Scholar] [CrossRef]
- Dintwe, K.; Okin, G.S.; Xue, Y. Fire-induced albedo change and surface radiative forcing in sub-Saharan Africa savanna ecosystems: Implications for the energy balance. J. Geophys. Res. 2017, 122, 6186–6201. [Google Scholar] [CrossRef] [Green Version]
- Beringer, J.; Hutley, L.B.; Tapper, N.J.; Coutts, A.; Kerley, A.; O′Grady, A.P. Fire impacts on surface heat, moisture and carbon fluxes from a tropical savanna in northern Australia. Int. J. Wildl. Fire 2003, 12, 333–340. [Google Scholar] [CrossRef]
- Veraverbeke, S.; Verstraeten, W.W.; Lhermitte, S.; Van De Kerchove, R.; Goossens, R. Assessment of post-fire changes in land surface temperature and surface albedo, and their relation with fireburn severity using multitemporal MODIS imagery. Int. J. Wildl. Fire 2012, 21, 243–256. [Google Scholar] [CrossRef] [Green Version]
- Huang, S.; Liu, H.; Dahal, D.; Jin, S.; Welp, L.R.; Liu, J.; Liu, S. Modeling spatially explicit fire impact on gross primary production in interior Alaska using satellite images coupled with eddy covariance. Remote Sens. Environ. 2013, 135, 178–188. [Google Scholar] [CrossRef]
- Rossi, F.S.; de Santos, G.A.A. Fire dynamics in Mato Grosso State, Brazil: The relative roles of gross primary productivity. Big Earth Data 2020, 4, 23–44. [Google Scholar] [CrossRef]
- Gao, Y.; Zhou, X.; Wang, Q.; Wang, C.; Zhan, Z.; Chen, L.; Yan, J.; Qu, R. Vegetation net primary productivity and its response to climate change during 2001-2008 in the Tibetan Plateau. Sci. Total Environ. 2013, 444, 356–362. [Google Scholar] [CrossRef]
- Danelichen, V.H.M.; Biudes, M.S.; Velasque, M.C.S.; Machado, N.G.; Gomes, R.S.R.; Vourlitis, G.L.; Nogueira, J.S. Estimating of gross primary production in an Amazon-Cerrado transitional forest using MODIS and Landsat imagery. An. Acad. Bras. Cienc. 2015, 87, 1545–1564. [Google Scholar] [CrossRef] [Green Version]
- Pausas, J.G.; Ribeiro, E. Fire and plant diversity at the global scale. Glob. Ecol. Biogeogr. 2017, 26, 889–897. [Google Scholar] [CrossRef]
- Bond, W.J.; Woodward, F.I.; Midgley, G.F. The Global Distribtuion of Ecosystems in a world without Fire. New Phytol. 2005, 165, 525–538. [Google Scholar] [CrossRef]
- Van Leeuwen, W.J.D. Monitoring the Effects of Forest Restoration Treatments on Post-Fire Vegetation Recovery with MODIS Multitemporal Data. Sensors 2008, 8, 2017–2042. [Google Scholar] [CrossRef] [Green Version]
- Li, X.; Zhang, H.; Yang, G.; Ding, Y.; Zhao, J. Post-Fire Vegetation Succession and Surface Energy Fluxes Derived from Remote Sensing. Remote Sens. 2018, 10, 1000. [Google Scholar] [CrossRef] [Green Version]
- Anderson, L.O. Biome-scale forest properties in Amazonia based on field and satellite observations. Remote Sens. 2012, 4, 1245–1271. [Google Scholar] [CrossRef] [Green Version]
- Christopoulou, A.; Mallinis, G.; Vassilakis, E.; Farangitakis, G.P.; Fyllas, N.M.; Kokkoris, G.D.; Arianoutsou, M. Assessing the impact of different landscape features on post-fire forest recovery with multitemporal remote sensing data: The case of Mount Taygetos (southern Greece). Int. J. Wildl. Fire 2019, 28, 521–532. [Google Scholar] [CrossRef] [Green Version]
- Sannigrahi, S.; Pilla, F.; Basu, B.; Basu, A.S.; Sarkar, K.; Chakraborti, S.; Joshi, P.K.; Zhang, Q.; Wang, Y.; Bhatt, S.; et al. Examining the effects of forest fire on terrestrial carbon emission and ecosystem production in India using remote sensing approaches. Sci. Total Environ. 2020, 725, 138331. [Google Scholar] [CrossRef]
- Mouillot, F.; Schultz, M.G.; Yue, C.; Cadule, P.; Tansey, K.; Ciais, P.; Chuvieco, E. Ten years of global burned area products from spaceborne remote sensing-A review: Analysis of user needs and recommendations for future developments. Int. J. Appl. Earth Obs. Geoinf. 2014, 26, 64–79. [Google Scholar] [CrossRef] [Green Version]
- Cardozo, S.; Pereira, G.; Shimabukuro, Y.E.; Moraes, E.C. Avaliação Das Áreas Queimadas No Estado De Rondônia. Rev. Bras. Cartogr. 2014, v.66/3, 705–716. [Google Scholar]
- Ministério do Meio Ambiente (MMA) Mapeamento da Cobertura Vegetal do Bioma Cerrado, Edital Probio 02/ 2004, Projeto Executivo B.02.02.109, Relatório Final. Available online: http://mapas.mma.gov.br/ (accessed on 22 Feburary 2018).
- Ministério do Meio Ambiente (MMA). Instituto Brasileiro do Meio Ambiente e dos Recursos Naturais Renováveis (IBAMA) Projeto de Monitoramento do Desmatamento dos Biomas Brasileiros por Satélite-PMDBBS. Available online: https://siscom.ibama.gov.br/monitora_biomas/ (accessed on 22 Feburary 2018).
- Da Pinto, T.J.S.; Gomes, B.M. CO2 Flux and its Relationship with Water Parameters and Biological Activity in the Ji-Paraná River (Rondônia State-Western Amazon). Biogeosci. Discuss. 2017, 1–14. [Google Scholar] [CrossRef] [Green Version]
- Homeier, J.; Kurzatkowski, D.; Leuschner, C. Stand dynamics of the drought-affected floodplain forests of Araguaia River, Brazilian Amazon. For. Ecosyst. 2017, 4. [Google Scholar] [CrossRef]
- Valente, C.R.; Latrubesse, E.M.; Ferreira, L.G. Relationships among vegetation, geomorphology and hydrology in the Bananal Island tropical wetlands, Araguaia River basin, Central Brazil. J. S. Am. Earth Sci. 2013, 46, 150–160. [Google Scholar] [CrossRef]
- Maracahipes, L.; Marimon, B.S.; Lenza, E.; Marimon-Junior, B.H.; De Oliveira, E.A.; Mews, H.A.; Gomes, L.; Feldpausch, T.R. Post-fire dynamics of woody vegetation in seasonally flooded forests (impucas) in the Cerrado-Amazonian Forest transition zone. Flora Morphol. Distrib. Funct. Ecol. Plants 2014, 209, 260–270. [Google Scholar] [CrossRef]
- Justice, C.O.; Townshend, J.R.G.; Vermote, E.F.; Masuoka, E.; Wolfe, R.E.; Saleous, N.; Roy, D.P.; Morisette, J.T. An overview of MODIS Land data processing and product status. Remote Sens. Environ. 2002, 83, 3–15. [Google Scholar] [CrossRef]
- Liang, S. Narrowband to broadband conversions of land surface albedo I Algorithms. Remote Sens. Environ. 2001, 76, 213–238. [Google Scholar] [CrossRef]
- Savitzky, A.; Golay, M.J.E. Smoothing and Differentiation of Data by Simplified Least Squares Procedures. Anal. Chem. 1964, 36, 1627–1639. [Google Scholar] [CrossRef]
- Schafer, R.W. What is a savitzky-golay filter? IEEE Signal Process. Mag. 2011, 28, 111–117. [Google Scholar] [CrossRef]
- Chen, J.; Jönsson, P.; Tamura, M.; Gu, Z.; Matsushita, B.; Eklundh, L. A simple method for reconstructing a high-quality NDVI time-series data set based on the Savitzky-Golay filter. Remote Sens. Environ. 2004, 91, 332–344. [Google Scholar] [CrossRef]
- De Carvalho Júnior, O.A.; Guimarães, R.F.; Silva, C.; Gomes, R.A.T. Standardized Time-Series and Interannual Phenological Deviation: New Techniques for Burned-Area Detection Using Long-Term MODIS-NBR Dataset. Remote Sens. 2015, 7, 6950–6985. [Google Scholar] [CrossRef] [Green Version]
- Saleska, S.R.; Rocha, H.R.; Huete, A.R.; Nobre, A.D.; Artaxo, P.; Shimabukuro, Y.E. LBA-ECO CD-32 Flux Tower Network Data Compilation, Brazilian Amazon. 1999–2006. Available online: https://daac.ornl.gov/LBA/guides/CD32_Brazil_Flux_Network.html (accessed on 10 August 2019).
- Numata, I.; Roberts, D.A.; Chadwick, O.A.; Schimel, J.P.; Galvão, L.S.; Soares, J.V. LBA-ECO ND-01 Reflectance and Biophysical Measures, Grass Pastures: Rondonia, Brazil. Available online: https://daac.ornl.gov/LBA/guides/ND01_Pasture_Spectra.html (accessed on 10 August 2019).
- Huete, A.R.; Ferreira, L.G.; Miura, T. LBA-ECO LC-19 Soil and Vegetation Data for Cerrado and Forested Sites, Brazil. 2002. Available online: https://daac.ornl.gov/LBA/guides/LC19_Field_2002.html (accessed on 10 August 2019).
- Santana, N.C.; de Carvalho Júnior, O.A.; Gomes, R.A.T.; Guimarães, R.F. Burned-Area Detection in Amazonian Environments Using Standardized Time Series Per Pixel in MODIS Data. Remote Sens. 2018, 10, 1904. [Google Scholar] [CrossRef] [Green Version]
- Maier, S.W. Changes in surface reflectance from wildfires on the Australian continent measured by MODIS. Int. J. Remote Sens. 2010, 31, 3161–3176. [Google Scholar] [CrossRef]
- Chuvieco, E.; Martínez, S.; Román, M.V.; Hantson, S.; Pettinari, M.L. Integration of ecological and socio-economic factors to assess global vulnerability to wildfire. Glob. Ecol. Biogeogr. 2014, 23, 245–258. [Google Scholar] [CrossRef]
- Klink, C.A.; Machado, R.B. Conservation of the Brazilian Cerrado. Conserv. Biol. 2005, 19, 707–713. [Google Scholar] [CrossRef]
- Nelson, A.; Chomitz, K.M. Effectiveness of strict vs. multiple use protected areas in reducing tropical forest fires: A global analysis using matching methods. PLoS ONE 2011, 6, e22722. [Google Scholar] [CrossRef]
- Tsuyuzaki, S.; Kushida, K.; Kodama, Y. Recovery of surface albedo and plant cover after wildfire in a Picea mariana forest in interior Alaska. Clim. Chang. 2009, 93, 517–525. [Google Scholar] [CrossRef]
- Planque, C.; Carrer, D.; Roujean, J.L. Analysis of MODIS albedo changes over steady woody covers in France during the period of 2001–2013. Remote Sens. Environ. 2017, 191, 13–29. [Google Scholar] [CrossRef]
- Jin, Y.; Roy, D.P. Fire-induced albedo change and its radiative forcing at the surface in northern Australia. Geophys. Res. Lett. 2005, 32, 1–4. [Google Scholar] [CrossRef]
- Ireland, G.; Petropoulos, G.P. Exploring the relationships between post-fire vegetation regeneration dynamics, topography and burn severity: A case study from the Montane Cordillera Ecozones of Western Canada. Appl. Geogr. 2015, 56, 232–248. [Google Scholar] [CrossRef]
- Potter, C. Regional analysis of MODIS satellite greenness trends for ecosystems of interior Alaska. GISci. Remote Sens. 2014, 51, 390–402. [Google Scholar] [CrossRef]
- Kim, Y. Drought and elevation effects on MODIS vegetation indices in northern Arizona ecosystems. Int. J. Remote Sens. 2013, 34, 4889–4899. [Google Scholar] [CrossRef]
- Zscheischler, J.; Mahecha, M.D.; Von Buttlar, J.; Harmeling, S.; Jung, M.; Rammig, A.; Randerson, J.T.; Schölkopf, B.; Seneviratne, S.I.; Tomelleri, E.; et al. A few extreme events dominate global interannual variability in gross primary production. Environ. Res. Lett. 2014, 9. [Google Scholar] [CrossRef] [Green Version]
- Sun, Z.; Wang, X.; Yamamoto, H.; Tani, H.; Zhong, G.; Yin, S.; Guo, E. Spatial pattern of GPP variations in terrestrial ecosystems and its drivers: Climatic factors, CO2 concentration and land-cover change, 1982–2015. Ecol. Inform. 2018, 46, 156–165. [Google Scholar] [CrossRef]
- Delgado, R.C.; Pereira, M.G.; Teodoro, P.E.; dos Santos, G.L.; de Carvalho, D.C.; Magistrali, I.C.; Vilanova, R.S. Seasonality of gross primary production in the Atlantic Forest of Brazil. Glob. Ecol. Conserv. 2018, 14, e00392. [Google Scholar] [CrossRef]
- Heck, E.; de Beurs, K.M.; Owsley, B.C.; Henebry, G.M. Evaluation of the MODIS collections 5 and 6 for change analysis of vegetation and land surface temperature dynamics in North and South America. ISPRS J. Photogramm. Remote Sens. 2019, 156, 121–134. [Google Scholar] [CrossRef]
- Quan, J.; Zhan, W.; Chen, Y.; Wang, M.; Wang, J. Time series decomposition of remotely sensed land surface temperature and investigation of trends and seasonal variations in surface urban heat islands. J. Geophys. Res. Atmos. 2016, 121, 2638–2657. [Google Scholar] [CrossRef]
- Eloy, L.A.; Bilbao, B.; Mistry, J.; Schmidt, I.B. From fire suppression to fire management: Advances and resistances to changes in fire policy in the savannas of Brazil and Venezuela. Geogr. J. 2019, 185, 10–22. [Google Scholar] [CrossRef]
- Durigan, G.; Ratter, J.A. The need for a consistent fire policy for Cerrado conservation. J. Appl. Ecol. 2016, 53, 11–15. [Google Scholar] [CrossRef]
- Schaaf, C.B.; Gao, F.; Strahler, A.H.; Lucht, W.; Li, X.; Tsang, T.; Strugnell, N.C.; Zhang, X.; Jin, Y.; Muller, J.-P.; et al. First operational BRDF, albedo nadir reflectance products from MODIS. Remote Sens. Environ. 2002, 83, 135–148. [Google Scholar] [CrossRef] [Green Version]
- Moura, Y.M.; Hilker, T.; Lyapustin, A.I.; Galvão, L.S.; dos Santos, J.R.; Anderson, L.O.; de Sousa, C.H.R.; Arai, E. Seasonality and drought effects of Amazonian forests observed from multi-angle satellite data. Remote Sens. Environ. 2015, 171, 278–290. [Google Scholar] [CrossRef]
- Morton, D.C.; Nagol, J.; Carabajal, C.C.; Rosette, J.; Palace, M.; Cook, B.D.; Vermote, E.F.; Harding, D.J.; North, P.R.J. Amazon forests maintain consistent canopy structure and greenness during the dry season. Nature 2014, 506, 221–224. [Google Scholar] [CrossRef] [PubMed]
- Badgley, G.; Field, C.B.; Berry, J.A. Canopy near-infrared reflectance and terrestrial photosynthesis. Sci. Adv. 2017, 3, e1602244. [Google Scholar] [CrossRef] [Green Version]
- Dechant, B.; Ryu, Y.; Badgley, G.; Zeng, Y.; Berry, J.A.; Zhang, Y.; Goulas, Y.; Li, Z.; Zhang, Q.; Kang, M.; et al. Canopy structure explains the relationship between photosynthesis and sun-induced chlorophyll fluorescence in crops. Remote Sens. Environ. 2020, 241. [Google Scholar] [CrossRef] [Green Version]


| Site Name | Study Area | Lat | Long | Variable | Period |
|---|---|---|---|---|---|
| Tocantins-Javaes Flux Tower | ANP-CSP | −9.824 | −50.159 | LST/GPP | 10/2003 to 12/2004 |
| Reserva Jaru Flux Tower | JPRB | −10.07800 | −61.93310 | LST/GPP | 04/2000 to 06/2002 |
| Cangusu 8-year Pasture | ANP-CSP | −10.04658 | −49.8998 | Reflectance | 06/2002 |
| Cangusu Cerrado woodland | ANP-CSP | −10.06633 | −49.90696 | Reflectance | 06/2002 |
| Cangusu 3-year pasture | ANP-CSP | −10.06339 | −49.91322 | Reflectance | 06/2002 |
| Cangusu 1-year pasture | ANP-CSP | −10.06155 | −49.90547 | Reflectance | 06/2002 |
| Santana do Araguaia 20-year pasture | ANP-CSP | −9.71817 | −50.40072 | Reflectance | 06/2002 |
| Santana do Araguaia Capoeira | ANP-CSP | −9.7454 | −50.30674 | Reflectance | 06/2002 |
| Ji-Paraná LC 1 | JPRB | −10.896 | −62.081 | Reflectance | 07/2003 |
| Ji-Paraná LC 2 | JPRB | −10.714 | −61.988 | Reflectance | 07/2003 |
| Presidente Medici PR | JPRB | −11.242 | −61.976 | Reflectance | 07/2003 |
| Amazon Forest | Cerrado | ||||
|---|---|---|---|---|---|
| Scenes (Path-Row) | Image Date | Sensor | Scenes (Path-Row) | Image Date | Sensor |
| 223–67 223–68 | 01/10/2002 | ETM+ | 231–67 231–68 | 20/09/2001 | ETM+ |
| 01/10/2005 | TM | 18/09/2003 | TM | ||
| 21/09/2007 | TM | 13/09/2007 | TM | ||
| 10/10/2014 | OLI | 21/09/2010 | TM | ||
| 27/09/2015 | OLI | 16/09/2014 | OLI | ||
| Study Area | Fire Recurrence (km2/Years) | |||||
|---|---|---|---|---|---|---|
| 0 | 1–3 | 4–6 | 7–9 | 10–12 | >12 | |
| JPRB | 10,774.4 (88%) | 1373.9 (11%) | 47.6 (0.4%) | 4.2 (0%) | 0.5 (0%) | 0.0 (0%) |
| ANP-CSP | 2126.8 (32%) | 877.4 (13%) | 1551.0 (23%) | 1651.9 (25%) | 337.1 (5%) | 14.0 (0.2%) |
| Study Area | Land Use/Vegetation | Biophysical Variable × Fire Recurrence | |||
|---|---|---|---|---|---|
| Albedo-Fire | EVI-Fire | GPP-Fire | LST-Fire | ||
| ANP-CSP | AFS | 0.321 | 0.883 | 0.618 | 0.480 |
| FS | 0.310 | 0.796 | 0.921 | 0.559 | |
| GWS | 0.521 | 0.864 | 0.745 | 0.540 | |
| PA | - | 0.867 | - | 0.458 | |
| SF | 0.000 | 0.796 | 0.864 | 0.696 | |
| SP | 0.504 | 0.906 | 0.790 | 0.913 | |
| JPRB | AOF | 0.000 | 0.814 | 0.808 | 0.644 |
| ASFT | 0.440 | 0.909 | 0.805 | 0.723 | |
| AWS | 0.001 | 0.890 | 0.920 | 0.460 | |
| OF | 0.419 | 0.507 | 0.703 | 0.727 | |
| PA | 0.073 | 0.617 | 0.915 | 0.351 | |
| SFT | 0.013 | 0.754 | 0.885 | 0.717 | |
| WS | 0.570 | 0.802 | 0.930 | 0.230 | |
Publisher’s Note: MDPI stays neutral with regard to jurisdictional claims in published maps and institutional affiliations. |
© 2020 by the authors. Licensee MDPI, Basel, Switzerland. This article is an open access article distributed under the terms and conditions of the Creative Commons Attribution (CC BY) license (http://creativecommons.org/licenses/by/4.0/).
Share and Cite
Santana, N.C.; Júnior, O.A.d.C.; Gomes, R.A.T.; Fontes Guimarães, R. Comparison of Post-fire Patterns in Brazilian Savanna and Tropical Forest from Remote Sensing Time Series. ISPRS Int. J. Geo-Inf. 2020, 9, 659. https://doi.org/10.3390/ijgi9110659
Santana NC, Júnior OAdC, Gomes RAT, Fontes Guimarães R. Comparison of Post-fire Patterns in Brazilian Savanna and Tropical Forest from Remote Sensing Time Series. ISPRS International Journal of Geo-Information. 2020; 9(11):659. https://doi.org/10.3390/ijgi9110659
Chicago/Turabian StyleSantana, Níckolas Castro, Osmar Abílio de Carvalho Júnior, Roberto Arnaldo Trancoso Gomes, and Renato Fontes Guimarães. 2020. "Comparison of Post-fire Patterns in Brazilian Savanna and Tropical Forest from Remote Sensing Time Series" ISPRS International Journal of Geo-Information 9, no. 11: 659. https://doi.org/10.3390/ijgi9110659