1. Introduction
Urban mobility data are of significant importance to urban development and play an important role in understanding urban traffic system [
1,
2], typically include taxi trajectories [
3,
4], bus trajectories [
5], smart card records for transportation [
6], bike sharing trajectories [
7,
8] and other public transport systems (underground, tramway, railway, etc). Among them, the taxi is an important part of urban transportation, and the taxi trips reflect human behaviors and mobility patterns, allowing us to identify the spatial variety of mobility patterns. Specifically, point patterns, trip patterns, and network flow patterns offer a valuable opportunity to get valuable insights in taxi mobility, which is one of the most important parts of urban mobility [
9]. It is important for the urban traffic application nowadays.
It is essential to understand the insights that mobility data imply. Taxi mobility research has been primarily focusing on the following three aspects. First, most studies mainly considered point patterns, such as taxi trajectories, which can give relevant insight into the passengers’ behavior [
10,
11], trip purposes [
12,
13], and spatial patterns [
14,
15]. Second, some studies further considered trip patterns, such as leveraged taxi trips, whose pick-up and drop-off points (ODs) [
16] are used for spatial pattern analysis and identification of trip purpose and spatial distribution. Note, in this paper, we define the locations of pick-up events as Os, the locations of drop-off events as Ds, the pairs of O and D are ODs. Third, few studies considered network flow patterns, and many methodologies generally extracted one single pattern for exploitation [
17,
18].
While examining point patterns, it is important to explore the relationship between land-use types and human mobility data [
19], as human activities are closely related to land-use types [
20]. Many studies have traced the human’s travel behaviors based on land-use types [
9,
10]. The existing inverse relationship between human activities and land-use types (i.e., extracting land-use categories from residential activities) has triggered many studies [
16,
17,
21,
22]. Multiple features extracted from taxi trajectory data, such as the outflow, inflow, net flow (inflow−outflow) and net flow ratio ([inflow − outflow]/[inflow + outflow]) can support land-use classification [
23,
24]. For example, Ge et al. proposed an integration framework to fuse multiple features and increase the accuracy of land-use classification [
25]. These taxi trajectory-based features were computed with a grid cell-based method, and the taxi trajectory data were not converted into a road network space. The impact of different land-use and districts on taxi trip ODs may vary in time series. Understanding the relationship between land-use and taxi service activities can provide relevant insights about how to optimize transport planning.
Previously, the network kernel density estimation (NKDE) algorithm, which considers a kernel density function based on road network distance instead of the Euclidean distance, was used to analyze the point events along road networks [
26]. The analysis based on NKDE can provide more precise patterns in network-related scenarios, offering information about the most densely occupied road network segments around point events. While NKDE has been widely used to examine traffic accidents [
27], economic activities [
28], central business districts [
29], and the accessibility of points of interest (POIs) [
30], few studies have leveraged it for exploring the spatial patterns of ODs along road networks.
In trip patterns, many studies leveraged taxi trip ODs to analyze the characteristics [
16]. An important research area is to discover people’s behavioral patterns by analyzing the taxi trip ODs. Such ODs, computed from the taxi track data, have been explored for trip pattern analysis, trip purpose and spatial distribution by means of integrated spatiotemporal geographic information system (GIS) toolkits. Meanwhile, taxi services are one of the most important driving activities, and have been widely used to quantify transport characteristics [
31]. For example, transportation theory demonstrates that drivers minimize travel time for route choice behavior [
32], and some studies found that taxi trajectories can give relevant insights into passengers’ behavior [
10,
11], trip purposes [
12,
13], and spatial patterns [
14,
15,
16], henceforth drawing plenty of attention for research.
In fact, taxi trips are generated in a network flow, which is more intuitive to analyze the spatial travel under the network flow patterns. Network flow considers locations, links, and the interaction between locations by the number of links [
33]. Shen et al. aim to uncover spatial and temporal patterns such as people’s location characteristics and space-time movements (whose trends vary over time) through the analysis of a large volume of taxi data. Liu et al. proposed a spatially-embedded network model to discover intra-city spatial interactions [
21].
To sum up, existing works only consider one kind of spatial pattern. Since the taxi mobility data itself is available in point frame format, and the associated human behavior is in network frame format, it is natural and essential to analyze spatial patterns via the three sources of information. In this work, we pursue the integration of point patterns, trip patterns, and network flow patterns to provide a better identification and understanding of the spatial variety of taxi mobility data. Specifically, we propose to identify the spatial variety of travel patterns from taxi mobility data by considering the point, trip and network aspects, simultaneously. In order to achieve this goal, there are three challenging issues that need to be addressed, as detailed below:
- (1)
First of all, although much progress has been made in the literature regarding the relationship between land-use and transportation (good performance has been reported from spatial distributions, spatial statistics, and spatial analytics), there are few studies focused on the relationship between taxi spatial patterns and land-use. With this consideration in mind, we propose a new method, called improved network kernel density estimation (imNKDE), which is able to estimate the OD density efficiently from a large amount of taxi trajectory data, and to further identify the spatial patterns from OD density and land-use data via Poisson regression.
- (2)
The relationships and spatial characteristics of a taxi trip and its corresponding routes have not been sufficiently investigated, and these items are helpful to find the distribution of the hottest road segments. While a taxi trip with passengers likely follows the shortest route, i.e., the shortest path [
32], the trip eventually selected by a taxi driver may be impacted by various factors of the road network and structure, such as travel time, travel speed, the number of road lanes and left turns, and the proportion of highways. As such, it is still unclear to what extent a taxi trip follows the shortest path. Here, we propose the use of trip patterns to measure the relationship between taxi trips and taxi routes based on their similarities. A regression model is introduced to further investigate the potential factors that may affect the taxi driver’s choices for taxi trips.
- (3)
Another important issue that we consider is that the current network flow is designed for integrating point analytics, which is not suitable for trip analytics. As mentioned, trip patterns are essential; however, previous studies did not show the spatial relationship between long and short taxi trips. Therefore, further network flow analytics should be considered to reveal the distance-based effects among taxi trips. In this work, we propose to use network flow pattern analytics for modeling the differences between taxi trip ODs and land-use data. More specifically, we use inter-zonal based and inner-zonal based spatial interaction analysis to capture these differences.
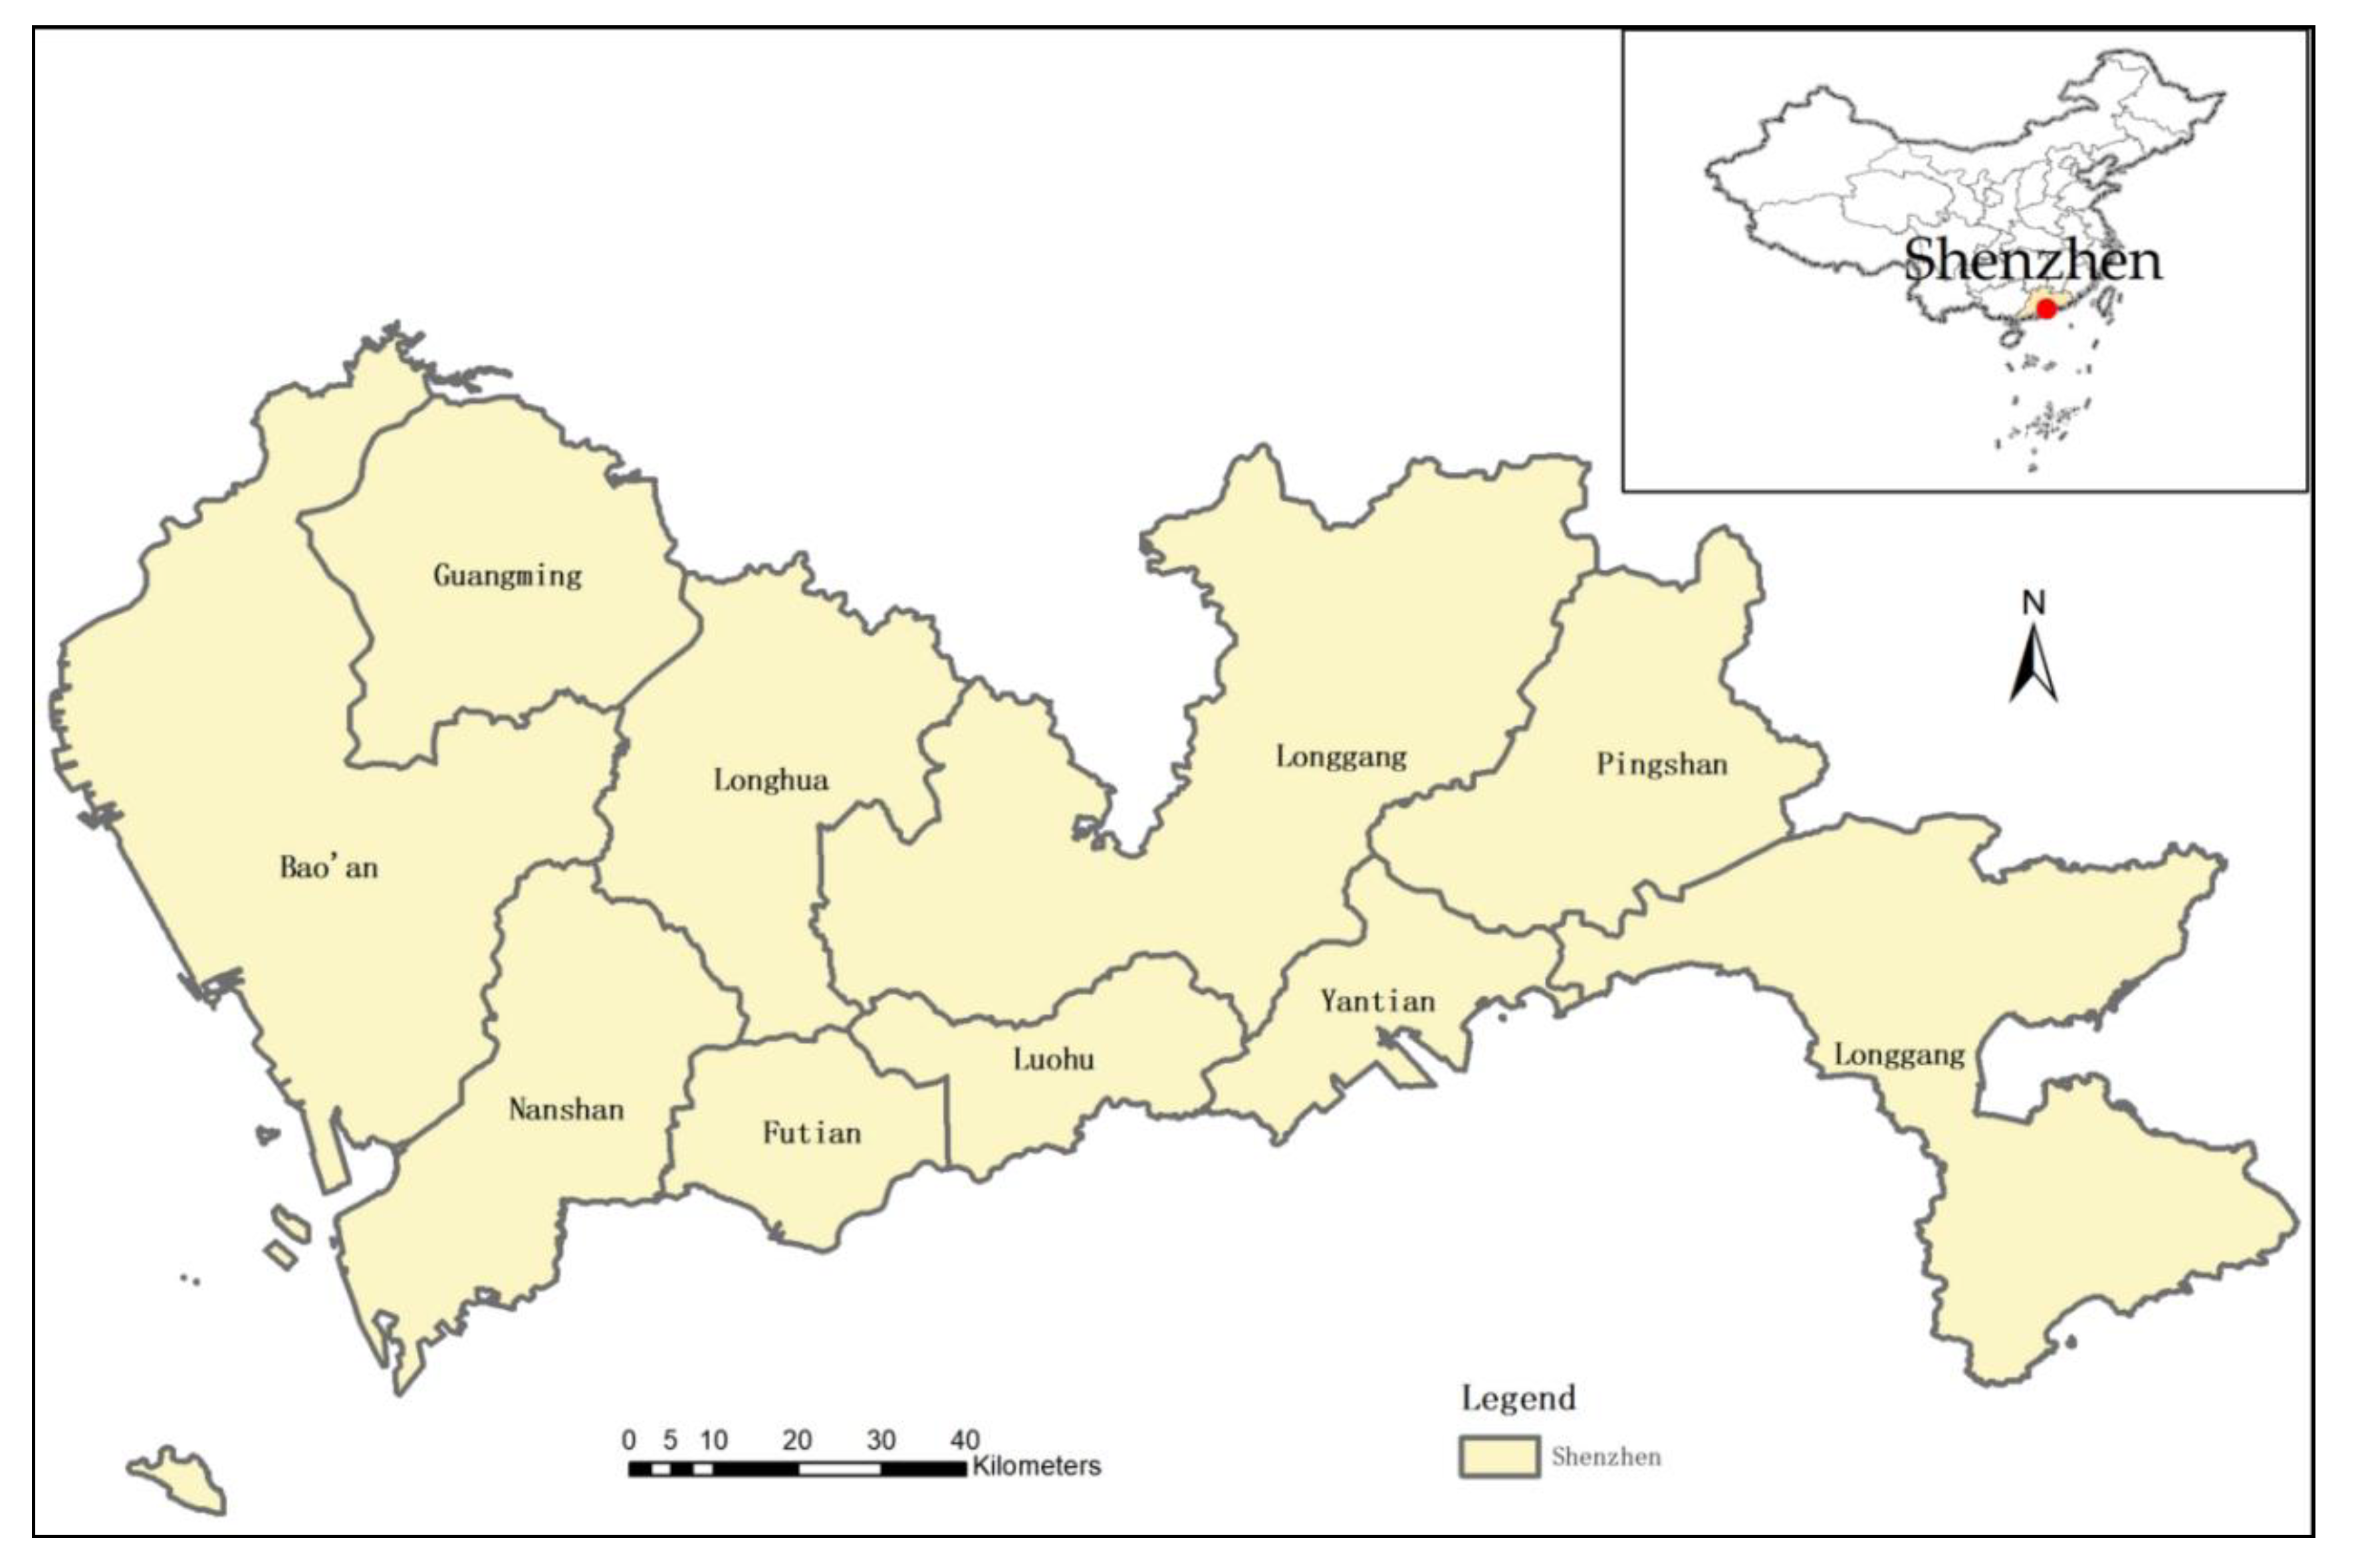
A case study in the city of Shenzhen, China, has been selected for validation purposes. The taxi mobility data, along with the land-use data and road network data are considered. The main contributions of our work can be summarized as follows:
- (1)
An improved NKDE (imNKDE) is proposed to process a large amount of taxi trajectories for the estimation of OD density.
- (2)
By jointly considering the taxi trip ODs and road network data, it is observed that taxi drivers prefer roads with more lanes or highways.
- (3)
We identify network flow patterns which are used to discover spatial interactions between different districts and land-use.
The remainder of the paper is organized as follows.
Section 2 describes some related works.
Section 3 introduces the research data.
Section 4 describes the methodology for identifying spatial patterns for urban mobility data. Detailed results and analyses are given in
Section 5.
Section 6 concludes the paper with some remarks and hints at plausible future research lines.
4. Methodology
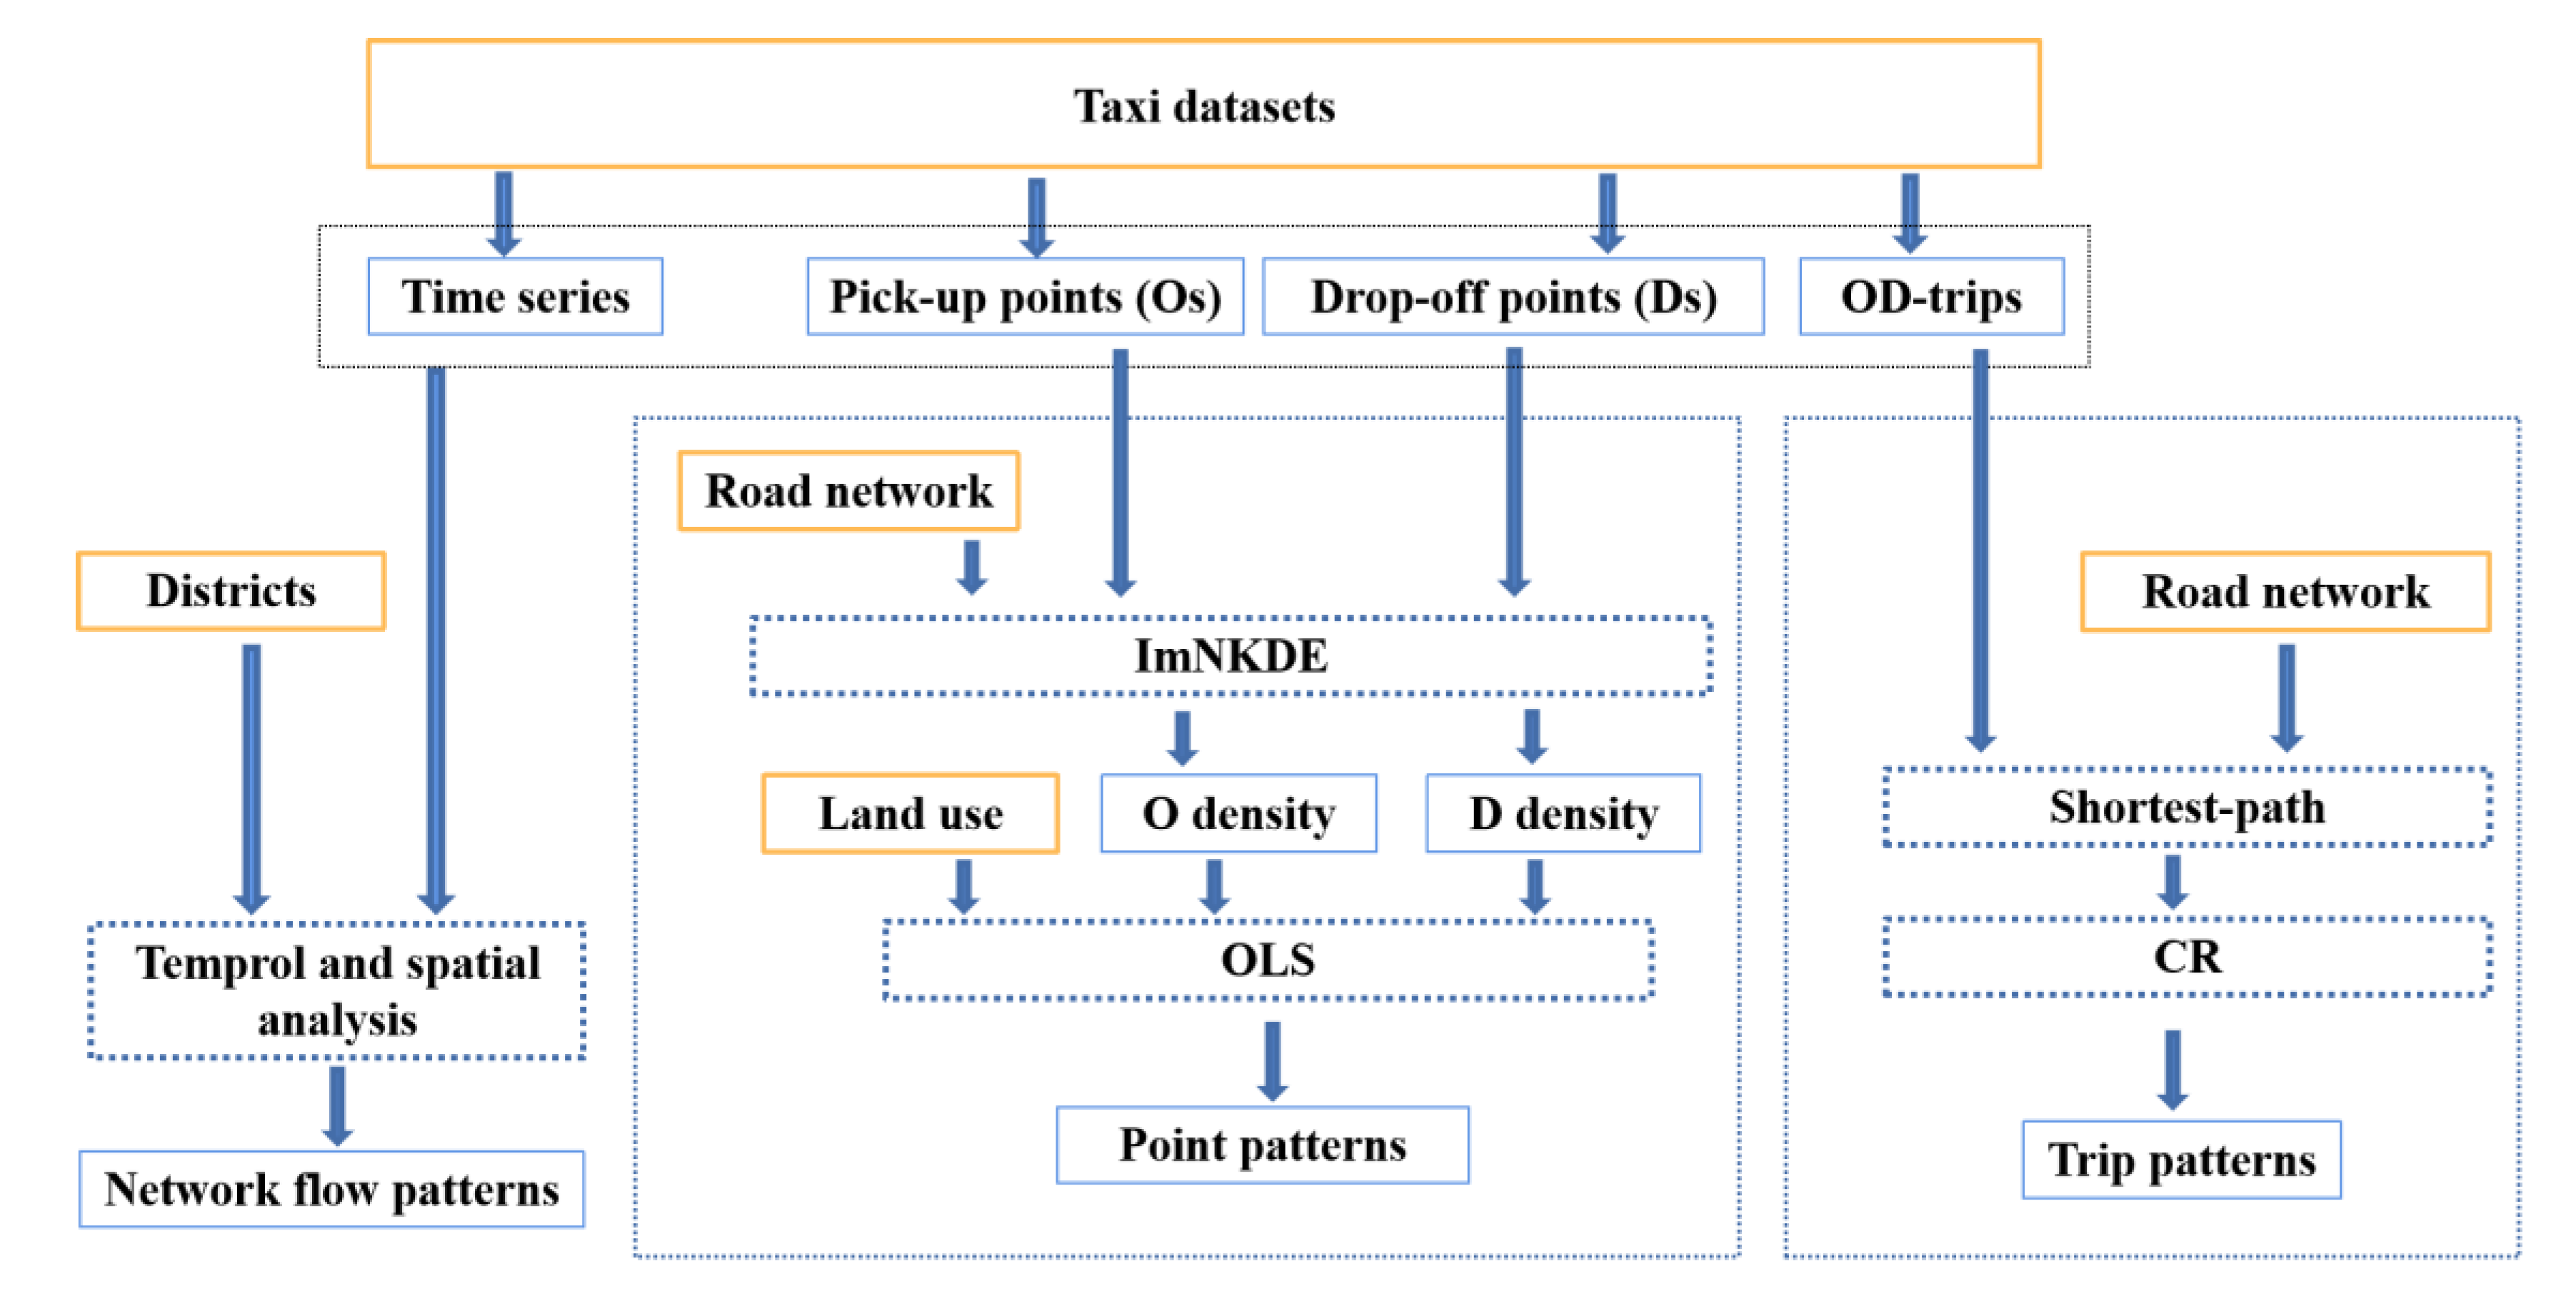
In this section, we present the proposed methodology for identifying multiple mobility patterns in Shenzhen. For illustrative purpose, the workflow adopted for discovering spatial-temporal patterns is demonstrated in
Figure 5. First, pick-up points (Os), drop-off points (Ds), OD-trips and time series data are obtained from taxi datasets. In this study, the spatial-temporal patterns of taxi trip are unfolded from three aspects: point patterns, trip patterns and network flow patterns. For point patterns, we propose an imNDKE method to estimate OD densities based on ODs and road network. In order to reveal the point patterns of taxi trip, OLS method is used to simulate the relationship between land-use and O density and D density, respectively. For trip patterns, related with the road network, we calculate the shortest-paths for OD trips. Next, to analyze the relationship between taxi trip and shortest-path, the coincidence rate (CR) of an OD trip and the corresponding shortest-path is calculated. Meanwhile, the spatial distribution of “hot road” is also demonstrated. For network flow patterns, the network flow among different districts is obtained from the spatial and temporal analysis of Os, Ds, OD-trips and time series. We design a chord diagram to visualize flows and quantify flow data. Based on the methods mentioned above, the spatial and temporal patterns of taxi trip are analyzed from the point, trip and network flow patterns.
4.1. Preprocessing: Computing ODs and Map Matching
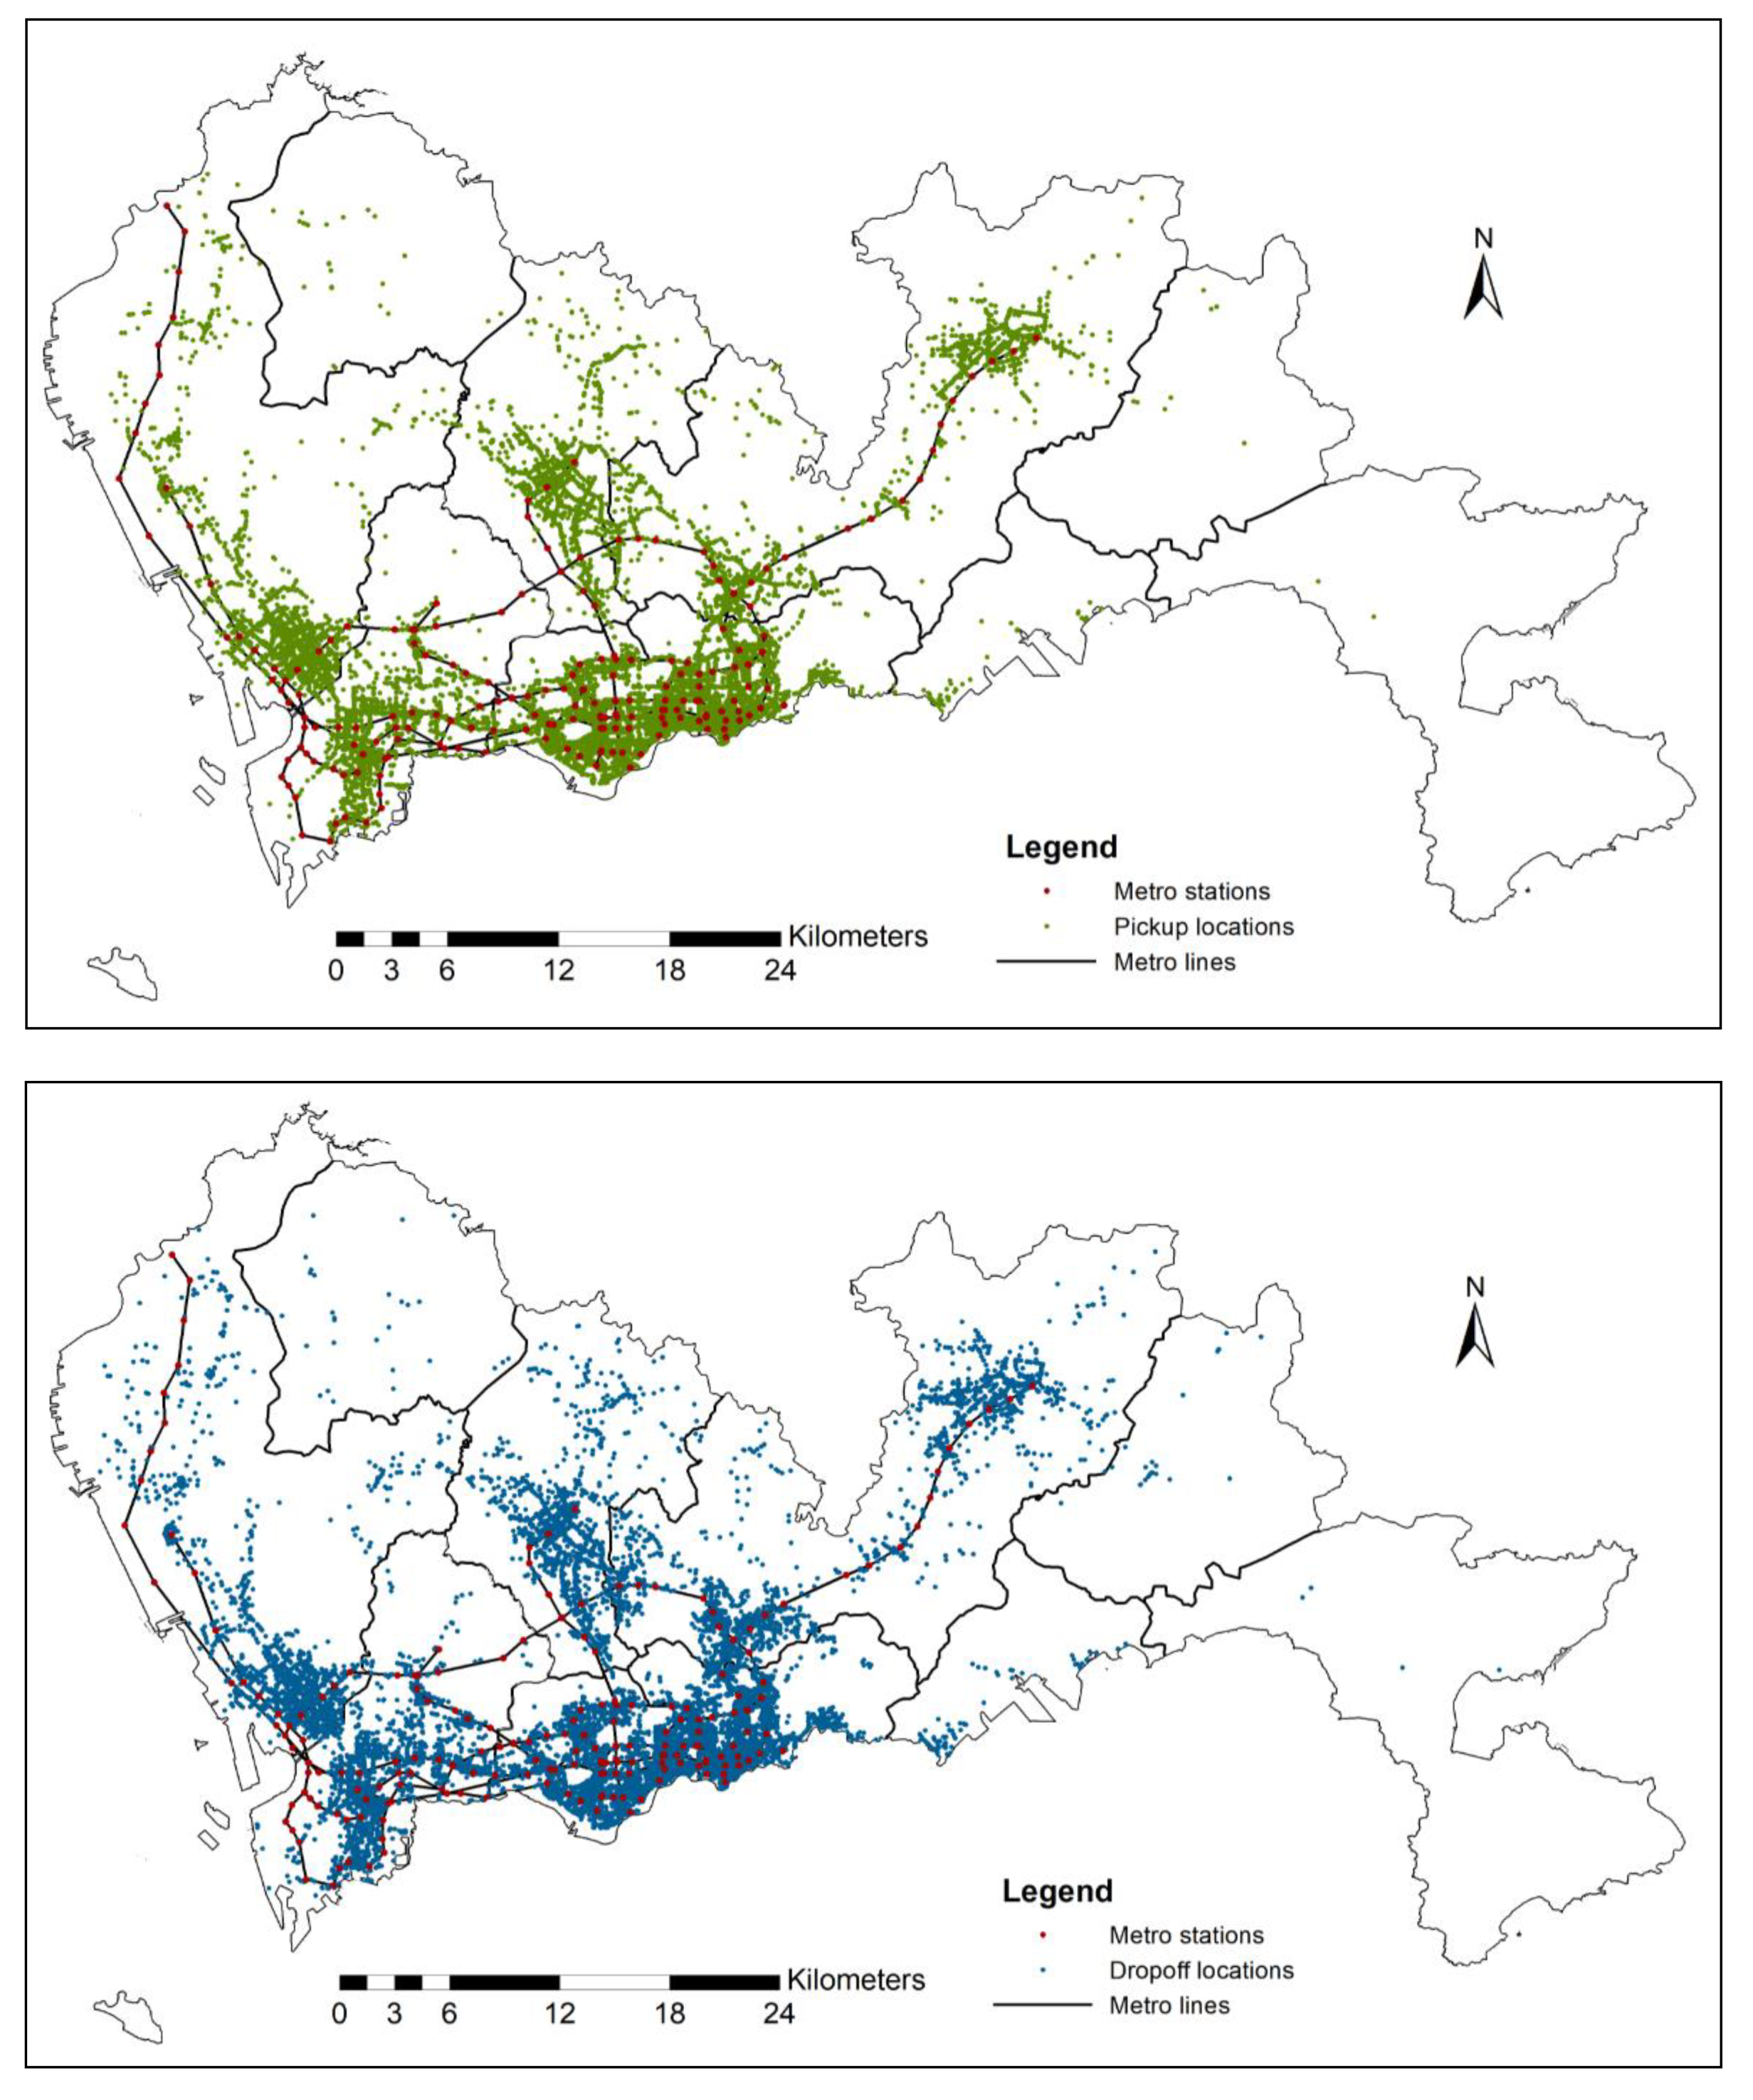
The taxi trip ODs are generated in the geo-processing step. The taxi data are cleaned and pre-processed by using spatial operations, in which when the occupied feature has an abnormal status (i.e., the value is neither 0 nor 1), or when the taxi stopped by the same location for more than 10 min, the data record is removed from consideration. Then, we perform the extraction of the taxi trip OD from the occupied status of each trajectory as follows:
If the previous state for the taxi trajectory is not occupied (without passengers) and the current status of the taxi trajectory is occupied (with passengers), then the current taxi trajectory is the potential pick-up point (O).
If the passenger status of the previous taxi trajectory is occupied and the current trajectory is not occupied at the next tracking point, then the previous track point is an alternative drop-off point (D).
If the time interval between O and D is smaller than a minimum time
t (5 min), this OD pair is ignored due to the reason that the time taken by the passenger is too short, and we assume that a single passenger occupied task cannot be completed within this period. With this in mind, the obtained taxi trip ODs are illustrated in
Figure 6.
Then, we perform map matching operators for the taxi trajectories onto the road network, using a hidden Markov model (HMM) [
61,
62]. The efficient shortest path algorithm is frequently used in map-matching and taxi trip analytics along the road network. As the A* algorithm, one of the popular shortest path algorithms, performs very well in comparison with other methods in real-word road networks [
63,
64], we use a bidirectional A* Dijkstra algorithm with binary heap. Note that, if one record of the taxi trajectory does not have one map matching result, this record will be ignored.
4.2. An Improved Network Kernel Density Estimation (imNKDE)
In this section, we first briefly introduce the traditional network kernel density estimation (NKDE) method. Then, we detailed the estimation of the ODs’ density by using our proposed imNKDE method, and the detection of the spatial taxi mobility patterns between the taxi data and land-use data along the road networks.
4.2.1. NKDE
The KDE (a nonparametric method) is used for data surface estimation [
65,
66]. The kernel function analysis is essentially a weighted distance method. It is based on the idea that the influence of distant point on the target grid is less than the influence of relatively close point. In the kernel function estimation function, the factors affecting the kernel function estimation are the type of the kernel function and the radius of kernel function search. There are many types of kernel functions, such as Gaussian, uniform kernel, triangular kernel, and gamma kernel. The Gaussian function is the most commonly used in the literature. Xie and Yan argued that using different kernel functions has little effect on the result of the density estimation [
67]. From the influence factors of the kernel estimation function, the search radius has a more significant influence on the kernel estimation result than the use of different kernel functions.
Based on KDE, NKDE is widely used to identify the hotspots and evaluate ODs along with the road network. The bandwidth for NKDE has important influence in the detection of the smoothness of the spatial patterns, in which it is observed that the narrow bandwidths (between 20 and 250 m) are more appropriate for identifying local effects at smaller scales [
67]. Let
be the network kernel density estimation in a point x. Then we can obtain
as the sum of the different densities of the individual kernels for each point [
68], as shown in Equation (1):
where
is the O/D point event, with
, and
is the total number of all O/D points.
is the kernel function of point
.
is the value at a point
of different kernels for each point, and
is the value of NKDE at a point
. In this study, following previous research, we choose the Gaussian kernel. Notice that, the NKDE value at an O/D point of the road network presents the OD density.
4.2.2. ImNKDE
Our proposed improved NKDE (imNKDE) method aims at tackling the problem of large amounts of taxi datasets, so as to efficiently achieve the OD density. When the number of trajectories is huge, the procedure of querying each road edge and nearby taxi events is time-consuming and challenging for the NKDE method. Actually for the OD density estimation, in practice we compute the densities for the pick-up (O) events and drop-off (D) events individually which means that, for each location, its density estimation is independently estimated with regards to the other locations. Quite opposite, in our work we propose to estimate the OD densities of the subareas via NKDE, as it is observed that NKDE is very efficient when the number of trajectories is relatively small. More specifically, we divide the whole road network into different sub-networks and introduce a shared-memory parallel computing approach to estimate the OD densities for each subarea. Suppose we have
n road network edges, we divide the road network edges into
k parts (
k equals to the number of threads). All threads simultaneously execute the density estimation via NKDE, where a shared memory parallel computing method (in which different threads share the spatial indices of taxi events) is proposed for efficient processing. After running all the computing tasks for each road edge and querying nearby taxi events, we aggregate the results as the final OD density. The parameters for the imNKDE method are set as follows. The search radius for the Gaussian kernel function is set to 200 m. The equal split method is chosen with ten segments over road network [
26].
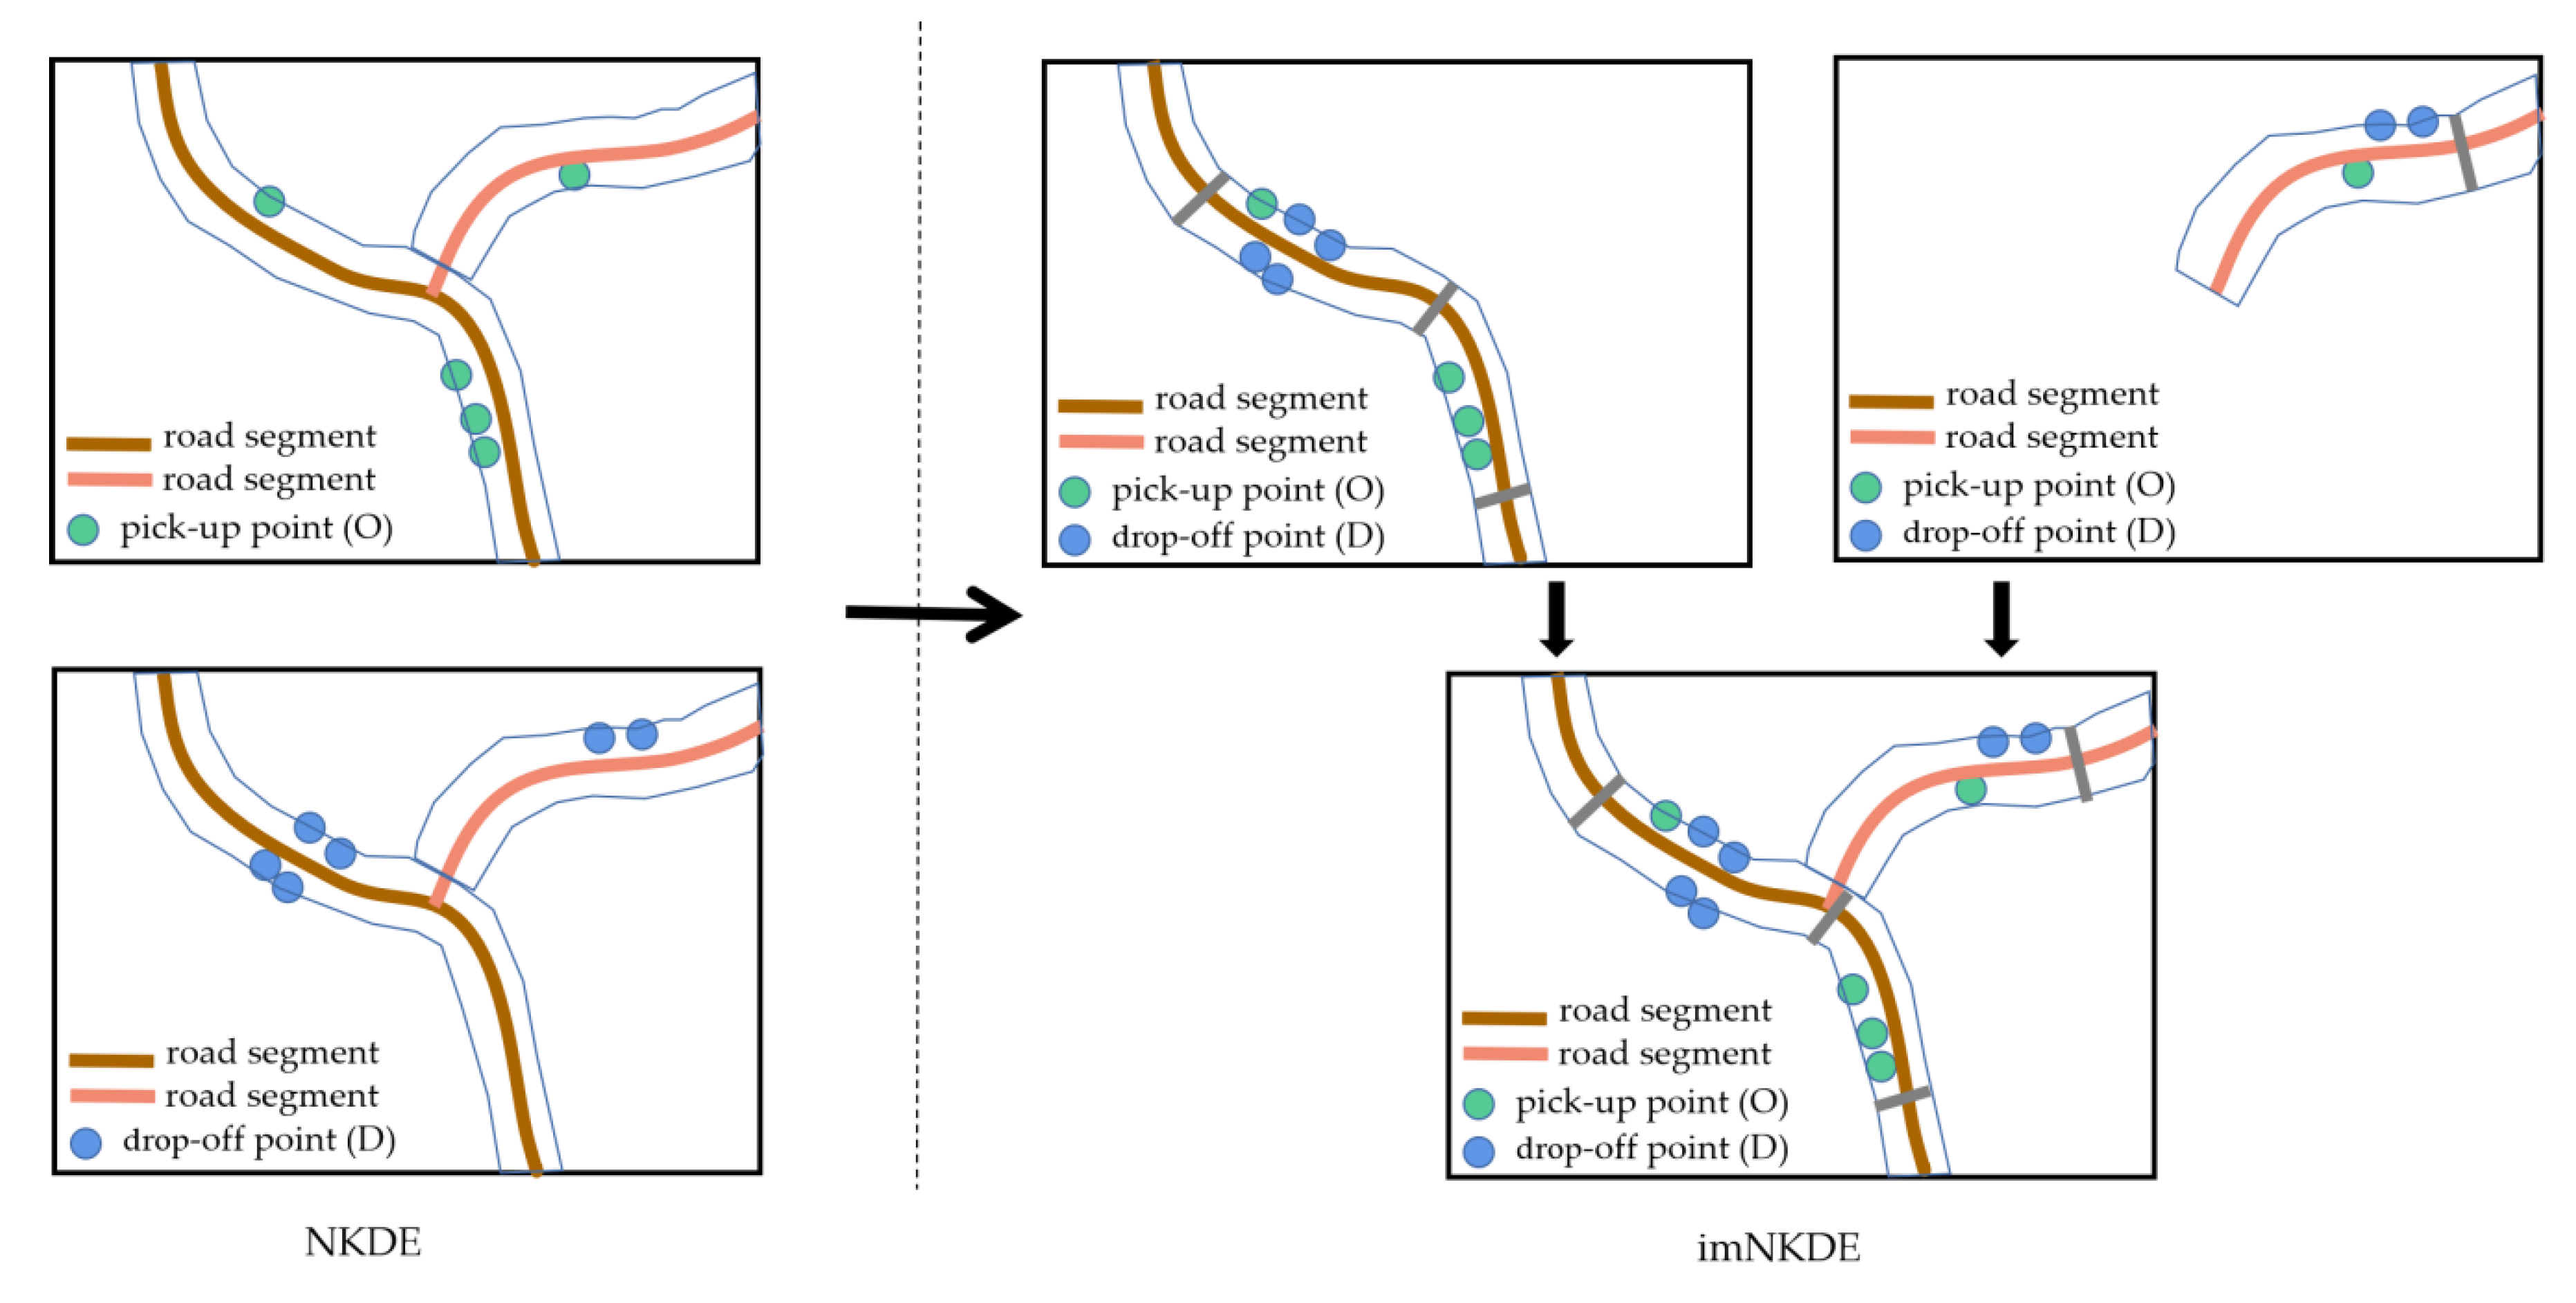
Figure 7 demonstrates the characteristic of NKDE and imNKDE methods, and the difference between them. As shown in
Figure 7, for NKDE, the O and D events are calculated individually for the whole area. Due to the large amount of data, and the complex network structure, it is time-consuming for the estimation. To improve the calculation efficiency, we divide the road network into different segments, and estimate the O and D density at the same time for different segments in our proposed imNKDE. Specifically, in order to improve the efficiency and avoid the loss of spatial information while decomposing the road network, OD densities for each segments are calculated with a shared memory parallel computing method. Next, the OD densities of segments have been aggregated to obtain the final OD densities. In general, compared with the original NKDE, our proposed imNKDE method has significantly improved the efficiency while achiving the same results for OD densities estimation with the traditional NKDE method.
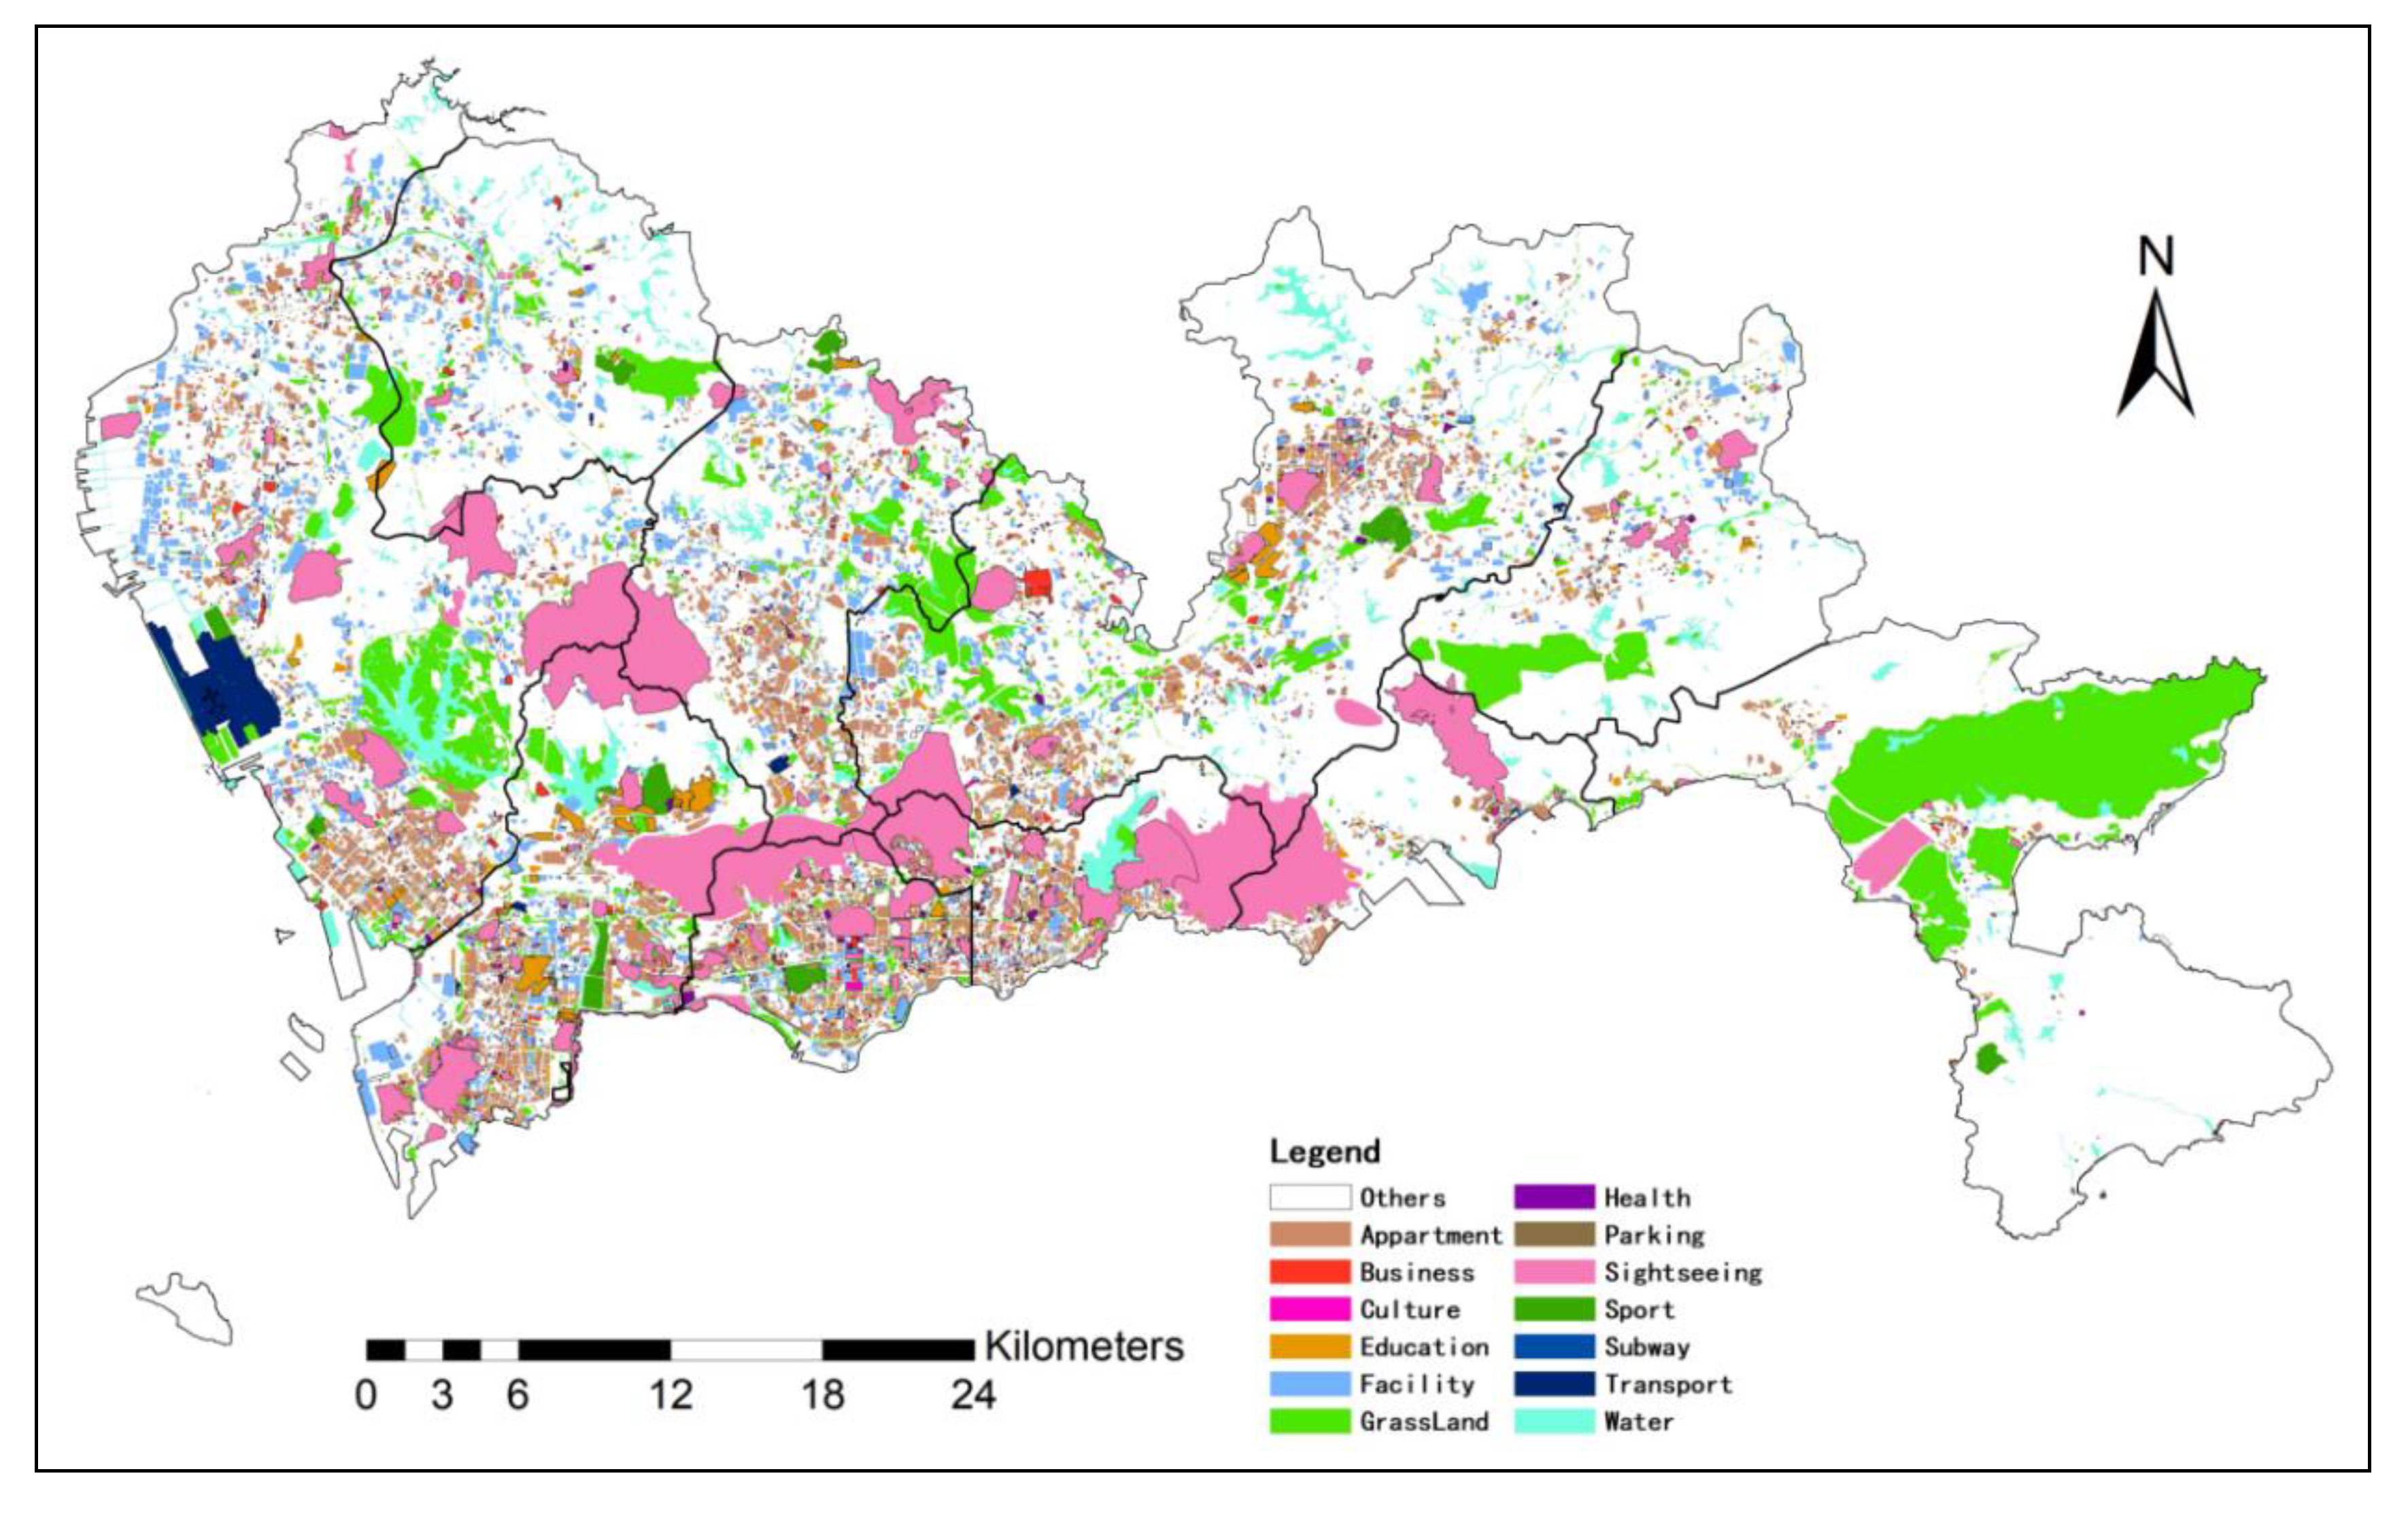
Finally, we use the proposed imNKDE to explore the relationship between taxi trip and land-use. Herein we consider the taxi trip OD density, and land-use data. Poisson regression is used to explore the relationship between the imNKDE and the land-use. For the relationship analysis, the imNKDE value is snapped into the 500 m * 500 m grid-based dataset. Then, the land-use type value is aggregated to the grid-based dataset. The Ordinary Least Squares (OLS) regression is a simple and effective multivariate regression method to estimate unknown factors for Poisson regression. The formulation for the OLS model is defined by Equation (2):
where
is the dependent variable, i.e., the land-use type,
is the intercept,
is the number of independent variables,
is the independent variable,
is the corresponding estimated coefficient, and
is the residual. Here, we calculate the relationship between taxi trip OD density and different land-use types respectively. Therefore, for different land-use types,
is imNKDE value, i.e., O density or D density. As we only consider the land-use type as independent variable, here,
, and
is the land-use type, thus
is used as the coefficient between land-use and imNKDE in the following parts.
If the p-value for the OLS result between the imNKDE and the land-use type is less than 0.05, then the variables are significant in affecting imNKDE in the regression. If the coefficient for the regression result is positive, the grids with high percentage of land-use values have high imNKDE.
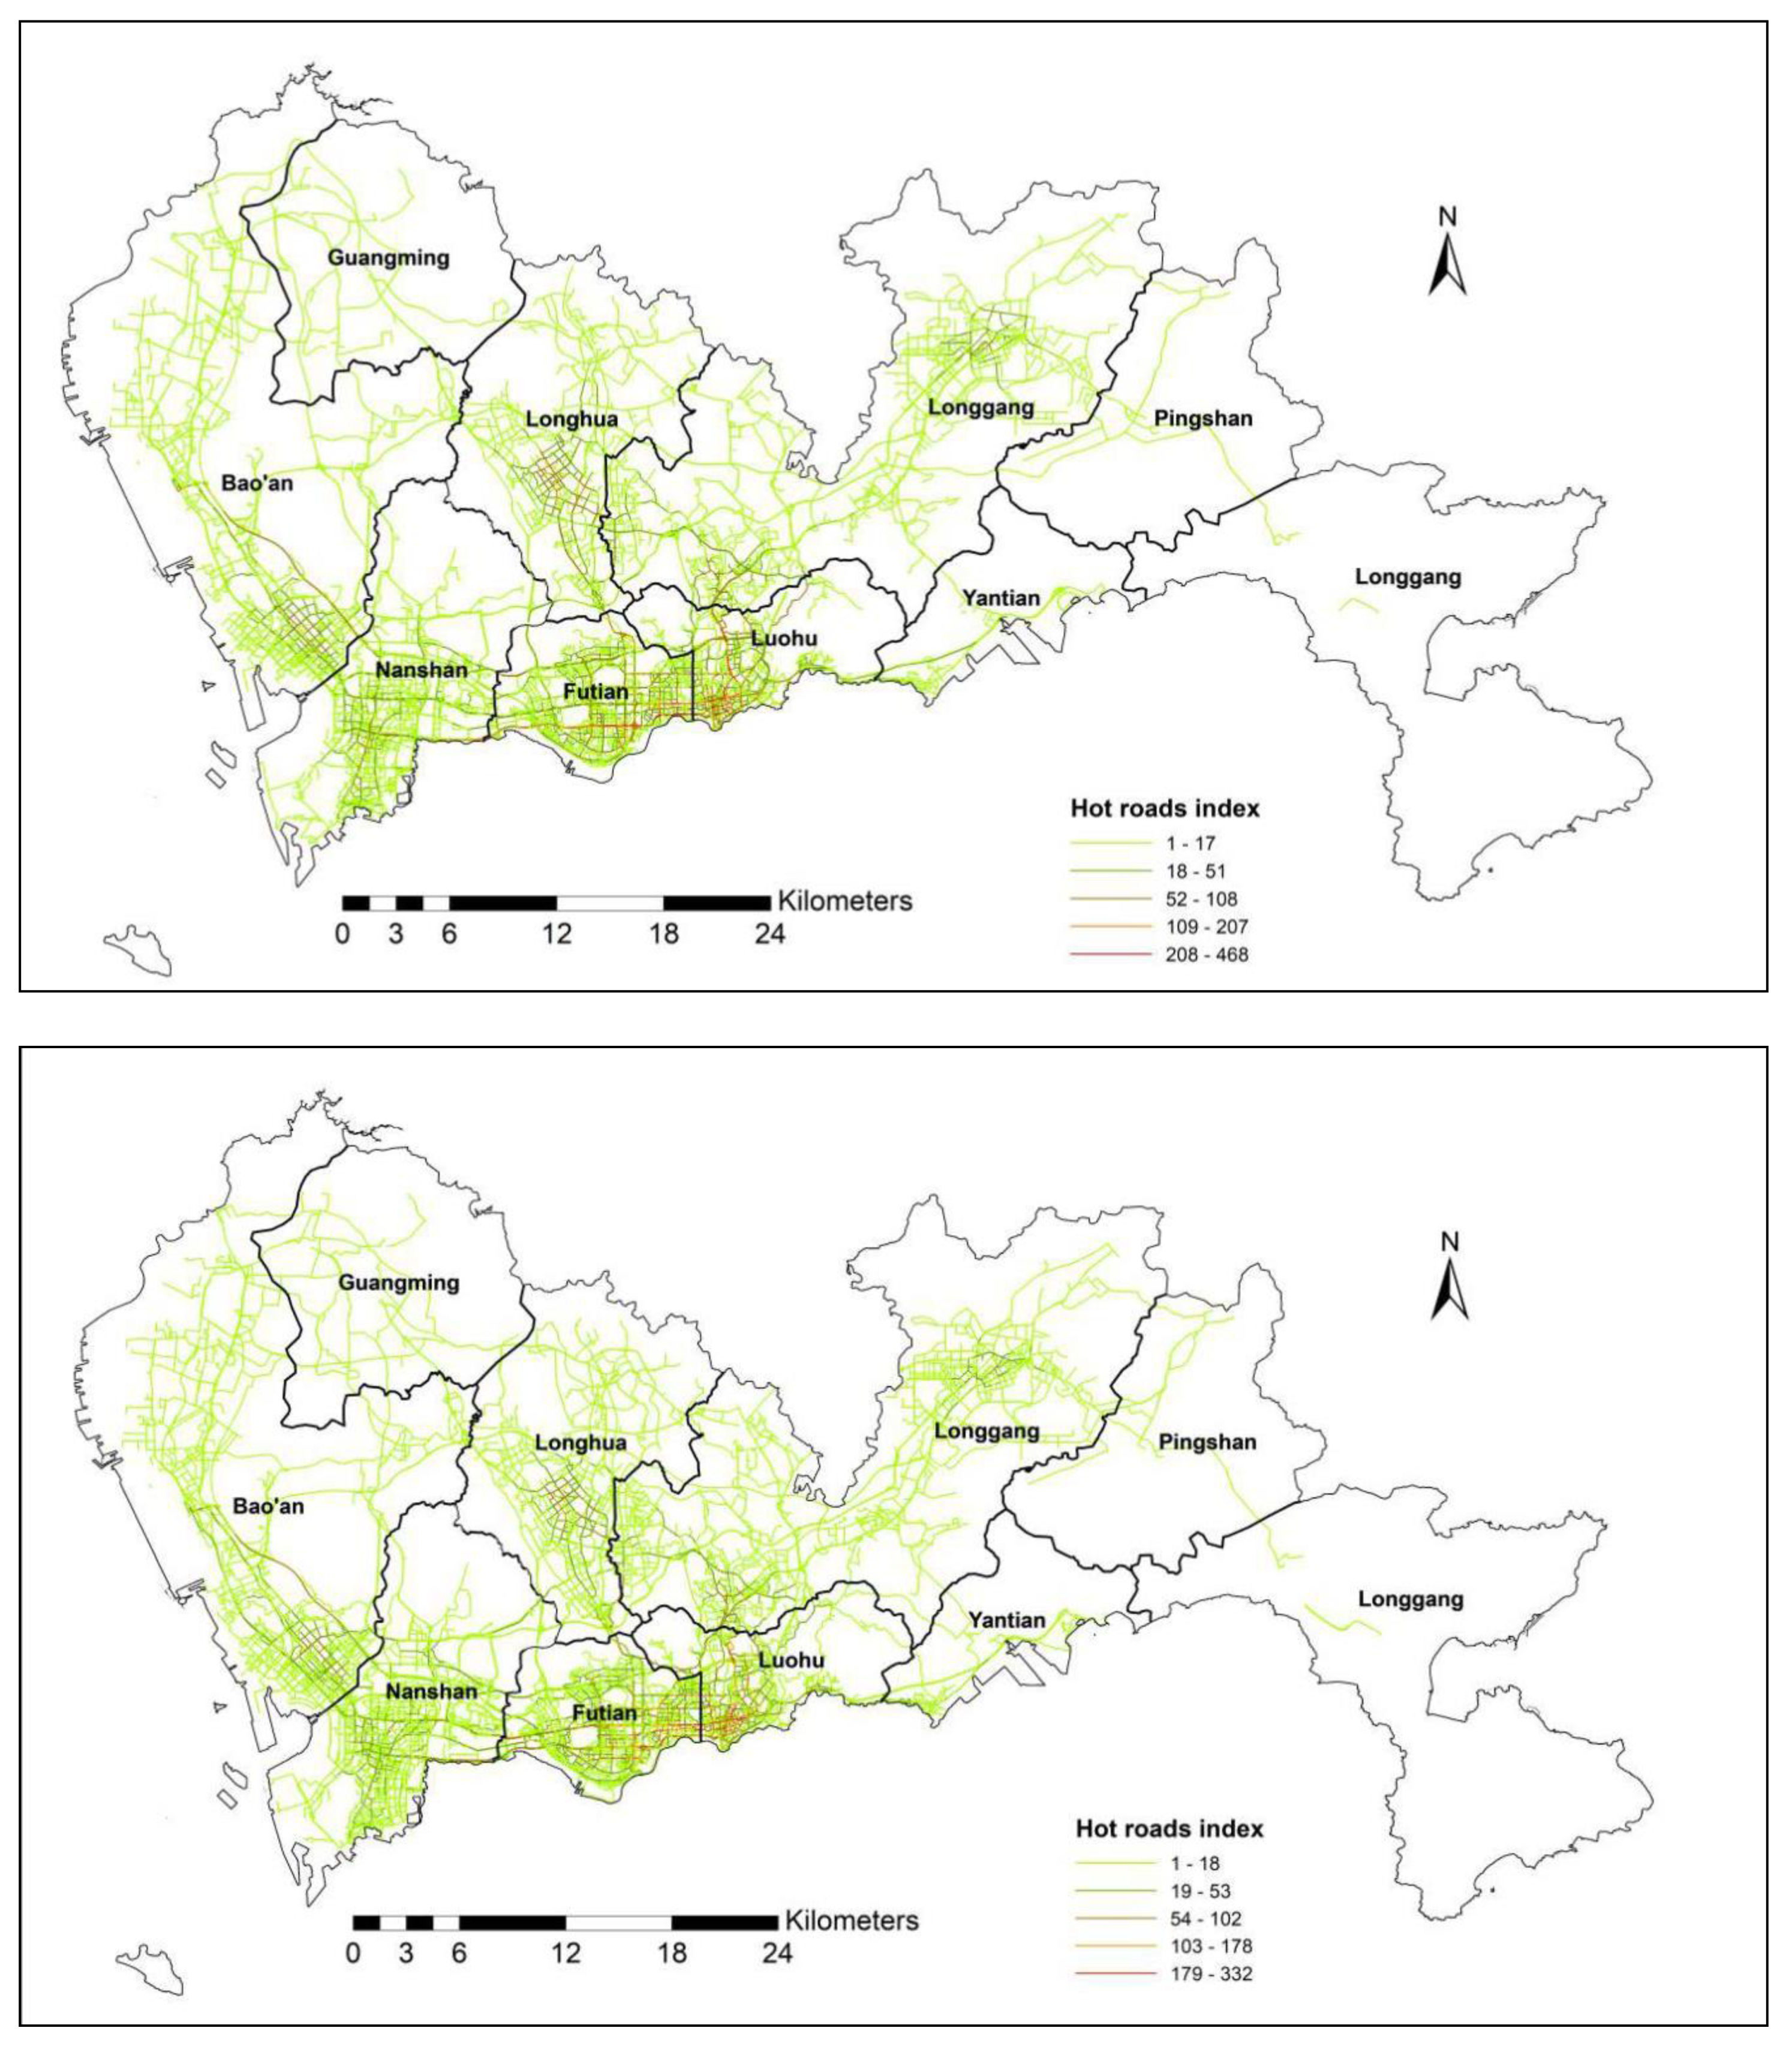
4.3. The Taxi Trip Patterns in Shenzhen (Metropolis)
The taxi trips and routes are used to describe the trip patterns. In this study, we analyze the difference between actual taxi trip and the corresponding shortest path, which is calculated considering the distance. The coincidence rate (CR) is considered to describe the relationship between a taxi trip and a shortest path. Let
be the taxi trip that is map-matched from the taxi trajectory, where
is the road segment for the taxi trip,
is the number of road segments for the taxi trip; let
be the corresponding shortest path, where
is the road segment for the shortest path,
is the number of road segments for the shortest path;
be the intersection of set
and
, with
being the road segment where passed by both the shortest path and the actual taxi trip, and
the number of these road segments. Then we have CR as follows:
where
denotes the length of road segment
, and
denotes the length of road segment
. The value of CR ranges from 0 to 1. When the CR value is 1, it means that the taxi trip is the same as the shortest path. When the CR value is 0, it indicates that there is no overlapping between a taxi trip and the shortest path. Here we also use the OLS for analysis purposes. If the p-value for the OLS result between the value on road segments and the frequency of the taxi trips is less than 0.05, which means the route choice is strongly dependent on the properties of the road network, instead of the shortest path.
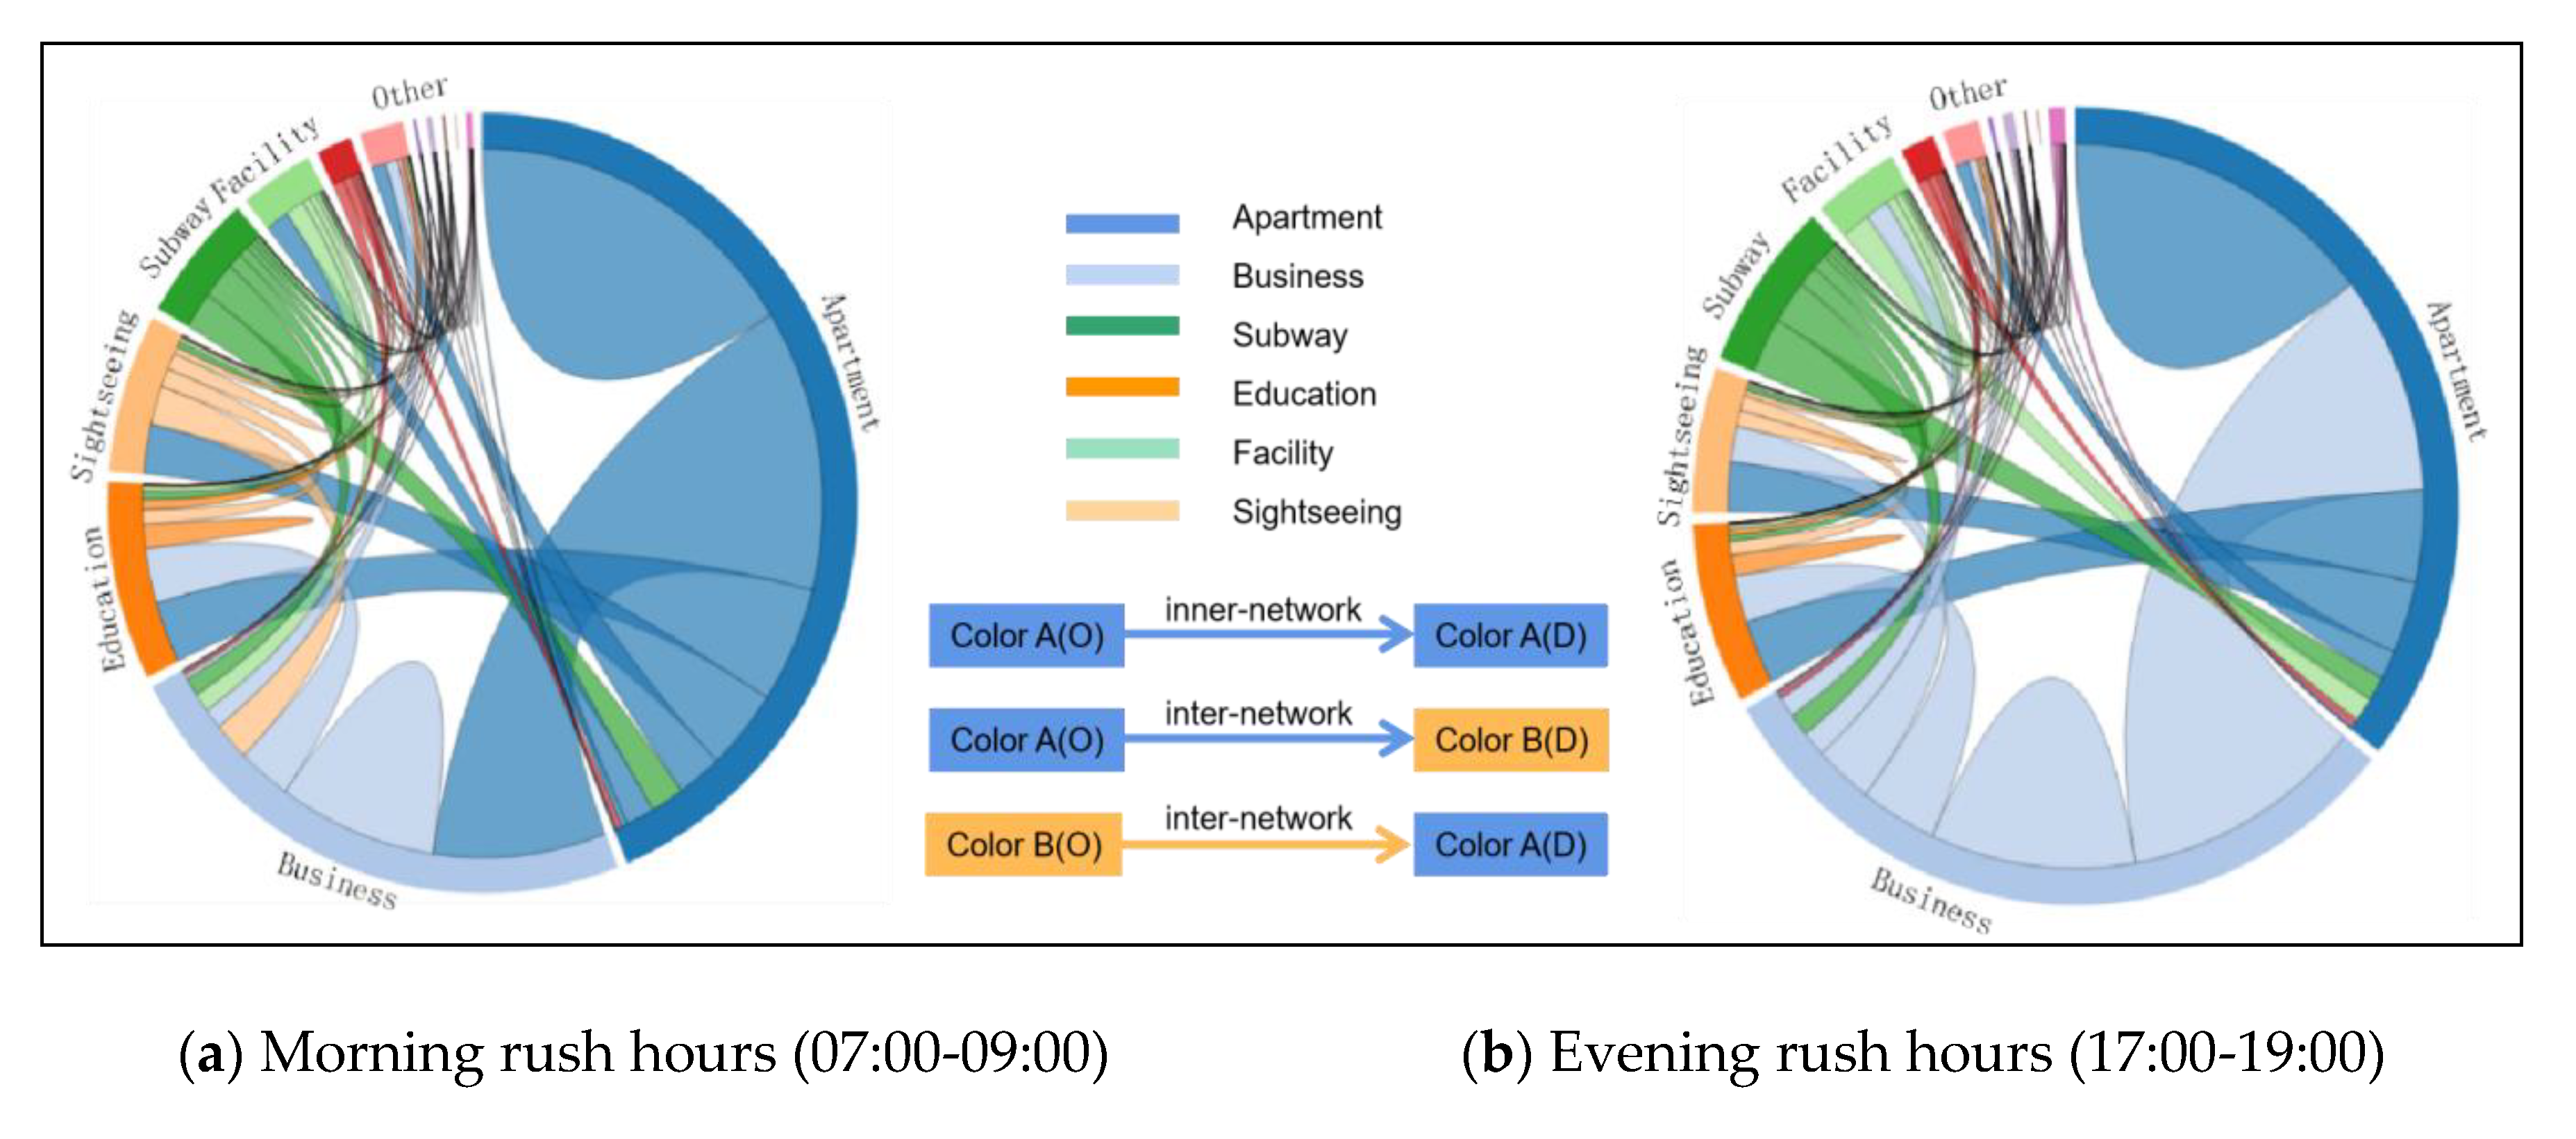
4.4. Network Flow Patterns
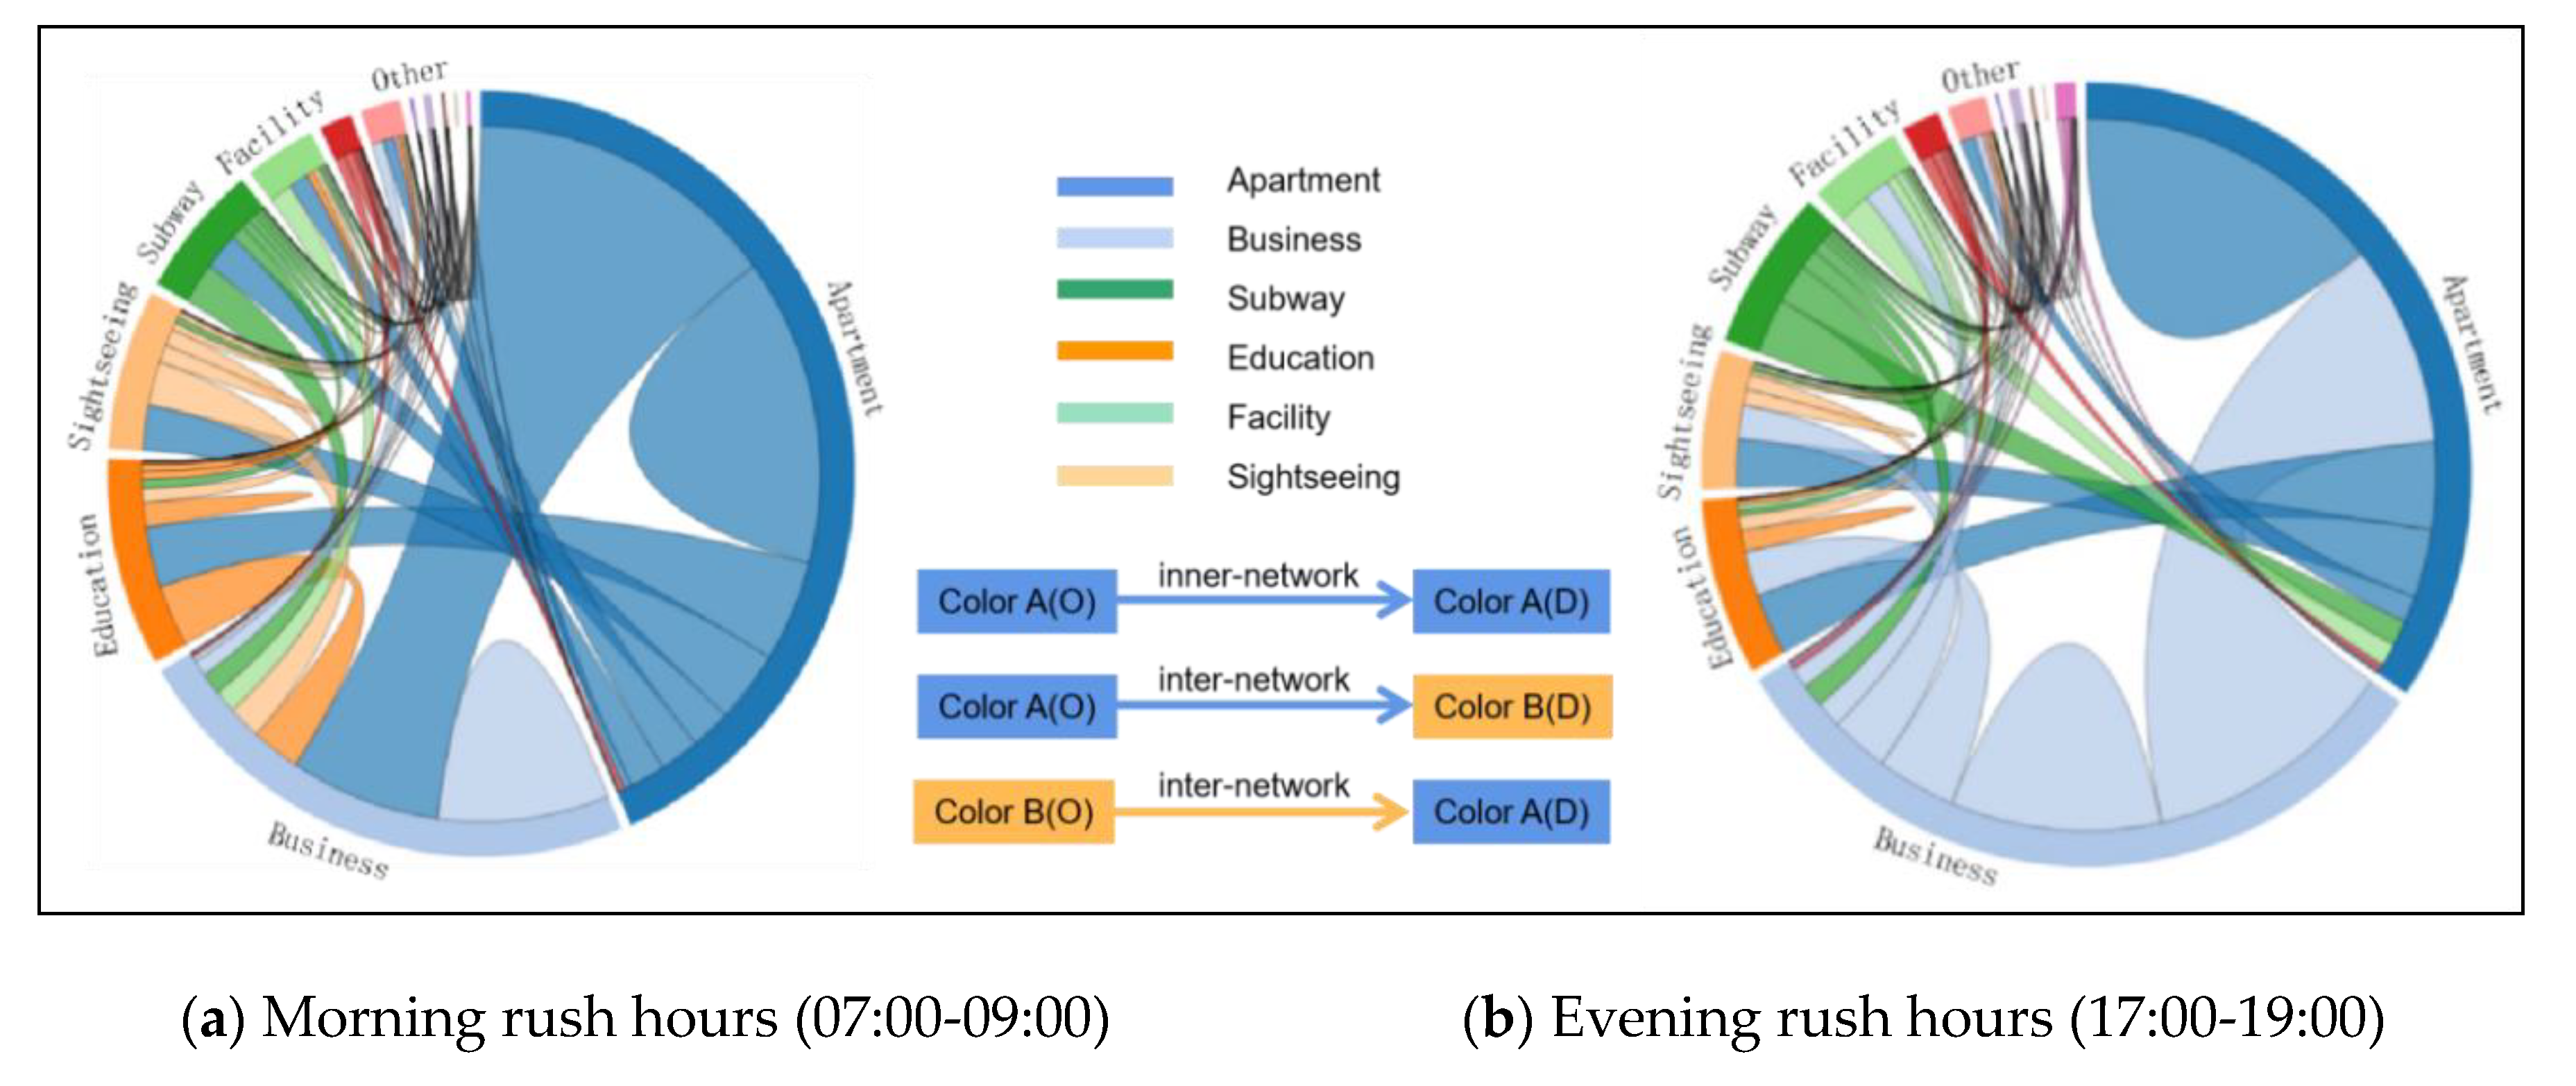
In this work, we use the proposed imNKDE with the network flow method, to detect the temporal patterns for taxi OD-trips among different regions. Taxi data are essential for understanding interaction patterns among different regions. The network flow among different districts can reveal the flow of taxi movement patterns. A chord diagram, representing network flows or connections between network nodes, has been designed for visualizing flows, using circular plots to quantify flow data [
69,
70]. Each component is represented by a fragment on the outer part of the circular layout. Then, network flow arcs are drawn between each pair of the network nodes. The width of the arc is proportional to the size of the network flow.
As the chord diagram can reveal the taxi trips’ interactions among different regions, a network flow matrix is built among different districts and different land-use regions. The point-in-polygon operator is performed for each pair of taxis in the OD flow. Notice that, if a pick-up (O) point is located in region A and the drop-off (D) point is located in region B, then the item value of network flow matrix from region A to region B is increased by 1 unit.
6. Conclusions and Future Work
The better understanding of taxi trip patterns is important for transport planning optimization. First, with the country’s vigorous promotion of new energy fields and a series of policy support, there are more and more new energy vehicles. It is very important to choose the appropriate sites for charging stations. The spatial distribution of OD densities based on imNKDE could help us know the main area of taxi trip, which could provide reference for the site selection. Meanwhile, the knowledge of ODs densities could guide the setting of stops for taxis. The proper setting of taxi stops can effectively reduce traffic jams and enhance the city image. Second, due to some reasons, such as the traffic jams, road maintenance and others, there are many taxi trips do not follow the shortest path rule. Therefore, with the relationship analysis between taxi trip and shortest path, the decision makers could know the possible deficiencies in the current transportation network, and design new strategies to improve the traffic network and promote the development of traffic. Last but not least, the network flow pattern of taxi trip could reflect the relationship between taxi trip and land-use, it can provide a guidance for traffic planning in other cities.
In this paper, we have developed a new method to identify the spatial variety in travel patterns from taxi mobility data and land-use. A main innovation of our method is that it considers the point, trip and network aspects simultaneously, as opposed to other existing methods. Another important contribution of our work is the development of a new improved network kernel density estimation (imNKDE) algorithm, with the capability of efficiently estimating the density of OD pairs from massive taxi trajectory data, to identify the spatial patterns from such density and land-use data. We also introduce the use of trip patterns to measure the relationship between taxi trips and taxi routes based on their similarities. Last but not least, another important contribution of this work is the incorporation of network flow pattern analytics to model the differences between taxi trip ODs and land-use data.
Our experimental results, conducted using a case study in the city of Shenzhen, China (including taxi mobility data, land-use data and road network data), demonstrate that our newly developed method can process large amounts of taxi trajectories and accurately identify network flow patterns, which are further exploited to discover the spatial interactions among different districts and land-use areas. Our spatial-temporal analytics is multi-source data-driven since there are more cities can be applicable using our methods. Although our method uses an efficient shared memory parallel implementation to estimate the OD densities for each subarea, in the future we will develop a graphics processing unit (GPU)-based implementation that will accelerate the processing of large amounts of data even more, aiming at real-time processing of trajectory data, which may greatly assist in traffic monitoring and control. Meanwhile, we will further analyze the relationship between taxi trip patterns and land-use and provide a reference for traffic planning.


