Article

Multi-View Instance Matching with Learned Geometric Soft-Constraints

by
Ahmed Samy Nassar
1,2,*,
Sébastien Lefèvre
2 and
Jan Dirk Wegner
1
1
EcoVision Lab, Photogrammetry and Remote Sensing Group, Institute of Geodesy and Photogrammetry, ETH Zurich, 8093 Zurich, Switzerland
2
IRISA, Université Bretagne Sud, 56000 Vannes, France
*
Author to whom correspondence should be addressed.
ISPRS Int. J. Geo-Inf. 2020, 9(11), 687; https://doi.org/10.3390/ijgi9110687
Submission received: 14 October 2020 / Revised: 3 November 2020 / Accepted: 11 November 2020 / Published: 18 November 2020

Abstract

:
We present a new approach for matching urban object instances across multiple ground-level images for the ultimate goal of city-scale mapping of objects with high positioning accuracy. What makes this task challenging is the strong change in view-point, different lighting conditions, high similarity of neighboring objects, and variability in scale. We propose to turn object instance matching into a learning task, where image-appearance and geometric relationships between views fruitfully interact. Our approach constructs a Siamese convolutional neural network that learns to match two views of the same object given many candidate image cut-outs. In addition to image features, we propose utilizing location information about the camera and the object to support image evidence via soft geometric constraints. Our method is compared to existing patch matching methods to prove its edge over state-of-the-art. This takes us one step closer to the ultimate goal of city-wide object mapping from street-level imagery to benefit city administration.

1. Introduction

Automated methods for mobile mapping to generate inventories of urban objects at large scale have received significant attention lately [1,2,3,4,5]. While most systems have laser scanners as a major part of their measurement device, a significant number of research efforts try to match objects across multiple views based solely on imagery. Some traditional methods [6] rely on SIFT [7] to perform the matching. Several methods [8] similarly employ Siamese CNNs to solve the problem. However, our case is different in that objects are static, but appear from very different viewing angles and distances in contrast to other works.
In this work, we propose to augment image evidence with soft geometric constraints to learn object instance matching in street-level images at large scale end-to-end. Our ultimate goal is to improve geo-positioning of urban objects from ground level images, particularly street-trees and traffic signs. To achieve this, we rely on using multi-views to have more information on the objects inside the scene. We acquire our geometric constraints from the metadata accompanying our images. The set up of the problem as demonstrated in Figure 1, which includes a scene with multiple cameras with a large distance between them. This introduces the problem of matching the objects inside the scene across multiple views which can be difficult due to how similar the objects can look while sharing the same background, as presented in Figure 2. Our method builds upon a Siamese architecture [9] that constructs two identical network branches sharing (at least partially) their weights. Features are computed for both input images and then compared to estimate the degree of similarity. This can be achieved by evaluating either a distance metric in feature space or the final classification loss. We build a Siamese CNN to match images of the same objects across multiple street-view images. Google street-view and Mapillary provide access to a huge amount of street-level images that can be used to construct very large datasets for deep learning approaches. Here, we use the former to build a multi-view dataset of street-trees and use a dataset provided by the latter for traffic signs. Both are then employed as testbeds to learn instance matching with soft geometric constraints based on a Siamese CNN model. Our main contribution is a modified Siamese CNN architecture that jointly learns geometric constellations from multi-view acquisitions jointly with the appearance information in the images. This will further on help us in our main pipeline to better geo-position objects in the wild, and to subsequently assign them with predefined semantic classes. As such, our problem encompasses several research topics in computer vision, such as multi-view object tracking, instance re-identification, and object localization. We highlight some examples in the literature per field and draw comparisons between these problems and ours in the following section.

2. Related Work

Siamese CNNs, as introduced by Bromley et al. [9], propose the matching of signatures using a neural network architecture with two usually identical network branches that partially share their weights at some stage. Siamese networks are used for a wide range of applications such as face verification [10,11,12], ground-to-aerial image matching [13,14], object tracking [15,16], local patch matching [17,18], and patch descriptors [19,20]. In this work, we explore Siamese networks to jointly learn robust appearance-based and geometric features and improve instance matching across multiple views.
Multi-view Object Tracking (MOT) has been tackled by many different deep learning approaches, e.g., the method of Leal-Taixé et al. [21] learns features using a Siamese CNN from multi-modal inputs from images and optical flow maps. In [22], a Siamese CNN and temporally constrained metrics are jointly learned to create a tracklet affinity model. Another approach [23] uses a combination of CNNs and recurrent neural networks (RNN) in order to match pairs of detections. In our setup and dataset, objects are not tracked from consecutive frames unlike the works mentioned, causing a background change which makes the problem more difficult.
Object geo-localization from ground imagery such as Google street-view has been a major research interest for several years, for example, for street-tree detection [24,25]. Other works aim at geo-localizing poles in Google street-view images [26] and use state-of-the-art object detectors along with a modified brute-force-based line-of-bearing to estimate the locations of the poles. Krylov and Dahyot [27] used semantic segmentation of images alongside a monocular depth estimator that feed into an MRF model to geo-localize traffic signs. Zhang et al. [28] detected road objects from ground level imagery and placed them into the right location using semantic segmentation and a topological binary tree.
Instance re-identification matches image patches for object re-identification purposes. The most similar problem to our task is the person re-identification problem, which has become a major research interest recently [8,29,30,31,32,33,34]. Another interesting application includes vehicle re-identification. For example, Huang et al. [35] used a CNN to extract features that are input to a temporal attention model. Liu et al. [36] used a CNN to extract appearance attributes, a Siamese CNN for license plate verification and the vehicle search is refined using re-ranking based on spatiotemporal relations. The authors of [37,38] used key points or descriptors to find matches between images; however, we try to find if image patches are of the same object, therefore finding descriptors is irrelevant. Again, our task differs significantly because consecutive images have large baselines (Google street-view panoramas) or are acquired from a moving platform (Mapillary dashcam dataset), which leads to high perspective change and varying background.

3. Instance Matching with Soft Geometric Constraints

An overview of the proposed pipeline is shown in Figure 3. The main idea is that corresponding images of the same object should follow the basic principles of stereo- (or multi-view) photogrammetry if the relative orientation between two or more camera viewpoints can be established. Directly imposing hard constraints based on the rules of, for example, forward intersection is hard. An unfavorable base-to-height ratio, i.e., trees on the street-side get very close to the camera but the distance between two panorama acquisitions is significantly larger, makes dense matching impossible. The perspective of the object changes too much to successfully match corresponding image pixels, as presented in Figure 2. Moreover, the heading and geolocation (that are recorded in the metadata of street-view panoramas) are often inaccurate due to telemetry interference or other causes. As for traffic signs, the image crops vary depending on the acquisition due to Mapillary’s dataset being crowdsourced. The crops can be acquired from a camera mounted on a vehicle or by pedestrians therefore providing an inconsistent setup. We thus propose to implicitly learn the distribution of geometric parameters that describe multi-view photogrammetry together with the image appearance of the objects. Our assumption is that this approach will enable cross-talking between image evidence and geometry. For example, if the same object appears with the same size in two images (but very different perspective), the triangle that connects both camera positions and the object must be roughly isosceles. That is, the object is located in between both camera standpoints. Conversely, the object in question that is viewed from the same perspective (very similar image appearance) but appears rather small will point at a pointy triangle with one very long leg (longer than the baseline) and another shorter leg. More literally speaking, the target object will most likely be situated outside the baseline between the two cameras.

3.1. Model Architecture

Our method employs a modified Siamese CNN that processes image crops, and geometric features jointly. We use geometric features composed of { [ C l a t * , C l n g * , h ] } , where C represents the image geolocation and h is the heading angle of the object inside the image. We add these geometric cues to image evidence inspired from Park et al. [39], who merged multi-modal data inside a single CNN architecture to minimize a joint loss function.
We feed two geometric vectors to our network in addition to the image crops containing the object instance, resulting in six channels in total, as shown in Figure 4. That creates an extra channel with the dimensions of the image for each geometric feature containing only the value of the feature. This is where this model differs from our previous work [40], in which the geometric vectors pass through a different subnetwork. Consequently, two feature subnetworks extract features from the geometric vectors and the image crops. Performing convolutions on the six channels provides enhanced descriptive features by applying the filter on both the RGB, and the geometric values conjointly. After that, the “Feature Subnetwork” produces “Feature Embeddings” that we provide as input to the “Decision Networks” that determines whether the images are similar or not.
In general, any state-of-the-art architecture could be used to extract the features. We experimented with shallow networks such as AlexNet and deeper networks such as ResNet for the different tasks in order to investigate how efficient (in terms of parameters) and deep the base network should be to extract the features. After preliminary experiments with common architectures such as AlexNet [41], ResNet34 [42], and MatchNet [18], we found ResNet34 to perform best in our scenario and thus kept it for all experiments. For future work, ResNet is a better choice implementation-wise when integrating with object detectors [43,44] that use ResNet as the backbone.
As shown in Figure 4, the features generated from the feature subnetworks are fed into the “decision networks” component, which is the decision-making part of the network that computes the similarity. This “decision networks” can be either a contrastive loss or made of fully connected layers [18] with classification (depending on the experiment, as we explain in the Results Section). The decision component is composed of four FC (fully connected) networks. Our Siamese CNNs shares the weights of the feature subnetworks, as suggested by Taigman et al. [11] when dealing with the same modality. Thus, both of our feature subnetworks are identical and come with shared network parameters.

3.2. Loss Functions

We tried three different variants of loss functions for our multi-view instance matching approach and explain their details in the following.
Contrastive: Our first approach is a Siamese CNN composed of two identical subnetworks that are trained with a contrastive loss function [45]. A contrastive loss (Equation (1)) takes a pair of features created from the two branches of the network as input, unlike other loss functions that evaluate the network across the training dataset. The loss function’s purpose is to bring matching or positive embeddings closer and push non-matching embeddings away in feature space. Therefore, the loss function encourages the network to output features that are close in feature space if samples are similar, or different features if they are not similar. This is achieved by penalizing the model depending on the samples. The contrastive loss function is defined as
L = 1 2 N ( n = 1 N y n d n 2 + ( 1 y n ) + ( 1 y n ) max ( m d n , 0 ) 2 )
where y is the ground truth label, m is a margin, and d n is any distance function between the two output features.
Metric: This is another Siamese CNN approach composed of similar subnetworks that provide the metric network with concatenated features. The metric network is composed of three fully connected layers with ReLU activation, except the last layer which encodes the binary cross entropy function (Equation (2)). The outputs of the last layer are two non-negative values within [0,1] that sum up to 1. Each value corresponds to the probability of the samples being classified as similar or not. Binary cross entropy is defined as
L = i = 1 C = 2 y i log ( s i ) = y 1 log ( s 1 ) ( 1 y 1 ) log ( 1 s 1 )
where we only have two classes. y 1 is the ground truth label and s 1 is the probability score for C 1 . Consequently, y 2 = 1 y 1 and s 2 = 1 s 1 are the ground truth and probability score for C 2 .
TripleNet: This is a triplet network architecture [46] composed of three identical subnetworks rather than two. Each feature subnetwork receives a different image to generate an embedding. The inputs are an anchor image (our main image or image in question), a positive image (an image similar to the anchor image), and a negative input (which is an image dissimilar to the anchor image). Similar to contrastive loss, the network is trained to minimize the anchor and positive embeddings while maximizing the distance between the anchor and negative embedding with a triplet loss (Equation (3)). The triplet loss is defined as:
L = max ( f ( A ) f ( P ) 2 f ( A ) f ( N ) 2 + m , 0 )
where m is the margin, f is the feature output, A is the anchor feature, P is the positive feature, and N is the negative feature. Note that all three architectures can be combined with different feature subnetworks such as AlexNet, MatchNet, ResNet34, etc.

4. Experiments

Our experiments were implemented in PyTorch. The weights of the network were initialized using the “Glorot uniform initializer” [47], the initial learning rate was set to 0.0001 with ADAM [48] as the optimizer, and the dropout rate was set to 0.3. All image patches were resized to 224 × 224 pixels and fed to the two network streams separately. Note that we applied standard pre-processing (mean subtraction and normalization) to the input images as well as the geometric features. We used normalization values calculated from ImageNet for our experiments since we used the pre-trained weights to initialize our models.

4.1. Datasets

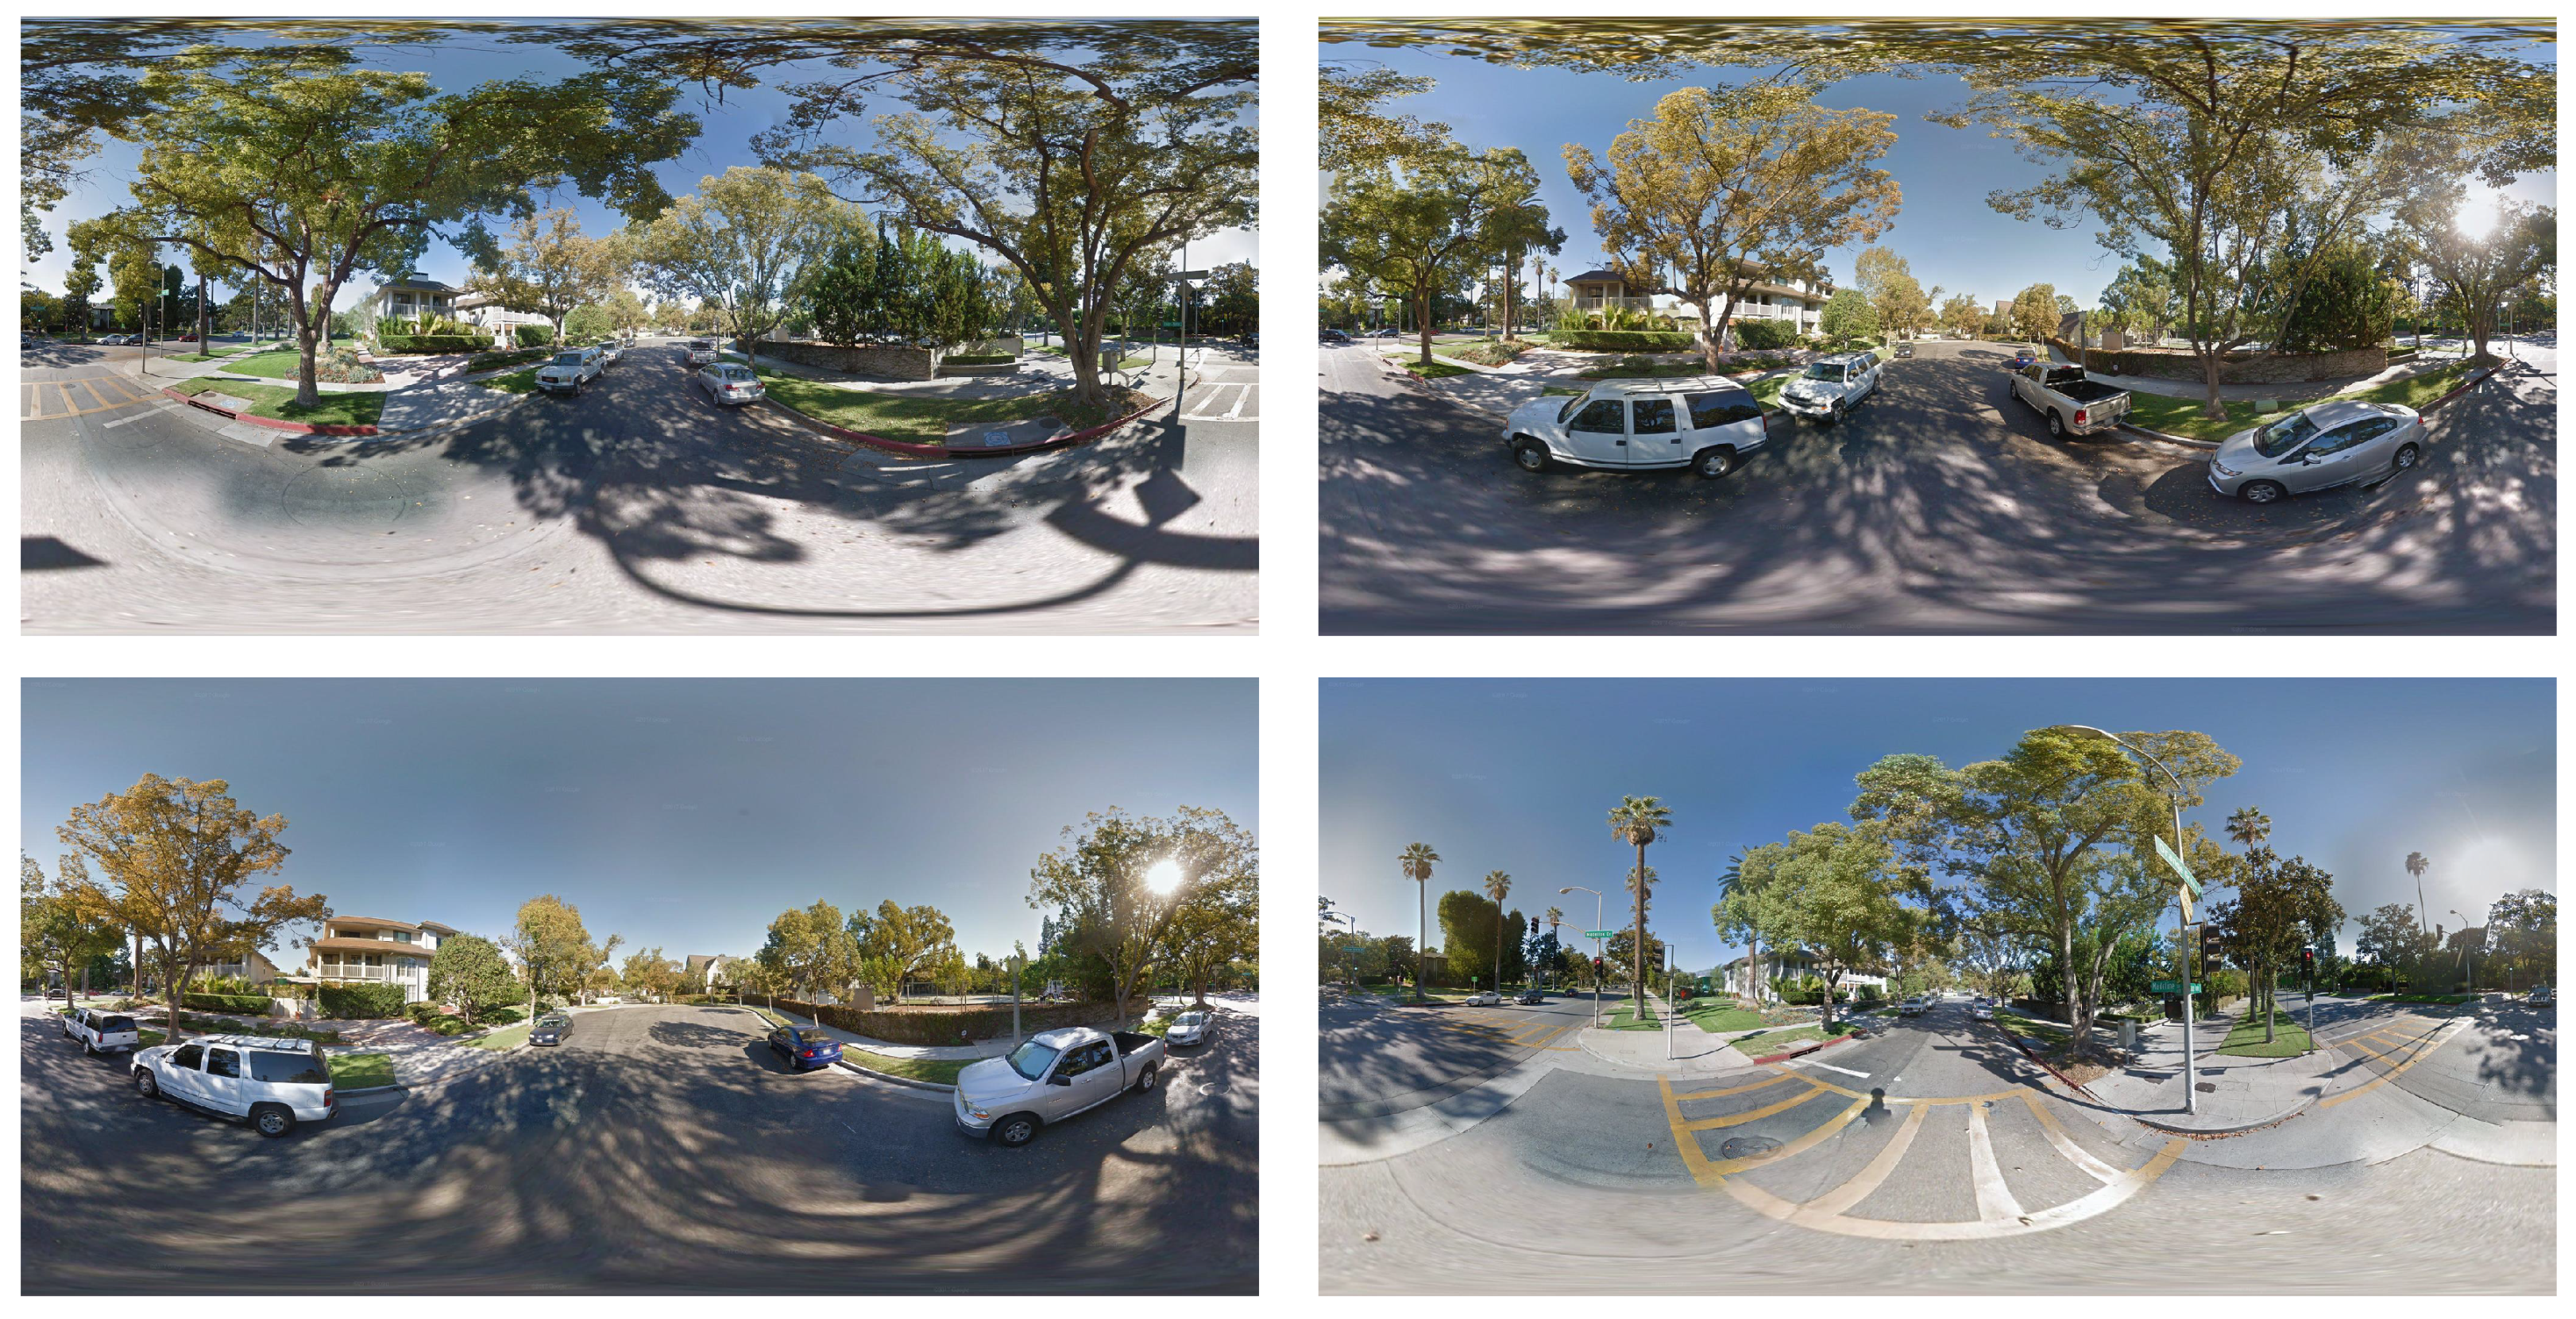
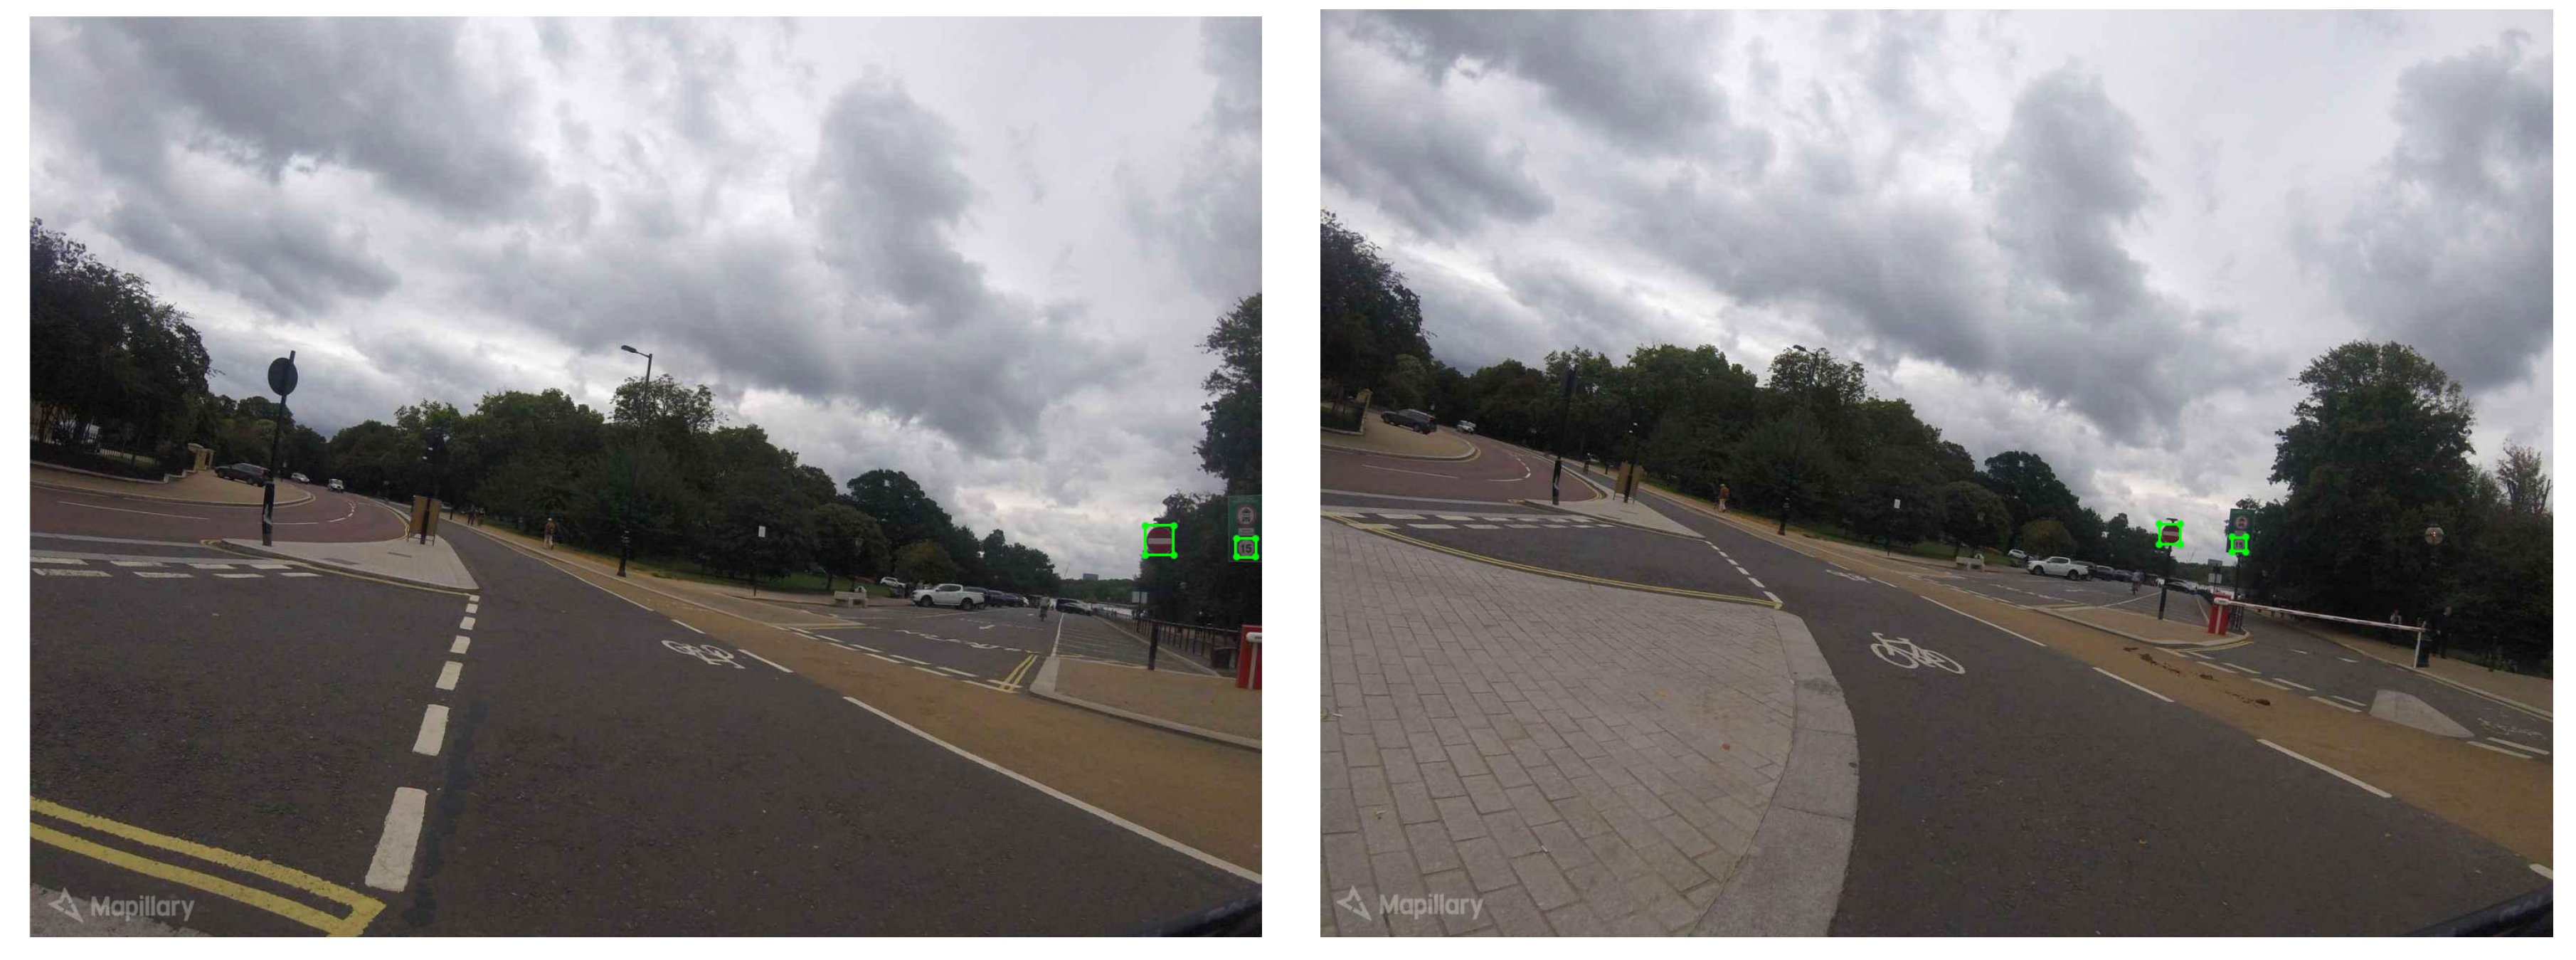
We evaluated our method on two different datasets. Both datasets differ in terms of objects, image geometry, and acquisition strategy. The Pasadena dataset consists of panorama images from Google street-view, whereas the Mapillary dataset contains mostly images acquired with various dash cams in moving vehicles. Objects of interest are trees in Pasadena and traffic signs in Mapillary. Baselines between consecutive panoramas of Pasadena are usually larger (≈50 m, Figure 5) than those between consecutive frames of Mapillary (usually a few meters depending on the speed of the vehicle, Figure 6). While panoramas of Pasadena show a 360 view around the mapping vehicle, Mapillary images are acquired with a forward looking camera in a moving vehicle, resulting in a much narrower field-of-view. In addition, this leads to different mappings of the same object in consecutive images, as shown in Figure 7. While objects in Mapillary images mainly experience a scale change while the vehicle is driven towards them, objects in panoramas also undergo a significant perspective change. In the following, we describe both datasets in more detail.

4.1.1. Pasadena

We tested our approach on a new dataset of Pasadena, California, USA, which extends the existing urban trees dataset of our previous work [13,25]. It is generated from an existing KML-file that contains rich information (geographic position, species, and trunk diameter) of 80,000 trees in the city of Pasadena. For every tree, we downloaded the closest four panoramic images of size 1664 × 832 pixels from Google street-view, as shown in Figure 5. A subset of 4400 trees with four views each was chosen, leading to 17,600 images in total plus meta-data. Note that the Pasadena inventory contains only street-trees, which makes up roughly 20% of all city trees. We drew bounding boxes around all street-trees per panorama image, which resulted in 47,000 bounding boxes in total. A crucial part of the labeling task was to label corresponding images of the same tree in the four closest views, as shown in Figure 1. As presented also in Figure 5, the perspective changes are drastic in some cases, making it even difficult for the human eye to tell if they are of the same location. In addition, distortions often occur when the trees overcast the 360 camera. Our final dataset is composed of panoramic images containing labeled trees (and matches between four tree images per tree), the panorama meta-data (geographic location and heading of the camera), and the geo-position per tree. Note that the geo-position per tree was used during training to generate ground truth parameters of our geometric features. It was not used during testing, but geometric parameters were directly derived from the individual panoramas.

4.1.2. Mapillary

We ran the baseline methods and our methods on a new dataset provided by Mapillary (www.mapillary.com) in order to verify our results. This dataset is not to be confused with the Mapillary Vistas dataset [49] which is provided for a semantic segmentation challenge. The dataset contains 31,342 instances of traffic signs that are identified within 74,320 images in an area of approximately 2 km 2 . On average, two traffic signs appear in each image. The dataset format is in GeoJSON, where each “feature” or identity has the following properties: (i) the geo-coordinate of the object that is attained by using 3D structure from motion techniques, which is thus affected by the GPS, and the density of the images; (ii) the objects distance in meters from the camera position; (iii) image keys to identify which the object appears in and which is used to retrieve the image using their API; (iv) geo-coordinates of the image location; (v) the object’s altitude and angle; and (vi) the annotation of the sign in polygon form.
The Mapillary dataset is quite different from our Pasadena dataset in many ways. The images are crowd-sourced with forward looking dash cameras on moving vehicles, smartphones, or even panoramic rigs on hobbyists cars. Therefore, the image sizes and quality are very inconsistent, as well as the time the images were captured. Because most of the images were captured from car dash cams, the viewpoint changes are only a few meters (Figure 6) due to the images being consecutive frames in comparison to a GSV panorama (Figure 5). As shown in Figure 6, because the camera is mostly forward looking, the objects are viewed almost from the same viewpoint with scale changes, and the objects are of a very small size in comparison to trees for instance. In addition, it is important to note that unlike trees the traffic signs are much smaller, and the best angle to capture them is from the front and not sideways due to how thin they are, as shown in Figure 6.

4.2. Evaluation Strategy

We performed a 10-fold cross-validation for all experiments to avoid any train-test split bias and over-fitting. Each tree comes with four image patches from different views, where every image patch is associated with a feature vector that contains geometric cues, as described in Section 3. For training the positive match category, we inserted matching image patch pairs from the same object with the geometry feature vectors to our model. Negative pairs of the rejection category were generated by randomly picking two image patches from two different objects. Initial tests showed that most mismatches occur at neighboring objects because geometry is least discriminative in such cases (i.e., the warping function is very similar) and objects share the same background. In the case of Pasadena, neighboring trees often belong to the same species, too, leading to very similar visual appearance in the images. Therefore, we added many negative example pairs from neighboring objects to make the classifier more robust.

4.3. Does Geometry Help?

We evaluated whether geometric evidence helps by comparing against a baseline without geometric features for the Pasadena and Mapillary datasets (Table 1). All three model architectures, Contrastive, Metric, and TripleNet, were evaluated per dataset with (w/ Geometry) and without geometric features (w/o Geometry).
The only difference from w/ Geometry to w/o Geometry is that we concatenated the geometric features to our image-based features right before the decision networks, i.e., after the feature subnetwork. Note that, for this experiment, we added geometric features at a later stage than for our full model (Ours) in order to allow a fair comparison. Adding geometric features consistently improves accuracy across datasets and architectures (Table 1). The Metric model architecture achieves the best results for Pasadena, whereas Contrastive works best for Mapillary.

4.4. Results

Superior performance of simple concatenation of geometric features to visual features (w/ Geometry) in comparison to using only visual features (w/o Geometry) leaves room for more discriminative, joint feature embedding. Ours adds geometric features as a second input in addition to image patches resulting in jointly convolving across geometric and visual cues with the feature subnetworks (ResNet34) at an earlier stage. In fact, using both sources of evidence simultaneously as input results allows the network to reason about their joint distribution. For reasons of consistency, we report the results of w/o Geometry and w/ Geometry for Pasadena and Mapillary using the different losses, with the same datasets. Since the TripleNet model architecture clearly performed worse for the baseline experiments, we keep only Contrastive and Metric for evaluating Ours (two bottom rows of Table 1).
Ours consistently outperforms all baseline methods regardless of the architecture. Adding geometric features at input to image patches, thus allowing the network to reason about the joint distribution of geometry and visual evidence, helps further reduce matching errors. Learning soft geometric constraints of typical scene configurations helps differentiate correct from incorrect matches in intricate situations.
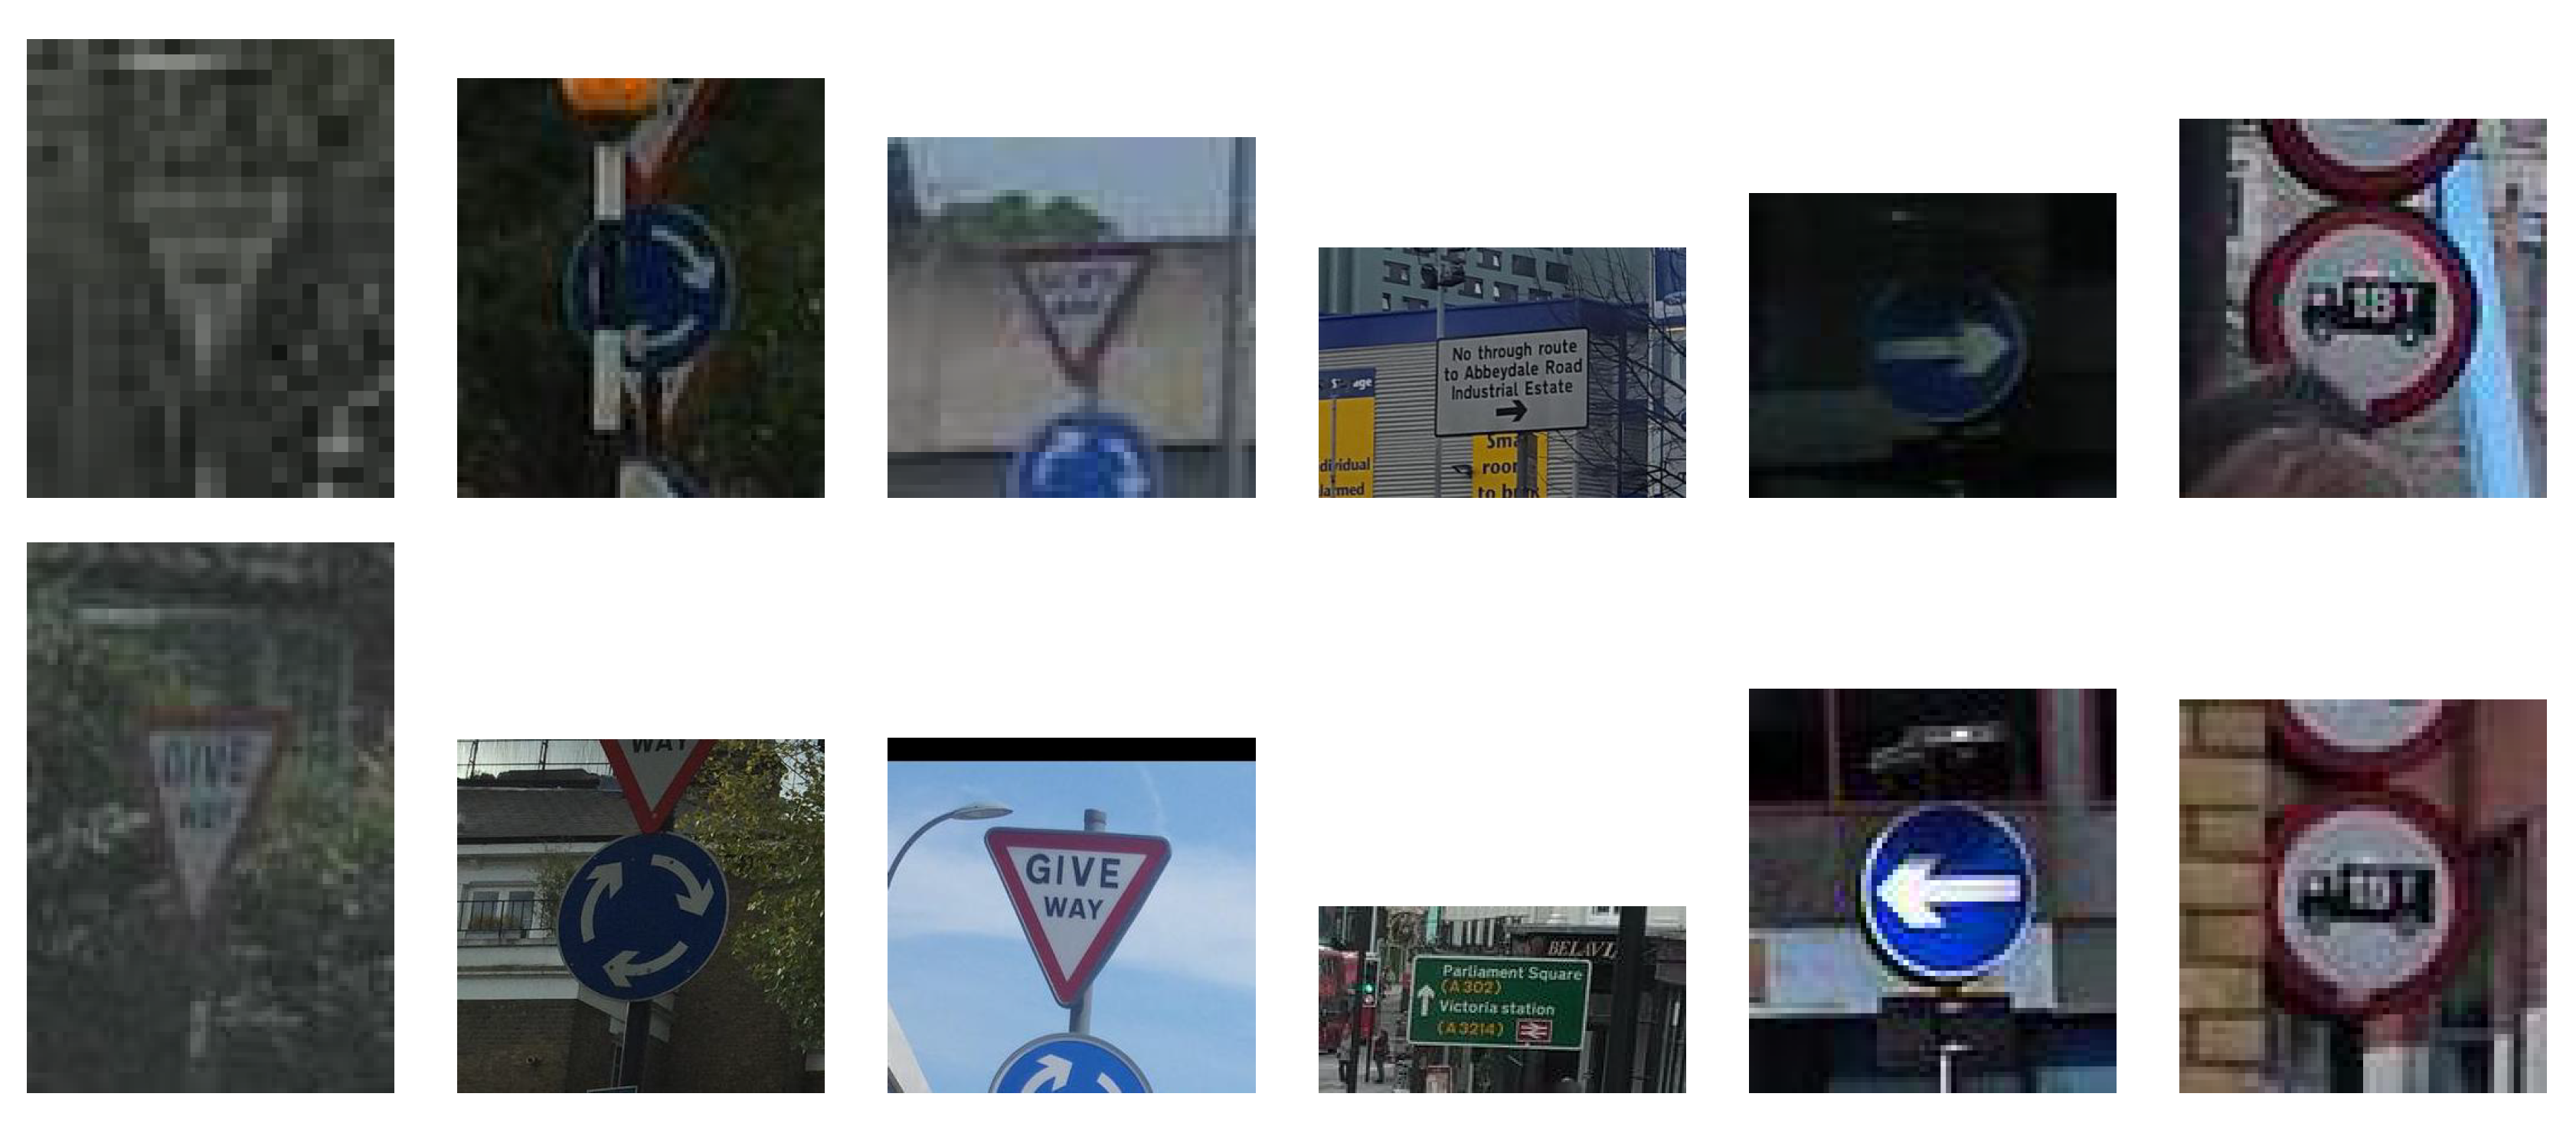
Examples for both correct classifications as not matching and matching for hard cases are shown in Figure 8 and Figure 9. Our method is able to correctly classify pairs of similar looking, neighboring trees as not matching (Figure 8), which was the major goal of this work to achieve more reliable object detections for multiple views. In addition, Ours also helps establish correct matches in difficult situations of very different viewing angles and occlusion. As for Mapillary, Ours helps in difficult situations if images are blurred, objects are partially occluded, or a significant perspective change happens, as shown in Figure 9. Furthermore, Ours correctly classifies image pairs of traffic signs of the same type as not matching even if these are located closely to one another (Figure 9).

5. Conclusions

We present a Siamese CNN architecture that jointly learns distributions of appearance-based warping functions and geometric scene cues for urban object (i.e., trees and traffic signs) instance matching in the wild. Instead of sequentially imposing hard thresholds based on multi-view photogrammetric rules, joint learning of appearance and geometry enables cross-talking of evidence inside a single network. While our network design is only a slightly adapted version of existing Siamese CNN architectures, adding geometry to image evidence consistently improves object instance matching results for both Pasadena and Mapillary datasets. Our hope is that this idea of “learning soft photogrammetric constraints” and combining them with object appearance will unleash a whole new line of research that models warped image content and relative sensor orientation jointly. For example, learned, soft photogrammetric constraints can help improving object detection across multiple views [50], for which in this study we explored different methods of incorporating the soft photogrammetric constraints in order to further experiment with learned end-to-end methods. Learning geometric constraints as soft priors jointly with image evidence will help in many situations where camera and object poses are ill-defined, noisy, or partially absent as well as for point cloud registration [51,52].

Author Contributions

Software, data curation, formal analysis, visualization, writing—original draft preparation, conceptualization, methodology, validation, resources, and writing—original draft preparation, Ahmed Samy Nassar; and conceptualization, methodology, validation, resources, writing—original draft preparation, writing—review and editing, funding acquisition, supervision, and project administration, Jan Dirk Wegner and Sébastien Lefèvreèvre. All authors have read and agreed to the published version of the manuscript.

Funding

This project was supported by funding provided by the Hasler Foundation.

Acknowledgments

We thank Mapillary for providing the dataset.

Conflicts of Interest

The authors declare no conflict of interest.

References

  1. Wu, J.; Yao, W.; Polewski, P. Mapping Individual Tree Species and Vitality along Urban Road Corridors with LiDAR and Imaging Sensors: Point Density versus View Perspective. Remote Sens. 2018, 10, 1403. [Google Scholar] [CrossRef] [Green Version]
  2. Wan, R.; Huang, Y.; Xie, R.; Ma, P. Combined Lane Mapping Using a Mobile Mapping System. Remote Sens. 2019, 11, 305. [Google Scholar] [CrossRef] [Green Version]
  3. Khoramshahi, E.; Campos, M.; Tommaselli, A.; Vilijanen, N.; Mielonen, T.; Kaartinen, H.; Kukko, A.; Honkavaara, E. Accurate Calibration Scheme for a Multi-Camera Mobile Mapping System. Remote Sens. 2019, 11, 2778. [Google Scholar] [CrossRef] [Green Version]
  4. Hillemann, M.; Weinmann, M.; Mueller, M.; Jutzi, B. Automatic Extrinsic Self-Calibration of Mobile Mapping Systems Based on Geometric 3D Features. Remote Sens. 2019, 11, 1955. [Google Scholar] [CrossRef] [Green Version]
  5. Balado, J.; González, E.; Arias, P.; Castro, D. Novel Approach to Automatic Traffic Sign Inventory Based on Mobile Mapping System Data and Deep Learning. Remote Sens. 2020, 12, 442. [Google Scholar] [CrossRef] [Green Version]
  6. Joglekar, J.; Gedam, S.S.; Mohan, B.K. Image matching using SIFT features and relaxation labeling technique—A constraint initializing method for dense stereo matching. IEEE Trans. Geosci. Remote Sens. 2014, 52, 5643–5652. [Google Scholar] [CrossRef]
  7. Lowe, D.G. Object recognition from local scale-invariant features. In Proceedings of the Seventh IEEE International Conference, Kerkyra, Greece, 20–27 September 1999; Volume 2, pp. 1150–1157. [Google Scholar]
  8. Li, W.; Zhao, R.; Xiao, T.; Wang, X. Deepreid: Deep filter pairing neural network for person re-identification. In Proceedings of the IEEE conference on computer vision and pattern recognition, Columbus, OH, USA, 23–28 June 2014; pp. 152–159. [Google Scholar]
  9. Bromley, J.; Guyon, I.; LeCun, Y.; Säckinger, E.; Shah, R. Signature verification using a “siamese” time delay neural network. Int. J. Pattern Recognit. Artif. Intell. 1993, 7, 669–688. [Google Scholar] [CrossRef] [Green Version]
  10. Chopra, S.; Hadsell, R.; LeCun, Y. Learning a similarity metric discriminatively, with application to face verification. In Proceedings of the CVPR, San Diego, CA, USA, 20–26 June 2005; pp. 539–546. [Google Scholar]
  11. Taigman, Y.; Yang, M.; Ranzato, M.; Wolf, L. Deepface: Closing the gap to human-level performance in face verification. In Proceedings of the IEEE Conference on Computer Vision and Pattern Recognition, Columbus, OH, USA, 23–28 June 2014; pp. 1701–1708. [Google Scholar]
  12. Koch, G.; Zemel, R.; Salakhutdinov, R. Siamese neural networks for one-shot image recognition. In Proceedings of the ICML Deep Learning Workshop, Lille, France, 6–11 July 2015; Volume 2. [Google Scholar]
  13. Lefèvre, S.; Tuia, D.; Wegner, J.D.; Produit, T.; Nassar, A.S. Toward seamless multiview scene analysis from satellite to street level. Proc. IEEE 2017, 105, 1884–1899. [Google Scholar] [CrossRef] [Green Version]
  14. Lin, T.Y.; Cui, Y.; Belongie, S.; Hays, J. Learning deep representations for ground-to-aerial geolocalization. In Proceedings of the IEEE Conference on Computer Vision and Pattern Recognition, Boston, MA, USA, 7–12 June 2015; pp. 5007–5015. [Google Scholar]
  15. Bertinetto, L.; Valmadre, J.; Henriques, J.F.; Vedaldi, A.; Torr, P.H. Fully-convolutional siamese networks for object tracking. In Proceedings of the European Conference on Computer Vision, Munich, Germany, 8–14 September 2016; pp. 850–865. [Google Scholar]
  16. Guo, Q.; Feng, W.; Zhou, C.; Huang, R.; Wan, L.; Wang, S. Learning dynamic siamese network for visual object tracking. In Proceedings of the IEEE International Conference on Computer Vision, Venice, Italy, 22–29 October 2017; pp. 1763–1771. [Google Scholar]
  17. Zbontar, J.; LeCun, Y. Stereo matching by training a convolutional neural network to compare image patches. J. Mach. Learn. Res. 2016, 17, 2. [Google Scholar]
  18. Han, X.; Leung, T.; Jia, Y.; Sukthankar, R.; Berg, A.C. Matchnet: Unifying feature and metric learning for patch-based matching. In Proceedings of the IEEE Conference on Computer Vision and Pattern Recognition, Boston, MA, USA, 7–12 June 2015; pp. 3279–3286. [Google Scholar]
  19. Tian, Y.; Fan, B.; Wu, F. L2-net: Deep learning of discriminative patch descriptor in euclidean space. In Proceedings of the IEEE Conference on Computer Vision and Pattern Recognition, Honolulu, HI, USA, 21–26 July 2017; pp. 661–669. [Google Scholar]
  20. Kumar, B.; Carneiro, G.; Reid, I. Learning local image descriptors with deep siamese and triplet convolutional networks by minimising global loss functions. In Proceedings of the IEEE Conference on Computer Vision and Pattern Recognition, Las Vegas, NV, USA, 27–30 June 2016; pp. 5385–5394. [Google Scholar]
  21. Leal-Taixé, L.; Canton-Ferrer, C.; Schindler, K. Learning by tracking: Siamese CNN for robust target association. In Proceedings of the IEEE Conference on Computer Vision and Pattern Recognition Workshops, Las Vegas, NV, USA, 26 June–1 July 2016; pp. 33–40. [Google Scholar]
  22. Wang, B.; Wang, L.; Shuai, B.; Zuo, Z.; Liu, T.; Luk Chan, K.; Wang, G. Joint learning of convolutional neural networks and temporally constrained metrics for tracklet association. In Proceedings of the IEEE Conference on Computer Vision and Pattern Recognition Workshops, Las Vegas, NV, USA, 26 June–1 July 2016; pp. 1–8. [Google Scholar]
  23. Sadeghian, A.; Alahi, A.; Savarese, S. Tracking the untrackable: Learning to track multiple cues with long-term dependencies. In Proceedings of the IEEE Conference on Computer Vision and Pattern Recognition, Honolulu, HI, USA, 21–26 July 2017; pp. 300–311. [Google Scholar]
  24. Wegner, J.D.; Branson, S.; Hall, D.; Schindler, K.; Perona, P. Cataloging public objects using aerial and street-level images—Urban trees. In Proceedings of the IEEE Conference on Computer Vision and Pattern Recognition Workshops, Las Vegas, NV, USA, 26 June–1 July 2016; pp. 6014–6023. [Google Scholar]
  25. Branson, S.; Wegner, J.D.; Hall, D.; Lang, N.; Schindler, K.; Perona, P. From Google Maps to a fine-grained catalog of street trees. ISPRS J. Photogramm. Remote Sens. 2018, 135, 13–30. [Google Scholar] [CrossRef] [Green Version]
  26. Zhang, W.; Witharana, C.; Li, W.; Zhang, C.; Li, X.; Parent, J. Using Deep Learning to Identify Utility Poles with Crossarms and Estimate Their Locations from Google Street View Images. Sensors 2018, 18, 2484. [Google Scholar] [CrossRef] [Green Version]
  27. Krylov, V.A.; Dahyot, R. Object Geolocation Using MRF Based Multi-Sensor Fusion. In Proceedings of the 2018 25th IEEE International Conference on Image Processing (ICIP), Athens, Greece, 7–10 October 2018; pp. 2745–2749. [Google Scholar]
  28. Zhang, C.; Fan, H.; Li, W.; Mao, B.; Ding, X. Automated detecting and placing road objects from street-level images. arXiv 2019, arXiv:1909.05621. [Google Scholar]
  29. Lin, Y.; Zheng, L.; Zheng, Z.; Wu, Y.; Hu, Z.; Yan, C.; Yang, Y. Improving person re-identification by attribute and identity learning. Pattern Recognit. 2019, 95, 151–161. [Google Scholar] [CrossRef] [Green Version]
  30. Liu, X.; Bi, S.; Ma, X.; Wang, J. Multi-Instance Convolutional Neural Network for multi-shot person re-identification. Neurocomputing 2019, 337, 303–314. [Google Scholar] [CrossRef]
  31. Meng, J.; Wu, S.; Zheng, W.S. Weakly Supervised Person Re-Identification. In Proceedings of the IEEE Conference on Computer Vision and Pattern Recognition, Long Beach, CA, USA, 16–20 June 2019; pp. 760–769. [Google Scholar]
  32. Bai, X.; Yang, M.; Huang, T.; Dou, Z.; Yu, R.; Xu, Y. Deep-person: Learning discriminative deep features for person re-identification. Pattern Recognit. 2020, 98, 107036. [Google Scholar] [CrossRef] [Green Version]
  33. Xiao, J.; Xie, Y.; Tillo, T.; Huang, K.; Wei, Y.; Feng, J. IAN: The individual aggregation network for person search. Pattern Recognit. 2019, 87, 332–340. [Google Scholar] [CrossRef] [Green Version]
  34. Xiao, T.; Li, S.; Wang, B.; Lin, L.; Wang, X. Joint detection and identification feature learning for person search. In Proceedings of the IEEE Conference on Computer Vision and Pattern Recognition, Honolulu, HI, USA, 21–26 July 2017; pp. 3415–3424. [Google Scholar]
  35. Huang, T.W.; Cai, J.; Yang, H.; Hsu, H.M.; Hwang, J.N. Multi-View Vehicle Re-Identification using Temporal Attention Model and Metadata Re-ranking. In Proceedings of the AI City Challenge Workshop, IEEE/CVF Computer Vision and Pattern Recognition (CVPR) Conference, Long Beach, CA, USA, 16–20 June 2019. [Google Scholar]
  36. Liu, X.; Liu, W.; Mei, T.; Ma, H. A deep learning-based approach to progressive vehicle re-identification for urban surveillance. In Proceedings of the European Conference on Computer Vision, Amsterdam, The Netherlands, 11–14 October 2016; pp. 869–884. [Google Scholar]
  37. Altwaijry, H.; Belongie, S.J. Ultra-wide Baseline Aerial Imagery Matching in Urban Environments. In Proceedings of the BMVC, Bristol, UK, 9–13 September 2013. [Google Scholar]
  38. DeTone, D.; Malisiewicz, T.; Rabinovich, A. Superpoint: Self-supervised interest point detection and description. In Proceedings of the IEEE Conference on Computer Vision and Pattern Recognition Workshops, Salt Lake City, UT, USA, 18–22 June 2018; pp. 224–236. [Google Scholar]
  39. Park, E.; Han, X.; Berg, T.L.; Berg, A.C. Combining multiple sources of knowledge in deep cnns for action recognition. In Proceedings of the IEEE Winter Conference on Applications of Computer Vision, Lake Placid, NY, USA, 7–10 March 2016; pp. 1–8. [Google Scholar]
  40. Nassar, A.S.; Lang, N.; Lefèvre, S.; Wegner, J.D. Learning geometric soft constraints for multi-view instance matching across street-level panoramas. In Proceedings of the 2019 Joint Urban Remote Sensing Event (JURSE), Vannes, France, 22–24 May 2019; pp. 1–4. [Google Scholar] [CrossRef] [Green Version]
  41. Krizhevsky, A.; Sutskever, I.; Hinton, G.E. Imagenet classification with deep convolutional neural networks. In Advances in Neural Information Processing Systems; MIT Press: Wayne, PA, USA, 2012; pp. 1097–1105. [Google Scholar]
  42. He, K.; Zhang, X.; Ren, S.; Sun, J. Deep residual learning for image recognition. In Proceedings of the IEEE Conference on Computer Vision and Pattern Recognition, Las Vegas, NV, USA, 26 June–1 July 2016; pp. 770–778. [Google Scholar]
  43. Lin, T.Y.; Goyal, P.; Girshick, R.; He, K.; Dollár, P. Focal loss for dense object detection. In Proceedings of the IEEE International Conference on Computer Vision, Venice, Italy, 22–29 October 2017; pp. 2980–2988. [Google Scholar]
  44. He, K.; Gkioxari, G.; Dollár, P.; Girshick, R. Mask r-cnn. In Proceedings of the IEEE International Conference on Computer Vision, Venice, Italy, 22–29 October 2017; pp. 2961–2969. [Google Scholar]
  45. Hadsell, R.; Chopra, S.; LeCun, Y. Dimensionality reduction by learning an invariant mapping. In Proceedings of the 2006 IEEE Computer Society Conference on Computer Vision and Pattern Recognition (CVPR’06), New York, NY, USA, 17–22 June 2006; Volume 2, pp. 1735–1742. [Google Scholar]
  46. Hoffer, E.; Ailon, N. Deep metric learning using triplet network. In Proceedings of the International Workshop on Similarity-Based Pattern Recognition, Copenhagen, Denmark, 12–14 October 2015; pp. 84–92. [Google Scholar]
  47. Glorot, X.; Bengio, Y. Understanding the difficulty of training deep feedforward neural networks. In Proceedings of the International Conference on Artificial Intelligence and Statistics, Sardinia, Italy, 13–15 May 2010; pp. 249–256. [Google Scholar]
  48. Kingma, D.P.; Ba, J. Adam: A method for stochastic optimization. arXiv 2014, arXiv:1412.6980. [Google Scholar]
  49. Neuhold, G.; Ollmann, T.; Rota Bulo, S.; Kontschieder, P. The mapillary vistas dataset for semantic understanding of street scenes. In Proceedings of the IEEE International Conference on Computer Vision, Venice, Italy, 22–29 October 2017; pp. 4990–4999. [Google Scholar]
  50. Nassar, A.S.; Lefèvre, S.; Wegner, J.D. Simultaneous multi-view instance detection with learned geometric soft-constraints. In Proceedings of the International Conference on Computer Vision (ICCV), Seoul, Korea, 27 October–2 November 2019; pp. 6559–6568. [Google Scholar]
  51. Gojcic, Z.; Zhou, C.; Wegner, J.D.; Wieser, A. The Perfect Match: 3D Point Cloud Matching with Smoothed Densities. In Proceedings of the IEEE Conference on Computer Vision and Pattern Recognition (CVPR), Long Beach, CA, USA, 15–20 June 2019; pp. 5545–5554. [Google Scholar]
  52. Gojcic, Z.; Zhou, C.; Wegner, J.D.; Guibas, L.J.; Birdal, T. Learning multiview 3D point cloud registration. arXiv 2020, arXiv:2001.05119. [Google Scholar]
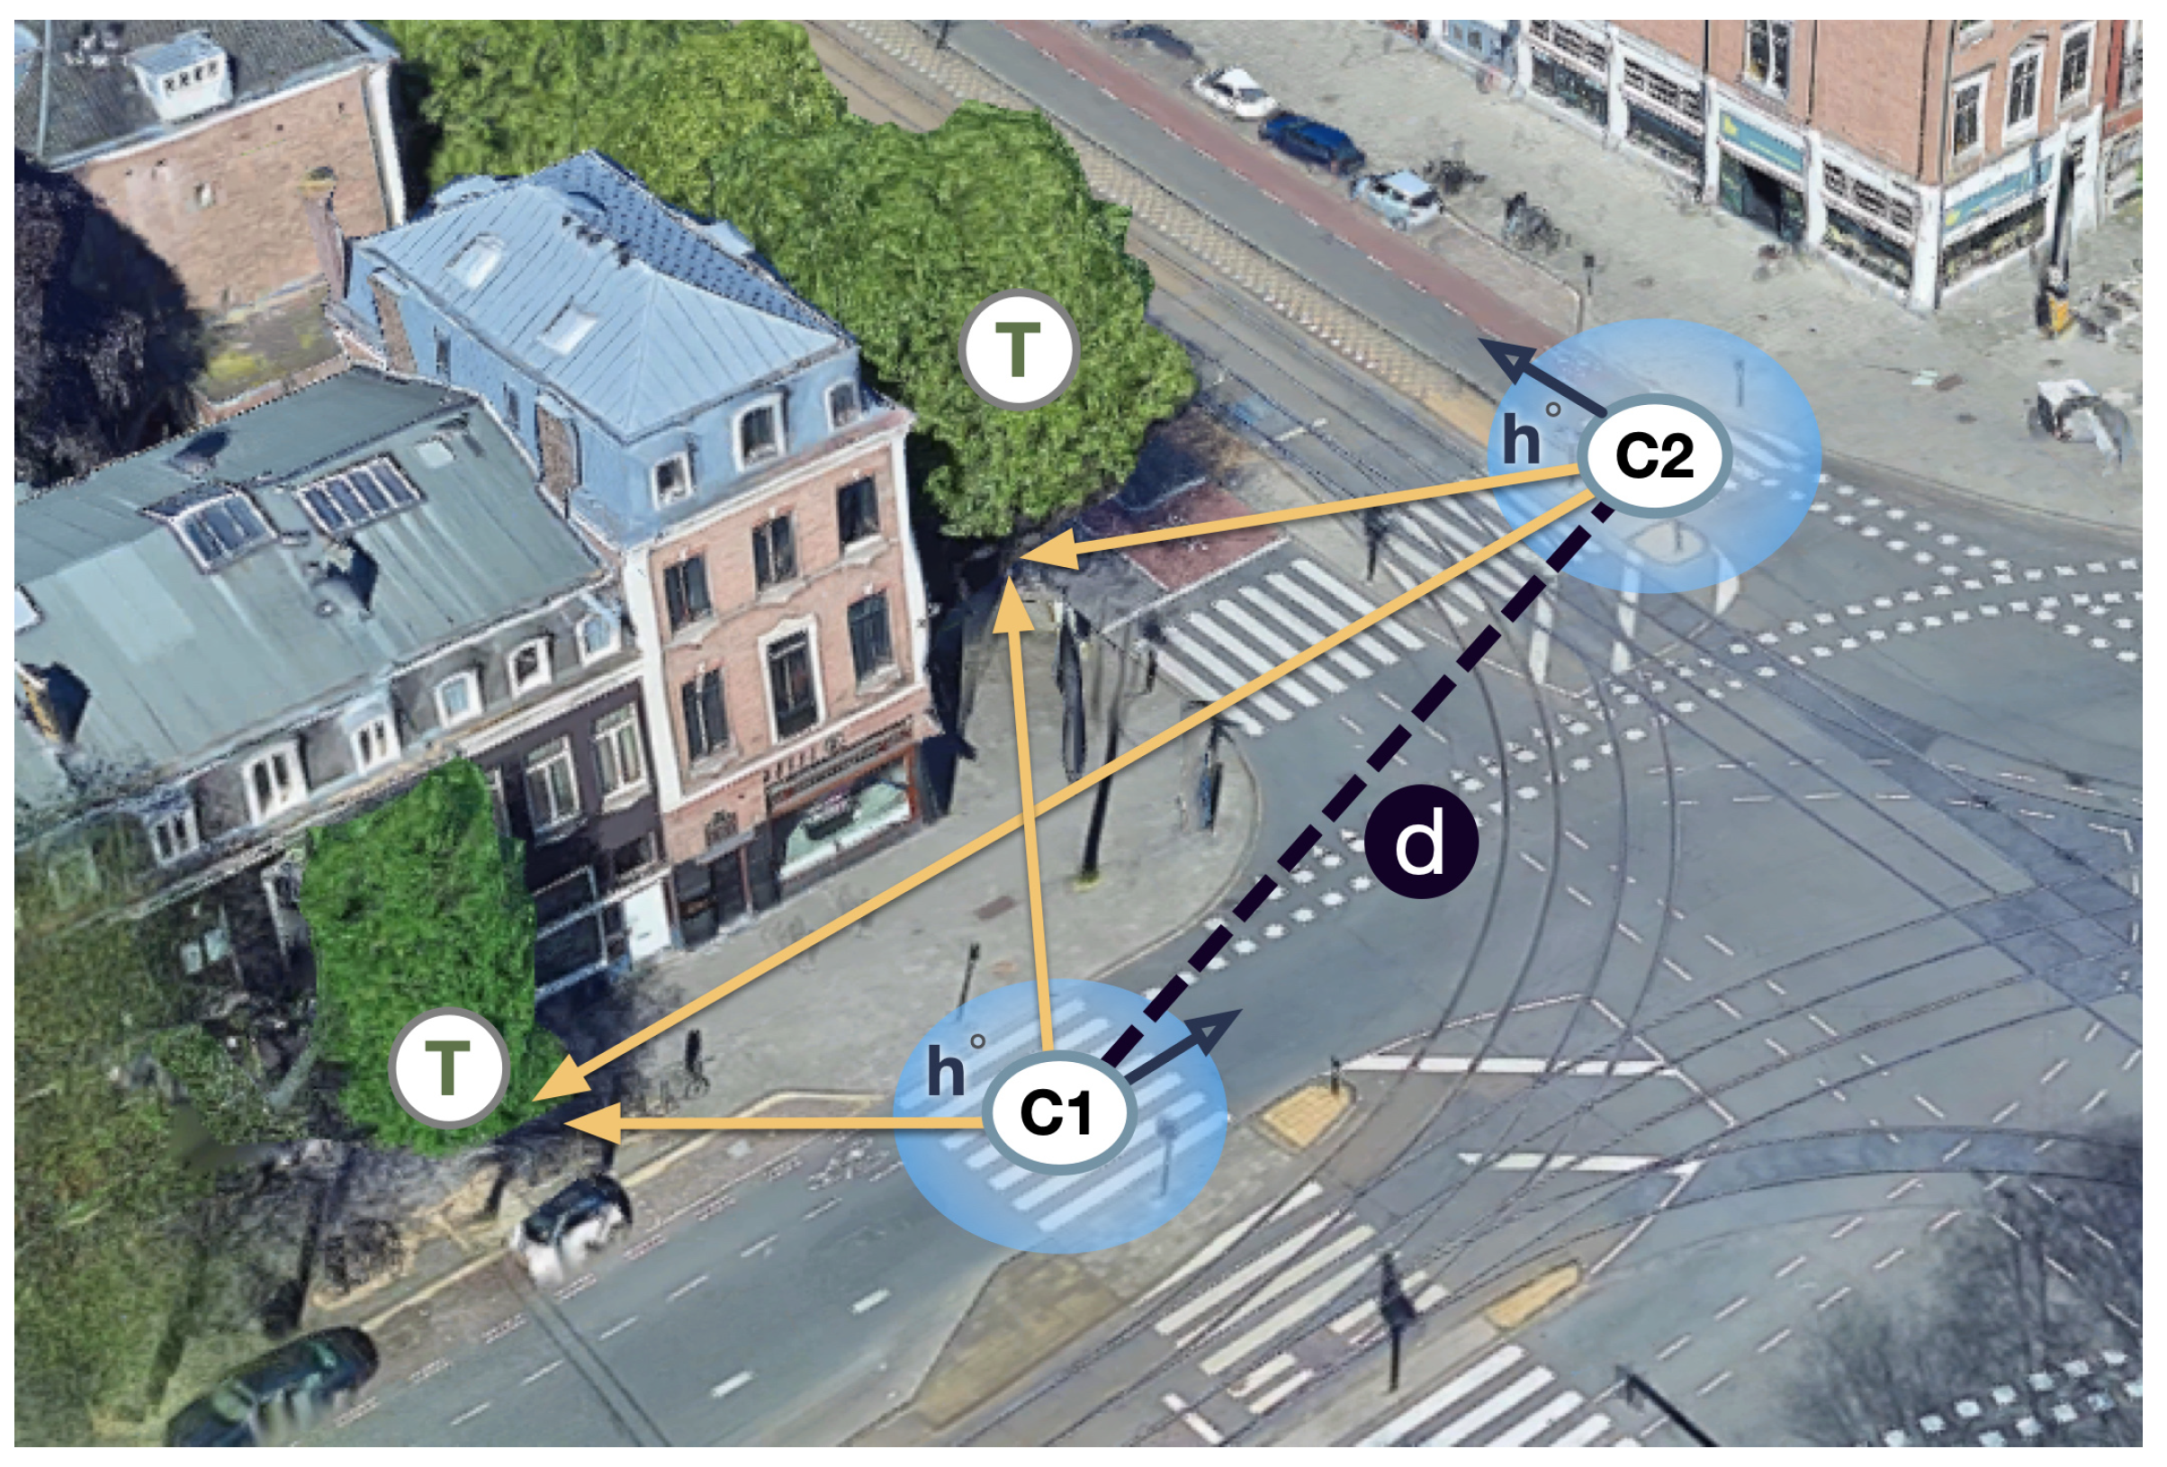
Figure 1. C*, camera with geo-position; T, the tree has its actual geographic coordinates and location within the panorama; h , heading angle inside panorama; d, distance between cameras.
Ijgi 09 00687 g001
Figure 2. The tree instance matching problem (color and letters indicate the matches of identity): each tree is photographed from multiple different views, changing its size, perspective, and background. Note that many trees look alike and are in close proximity (Imagery © 2019 Google).
Ijgi 09 00687 g002
Figure 3. The overall pipeline which encompasses our proposed model. First, a geographic region of area is selected. Then, for that geographic region, the imagery and metadata pertaining to it are downloaded. An object detector detects the objects in this imagery. Our proposed model takes in pairs of image crops of the object and decides if they are matching or not. An inventory is created of the objects, with a pool of image crops from different views for each instance.
Ijgi 09 00687 g003
Figure 4. Diagram showing the overall network architecture. The Feature Subnetwork receives an image with three extra channels ( { [ C l a t * , C l n g * , h ] } ) as input (shown as three additional matrix layers in grey). In general, the feature subnetworks could be of any state-of-the-art architecture but preliminary tests showed that ResNet consistently yielded best performance. Generated feature embeddings are passed to the decision networks that classify whether two image patches are matching or not.
Ijgi 09 00687 g004
Figure 5. Four consecutive panoramas from the Pasadena dataset (Imagery © 2019 Google).
Ijgi 09 00687 g005
Figure 6. Consecutive frames of two example scenes of the Mapillary dataset.
Ijgi 09 00687 g006aIjgi 09 00687 g006b
Figure 7. A single instance of a traffic sign from the Mapillary dataset acquired from different sensors, angles, and dates.
Ijgi 09 00687 g007
Figure 8. Pairs of Pasadena candidate matches (top and bottom rows) that are correctly classified using our method (Ours) in comparison to the appearance-based only method (w/o Geometry). The first three columns show difficult situations correctly resolved as matches by Ours despite significant change in perspective, illumination, and background. Columns 4–6 (from left) show similar looking, neighboring trees correctly classified as not matching by Ours. (Imagery © 2019 Google).
Ijgi 09 00687 g008
Figure 9. Pairs of Mapillary candidate matches (top and bottom rows) that are correctly classified using our method (Ours) in comparison to the appearance-based only method (w/o Geometry). The first three columns show difficult situations correctly resolved as matches by Ours despite significant change in perspective, illumination, and background. Columns 4–6 (from left) show similar looking, neighboring signs correctly classified as not matching by Ours.
Ijgi 09 00687 g009
Table 1. Matching accuracy (in %) and standard deviation matching results for w/o Geometry, w/ Geometry, and Ours on the two datasets and losses. The best results are marked bold.
LossPasadenaMapillary
w/o GeometryContrastive 78.0 ± 0.611 93.6 ± 0.04
Metric 80.1 ± 0.5 67.0 ± 0.73
TripleNet 72.2 ± 0.67 66.1 ± 0.94
w/ GeometryContrastive 79.6 ± 0.61 94.4 ± 0.46
Metric 81.1 ± 0.62 67.6 ± 0.52
TripleNet 75.6 ± 0.812 67.1 ± 1.1
OursContrastive 81 . 75 ± 0 . 82 96 . 5 ± 0 . 33
Metric 82 . 3 ± 0 . 22 69 . 3 ± 0 . 96
Publisher’s Note: MDPI stays neutral with regard to jurisdictional claims in published maps and institutional affiliations.