Flow Modeling and Rendering to Support 3D River Shipping Based on Cross-Sectional Observation Data


Abstract
:1. Introduction
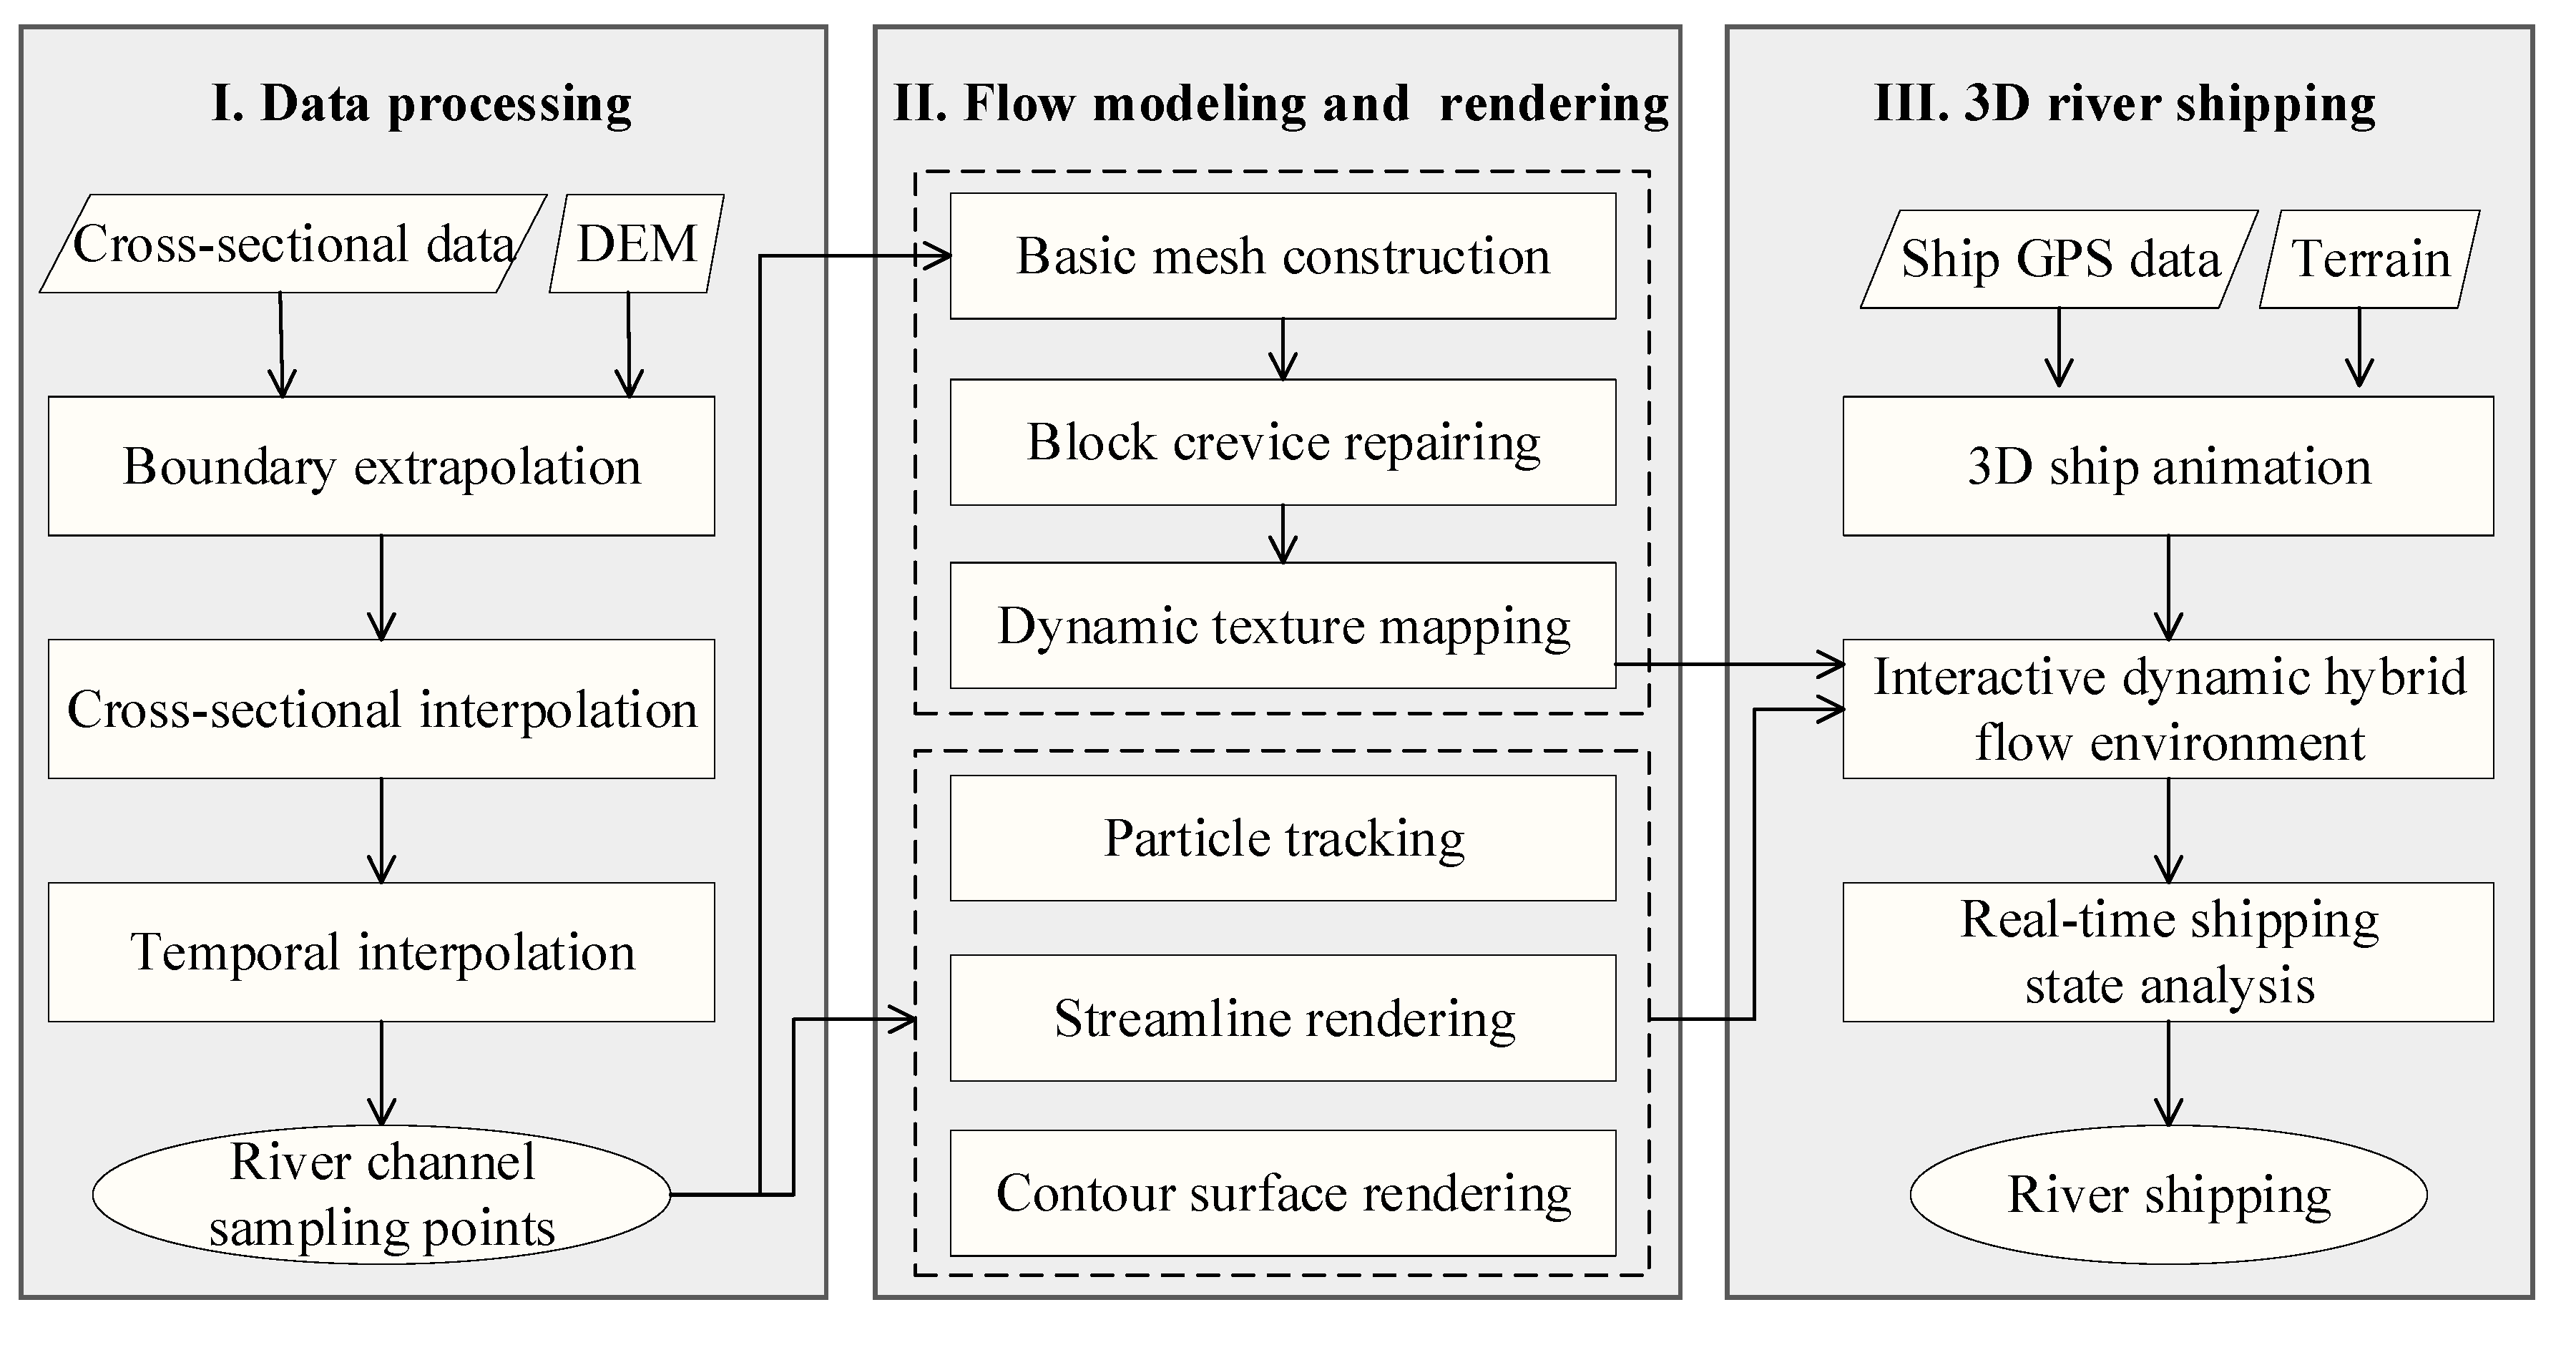
2. System Framework
3. Methodology
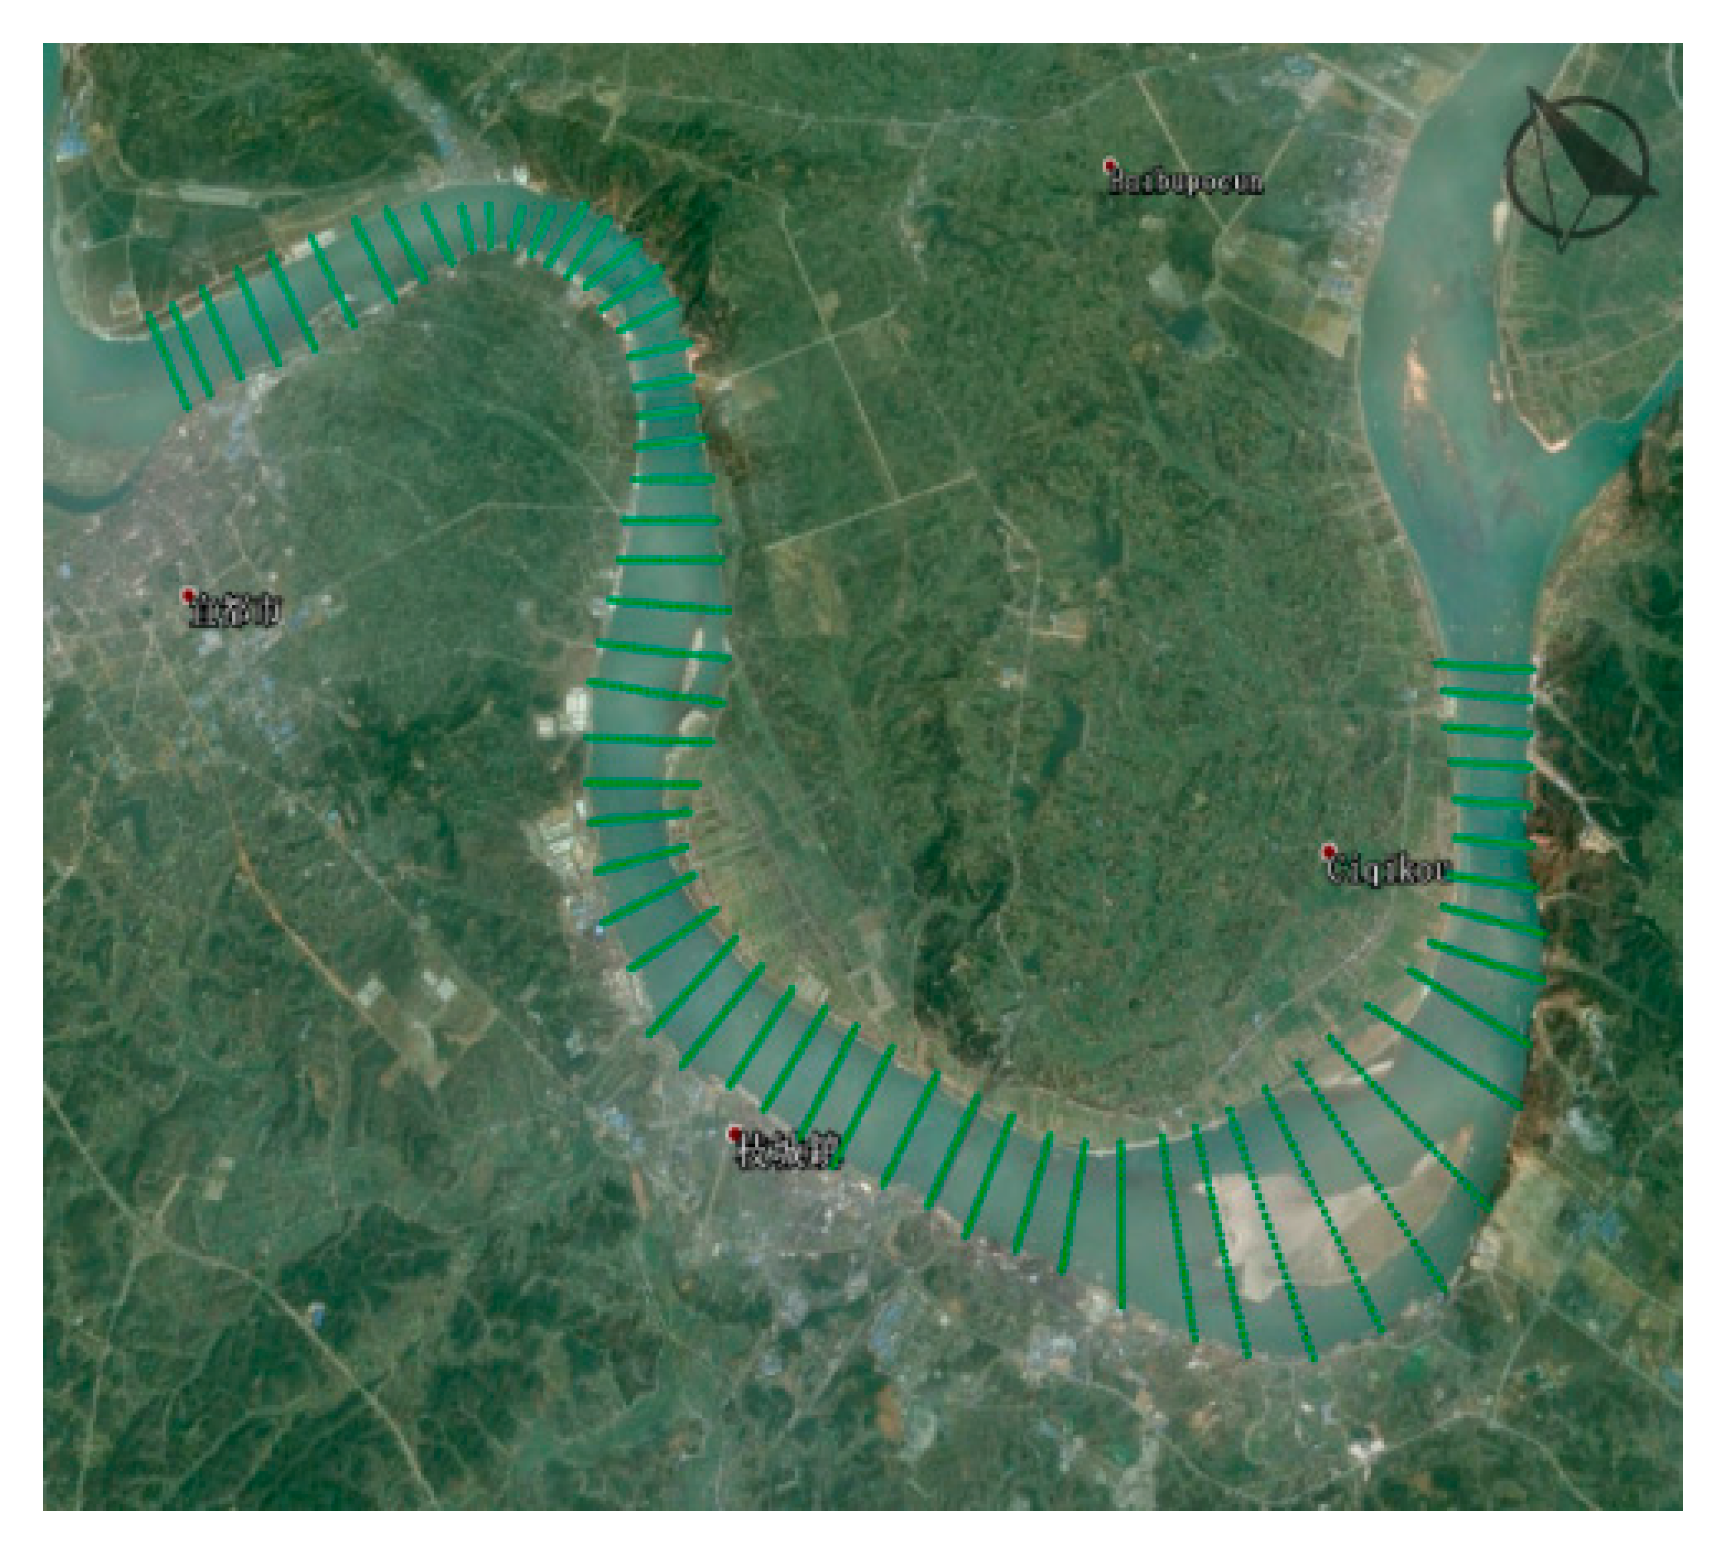
3.1. Study Area and Data
3.2. Data Processing
3.2.1. Boundary Extrapolation
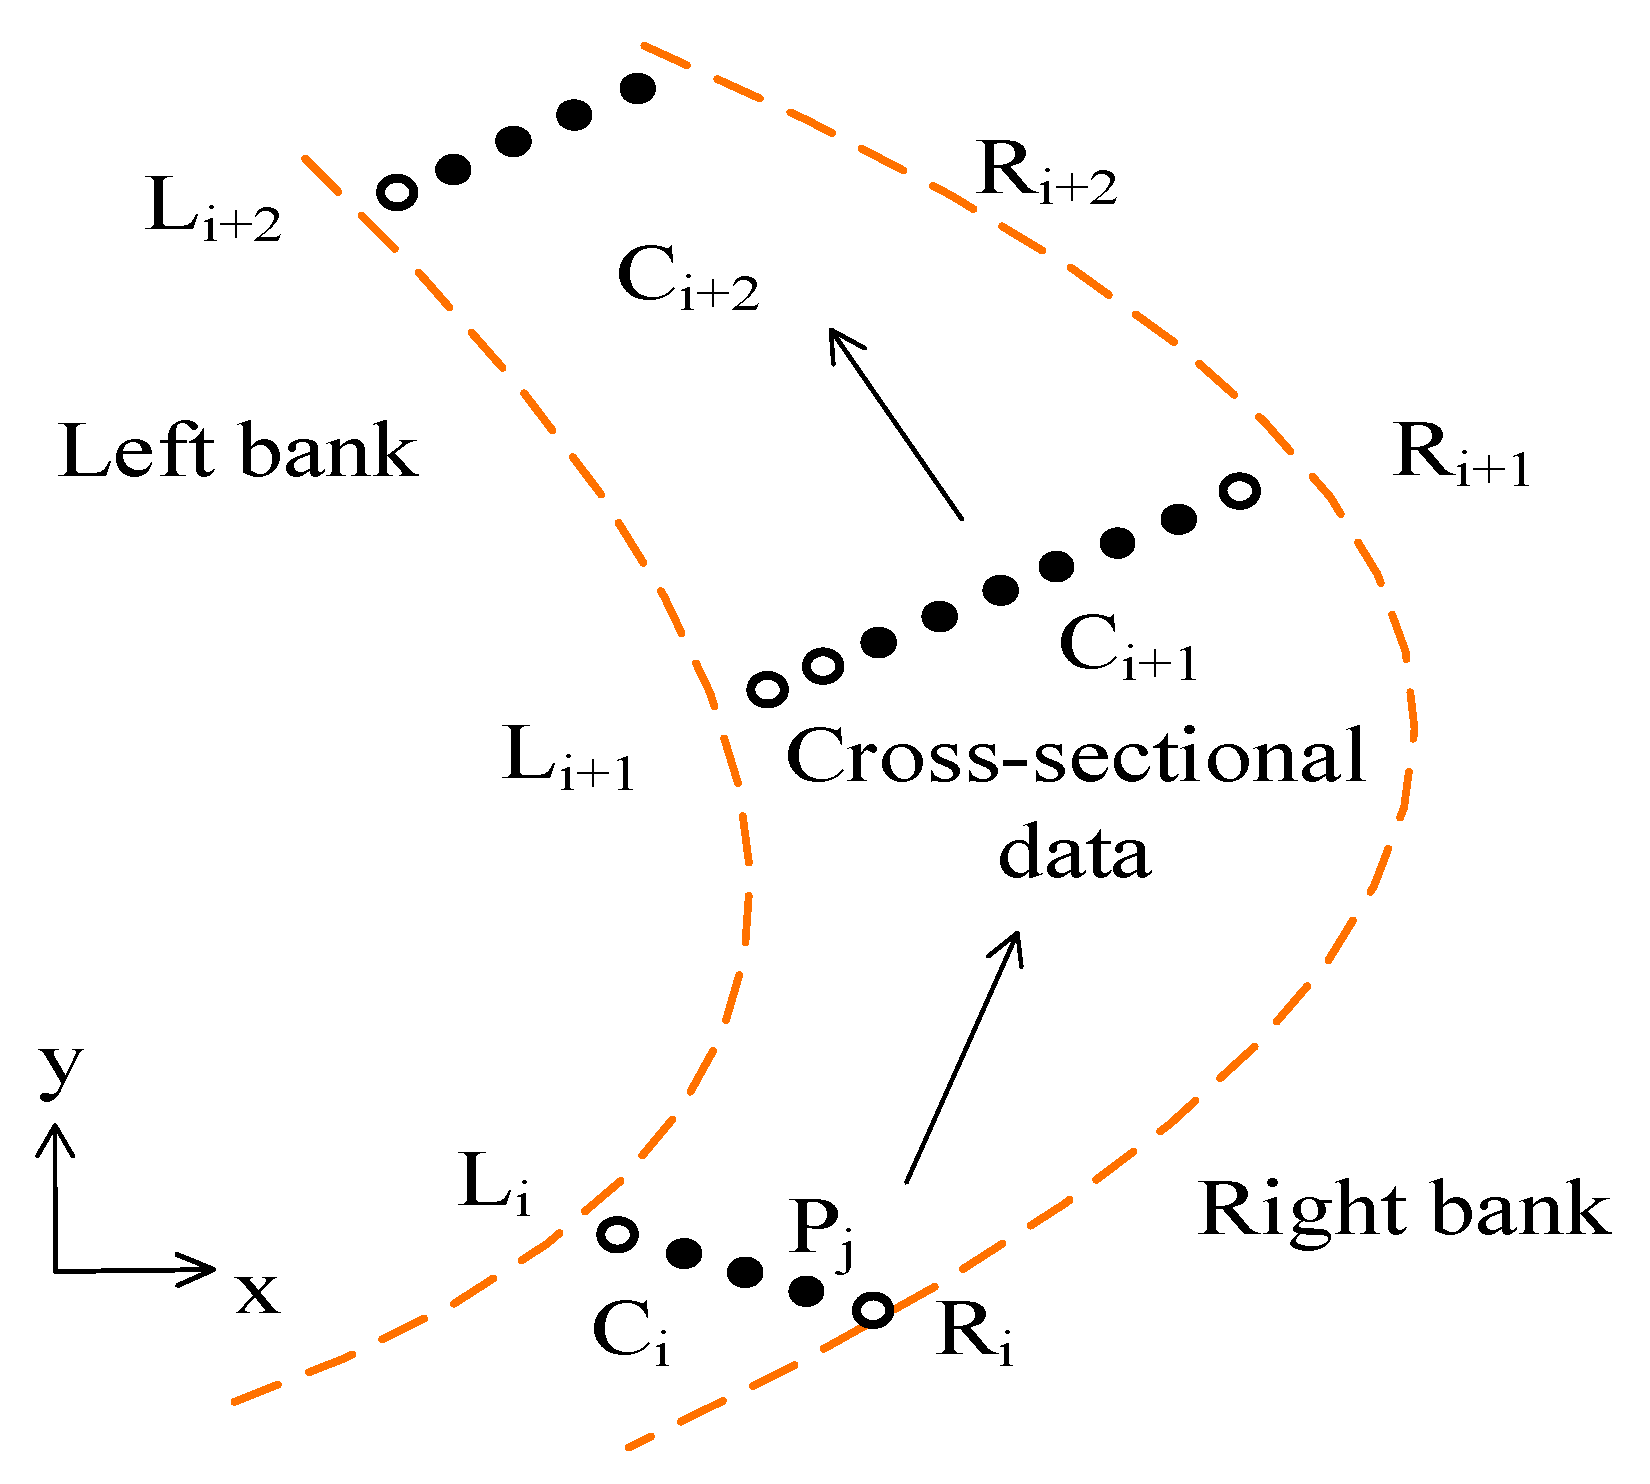
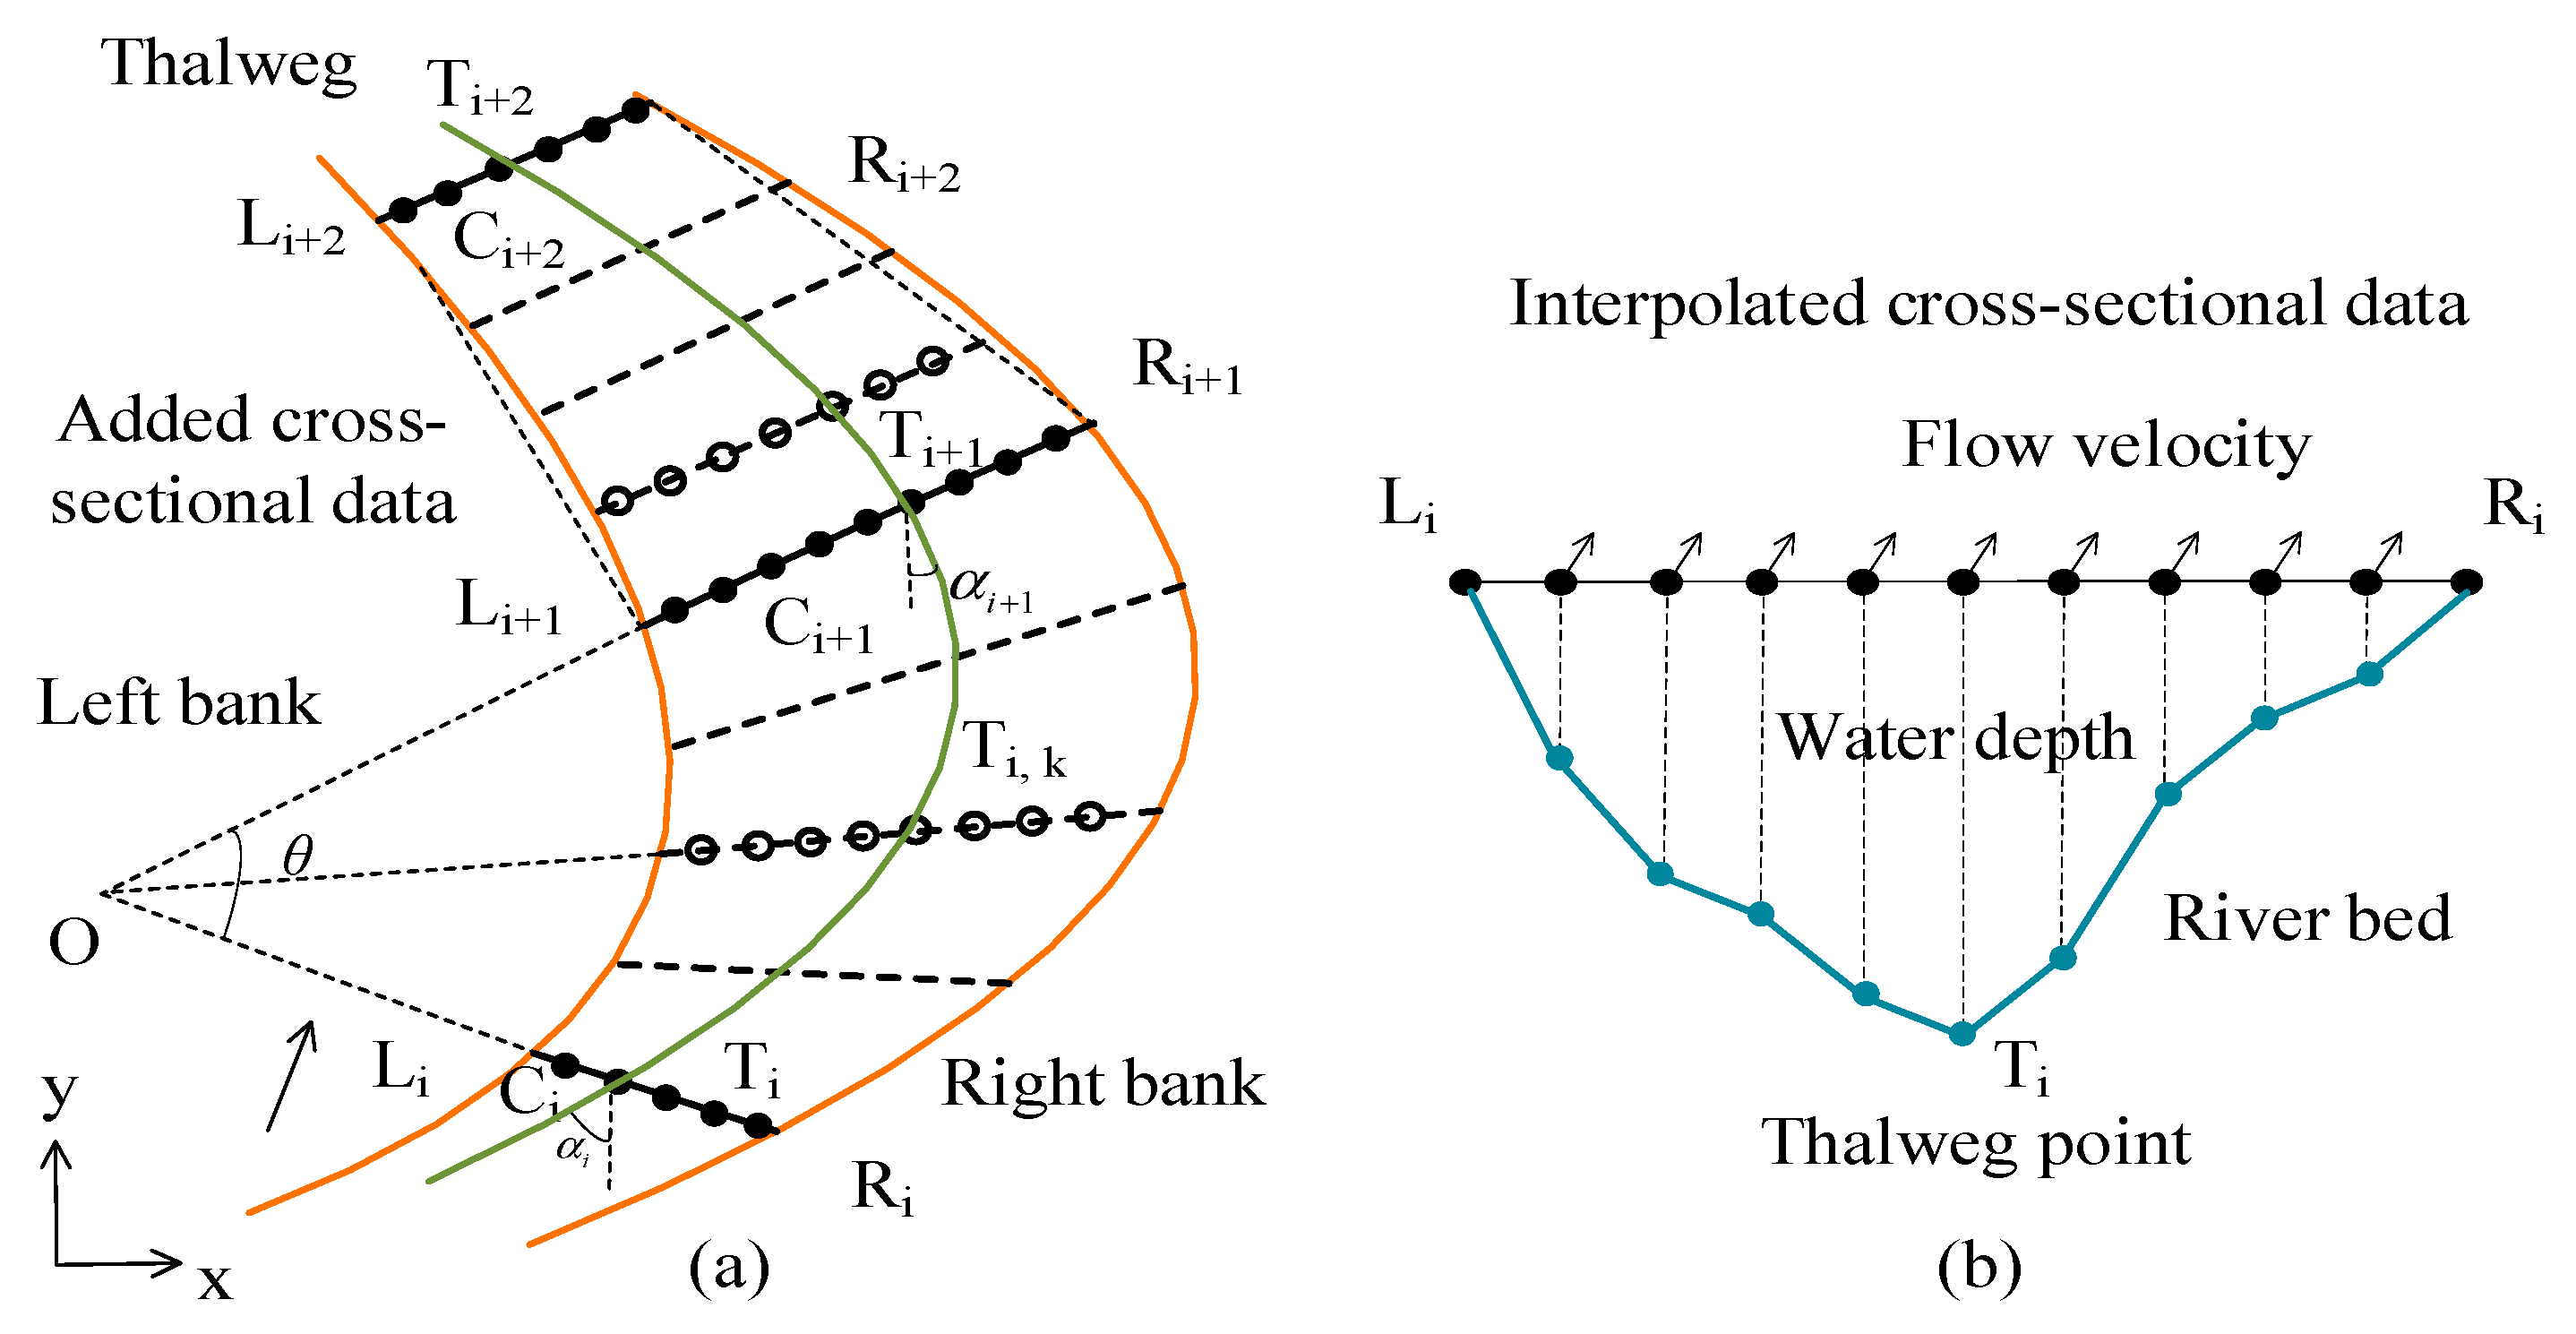
3.2.2. Cross-Sectional Interpolation
3.2.3. Temporal Interpolation
3.3. Flow Simulation
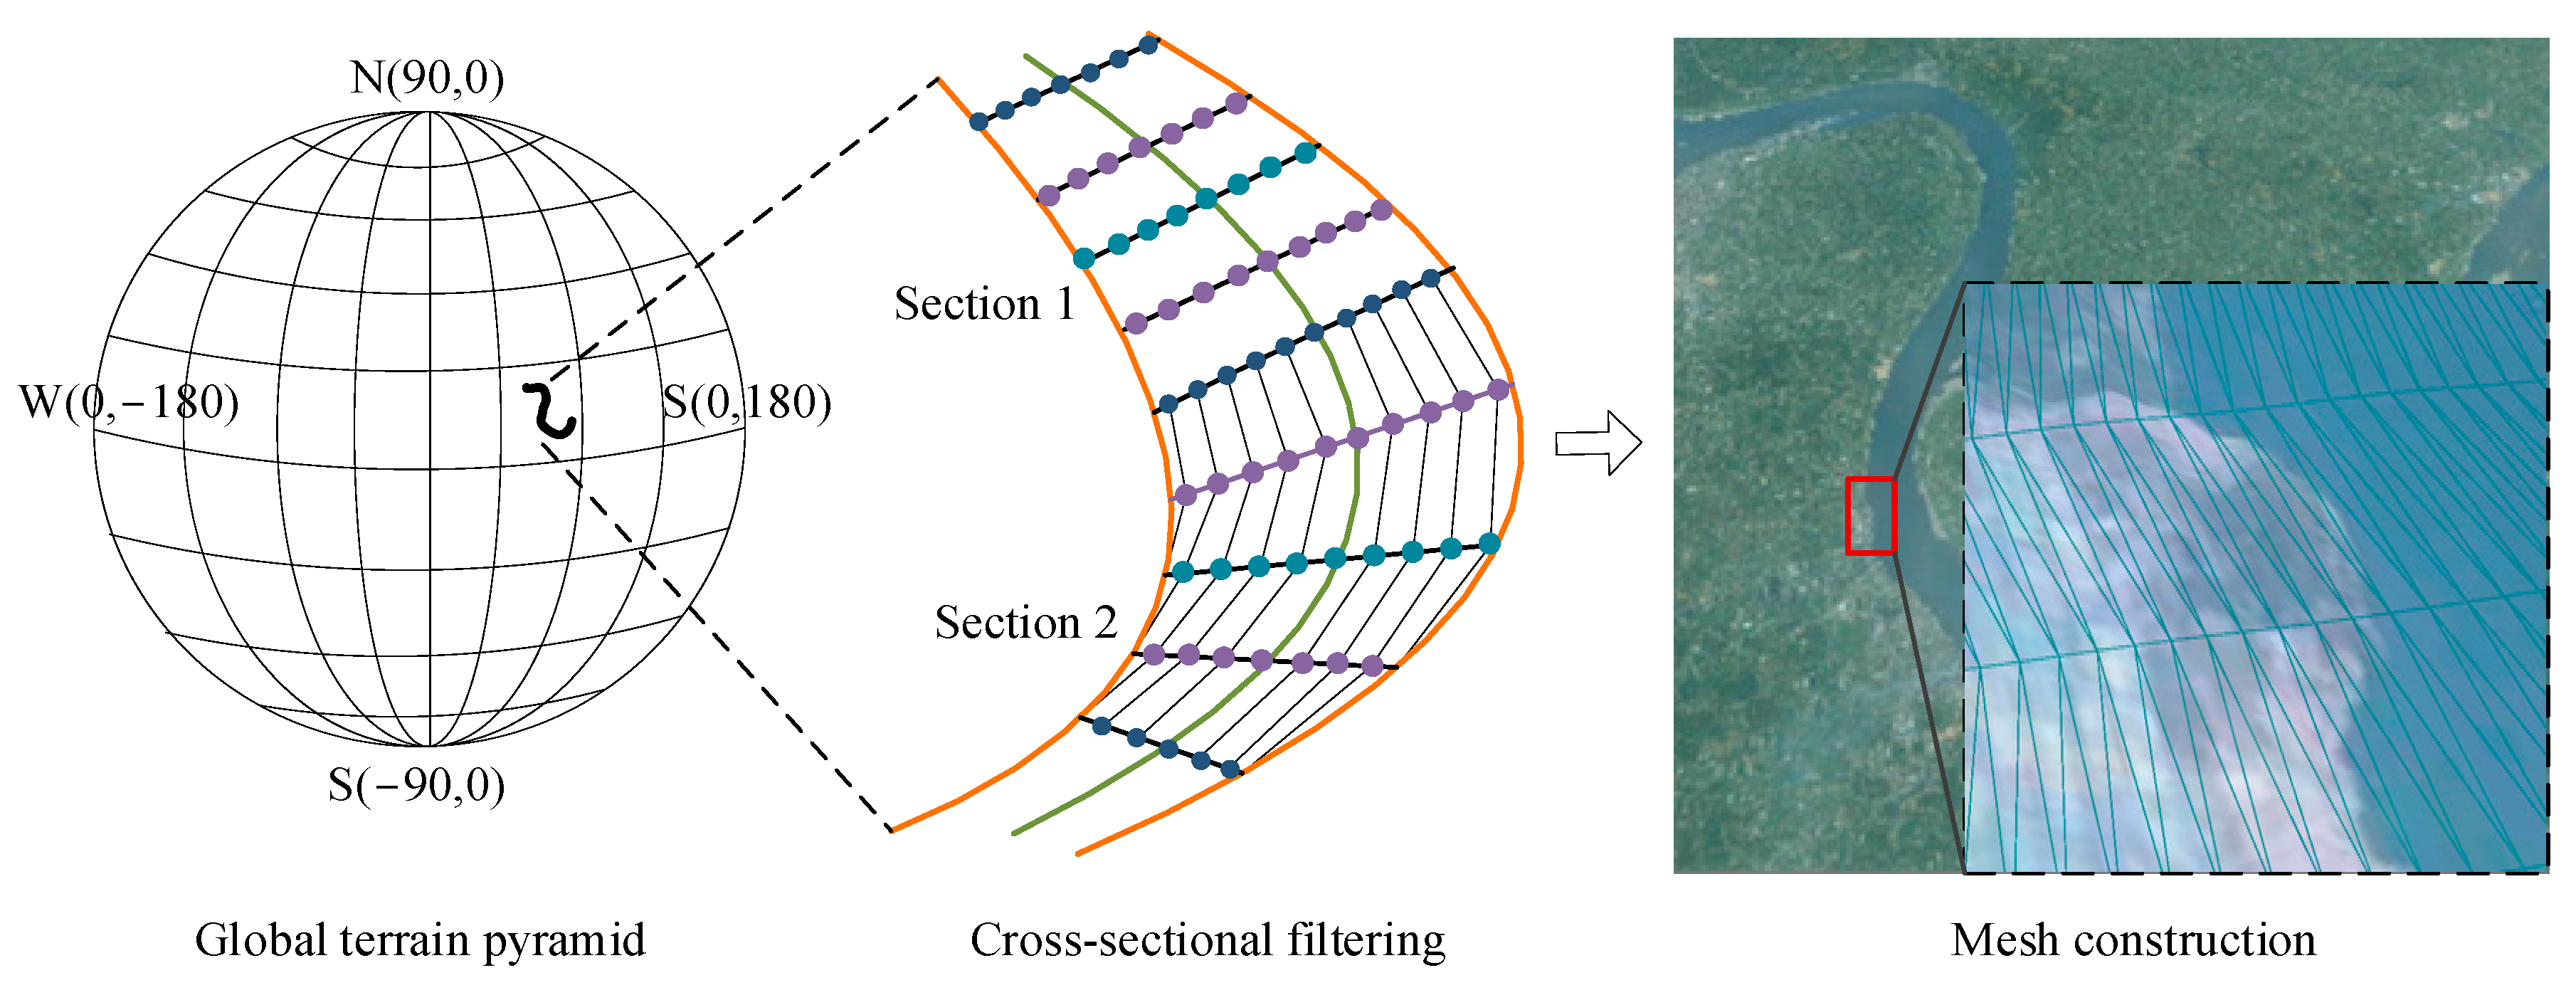
3.3.1. Basic Mesh Construction
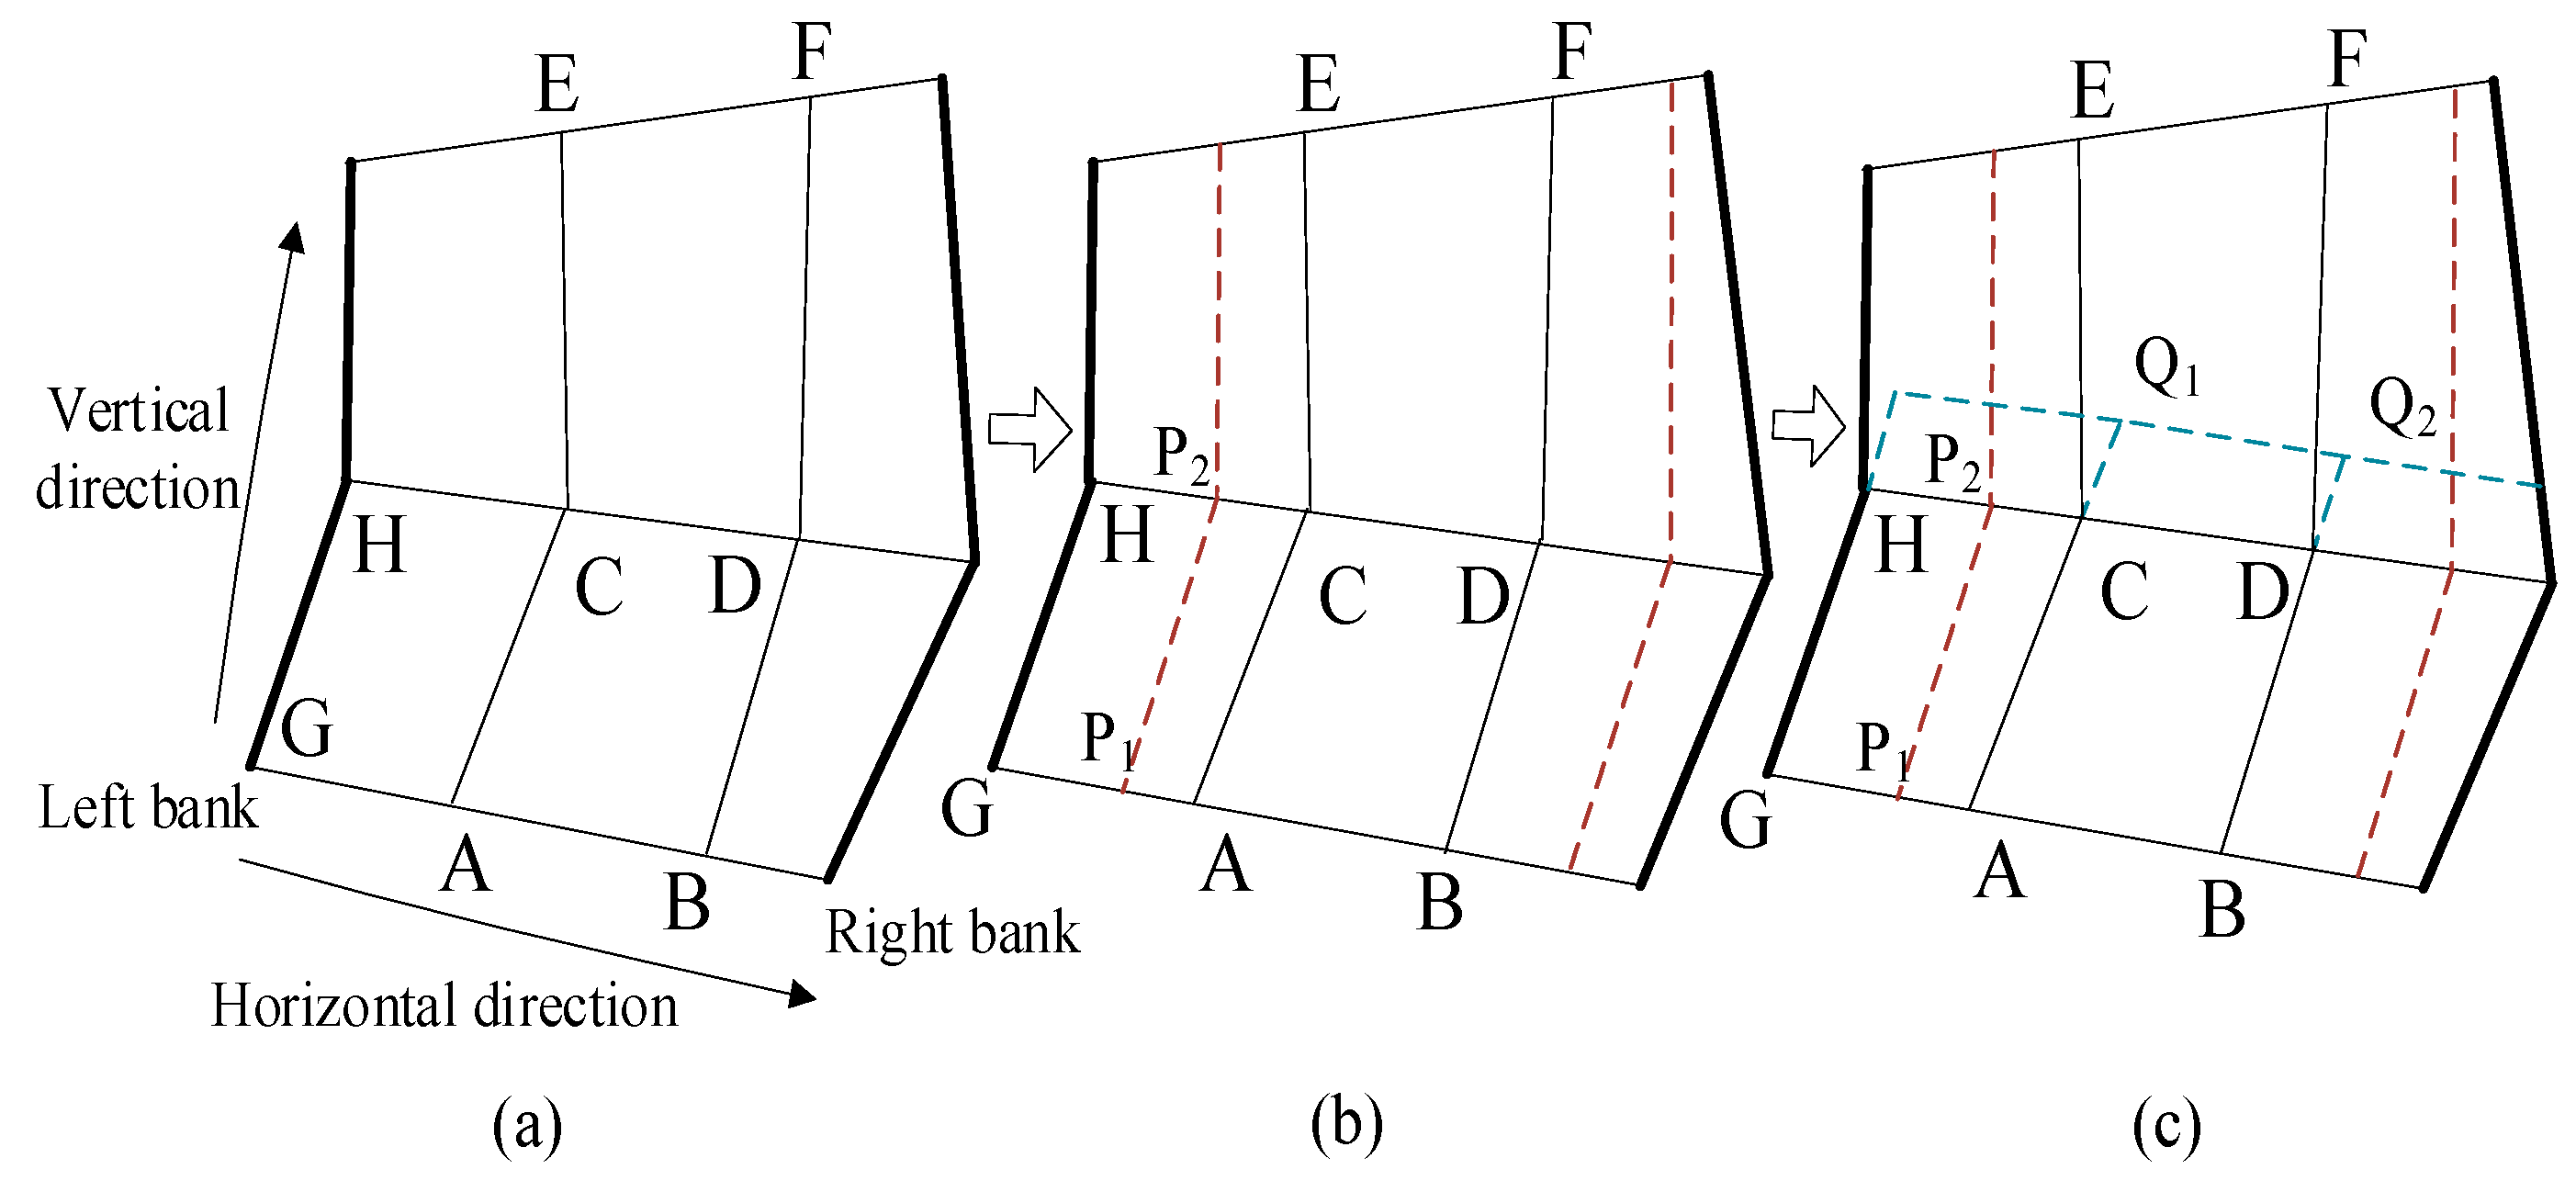
3.3.2. Block Crevice Repairing
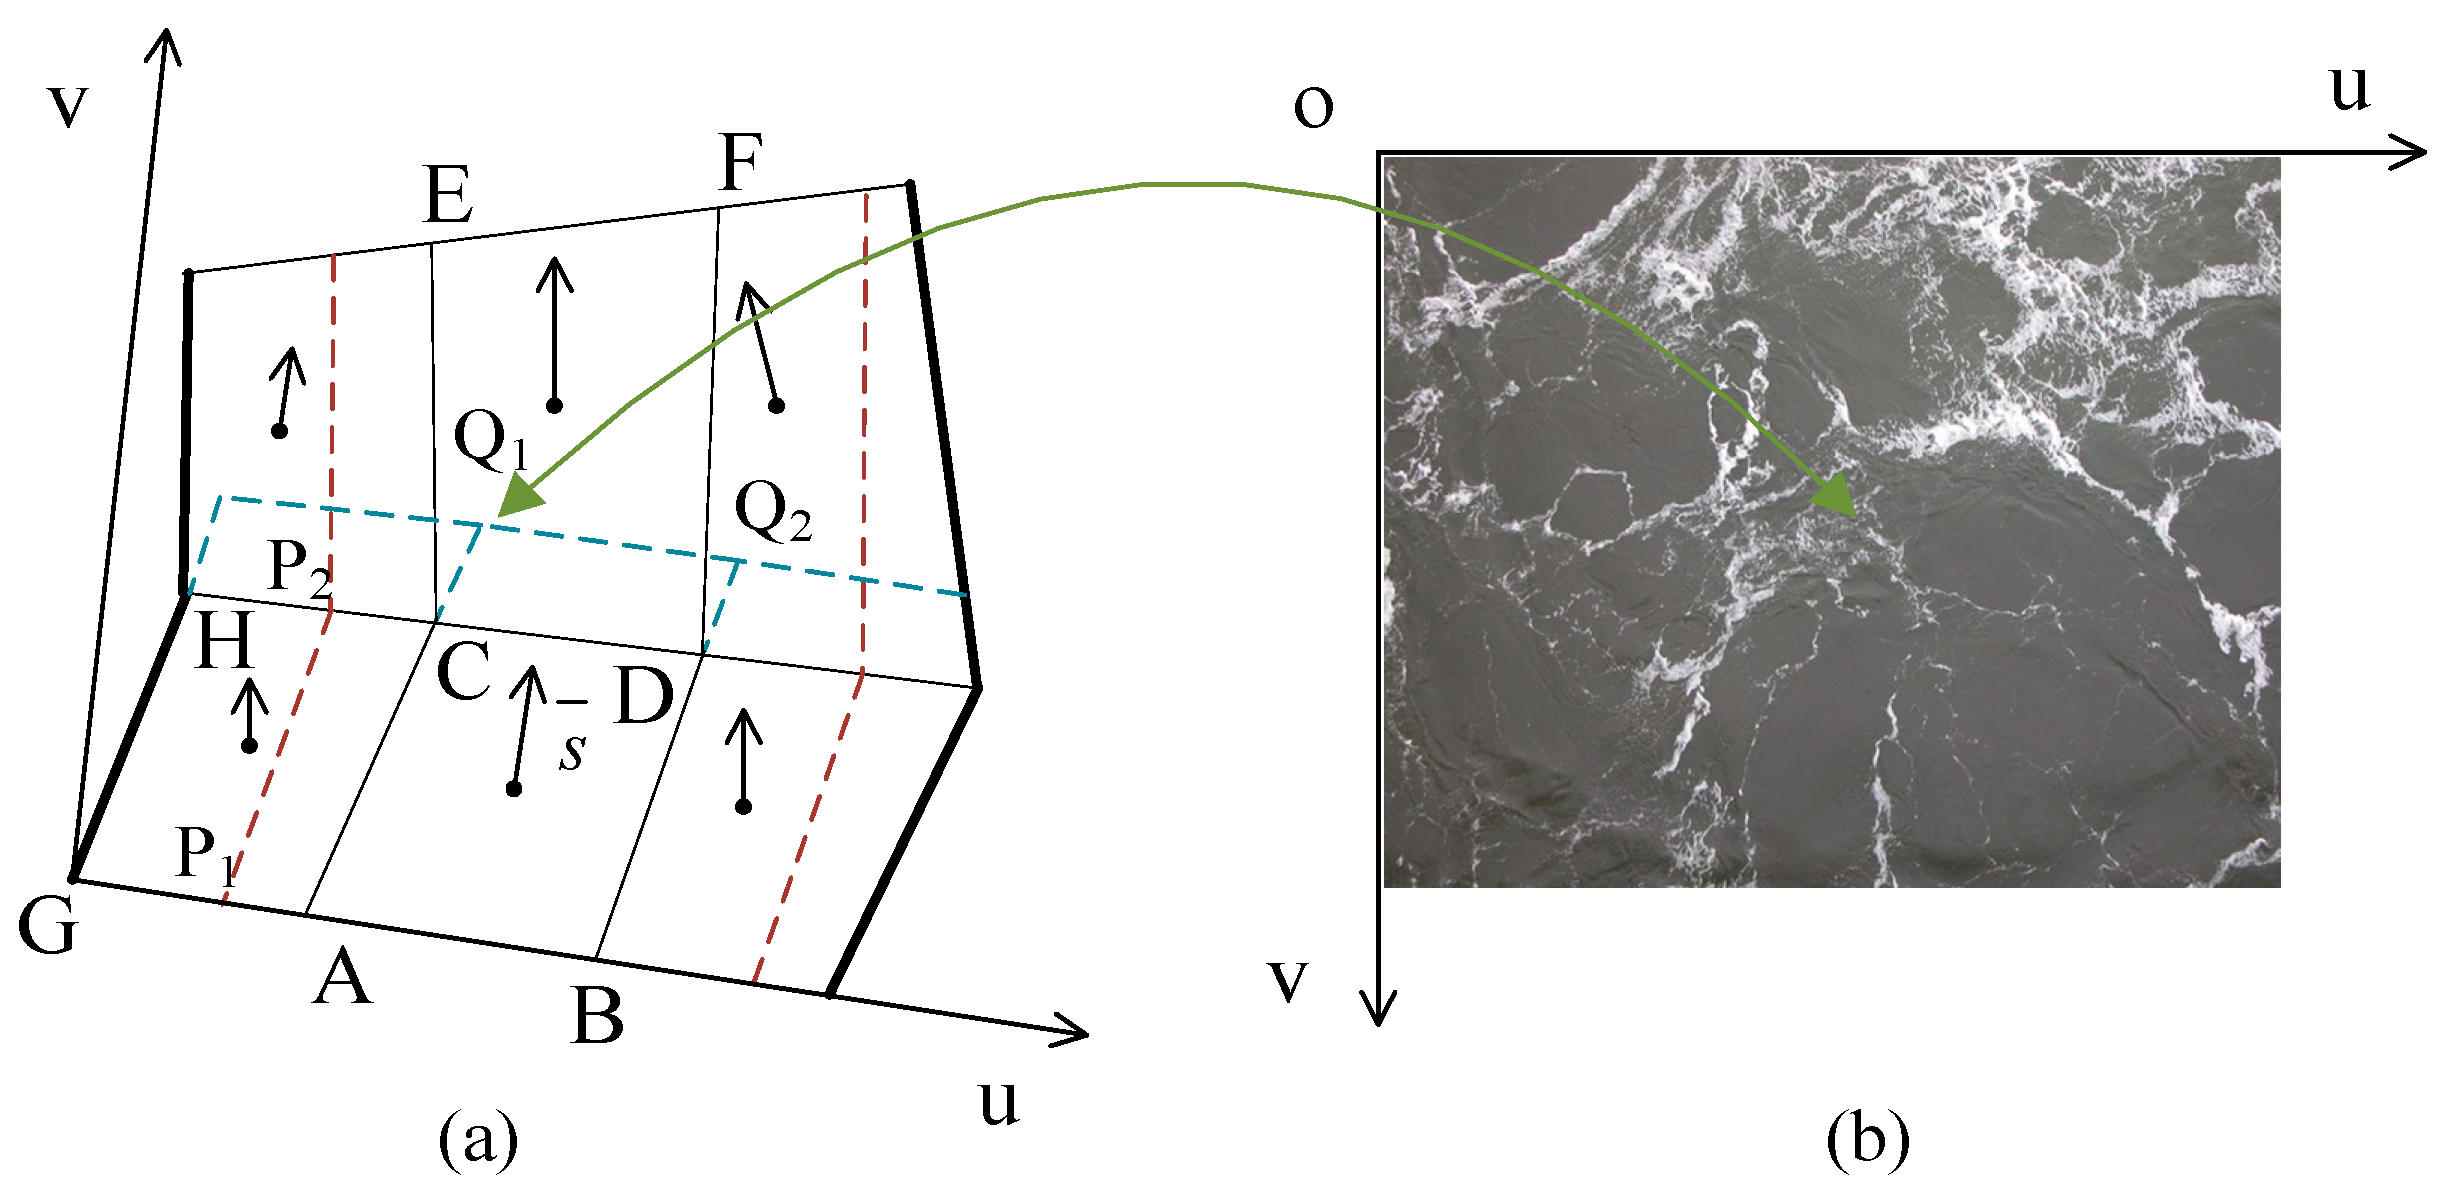
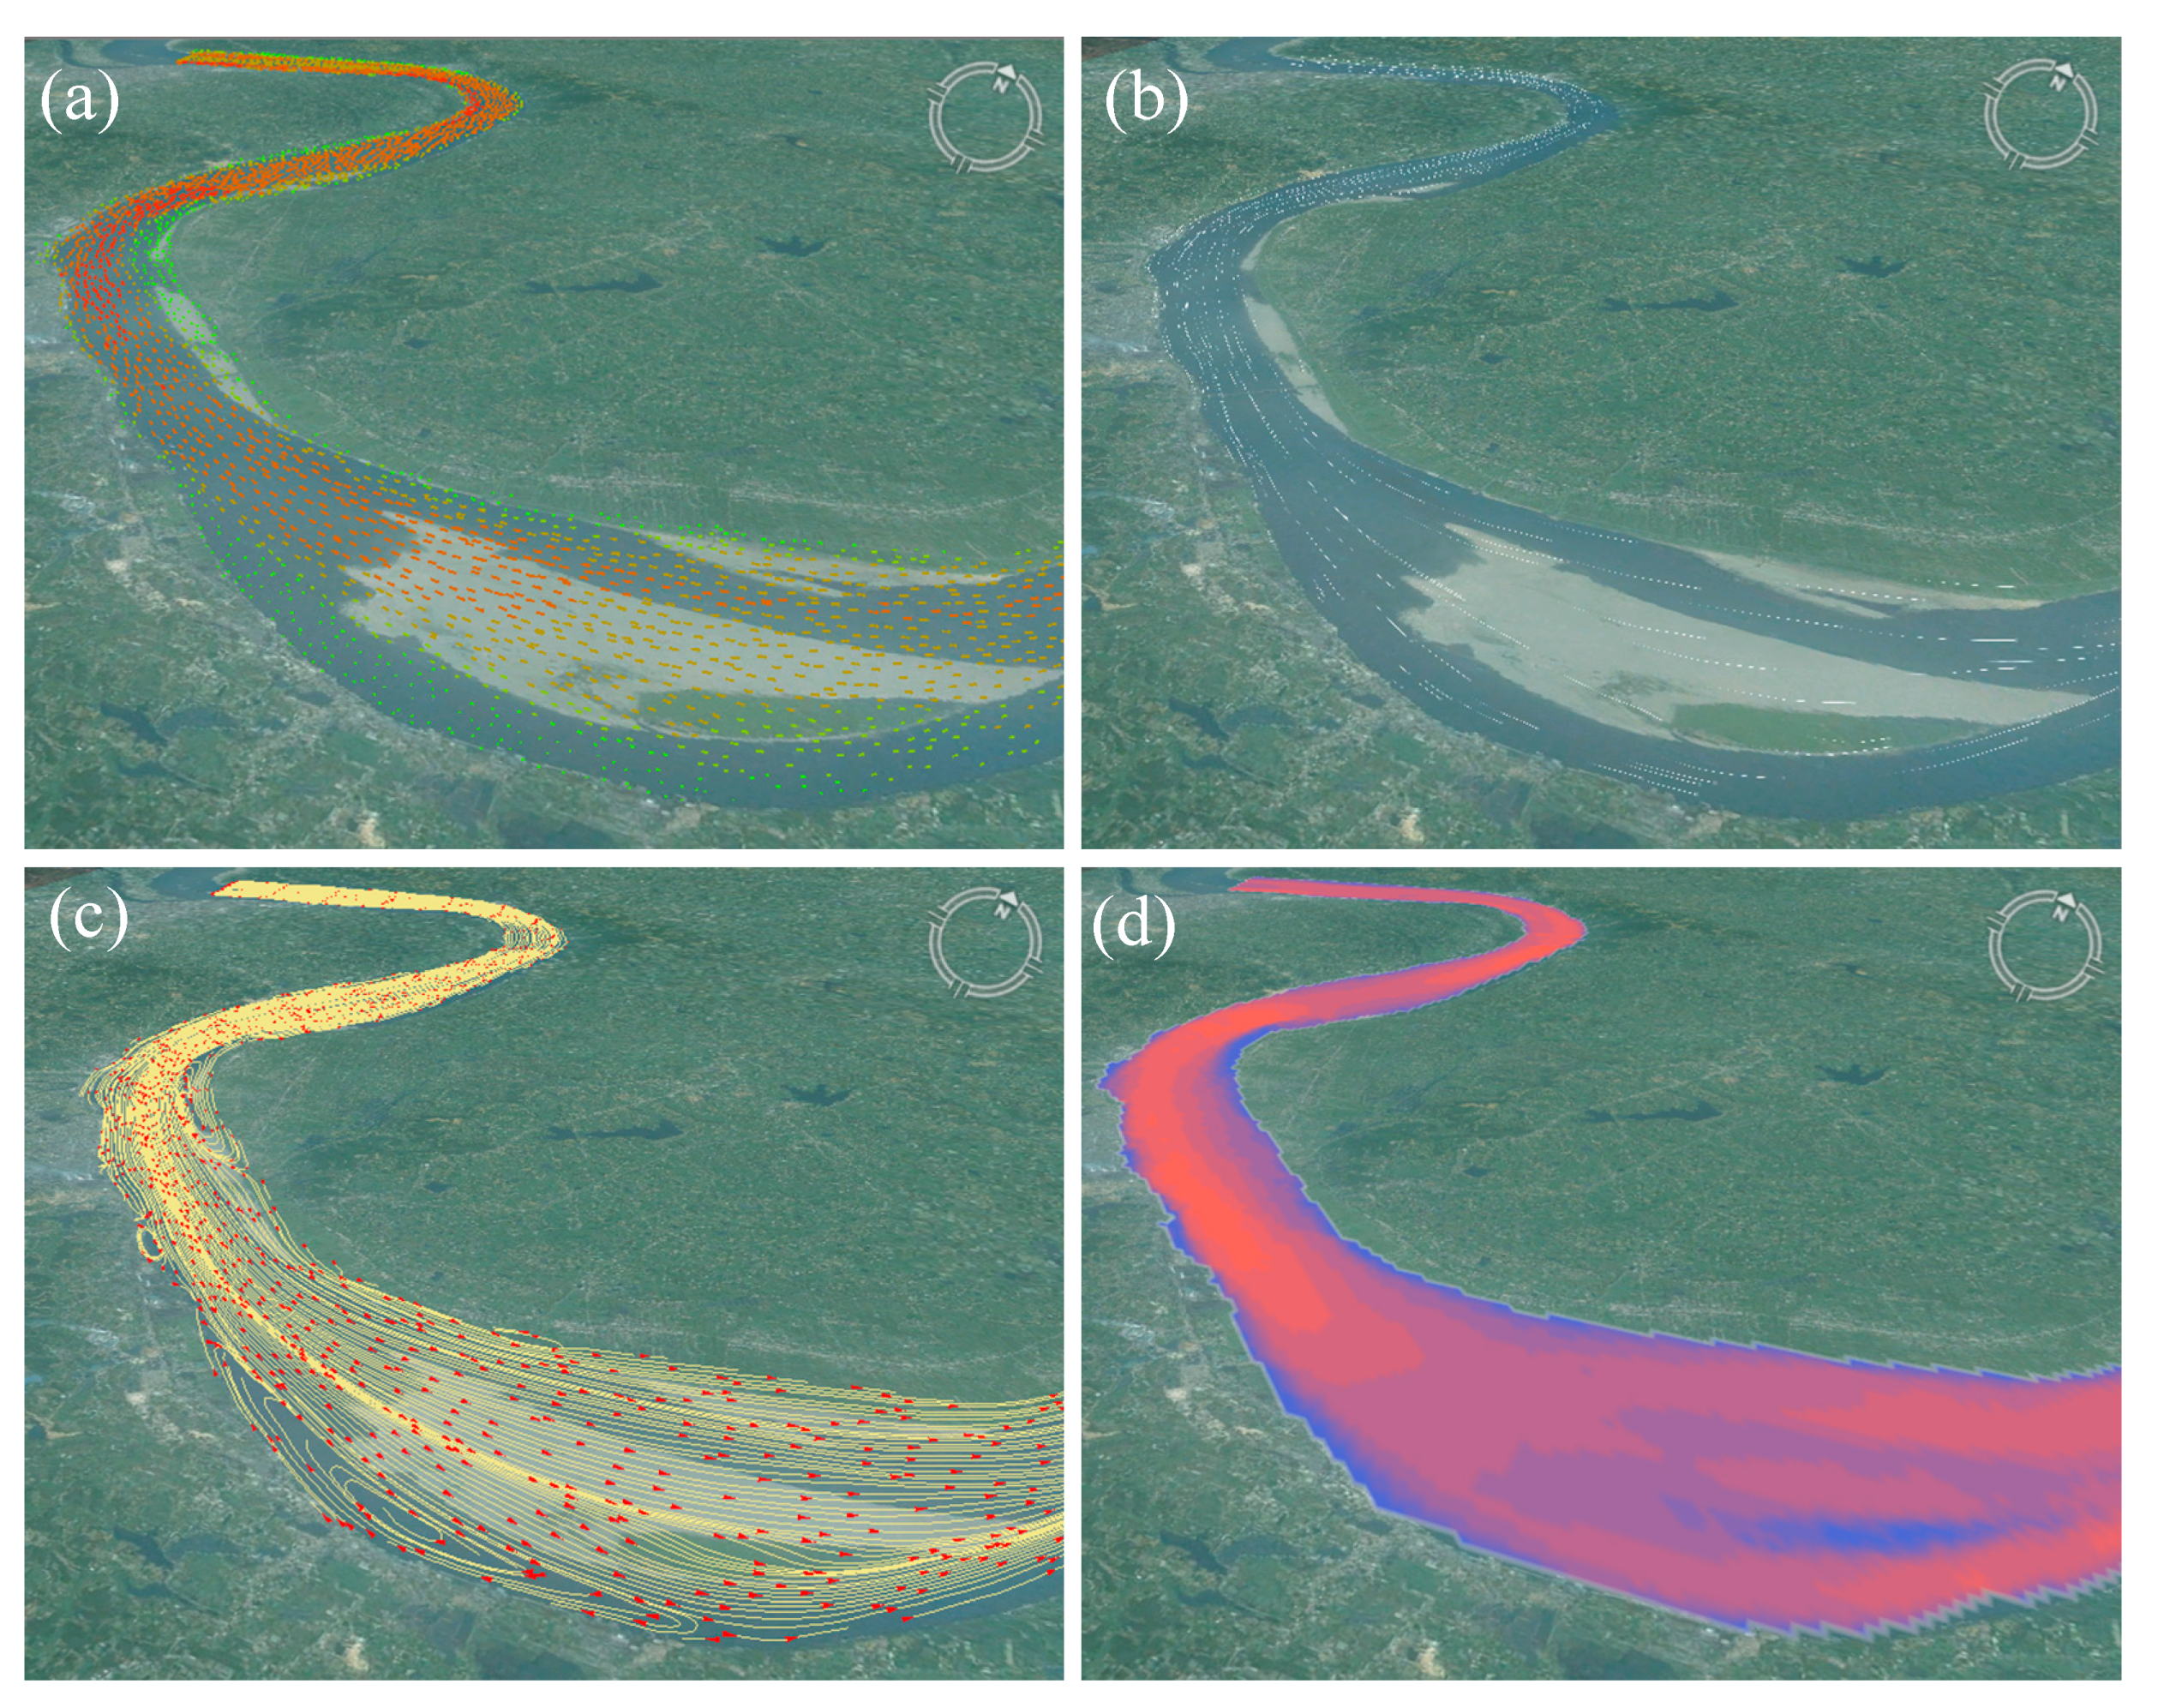
3.3.3. Dynamic Texture Mapping
3.4. Flow Visualization
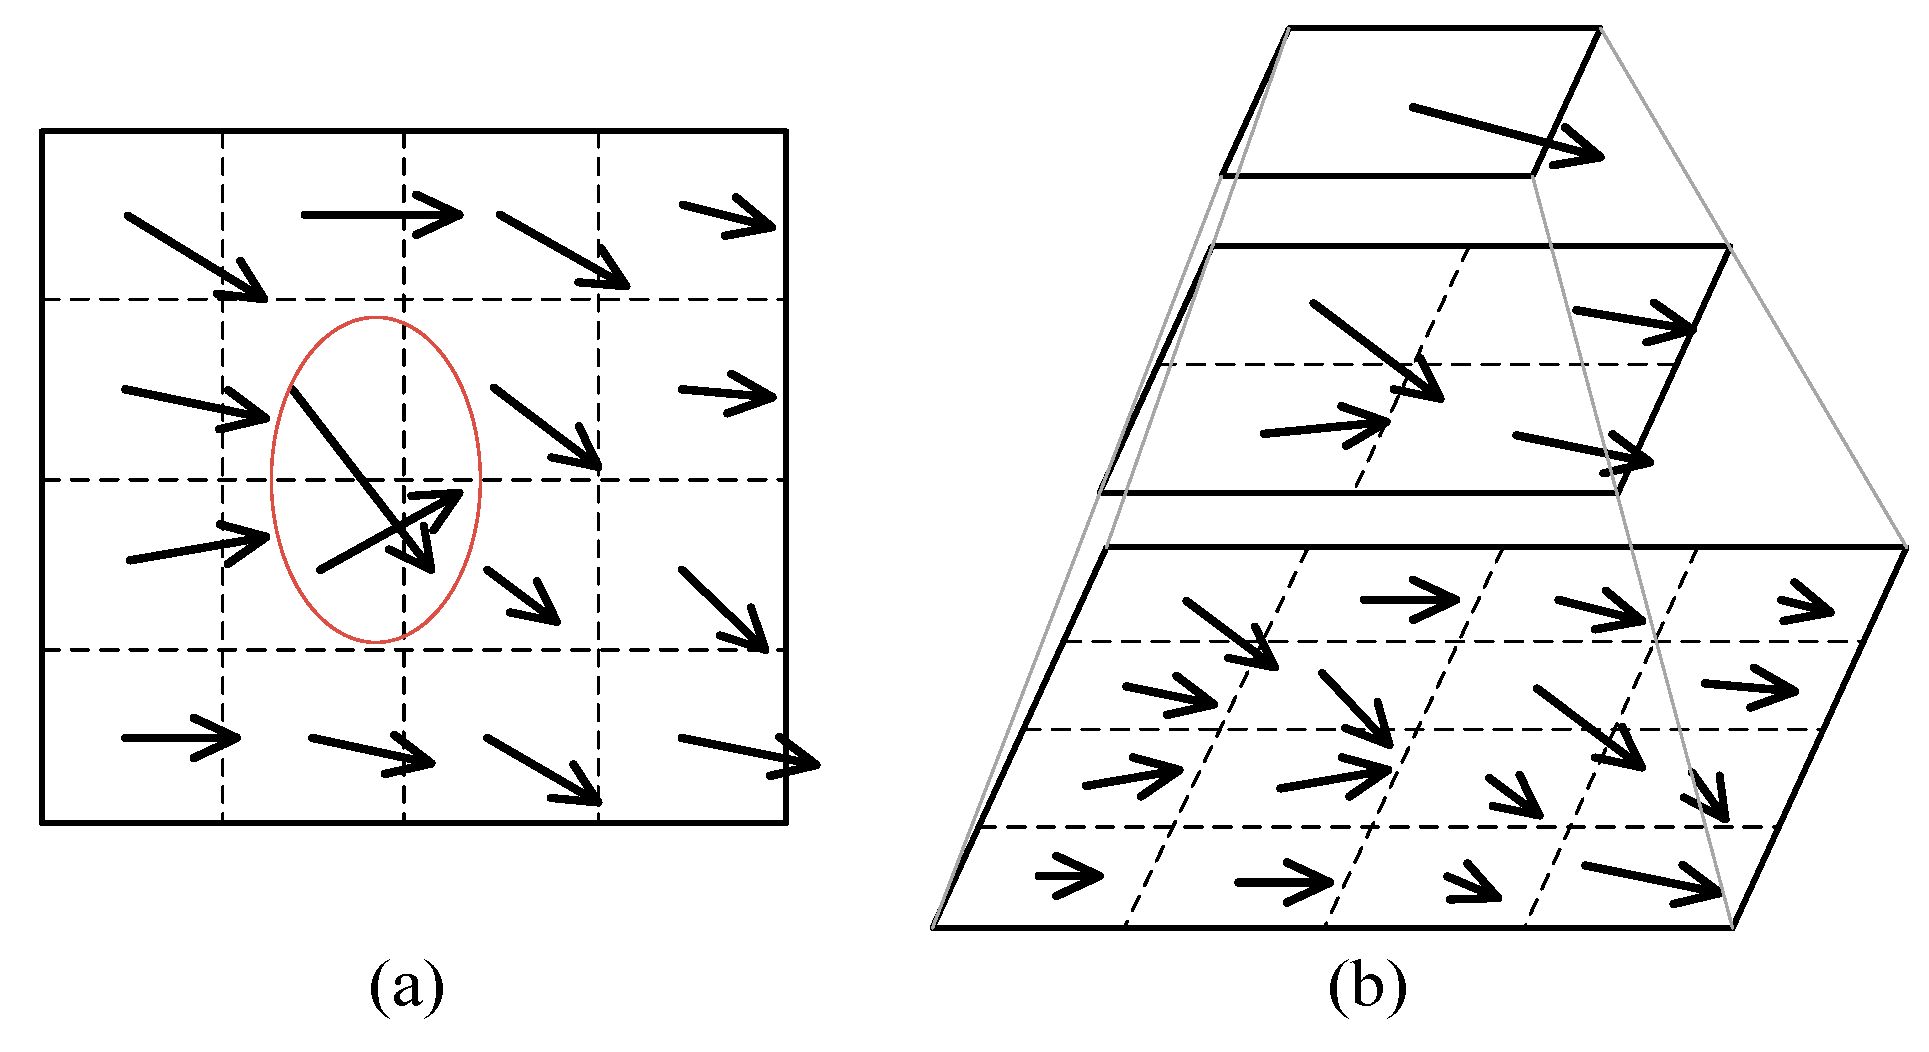
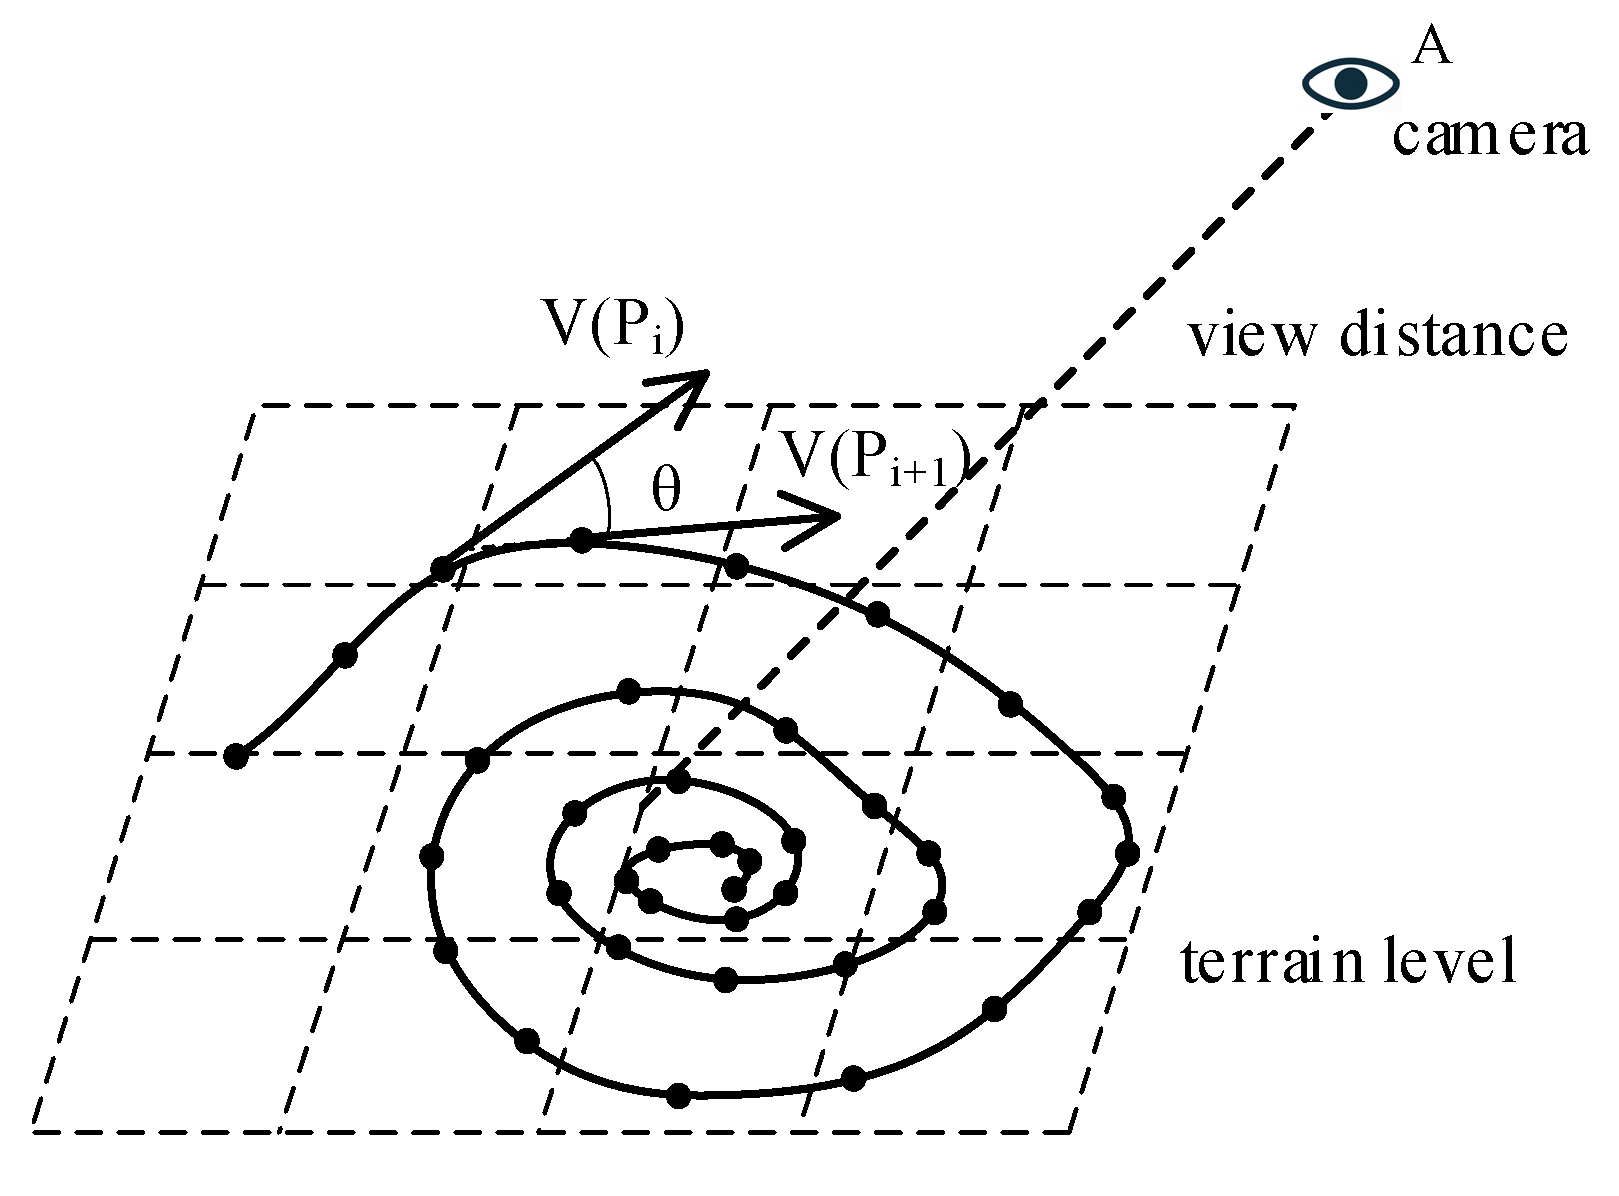
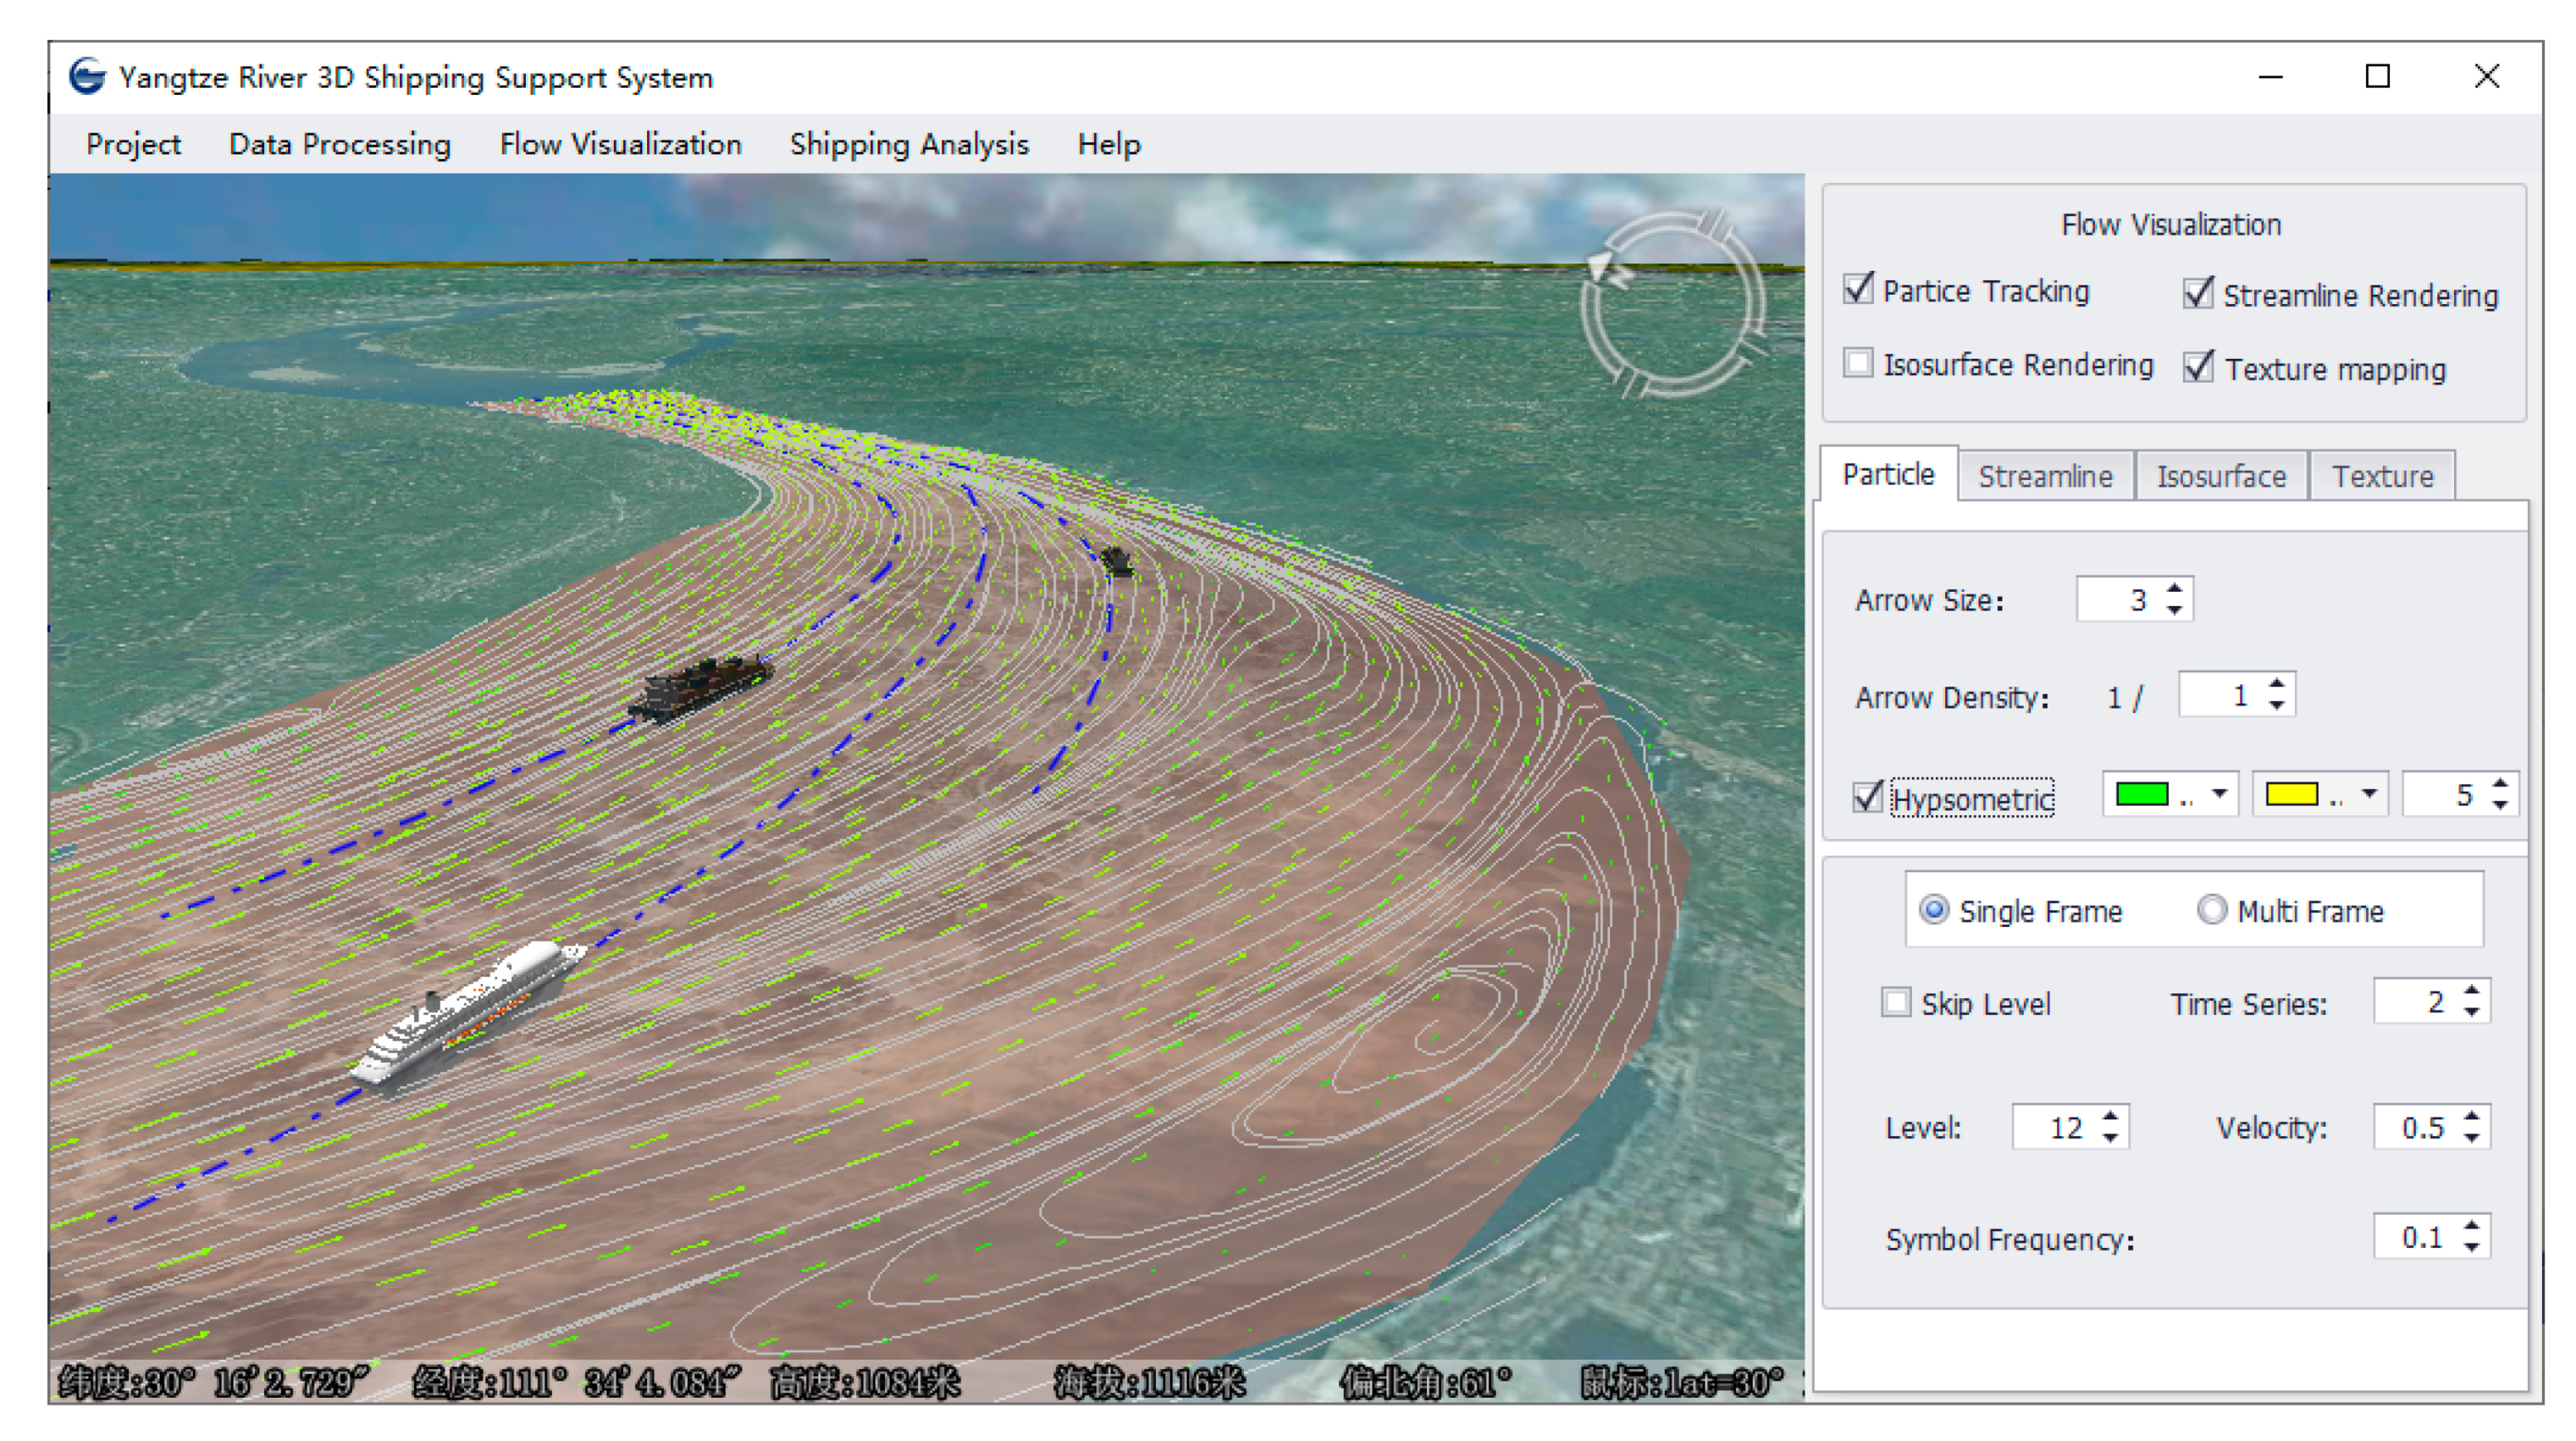
3.4.1. Particle Tracking
3.4.2. Streamline Rendering
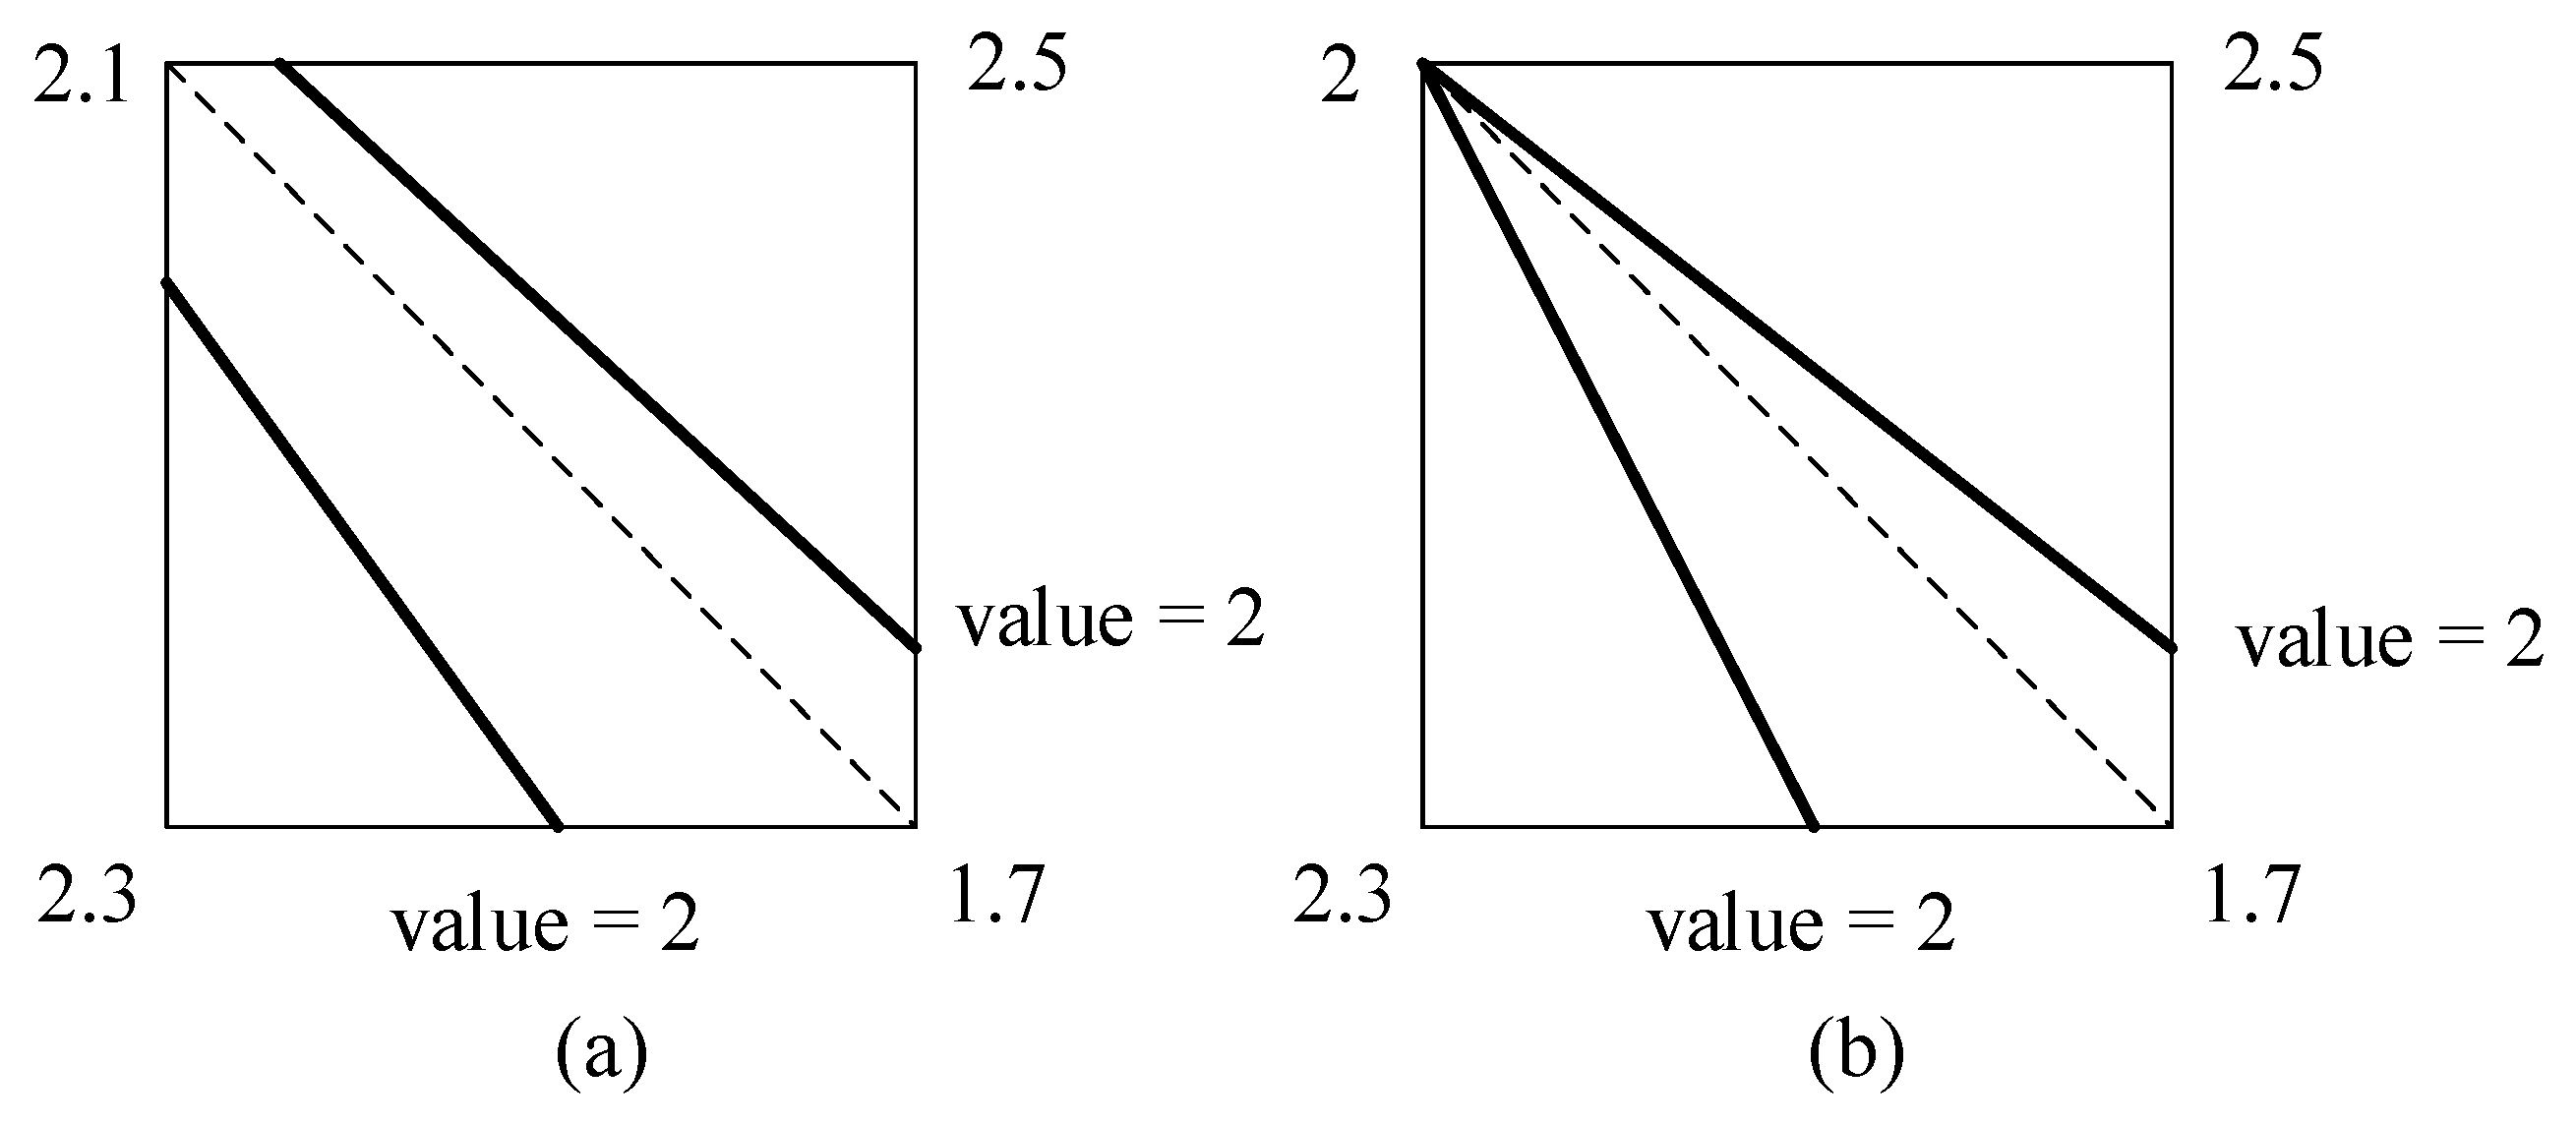
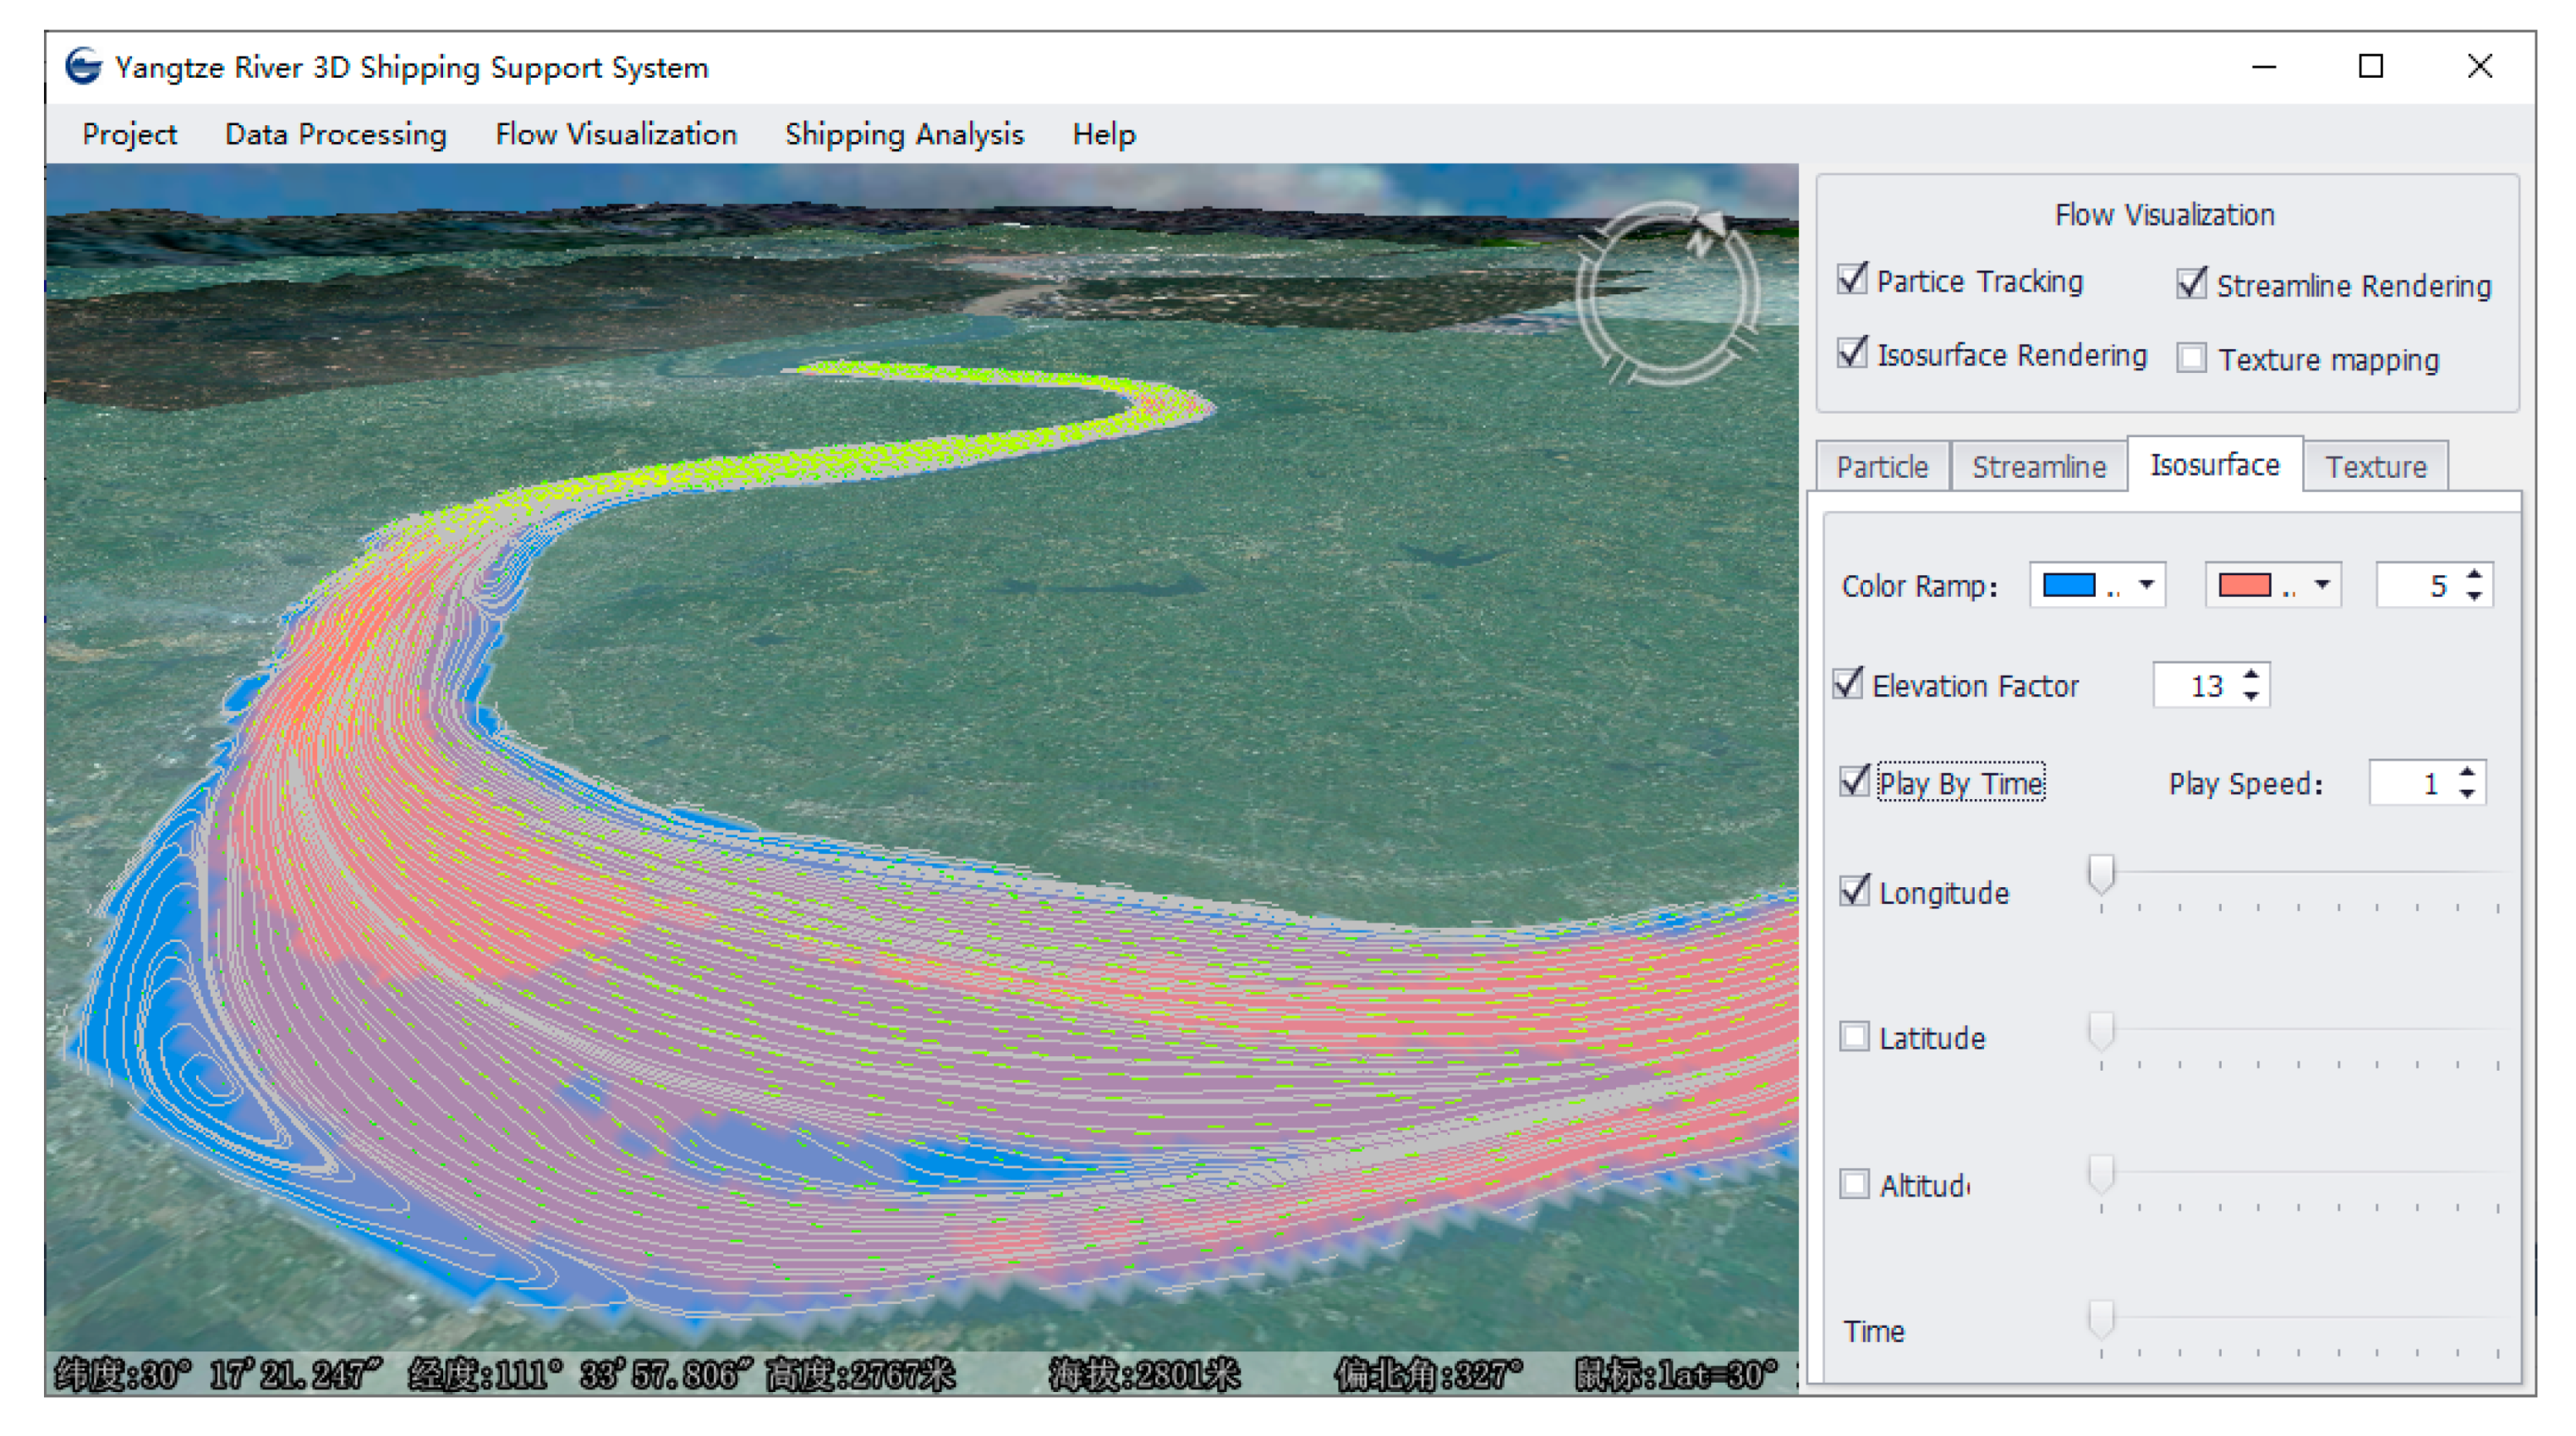
3.4.3. Contour Surface Rendering
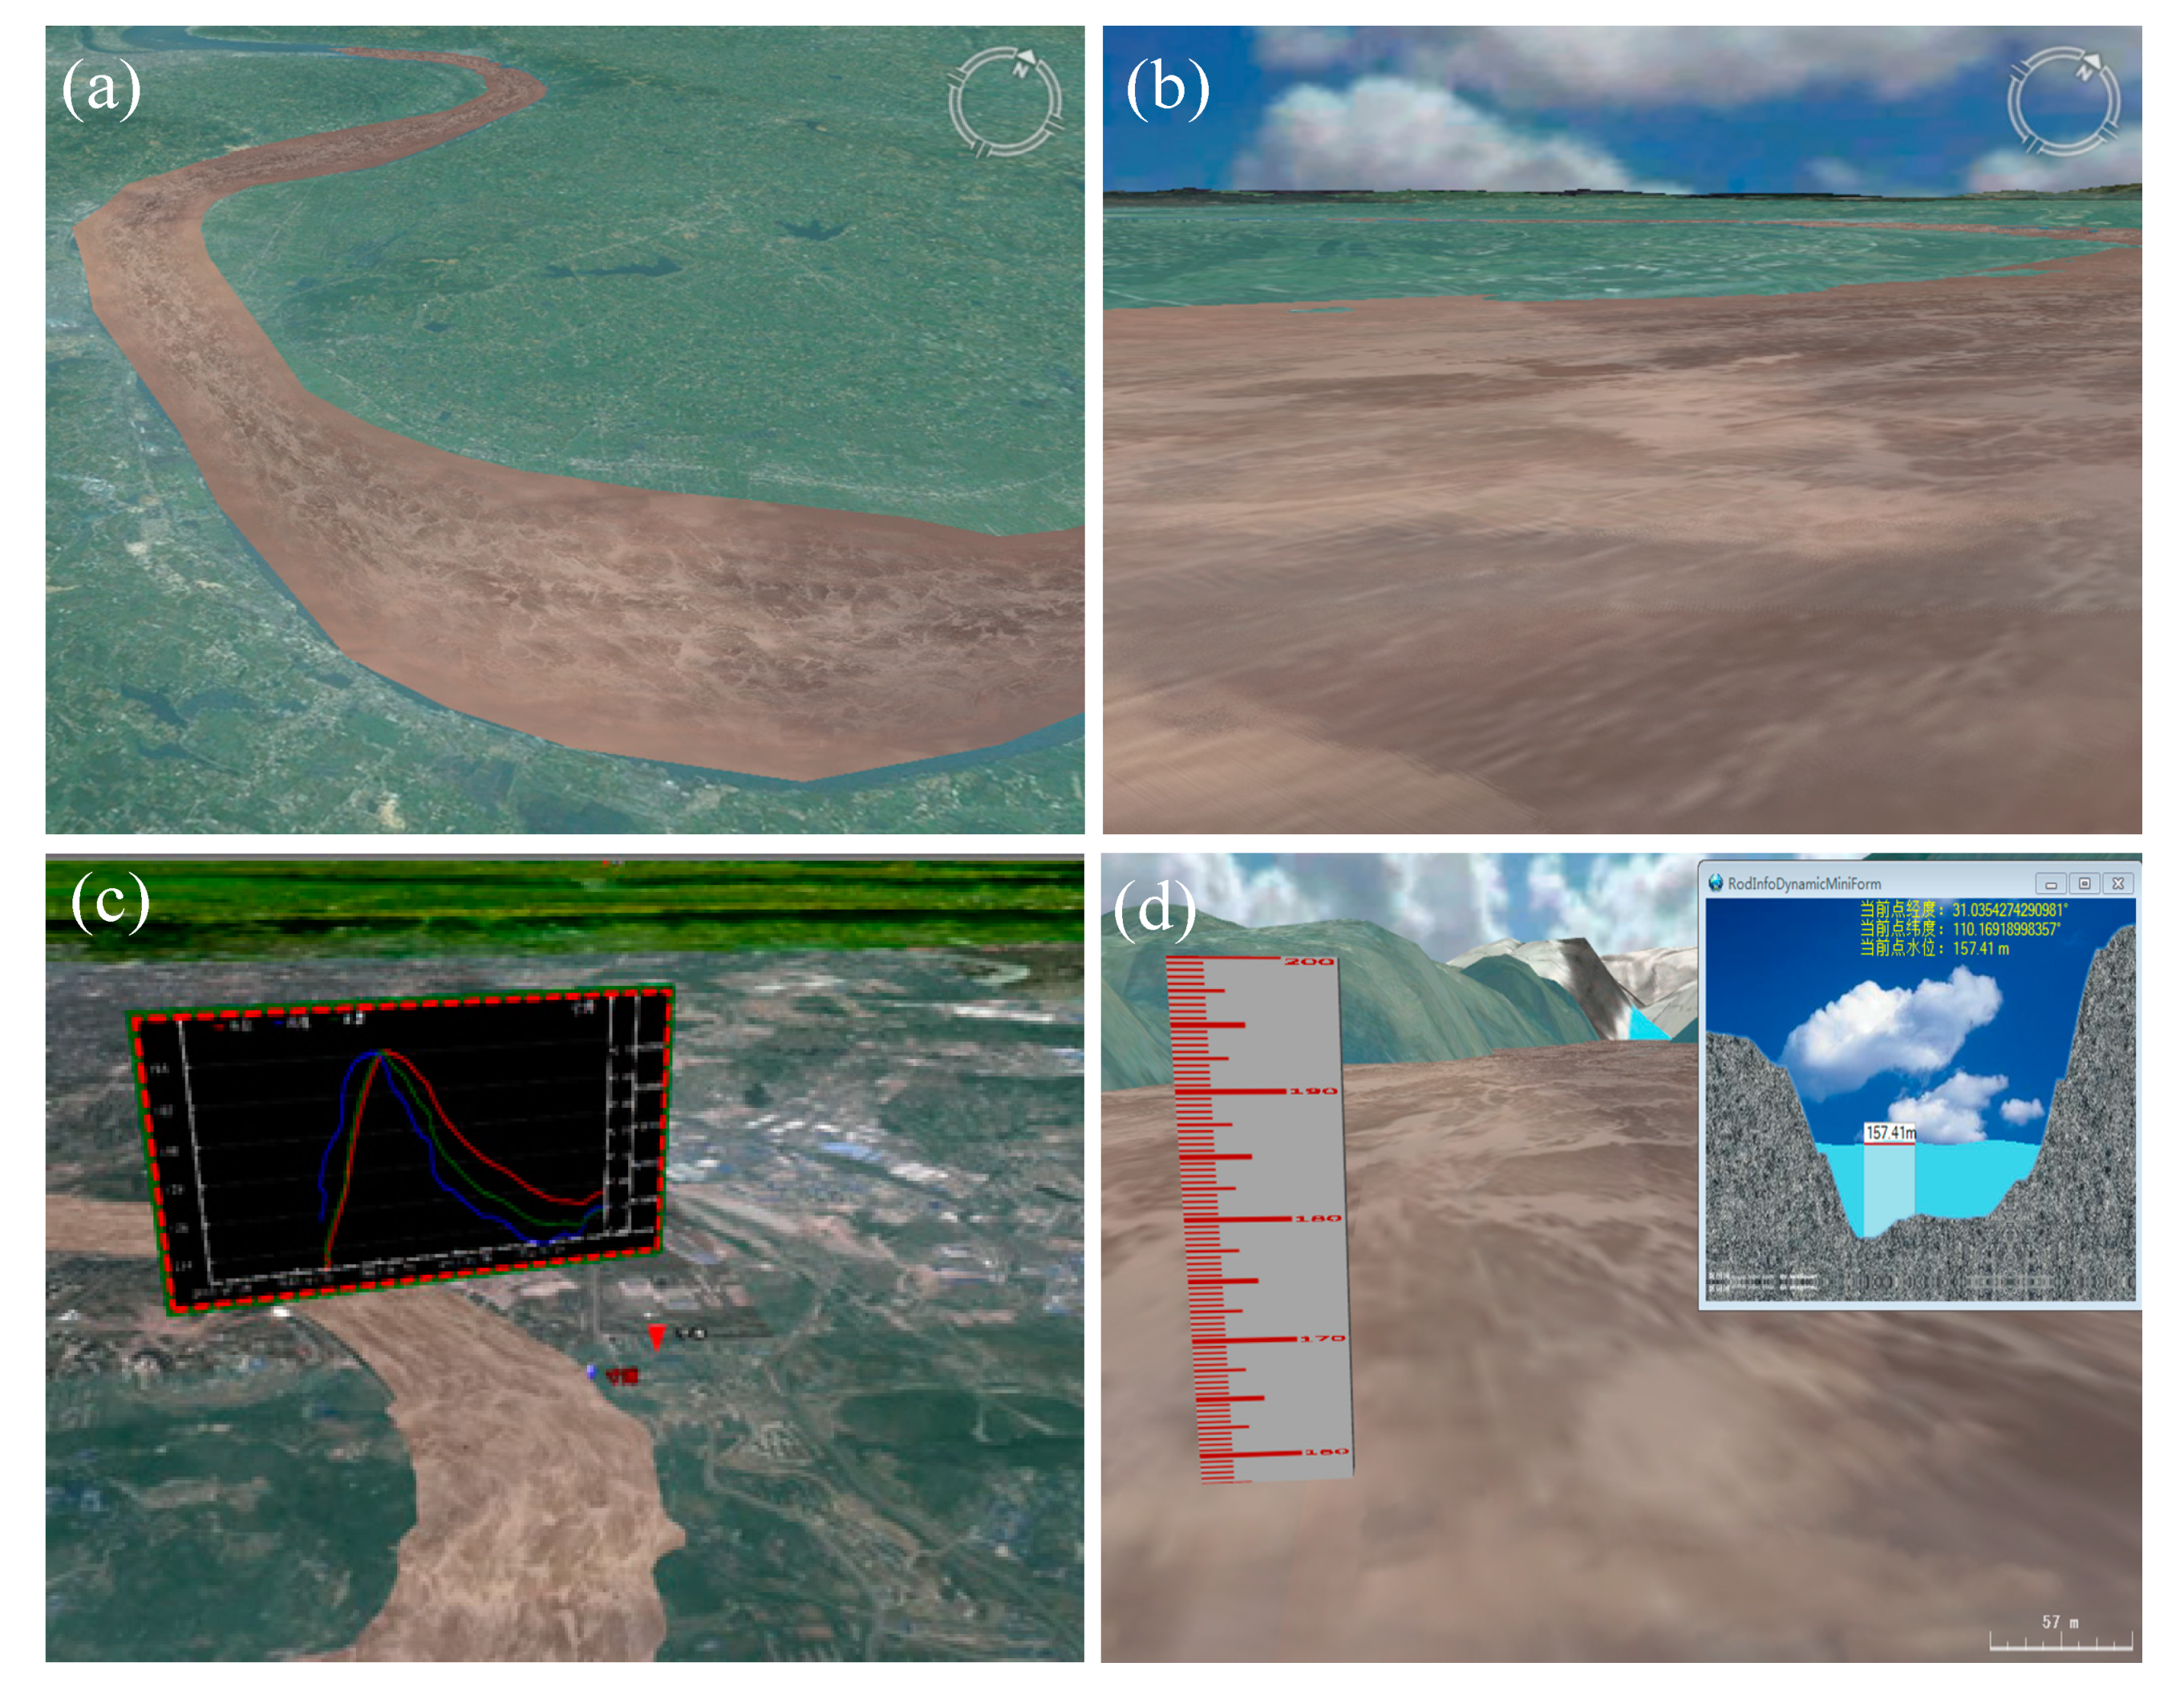
4. Implementation and Discussion
4.1. Performance
4.2. Discussion
5. Conclusions and Future Work
Author Contributions
Funding
Conflicts of Interest
References
- WMO. The Global Climate in 2015–2019; WHO: Geneva, Switzerland, 2019. [Google Scholar]
- Bizzi, S.; Demarchi, L.; Grabowski, R.; Weissteiner, C.; Van de Bund, W. The use of remote sensing to characterise hydromorphological properties of European rivers. Aquat. Sci. 2016, 78, 57–70. [Google Scholar] [CrossRef] [Green Version]
- Coveney, S.; Roberts, K. Lightweight UAV digital elevation models and orthoimagery for environmental applications: data accuracy evaluation and potential for river flood risk modelling. Int. J. Remote Sens. 2017, 38, 3159–3180. [Google Scholar] [CrossRef] [Green Version]
- Costabile, P.; Macchione, F.; Natale, L.; Petaccia, G. Flood mapping using LIDAR DEM. Limitations of the 1-D modeling highlighted by the 2-D approach. Nat. Hazards 2015, 77, 181–204. [Google Scholar] [CrossRef]
- Lin, Y.-T.; Chen, W.-B.; Su, Y.-F.; Han, J.-Y.; Jang, J.-H. Improving river stage forecast by bed reconstruction in sinuous bends. J. Hydroinformatics 2018, 20, 960–974. [Google Scholar] [CrossRef]
- Dal Cin, C.; Moens, L.; Dierickx, P.; Bastin, G.; Zech, Y. An integrated approach for realtime floodmap forecasting on the Belgian Meuse River. Nat. Hazards 2005, 36, 237–256. [Google Scholar]
- Legleiter, C.J.; Kyriakidis, P.C. Spatial prediction of river channel topography by kriging. Earth Surf. Process. Landf. J. Br. Geomorphol. Res. Group 2008, 33, 841–867. [Google Scholar] [CrossRef]
- Lázaro, J.M.; Navarro, J.Á.S.; Gil, A.G.; Romero, V.E. Developing and programming a watershed traversal algorithm (WTA) in GRID-DEM and adapting it to hydrological processes. Comput. Geosci. 2013, 51, 418–429. [Google Scholar] [CrossRef]
- Schäuble, H.; Marinoni, O.; Hinderer, M. A GIS-based method to calculate flow accumulation by considering dams and their specific operation time. Comput. Geosci. 2008, 34, 635–646. [Google Scholar] [CrossRef]
- Flanagin, M.; Grenotton, A.; Ratcliff, J.; Shaw, K.B.; Sample, J.; Abdelguerfi, M. Hydraulic splines: A hybrid approach to modeling river channel geometries. Comput. Sci. Eng. 2007, 9, 4–15. [Google Scholar] [CrossRef]
- Schäppi, B.; Perona, P.; Schneider, P.; Burlando, P. Integrating river cross section measurements with digital terrain models for improved flow modelling applications. Comput. Geosci. 2010, 36, 707–716. [Google Scholar] [CrossRef]
- Caviedes-Voullième, D.; Morales-Hernández, M.; López-Marijuan, I.; García-Navarro, P. Reconstruction of 2D river beds by appropriate interpolation of 1D cross-sectional information for flood simulation. Environ. Model. Softw. 2014, 61, 206–228. [Google Scholar] [CrossRef]
- Zhang, Y.; Xian, C.; Chen, H.; Grieneisen, M.L.; Liu, J.; Zhang, M. Spatial interpolation of river channel topography using the shortest temporal distance. J. Hydrol. 2016, 542, 450–462. [Google Scholar] [CrossRef] [Green Version]
- Chen, W.-B.; Liu, W.-C. Modeling the influence of river cross-section data on a river stage using a two-dimensional/three-dimensional hydrodynamic model. Water 2017, 9, 203. [Google Scholar] [CrossRef] [Green Version]
- Zhang, S.; Zhang, T.; Wu, Y.; Yi, Y. Flow simulation and visualization in a three-dimensional shipping information system. Adv. Eng. Softw. 2016, 96, 29–37. [Google Scholar] [CrossRef]
- Zhang, S.; Li, W.; Lei, X.; Ding, X.; Zhang, T. Implementation methods and applications of flow visualization in a watershed simulation platform. Adv. Eng. Softw. 2017, 112, 66–75. [Google Scholar] [CrossRef]
- Wu, Y.; Peng, F.; Peng, Y.; Kong, X.; Liang, H.; Li, Q. Dynamic 3D Simulation of Flood Risk Based on the Integration of Spatio-Temporal GIS and Hydrodynamic Models. ISPRS Int. J. Geo-Inf. 2019, 8, 520. [Google Scholar] [CrossRef] [Green Version]
- Liu, S.; Chen, G.; Yao, S.; Tian, F.; Liu, W. A framework for interactive visual analysis of heterogeneous marine data in an integrated problem solving environment. Comput. Geosci. 2017, 104, 20–28. [Google Scholar] [CrossRef]
- Su, T.; Cao, Z.; Lv, Z.; Liu, C.; Li, X. Multi-dimensional visualization of large-scale marine hydrological environmental data. Adv. Eng. Softw. 2016, 95, 7–15. [Google Scholar] [CrossRef]
- Zhang, F.; Mao, R.; Du, Z.; Liu, R. Spatial and temporal processes visualization for marine environmental data using particle system. Comput. Geosci. 2019, 127, 53–64. [Google Scholar] [CrossRef]
- Tian, F.; Cheng, L.; Chen, G. Transfer function-based 2D/3D interactive spatiotemporal visualizations of mesoscale eddies. Int. J. Digit. Earth 2018. [Google Scholar] [CrossRef]
- Wang, S.; Kang, F. Automatic optimization for large-scale real-time coastal water simulation. Math. Probl. Eng. 2016, 2016. [Google Scholar] [CrossRef] [Green Version]
- Nugjgar, P.; Fujimoto, T.; Chiba, N. Markov-type velocity field for efficiently animating water stream. Vis. Comput. 2012, 28, 219–229. [Google Scholar] [CrossRef]
- Nugjgar, P.; Chiba, N. Markov-Type Vector Field for endless surface animation of water stream. Vis. Comput. 2013, 29, 959–968. [Google Scholar] [CrossRef]
- Chentanez, N.; Müller, M. Real-time simulation of large bodies of water with small scale details. In Proceedings of the 2010 ACM SIGGRAPH/Eurographics Symposium on Computer Animation; Eurographics Association: Goslar, Germany, 2010; pp. 197–206. [Google Scholar]
- Burrell, T.; Arnold, D.; Brooks, S. Advected river textures. Comput. Animat. Virtual Worlds 2009, 20, 163–173. [Google Scholar] [CrossRef]
- Boultif, A.; Louër, D. Powder pattern indexing with the dichotomy method. J. Appl. Crystallogr. 2004, 37, 724–731. [Google Scholar] [CrossRef]
- Harvey, B.R. Transformation of 3D co-ordinates. Aust. Surv. 1986, 33, 105–125. [Google Scholar] [CrossRef]
- Blu, T.; Thévenaz, P.; Unser, M. Linear interpolation revitalized. IEEE Trans. Image Process. 2004, 13, 710–719. [Google Scholar] [CrossRef] [Green Version]
- Hu, P.; Hou, J.; Zhi, Z.; Li, B.; Guo, K. An Improved Method Constructing 3D River Channel for Flood Modeling. Water 2019, 11, 403. [Google Scholar] [CrossRef] [Green Version]
- Sibson, R. Locally equiangular triangulations. Comput. J. 1978, 21, 243–245. [Google Scholar] [CrossRef] [Green Version]
- Zhang, X.; Yue, P.; Chen, Y.; Hu, L. An efficient dynamic volume rendering for large-scale meteorological data in a virtual globe. Comput. Geosci. 2019, 126, 1–8. [Google Scholar] [CrossRef]
- Zhang, X.; Zhong, M.; Liu, S.; Zheng, L.; Chen, Y. Template-Based 3D Road Modeling for Generating Large-Scale Virtual Road Network Environment. ISPRS Int. J. Geo-Inf. 2019, 8, 364. [Google Scholar] [CrossRef] [Green Version]
- Shewchuk, J.R. Delaunay refinement algorithms for triangular mesh generation. Comput. Geom. 2002, 22, 21–74. [Google Scholar] [CrossRef] [Green Version]
- Hawick, K.A. Modelling flood incursion and coastal erosion using cellular automata simulations. In Proceedings of the IASTED International Conference on Environmental Management and Engineering, Banff, AB, Canada, 16–18 July 2014; 2014; pp. 16–17. [Google Scholar]
- Wang, S.; Li, W. Capturing the dance of the earth: PolarGlobe: Real-time scientific visualization of vector field data to support climate science. Comput. Environ. Urban Syst. 2019, 77, 101352. [Google Scholar] [CrossRef]
- Bell, D.G.; Kuehnel, F.; Maxwell, C.; Kim, R.; Kasraie, K.; Gaskins, T.; Hogan, P.; Coughlan, J. NASA World Wind: Opensource GIS for mission operations. In Proceedings of the Aerospace Conference, Big Sky, MT, USA, 3–10 March 2007; pp. 1–9. [Google Scholar]
- Bavoil, L.; Myers, K. Order Independent Transparency with Dual Depth Peeling; NVIDIA OpenGL SDK: Santa Clara, CA, USA, 2008; pp. 1–12. [Google Scholar]
- Helbig, C.; Bilke, L.; Bauer, H.-S.; Böttinger, M.; Kolditz, O. Meva-an interactive visualization application for validation of multifaceted meteorological data with multiple 3d devices. PLoS ONE 2015, 10. [Google Scholar] [CrossRef] [PubMed]
- Liu, P.; Gong, J.; Yu, M. Visualizing and analyzing dynamic meteorological data with virtual globes: A case study of tropical cyclones. Environ. Model. Softw. 2015, 64, 80–93. [Google Scholar] [CrossRef]
- Zhang, X.; Zhang, M.; Jiang, L.; Yue, P. An interactive 4D spatio-temporal visualization system for hydrometeorological data in natural disasters. Int. J. Digit. Earth 2019, 1–21. [Google Scholar] [CrossRef]
- Forssell, L.K.; Cohen, S.D. Using line integral convolution for flow visualization: Curvilinear grids, variable-speed animation, and unsteady flows. IEEE Trans. Vis. Comput. Graph. 1995, 1, 133–141. [Google Scholar] [CrossRef]
- Ma, Y.-Y.; Guo, Y.-F. Visualization of Vector Field using Line Integral Convolution based on Visual Perception. In Proceedings of the 2nd International Symposium on Computer Science and Intelligent Control; ACM: Stockholm, Sweden, 2018; p. 58. [Google Scholar]
- Min, H.; Haichao, Z.; Maosong, B.; Danchen, Z. Flow Visualization Based on Enhanced Streamline Line Integral Convolution. J. Syst. Simul. 2016, 28, 2933–2938. [Google Scholar]
- Tang, B.; Shi, H. Intelligent vector field visualization based on line integral convolution. Cogn. Syst. Res. 2018, 52, 828–842. [Google Scholar] [CrossRef]
- Reyes-Ortiz, J.L.; Oneto, L.; Anguita, D. Big data analytics in the cloud: Spark on hadoop vs mpi/openmp on beowulf. Procedia Comput. Sci. 2015, 53, 121–130. [Google Scholar] [CrossRef] [Green Version]


| Name | Data |
|---|---|
| Dimensions | 248 × 233 × 1 × 30 |
| Latitudinal range | 30.2468 °N–30.4284 °N |
| Longitudinal range | 111.4626 °W–111.6344 °W |
| Time range | 8:00 6 September–14:00 7 September |
| Time step | 1 h |
| Variable type | Flow velocity, water depth |
| Data volume | 2 GB |
| Rendering Models | Memory Amount | Average FPS |
|---|---|---|
| Particle tracking | 245 MB | 38 |
| Streamline rendering | 282 MB | 42 |
| Contour surface rendering | 291 MB | 35 |
| Dynamic texture mapping | 250 MB | 58 |
| Hybrid rendering 1 | 353 MB | 31 |
| Hybrid rendering 2 | 329 MB | 36 |
© 2020 by the authors. Licensee MDPI, Basel, Switzerland. This article is an open access article distributed under the terms and conditions of the Creative Commons Attribution (CC BY) license (http://creativecommons.org/licenses/by/4.0/).
Share and Cite
Zhang, X.; Liu, J.; Hu, Z.; Zhong, M. Flow Modeling and Rendering to Support 3D River Shipping Based on Cross-Sectional Observation Data. ISPRS Int. J. Geo-Inf. 2020, 9, 156. https://doi.org/10.3390/ijgi9030156
Zhang X, Liu J, Hu Z, Zhong M. Flow Modeling and Rendering to Support 3D River Shipping Based on Cross-Sectional Observation Data. ISPRS International Journal of Geo-Information. 2020; 9(3):156. https://doi.org/10.3390/ijgi9030156
Chicago/Turabian StyleZhang, Xuequan, Jin Liu, Zihe Hu, and Ming Zhong. 2020. "Flow Modeling and Rendering to Support 3D River Shipping Based on Cross-Sectional Observation Data" ISPRS International Journal of Geo-Information 9, no. 3: 156. https://doi.org/10.3390/ijgi9030156
APA StyleZhang, X., Liu, J., Hu, Z., & Zhong, M. (2020). Flow Modeling and Rendering to Support 3D River Shipping Based on Cross-Sectional Observation Data. ISPRS International Journal of Geo-Information, 9(3), 156. https://doi.org/10.3390/ijgi9030156