Article

Multifractal Characteristics of Seismogenic Systems and b Values in the Taiwan Seismic Region

1
Key Laboratory of Environmental Change and Natural Disaster, Beijing Normal University, Beijing 100875, China
2
State Key Laboratory of Earth Surface Processes and Resource Ecology, Beijing Normal University, Beijing 100875, China
3
Faculty of Geographical Science, Center for Geodata and Analysis, Beijing Normal University, Beijing 100875, China
4
National Tibetan Plateau Data Center, Beijing 100101, China
5
College of Data Science, Taiyuan University of Technology, Taiyuan 030024, China
*
Author to whom correspondence should be addressed.
ISPRS Int. J. Geo-Inf. 2020, 9(6), 384; https://doi.org/10.3390/ijgi9060384
Submission received: 11 May 2020 / Revised: 2 June 2020 / Accepted: 6 June 2020 / Published: 10 June 2020
(This article belongs to the Special Issue Geomatics and Geo-Information in Earthquake Studies)

Abstract

:
Seismically active fault zones are complex natural systems and they exhibit multifractal correlation between earthquakes in space and time. In this paper, the seismicity of the Taiwan seismic region was studied through the multifractal characteristics of the spatial-temporal distribution of earthquakes from 1st January 1995 to 1st January 2019. We quantified the multifractal characteristics of Taiwan at different scales and defined them as ΔD values. Furthermore, we studied the relationship between the ΔD and b values, which signifies the average size distribution of those earthquakes. The results are as follows. (1) The temporal multifractal curve changes substantially before and after the strong earthquakes. (2) The maximum ΔD value of the seismic region in Taiwan occurs at depths of 0~9 km, indicating that geological structures and focal mechanisms is the most complex at these depths compared with other depths. (3) ΔD values for different regions range from 0.2~1.5, and b values range from 0.65~1.3, with a significant positive correlation between them (ΔD = 1.5 × b − 0.68). For this purpose, a statistical relationship is developed between b and ΔD values, and regional and temporal changes of these parameters are analyzed in order to reveal the potential of future earthquakes in the study region.

1. Introduction

Earthquakes are among the most serious natural disasters and cause great losses to humanity. Therefore, scientifically understanding seismic hazards and designing different seismic fortification intensity for different regions according to the degree of seismic hazard are of great practical significance. To evaluate the seismic hazard of an area, the seismicity of the area must first be analyzed. Numerous statistical models have been proposed to describe the regional and temporal variations of seismicity by using scaling laws in seismology [1,2,3,4]. Different seismic parameters can be used to analyze the characteristic of seismicity in these models, including the (1) magnitude of completeness (MC), which is the lowest magnitude at which all earthquakes in a space-time volume are credibly detected [5]; (2) b value, which defines the frequency-magnitude distribution of earthquakes, and (3) D value, which indicates the number of objects greater than a specified size with a power law dependent on size [6].
Fractal characteristics describe the processes of seismic systems from gestation to the self-organizing critical state. Changes in the heterogeneity degree of seismicity, seismotectonic structures, mechanical rock properties can be described by using the fractal dimension D value [3]. Wang et al. [7] applied fractal theory to the study of the spatial distributions of seismic sources, and the results show significant multifractality and a spatial variation in multifractality for epicentral distributions of earthquakes in west Taiwan. Chen et al. [8] proposed the Hill multifractal estimator to compare the generalized strain energy of seismic activities in New Zealand, Japan and the eastern and western regions of China and analyzed the multifractal characteristics of the seismic activities in each region. The results showed that the multifractal characteristics of seismic activities are closely related to the complexity of the geological structures. Pastén et al. [9] also used multifractal theory to analyze the change sequence of seismic electromagnetic currents and noted that the dimension of seismic electromagnetic currents has an obvious abnormal value before a large earthquake. Balcerak [10] analyzed the seismic time series of the 2003 Tokachi-Oki earthquake in Japan and noted that the multifractal dimension of the seismic activity would also have outliers before the next large earthquake.
Another fundamental parameter in seismology is the b value from the Gutenberg–Richter frequency-magnitude relation. According to global statistics, the b value of a large seismic area is generally close to 1.0 [11,12,13]. However, variations in b values do occur regionally, these variations are highly correlated with the regional characteristics of seismic activity and may be significant, for example, ranging from 0.5 to 1.3 near Parkfield on the San Andreas fault or from 0.5 to 1.5 in California and Japan [14,15]. The variation in the b value is sensitive to the differential stress [16]. Previous studies have confirmed that the b value is inversely dependent on the differential stress in both the laboratory [17,18] and the field [19]. A region with a low b value is implied to exhibit a large differential stress, suggesting its being toward the end of the seismic cycle [14]. Such a relationship can be used as a kind of precursory information for earthquake forecasting [16,20]. In probabilistic seismic hazard analysis (PSHA) studies, the b value is used to reflect the magnitude distribution of earthquakes in a certain area, which is crucial for the accuracy of the final evaluation results.
The relationship between the b value and the fractal dimension D value has been widely discussed in many studies [21,22,23,24,25]. Aki [21] proposed a simple relationship between the b value and the fractal dimension D and identified a positive correlation D = 3b/c (where c is the slope of the log moment versus magnitude relation and equal to approximately 1.5). Wang et al. [22] showed a negative correlation between the b value and the D value in western Taiwan and indicated that a negative correlation for the observed seismicity might be reasonable due to the isolation of asperities or barriers on the fault planes. Wang et al. [25] obtained a similar result for earthquakes in Taiwan and showed a negative correlation between the b value and the D value. Mandal et al. [26] showed the correlation between those two scaling exponents could change from a negative one to positive in India.
Most previous studies use fractal theory to describe the fractal features of the study region on a large scale and macroscopically. We focus on the fine multifractal features in the study region. In the present work, the study area was divided into different scales (i.e., regions) and the depths of the regions are divided according to the results of the latest geological structure research, thereby providing the three-dimensional characteristics of the b value and D value of the Taiwan earthquake area. The results of this study are expected to be helpful in quantitatively describing the material composition of the crust and the degree of heterogeneity of geological structures, that is, the complexity of the geological structure environment and the determination of the PSHA.

2. Study Area

Taiwan island is located in the seismically active region at the junction of the Eurasian plate in the west and the Philippine sea plate in the east, as shown in Figure 1. The Philippine sea plate in northeastern Taiwan is being pushed under the Eurasian plate, while the Eurasia plate is going beneath the Philippine Sea Plate in south Taiwan. As a result of regional tectonic motion, the subduction zone, compressional folds and thrust belts lift the surface of Taiwan Island and most of Taiwan is under a northwest-southeast contraction with the convergence rate of about 80 mm/year [27,28,29,30,31]. The unique location of Taiwan at the conjunction point between the Ryukyu arc and the Luzon arc leads to some geological structures at Taiwan such as folds, faults, and volcanoes. Thus, numerous earthquakes have been taking place inland. The Central Weather Bureau Seismic Network (CWBSN), which is responsible for monitoring regional earthquakes in Taiwan. This network currently consists of a central recording system with 71 telemetered stations that are equipped with three-component Teledyne/Geotech S13 seismometers [31]. According to previous research on the seismicity of the Taiwan [32], the CWBSN instruments were operating in a triggered recording mode prior to 1994 when continuous recoding began.
Many devastating earthquakes which have occurred in the past decade (Figure 1). Such as the 1999 Chi-Chi MW 7.6 earthquake, which is the largest inland earthquake ever recorded in Taiwan [33,34,35,36,37], the 2002 Hualien MW 7.1 earthquake [38], the 2003 Chengkung MW 6.8 earthquake [39], and the Pingtung MW 7.0 earthquake in December 2006 [40]. The significant events were well recorded in Taiwan provide a valuable database to study both the lithosphere structure, earthquake sources, background stress state and stress perturbation.
Previous studies have inferred crustal strain or stress states in Taiwan from different data sets. Angelier et al. [33], Suppe et al. [34], and Chang et al. [35] investigated the stress state and stress perturbation according to fault-slip data sets, borehole breakout and elongation data GPS observations and earthquake focal mechanisms. They found that the orientations of the maximum horizontal compressive stress are generally NW-SE directed, consistent with the orientation of plate motion. More detailed analysis of spatial variations of stress or strain states after the Chi-Chi earthquake. Hsu et al. [29] discussed the deviatoric stress in the crust from GPS observations. They observed a 10°–20° rotation of fault slip vectors after the Chi-Chi mainshock and suggested a low deviatoric stress of about 1–3 MPa on the décollement beneath the Central Range. Wu et al. [37] evaluated spatial and temporal variations of stress orientations by using the stress tensor inversion methodology. They found significant rotations (>20°) of the maximum horizontal compressive axis immediately after the Chi-Chi earthquake. Chan et al. [30] investigated the variations of stress states associated with the 1999 Chi-Chi earthquake in different spatial scales and given the background deviatoric stress in the range of 10–50 MPa and the horizontal NW-SE directed maximum principal stress axis, the predicted fault types show strike-slip and normal faulting near the coseismic surface rupture and thrust and strike–slip faulting in central Taiwan. In general, early works attributed such stress heterogeneity to the existence of fault geometry complexity or pre-existing spatial stress heterogeneity on a local scale by various factors such as existing fault networks, lithology, geologic history, and so on [30].

3. Earthquake Catalog

In seismicity studies, the integrity of the seismic catalog in the region must be evaluated; otherwise, the seismicity parameter estimates would be biased. In this work, we used catalog from the Central Weather Bureau Seismic Network (CWBSN) for the period 1st January 1995–1st January 2019. To evaluate the reliability of the catalog, the completeness of the earthquake catalog was tested by calculating the magnitude of completeness, or MC, is defined as the minimum magnitude at which the cumulative Frequency Magnitude Distribution (FMD) departs from the decay [32]. Most techniques that focus on estimating MC follow the validity of the Gutenberg–Richter law, such as the Goodness-of-Fit Test [41], the Entire Magnitude Range [15], and the maximum curvature (MAXC) method [42].
MC usually shows a non-stable value in time. In the present work, the change of MC values as a function of time is estimated using a mowing window approach with the MAXC technique. Because it is a robust and straightforward method of estimating MC based on finding the magnitude bin with the highest frequency of events in the frequency magnitude distribution plot. The whole earthquake catalog with M ≥ 1.0 is included in the estimation of MC value and it is plotted with its standard deviation for samples of 250 events/windows. Figure 2 shows the changes in MC value with time. MC value is rather large and varies from 4 to 4.5 until 2001 whereas it changes from about 3.5 to about 4 between 2001 and 2005. It can be easily seen that MC value changes between 3 and 3.5 after 2005. As a result, MC value for the Taiwan region varies between 2.8 and 3.5.
Figure 3 shows the cumulative number of events versus time for the original catalog with M ≥ 1.0 and for the declustered catalog with M ≥ 3 between 1995 and 2019. As shown in Figure 3, there is no significant seismic activity from 1995 to 2000 and a little seismicity change between 2000 and 2005. On the contrary, there are great seismic changes after 2005. The cumulative earthquake number of declustered catalog with M ≥ 3 as a function of time for the Taiwan region has a smoother slope when compared to the original catalog. Thus, it is clear from Figure 3 that declustering algorithm has removed dependent events from the original catalog and after processing the declustering algorithm, a more homogeneous, reliable and robust earthquake catalog has been obtained. We select events from the catalog with focal depths less than 40 km, which is comparable to the thickness of the seismogenic zone in Taiwan [43,44].

4. Method

4.1. Multifractal Methods

Many irregular forms and phenomena exist in nature, and self-similarity is observable at different scales. Patterns with scale invariance and self-similar irregularity are called fractals. In general, fractals can be divided into two categories: uniform fractals, which are based on strict geometric self-similarity on infinitely many scales, such as the famous Koch curve; and multifractals, which are statistically self-similar and non-uniform. Most fractals in nature are multifractals with statistical self-similarity at a certain scale. Fractal characteristics can be quantitatively characterized by fractal dimension values.
The Renyi generalized fractal dimension is the most common method for describing multifractals. Based on information theory, it defines the q-order probability moment:
X q ( ε ) = i P i ( ε ) q
X q ( ε ) ε ( q 1 ) D q
where Dq is the generalized dimension.
D q = lim ε 0 P i log P i log ε , ( q = 1 ) 1 q 1 lim ε 0 log P i q log ε , ( q 1 )
where Pi is the probability that events fall into a box with length ε; q is the estimated order of the moment and can take any real number ranging from −∞ to +∞. Dq for larger positive q shows the fractal property of dense regions, where Pi is large, and Dq for negative q displays that of thin regions, where Pi is small.
The probability Pi can be estimated by the box-counting method for the observed data.
Using the box-counting method, the study researches fractal characteristic of the seismic spatio-temporal space by calculating generalized fractal dimension of the time series and spatial distribution in the seismic activity. Each seismic event is set as a data point in the seismic dataset, ε as minimum spatio-temporal interval. With the minimum spatio-temporal scale ε, N(ε) is number of non-empty subsets under the whole seismic dataset. As the ε value head towards zero, the fractal dimension is calculated. The capacity dimension Dc set as [45]:
D C = lim ε 0 log N ( ε ) log ( 1 / ε )
When the ith component contains the number of data points as Ni(ε), the probability for a point data belongs to the ith subset with the spatiotemporal scale ε, is defined as:
P i ( ε ) = N i ( ε ) N ( ε )
The information dimension Di is
D i = lim ε 0 P i ( ε ) × log P i ( ε ) log ε
A single value of fractal dimension (Dc and Di) is not enough to characterize the fractal properties of multifractal objects. Therefore, the idea of fractal dimension has been extended to the generalized fractal dimension Dq. Generally speaking, D0 (q = 0) relates to the capacity dimension DC, D1 (q = 1) to the information dimension Di. The value of Dq can be estimated from the linear portion of the plot of log X(ε) versus log ε.

4.2. Estimation of b Value

In their 1942 article “Global Seismicity”, which was published in the Journal of the American Geological Society, Gutenberg and Richter noted that seismic activity can be characterized by the following relationship [46]:
log N ( m ) = a b m
where N(m) is the frequency of earthquakes with a magnitude greater than or equal to m. Parameters a and b can be obtained by regression on the actual earthquake catalog. In the PSHA, b is an important parameter that describes the distributions of earthquake magnitudes and frequencies, and a is an important parameter that actually measure of the level of seismic activity in a certain region. The most common methods for estimating the b value are maximum likelihood and least squares estimation. However, researchers widely recognize that the least squares method should not be used because the cumulative frequencies of earthquakes violate the basic assumption of independence of the data [47].
In the present study, we use a maximum likelihood method to estimate the b value and the standard deviation [48,49]. The b value and the standard deviation (σ) of b value is as follows:
b = lg e M ¯ M 0
σ = b N 1 / 2
where M ¯ is the average of magnitudes in the earthquake catalog; M0 is the initial magnitude; N is the number of events used for the b value estimation.

5. Results

5.1. Multifractal Characteristics of the Time Distribution

A time series for earthquakes is a finite and discrete point set. To ensure reliable results, this paper selects historical seismic data for the Taiwan seismic province through integrity testing, and the time distribution range is 1st January 1995 to 1st January 2019. In a multifractal analysis, the number of point sets to be studied should be as large as possible. When the sample size is too small, the obtained fractal dimension may have pseudo-multifractal characteristics with parameter changes. Generally, the sample size should be no less than 200 [50].
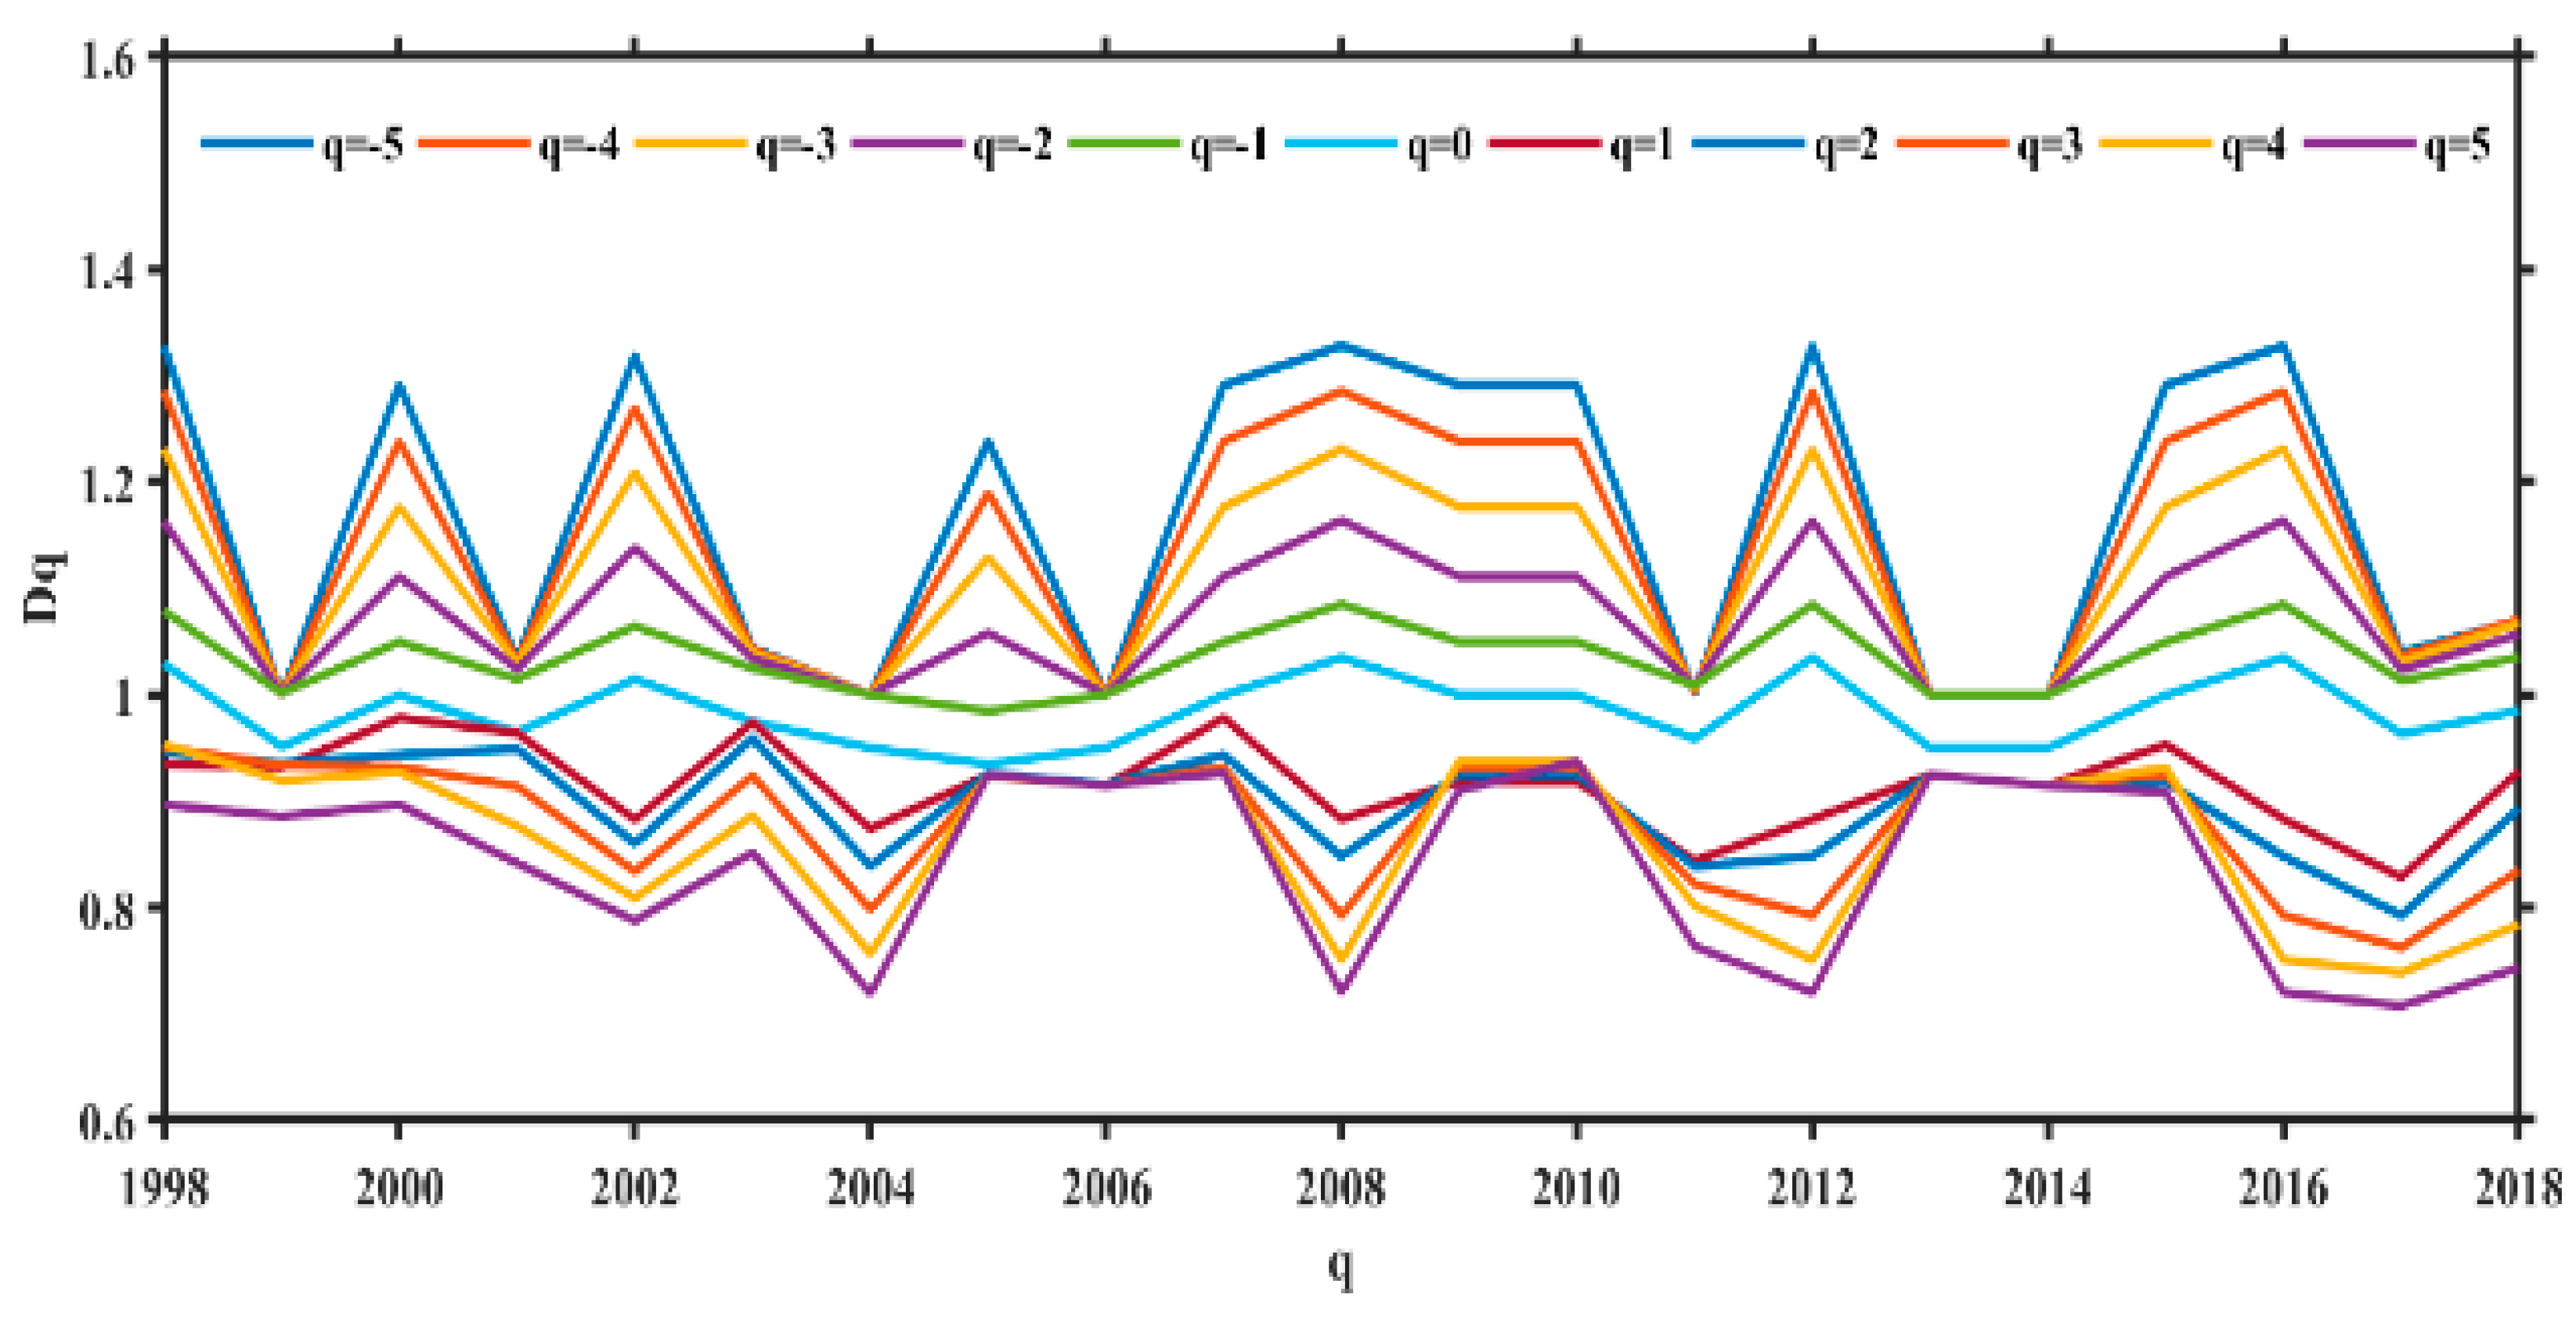
To ensure the reliability of the results, the calculation windows were 1 year long, except for the 1995–1998 calculation window. The results are shown in Figure 4, where the value of q is unified from [−5,5]. In the figure, the curves from top to bottom are the multifractal evolution states over time of q from −5 to 5.
In order to make an assessment on the seismic activity with time, the temporal distribution of all M ≥ 1.0 earthquakes from 1995 to 2019 is plotted as seen in Figure 5. There are a few strong earthquakes larger than 6.5 from 1995 to 2019. Many strong earthquakes with magnitudes greater than 6.5 are accompanied by dramatic changes in the corresponding curves in Figure 4. Specifically, most of the curves are in a state of loose tension before strong earthquakes occur; that is, the Dq value in the negative q region increases sharply or the Dq value in the positive q region decreases sharply or both.

5.2. Multifractal Characteristics of the Spatial Distribution

Similar to the characteristics of seismic activities in a time series, the spatial distribution can also be regarded as a series of discontinuous point sets in a multifractal analysis. In addition, to further describe the seismic activity characteristics reflected by the multifractals at different depths in the Taiwan seismic province, we first use k-means clustering to stratify all the earthquakes in the study area (focal depths ≤ 40 km). According to the sample size requirements for a multifractal analysis, we divide the study area into 5 layers: H1 (0~9 km), H2 (9~14.5 km), H3 (14.5~21.5 km), H4 (21.5~29.5 km), and H5 (29.5~40 km) (Figure 6). Each layer is latticed, a spatial sequence reflecting the integrity of its spatial distribution is established, and the generalized fractal dimension Dq of each layer is calculated. For the value of q, the entire set of real numbers can theoretically be obtained; the larger the range is, the better the characteristics of the multifractal structure can be displayed [51]. Considering that an increase in q leads to an exponential increase in the calculation results and an overflow, after many experiments, q is set to [−10,10] in this paper.
The calculation results are shown in Figure 7. The Dq values at different depths all monotonically decrease with increasing q and are nonlinear, subtractive functions. The value of q gradually increases from negative to zero and then to a positive value, and this change is analogous to that from describing the complexity of seismic system structures in sparse areas to describing the complexity of structures in clustered areas. The curve first decreases sharply and then slowly decreases, which indicates that the spatial multifractal complexity increases and is consistent with the complexity of the seismotectonic structure. To quantitatively describe this complexity, we adopt an area the size of the multifractal complexity of the parameter ΔD (the difference between D10 and D−10), reflecting the complexity of the regional seismotectonic structure [52,53].
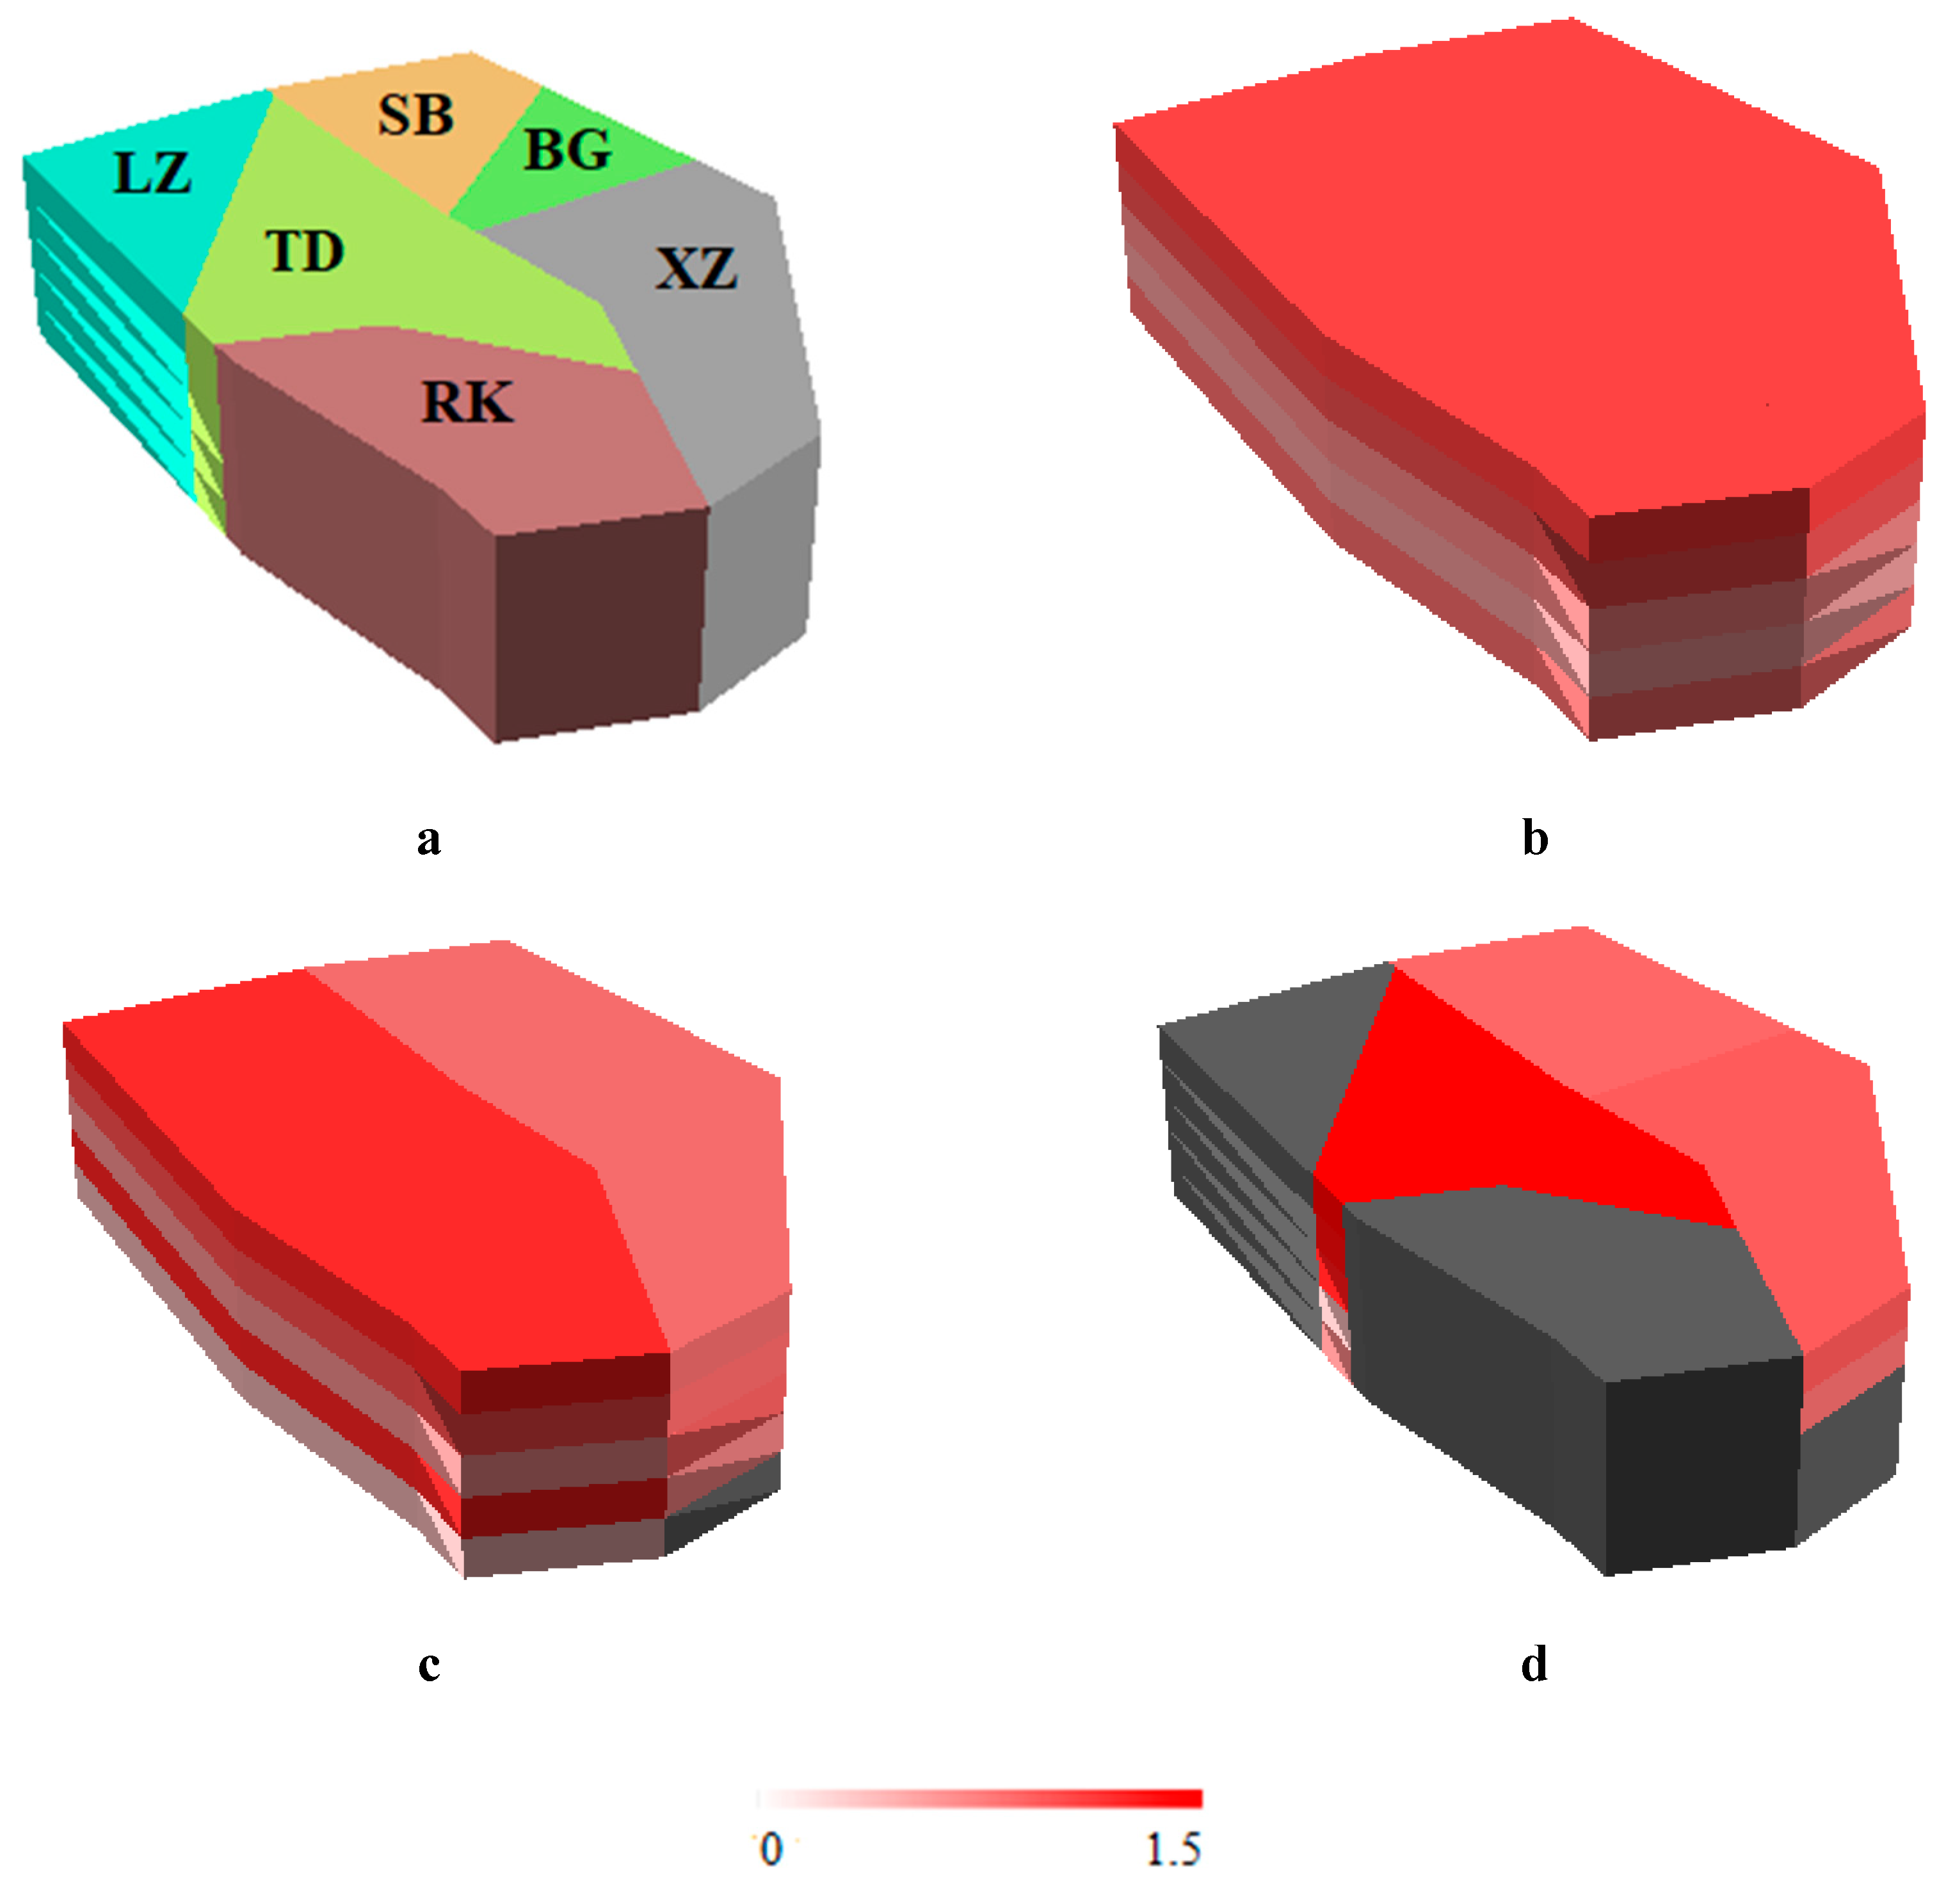
Based on the characteristics of the seismicity and seismotectonic structure and zonation in the Taiwan region, the study area is first divided into east and west seismic tectonic zones. Furthermore, the eastern seismic tectonic zone is further divided into the Ryukyu arc (RK), TaiDong valley (TD), and Luzon arc (LZ). The western seismic tectonic zone is divided into the XinZhu fault (XZ), BeiGang uplift (BG), and Southwest basin (SB). The multifractals of each depth layer in different regions are calculated, and the results are shown in Figure 8.
Figure 8 attempts to show the distribution of ΔD values at different spatial scales, and the results show the distribution of ΔD distribution at different depth layers and at different regions of the same depth layer is highly uneven. This phenomenon implies the complexity of regional geological structures.
The ΔD for the study area (b) in H1 (0~9 km) is the largest, and the value tends to decrease with depth until H4 (21.5~29.5 km). The ΔD of the last depth layer H5 (29.5~40 km) increases instead, which indicates that the multifractal structure of this layer becomes relatively complex again. The ΔD results for the east and west seismic tectonic zones (c) show that eastern Taiwan has higher values than western Taiwan at all layers except H3 (14.5~21.5 km). In the zones of tectonic features (d), different regions have different ΔD values. Compared with those in other zones, the ΔD value in the TaiDong valley (TD) is the largest at all layers. In western Taiwan, the ΔD values of BeiGang uplift (BG) and Southwest basin (SB) are similar and slightly less than that of XinZhu fault (XZ) in the first layer (H1) but greater in the second layer (H2).

5.3. Relationship between ΔD and b Values

We consider that seismic activity has the multifractal characteristics, and a single fractal dimension D value may not be able to accurately describe the relationship between spatial fractal characteristics and b values. In this section, we calculate the b value and its standard deviation for each region by using the maximum likelihood estimation. Then, a correlation analysis is carried out based on the above results for the multifractals.
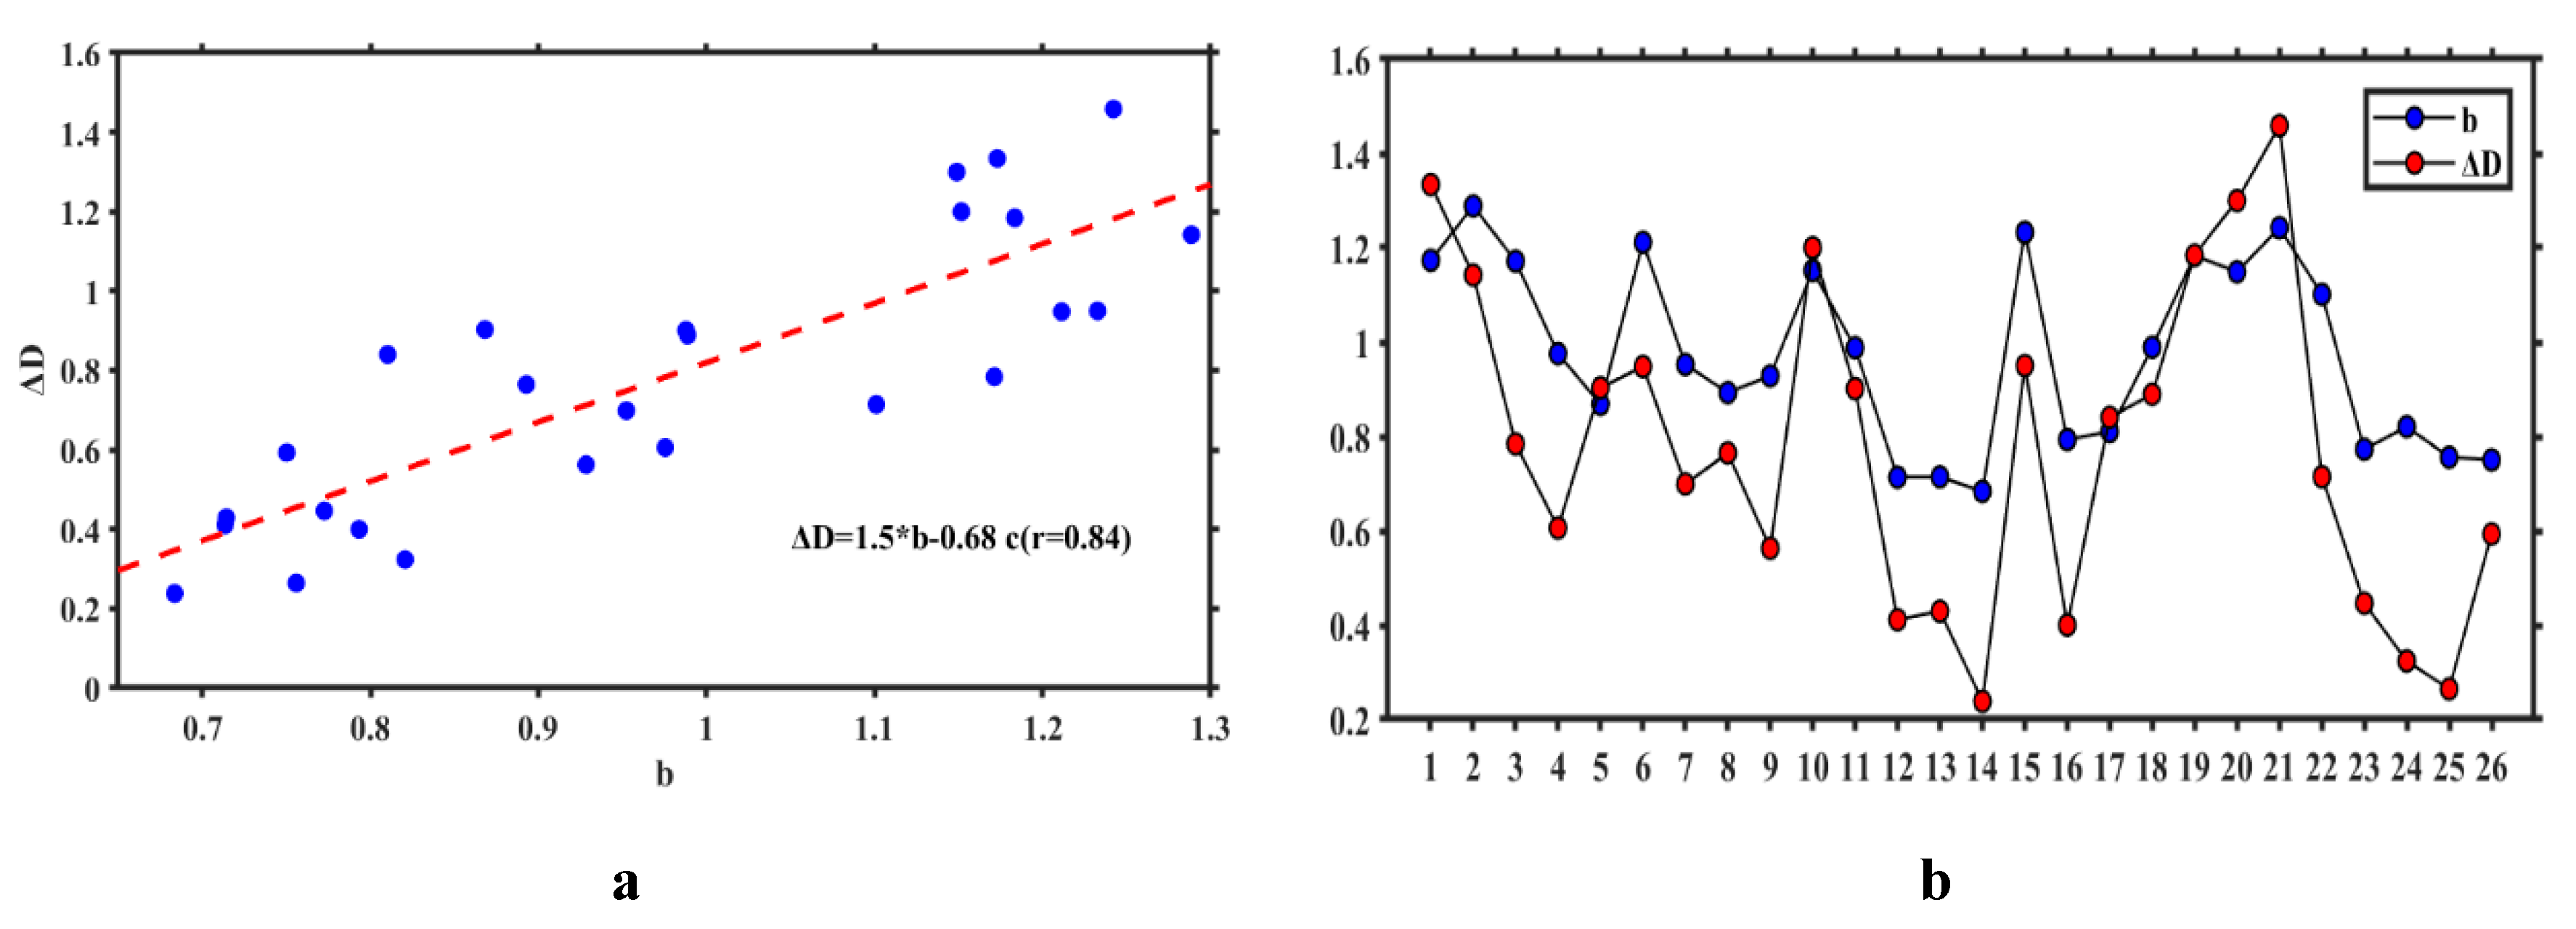
Figure 9a shows the relationship of regression fit between b and ΔD values. Negative correlation coefficient (r) is calculated as 0.84 and it can be accepted as a strong enough. Linear regression fit is used and following relationship is obtained:
ΔD = 1.5 × b − 0.68, (r = 0.84)
The results also show that the ΔD value ranges between 0.2 and 1.5 and b value ranges from 0.65~1.3. Different sample points of ΔD and b values change consistently (Figure 9b), and the change in the range of ΔD is greater than that of the b value.

6. Discussion

Seismically active fault regions are complex natural systems and they exhibit scale-invariant or fractal correlation between earthquakes in space and time [53]. By understanding the multifractal features of the time distribution of seismic events, the temporal variations of some characteristics of seismotectonic structure can be reflected in detail. Multifractal characteristics of the time distribution results show that the curve oscillates between compression and tension. Most of the curves are in a state of loose tension before strong earthquakes occur. This finding is also consistent with previous research results [54,55]. We also find that the temporal multifractal generalized fractal dimensions of the Dq vs. q curve usually changes abruptly before and after strong earthquakes.
The spatial distribution of seismic events is controlled by the geological and tectonic environments, and the multifractal features of a seismic event’s spatial distribution are closely related to the complexity of the seismotectonic structure. To describe this complexity accurately and quantitatively, we first divide the research area into different scales and depths and then use the size of the ΔD values to represent the complexity of the seismotectonic structure in different regions. In the Gutenberg–Richter relation, which is widely used in seismological studies, the b value represents the proportion of all earthquakes of different magnitudes and ranges in a certain area and is sensitive to the differential stress. To date, most studies on b values focus on their temporal and/or spatial variations. Varotsos et al. [56] based on the natural time analysis of earthquake data revealed that a fall of the b value observed before large earthquakes reflects an increase in the order parameter fluctuations upon approaching the critical point (mainshock) and stems from both origins of self-similarity. Recently, several studies have proved that b value may decrease before a large earthquake and explained that the variation of the b value could reflect the physical process of stress evolution and crack growth [16,20,57]. laboratory measurements have established that the higher the differential stress applied to the rock sample, the lower the b value [17,18]. Some authors [58,59] pointed out the correlation between b value and tectonic regimes, and the final results are widely consistent: as power laws indicate scale invariance, inverse dependence of the b value on differential stress. Spada et al. [60] and Wiemer and Wyss [61] proved that the b value would decrease with increasing depth and pressure. Grassberger et al. [62] showed that the physical reasons for the decrease in b value with increasing depth are mainly stress changes and anisotropy of the medium. Chan et al. [43] showed that large earthquakes in Taiwan are located predominately in regions with low b values. Table 1 shows the ΔD and b values of different depth layers and regions. The decreasing trend of ΔD from H1 to H5 indicates that the heterogeneity of the crustal in Taiwan crust is decreasing. According to column 3, the maximum b value of the crust in Taiwan is relatively large, which means that the stress level in the upper crust is relatively low and may also indicate that the strength of the rocks constituting the upper crust is relatively low [63]. The decreasing trend of b values from H2 to H5 clearly shows that the pressure increases with increasing depth, leading to a change in the stress state. The b value is a minimum at H5 (29.5~40 km), indicating that the crustal intermediate stress level is the highest at this depth compared to the other depth layers.
Many studies on the relationship between multifractals of seismic spatial sequences and b values have been reported [21,22,23,24,25,50]. Aki [21] proposed a simple relation between the b value and the D value: D = 3b/c (c = 1.5). However, in follow-up studies, the observed results did not satisfy this relationship [52,64]. We argue that the multifractal characteristics of seismic activity leading to a single fractal D value and the b value relationship may not be able to accurately determine the spatial multifractal characteristics of the ΔD and b values. We obtain a significant positive correlation between them, and the range of ΔD values is larger than that of b values.
Based on the complexity characteristics of seismically active fault and fractal theory can be used to reveal the characteristics of non-stability and discontinuity in the complex system. Spatial and temporal analyses of the current seismic behaviors of earthquakes provide valuable evidence of future earthquake hazards in the Taiwan region. For this reason, seismotectonic parameters such as ΔD value, b value, and their relations must be more carefully estimated in order to reveal the significant anomaly regions before strong earthquakes in the future.

7. Conclusions

Based on data from 1st January 1995 to 1st January 2019 in the Taiwan seismic region, we analyzed the spatial and temporal multifractal characteristics of seismicity in this region. The results show that the temporal multifractal generalized fractal dimension of the Dq vs. q curve for the Taiwan earthquake zone oscillates between compression and tension and reflects the repeated changes in the seismogenic system from steady to unsteady, with the curve usually changing abruptly before and after strong earthquakes. Specifically, the Dq value in the negative q region increases sharply, or the Dq value in the positive q region decreases sharply, or both.
Regarding the spatial multifractal characteristics, we calculated the generalized fractal dimension Dq for five depth layers of the shallow source tectonic system. The results show that the ΔD of the H2 layer is the largest, suggesting that the heterogeneity of the stratum in this layer is the most prominent. Thus, the geological and tectonic environment in this layer is the most complex. Meanwhile, the seismic catalog shows that this layer has the most earthquake events. In addition to the first layer, the ΔD value in H3 (14.5~21.5 km) in the western area of Taiwan is larger than that in the eastern region, and the ΔD values in other deep layers in the eastern region are larger than those in the west. This finding indicates that the geological and tectonic environment in eastern Taiwan is more complex than that in the west and that the level of seismic activity is also higher in eastern Taiwan.
To estimate a more up-to-date and reliable statistical relation between two seismotectonic parameters b and ΔD values, linear regression is preferred. The relationship of ΔD = 1.5 × b − 0.68 is suggested with a strong enough positive correlation (r = 0.84) for Taiwanese earthquake distributions. For the Taiwan earthquake area at different depths, the b values range from 0.65~1.3, while the ΔD values range from 0.2~1.5.

Author Contributions

The first author Chun Hui is a major contributor to the paper and responsible for the core writing of the paper. The corresponding author Changxiu Cheng is another major contributor to the paper and mainly responsible for the direction of research and modifying the paper. The other two authors, Lixin Ning and Jing Yang, provided opinions on the article’s revision and collected some of the data. All authors have read and agreed to the published version of the manuscript.

Funding

National Natural Science Foundation of China, Grant No. 41771537.

Acknowledgments

This research was supported by the National Natural Science Foundation of China (Grant No. 41771537). The authors thank the editors of the journal and reviewers for their constructive comments and American Journal Experts (AJE) for polishing the language of this article.

Conflicts of Interest

The authors declare no conflict of interest.

References

  1. Hirata, T. A correlation between the b-value and the fractal dimension of earthquakes. J. Geophys. Res. 1989, 94, 7507–7514. [Google Scholar] [CrossRef]
  2. Öncel, A.O.; Wilson, T.H. Anomalous seismicity preceding the 1999 Izmit event, NW Turkey. Geophys. J. Int. 2007, 169, 259–270. [Google Scholar] [CrossRef] [Green Version]
  3. Öztürk, S. Characteristics of seismic activity in the Western, Central and Eastern parts of the North Anatolian Fault Zone, Turkey: Temporal and spatial analysis. Acta Geophys. 2011, 59, 209–238. [Google Scholar] [CrossRef]
  4. Öztürk, S. A study on the correlations between seismotectonic b-value and Dc-value, and seismic quiescence Z-value in the Western Anatolian region of Turkey. Aust. J. Earth Sci. 2015, 108, 172–184. [Google Scholar] [CrossRef]
  5. Woessner, J.; Wiemer, S. Assessing the quality of earthquake catalogues: Estimating the magnitude of completeness and its uncertainty. Bull. Seismol. Soc. Am. 2005, 95, 684–698. [Google Scholar] [CrossRef]
  6. Öztürk, S. Earthquake hazard potential in the Eastern Anatolian Region of Turkey: Seismotectonic b and Dc-values and precursory quiescence Z-value. Front. Earth Sci. 2018, 12, 215–236. [Google Scholar] [CrossRef]
  7. Wang, J.H.; Lee, C.W. Multifractal measures of earthquakes in west Taiwan. Pure Appl. Geophys. 1996, 146, 131–145. [Google Scholar] [CrossRef]
  8. Chen, S.J.; David, H.; Ma, L.; Wang, L.F. Research on the multifractal characteristics of the temporal-spatial distribution of earthquakes over New Zealand area. Acta Seismol. Sin. 2003, 16, 312–322. [Google Scholar] [CrossRef]
  9. Pastén, D.; Muñoz, V.; Cisternas, A.; Rogan, J.; Valdivia, J.A. Monofractal and multifractal analysis of the spatial distribution of earthquakes in the central zone of Chile. Phys. Rev. E 2011, 84, 066123. [Google Scholar] [CrossRef] [PubMed]
  10. Balcerak, E. Seismic quiescence before the 2003 Tokachi-oki earthquake. Eos Trans. Am. Geophys. Union 2012, 93, 16. [Google Scholar] [CrossRef]
  11. Kagan, Y. Universality of the seismic moment-frequency relation. Pure Appl. Geophys. 1999, 155, 537–573. [Google Scholar] [CrossRef]
  12. Evernden, J. Study of regional seismicity and associated problems. Bull. Seismol. Soc. Am. 1970, 60, 393–446. [Google Scholar]
  13. Lay, T.; Wallace, T.C. Modern Global Seismology; Academic Press: Cambridge, MA, USA, 1995; p. 393. [Google Scholar]
  14. Schorlemmer, D.; Wiemer, S.; Wyss, M. Variations in earthquake-size distribution across different stress regimes. Nature 2005, 437, 539–542. [Google Scholar] [CrossRef] [PubMed]
  15. Ogata, Y.; Katsura, K. Analysis of temporal and spatial heterogeneity of magnitude frequency distribution inferred from earthquake catalogues. Geophys. J. Int. 1993, 113, 727–738. [Google Scholar] [CrossRef] [Green Version]
  16. Gulia, L.; Wiemer, S. Real-time discrimination of earthquake foreshocks and aftershocks. Nature 2019, 574, 193–199. [Google Scholar] [CrossRef] [PubMed]
  17. Amitrano, D. Brittle-ductile transition and associated seismicity: Experimental and numerical studies and relationship with the b value. J. Geophys. Res. Solid Earth 2003, 108, 2044–2050. [Google Scholar] [CrossRef] [Green Version]
  18. Goebel, T.H.W.; Schorlemmer, D.; Becker, T.W.; Dresen, G.; Sammis, C.G. Acoustic emissions document stress changes over many seismic cycles in stick-slip experiments. Geophys. Res. Lett. 2013, 40, 2049–2054. [Google Scholar] [CrossRef] [Green Version]
  19. Sarlis, N.V.; Skordas, E.S.; Varotsos, P.A.; Nagao, T.; Kamogawa, M.; Tanaka, H.; Uyeda, S. Minimum of the order parameter fluctuations of seismicity before major earthquakes in Japan. Proc. Natl. Acad. Sci. USA 2013, 110, 13734–13738. [Google Scholar] [CrossRef] [PubMed] [Green Version]
  20. Xie, W.Y.; Hattori, K.; Han, P. Temporal Variation and Statistical Assessment of the b Value off the Pacific Coast of Tokachi, Hokkaido, Japan. Entropy 2019, 21, 249. [Google Scholar] [CrossRef] [Green Version]
  21. Aki, K. A probabilistic synthesis of precursory phenomena. Earthq. Predict. Int. Rev. 1981, 4, 566–574. [Google Scholar]
  22. Wang, J.H.; Lin, W.H. A Fractal Analysis of Earthquakes in West Taiwan. Terr. Atmos. Ocean. Sci. 1993, 4, 457–462. [Google Scholar] [CrossRef]
  23. Legrand, D. Fractal Dimensions of Small, Intermediate, and Large Earthquakes. Bull. Seismol. Soc. Am. 2002, 92, 3318–3320. [Google Scholar] [CrossRef]
  24. Öncel, A.O.; Wilson, T.H. Correlation of seismotectonic variables and GPS strain measurements in western Turkey. J. Geophys. Res. Solid Earth 2004, 109, B11306. [Google Scholar]
  25. Wang, J.H.; Chen, K.C.; Leu, P.L.; Chang, J.H. b-Values Observations in Taiwan: A Review. Terr. Atmos. Ocean. Sci. 2015, 26, 475–492. [Google Scholar] [CrossRef] [Green Version]
  26. Mandal, P.; Rastogi, B.K. Self-organized fractal seismicity and b value of aftershocks of the 2001 Bhuj earthquake in Kutch (India). Pure Appl. Geophys. 2005, 162, 53–72. [Google Scholar] [CrossRef]
  27. Hattori, K. ULF geomagnetic changes associated with large earthquakes. Terr. Atmos. Ocean. Sci. 2004, 15, 329–360. [Google Scholar]
  28. Suppe, J. Mechanism of mountain building and metamorphism in Taiwan. Geol. Soc. China Mem. 1981, 4, 67–89. [Google Scholar]
  29. Hsu, Y.J.; Yu, S.B.; Simons, M.; Kuo, L.C.; Chen, H.Y. Interseismic crustal deformation in the Taiwan plate boundary zone revealed by GPS observations, seismicity, and earthquake focal mechanisms. Tectonophysics 2009, 479, 4–18. [Google Scholar] [CrossRef]
  30. Chan, C.H.; Hsu, Y.J.; Wu, Y.M. Possible stress states adjacent to the rupture zone of the 1999 Chi-Chi, Taiwan, earthquake. Tectonophysics 2012, 541–543, 81–88. [Google Scholar] [CrossRef]
  31. Wu, Y.M.; Chang, C.H.; Zhao, L.; Teng, T.L.; Nakamura, M. A comprehensive relocation of earthquakes in Taiwan from 1991 to 2005. Bull. Seismol. Soc. Am. 2008, 98, 1471–1481. [Google Scholar] [CrossRef] [Green Version]
  32. Mignan, A.; Werner, M.; Wiemer, S.; Chen, C.C.; Wu, Y.M. Bayesian estimation of the spatially varying completeness magnitude of earthquake catalogs. Bull. Seismol. Soc. Am. 2011, 101, 1371–1385. [Google Scholar] [CrossRef]
  33. Angelier, J.; Barrier, E.; Chu, H.T. Plate collision and paleostress trajectories in a fold-thrust belt: The foothills of Taiwan. Tectonophysics 1986, 125, 161–178. [Google Scholar] [CrossRef]
  34. Suppe, J.; Hu, C.T.; Chen, Y.J. Preset-day stress directions in western Taiwan inferred from borehole elongation. Pet. Geol. Taiwan 1985, 21, 1–12. [Google Scholar]
  35. Chang, C.P.; Chang, T.Y.; Angelier, J.; Kao, H.; Lee, J.C.; Yu, S.B. Strain and stress field in Taiwan oblique convergent system: Constraints from GPS observation and tectonic data. Earth Planet. Sci. Lett. 2003, 214, 115–127. [Google Scholar] [CrossRef]
  36. Yeh, Y.H.; Barrier, E.; Lin, C.H.; Angelier, J. Stress tensor analysis in the Taiwan area from focal mechanisms of earthquakes. Tectonophysics 1991, 200, 267–280. [Google Scholar]
  37. Wu, Y.M.; Hsu, Y.J.; Chang, C.H.; Teng, L.S.; Nakamura, M. Temporal and spatial variation of stress field in Taiwan from 1991 to 2007: Insights from comprehensive first motion focal mechanism catalog. Earth Planet. Sci. Lett. 2010, 298, 306–316. [Google Scholar] [CrossRef]
  38. Chen, H.Y.; Kuo, L.C.; Yu, S.B. Coseismic movement and seismic ground motion associated with the 31 March 2002 Hualien “331” earthquake. Terr. Atmos. Oceans Sci. 2004, 15, 683–695. [Google Scholar] [CrossRef] [Green Version]
  39. Hu, J.C.; Cheng, L.W.; Chen, H.Y.; Wu, Y.M.; Lee, J.C.; Chen, Y.G.; Lin, K.C.; Rau, R.J.; Kuochen, H.; Chen, H.H.; et al. Coseismic deformation revealed by inversion of strong motion and GPS data: The 2003 Chengkung earthquake in Taiwan. Geophys. J. Int. 2007, 169, 667–674. [Google Scholar] [CrossRef] [Green Version]
  40. Wu, Y.M.; Chang, C.H.; Zhao, L.; Hsiao, N.C.; Chen, Y.G.; Hsu, S.K. Relocation of the 2006 Pingtung earthquake sequence and seismotectonics in Southern Taiwan. Tectonophysics 2009, 479, 19–27. [Google Scholar] [CrossRef]
  41. Cao, A.; Gao, S.S. Temporal variation of seismic b-values beneath northeastern Japan island arc. Geophys. Res. Lett. 2002, 29, 48-1–48-3. [Google Scholar] [CrossRef]
  42. Wiemer, S.; Wyss, M. Minimum magnitude of completeness in earthquake catalogs: Examples from Alaska, the western United States, and Japan. Bull. Seismol. Soc. Am. 2000, 90, 859–869. [Google Scholar] [CrossRef]
  43. Chan, C.H.; Wu, Y.M.; Tseng, T.L.; Lin, T.L.; Chen, C.C. Spatial and temporal evolution of b-values before large earthquakes in Taiwan. Tectonophysics 2012, 532, 215–222. [Google Scholar] [CrossRef] [Green Version]
  44. Wang, J.H. Depth distribution of shallow earthquakes in Taiwan. J. Geol. Soc. China. 1994, 37, 125–142. [Google Scholar]
  45. Sunmonu, L.A.; Dimri, V.P.; Prakash, M.R.; Bansal, A.R. Multifractal approach to the time series of m ≥ 7.0 earthquake in himalayan region and its vicinity during 1895–1995. J. Geol. Soc. India 2001, 58, 163–169. [Google Scholar]
  46. Gutenberg, B.; Richter, C.F. Earthquake magnitude, intensity, energy, and acceleration. Bull. Seismol. Soc. Am. 1942, 32, 163–191. [Google Scholar]
  47. Noh, M. A parametric estimation of Richter-b and m max from an earthquake catalog. Geosci. J. 2014, 18, 339–345. [Google Scholar] [CrossRef]
  48. Aki, K. Maximum likelihood estimate of b in the formula logN = a − bM and its confidence limits. Bull. Earthq. Res. Inst. Tokyo Univ. 1965, 43, 237–239. [Google Scholar]
  49. A method for determining the value of b in a formula logN = a − bM showing the magnitude frequency relation for earthquakes. Geophys. Bull. Hokkaido Univ. 1965, 13, 99–103.
  50. Yin, L.R.; Li, X.L.; Zheng, W.F.; Yin, Z.; Song, L.H.; Ge, L.J.; Zeng, Q. Fractal dimension analysis for seismicity spatial and temporal distribution in the circum-Pacific seismic belt. J. Earth Syst. Sci. 2019, 128, 22. [Google Scholar] [CrossRef] [Green Version]
  51. Márquez-Rámirez, V.H.; Pichardo, F.A.N.; Reyes-Dávila, G. Multifractality in seismicity spatial distributions: Significance and possible precursory applications as found for two cases in different tectonic environments. Pure Appl. Geophys. 2012, 169, 2091–2105. [Google Scholar] [CrossRef]
  52. Singh, C.; Singh, A.; Chadha, R. Fractal and b-value mapping in Eastern Himalaya and Southern Tibet. Bull. Seismol. Soc. Am. 2009, 99, 3529–3533. [Google Scholar] [CrossRef]
  53. Öncel, A.O.; Alptekin, Ö.; Main, I.G. Temporal variations of the fractal properties of seismicity in the western part of the North Anatolian fault zone: Possible artifacts due to improvements in station coverage. Nonlinear Process. Geophys. 1995, 2, 147–157. [Google Scholar] [CrossRef] [Green Version]
  54. De Rubeis, V.; Dimitriu, P.; Papadimitriou, E.; Tosi, P. Recurrent patterns in the spatial behaviour of Italian seismicity revealed by the fractal approach. Geophys. Res. Lett. 1993, 20, 1911–1914. [Google Scholar] [CrossRef]
  55. Zhu, L.R.; Zhou, S.Y.; Yang, M.L.; Hong, S.Z.; Gong, Y.Q.; Wang, H.T. The Precision Estimate of Multi-Fractal Methods of Time Sequence of Earthquakes. Earthq. Res. China 2000, 14, 47–56. [Google Scholar]
  56. Varotsos, P.A.; Sarlis, N.V.; Skordas, E.S. Order parameter fluctuations in natural time and b-value variation before large earthquakes. Nat. Hazards Earth Syst. Sci. 2012, 12, 3473–3481. [Google Scholar] [CrossRef] [Green Version]
  57. Shi, H.; Meng, L.; Zhang, X.; Chang, Y.; Yang, Z.; Xie, W.; Hattori, K.; Han, P. Decrease in b value prior to the Wenchuan earthquake (M (s) 8.0). Chin. J. Geophys. 2018, 61, 1874–1882. [Google Scholar]
  58. Gulia, L.; Wiemer, S. The influence of tectonic regimes on the earthquake size distribution: A case study for Italy. Geophys. Res. Lett. 2010, 37, L10305. [Google Scholar] [CrossRef]
  59. Scholz, C.H. The frequency magnitude relation of microfracturing in rock and its relation to earthquakes. Bull. Seismol. Soc. Am. 1968, 58, 399–415. [Google Scholar]
  60. Spada, M.; Tormann, T.; Wiemer, S.; Enescu, B. Generic dependence of the frequency-size distribution of earthquakes on depth and its relation to the strength profile of the crust. Geophys. Res. Lett. 2013, 40, 709–714. [Google Scholar] [CrossRef] [Green Version]
  61. Wiemer, S.; Wyss, M. Mapping the frequency-magnitude distribution in asperities: An improved technique to calculate recurrence times? J. Geophys. Res. Solid Earth 1997, 102, 15115–15128. [Google Scholar] [CrossRef]
  62. Grassberger, P.; Procaccia, I. Measuring the strangeness of strange attractors. Phys. D Nonlinear Phenom. 1983, 9, 189–208. [Google Scholar] [CrossRef]
  63. Khan, P. Mapping of b-value beneath the Shillong Plateau. Gondwana Res. 2005, 8, 271–276. [Google Scholar] [CrossRef]
  64. Pailoplee, S.; Choowong, M. Earthquake frequency-magnitude distribution and fractal dimension in mainland Southeast Asia. Earth Planets Space 2014, 66, 8. [Google Scholar] [CrossRef] [Green Version]
Figure 1. Topographic map of the sea floor around Taiwan. The area outlined in pink is the study area.
Ijgi 09 00384 g001
Figure 2. Variations of magnitude completeness MC value from 1995 to 2019 in the Taiwan region. Standard deviation (δMC) of the completeness (dashed lines) is also given. MC is plotted for overlapping samples, each containing 200 events.
Ijgi 09 00384 g002
Figure 3. Cumulative number plots of the earthquakes versus time for all events with M ≥ 1.0 and declustered events with M ≥ 3 in the Taiwan region.
Ijgi 09 00384 g003
Figure 4. The change state of the fractal curve over time from 1998 to 2018 in the Taiwan region when q is taken from −5 to 5.
Ijgi 09 00384 g004
Figure 5. Magnitude distribution as a function of time for earthquakes occurred in the Taiwan region from 1995 to 2019.
Ijgi 09 00384 g005
Figure 6. Distribution of the seismic events in different depth layers.
Ijgi 09 00384 g006
Figure 7. Variations in the generalized dimension Dq with respect to q in different depth layers.
Ijgi 09 00384 g007
Figure 8. Study area and results from the tri-class seismic source model in different depth layers (ΔD) (a) represents the zones of different tectonic features; (b) represents the study area (ΔD); (c) represents the east and west seismic tectonic zones (ΔD), and (d) represents the different zones of tectonic features (ΔD). The shades of red indicate the value of ΔD, and gray indicates areas that do not have data).
Ijgi 09 00384 g008
Figure 9. Relationship between the b value of the Gutenberg–Richter relation and the ΔD of the multifractal. (a) represents the relationship of regression fit between b and ΔD values; (b) represents the specific range of b and ΔD values.
Ijgi 09 00384 g009
Table 1. ΔD and b values at different depths.
DepthΔDb
H11.331.17 ± 0.01
H21.141.29 ± 0.01
H30.781.17 ± 0.02
H40.610.98 ± 0.02
H50.900.87 ± 0.02