Article

Implementation and Evaluation of a Fast Area Feature Labeling Method Using Auxiliary Lines †

Faculty of Information and Communication Engineering, Osaka Electro-Communication University, Osaka 572-8530, Japan
*
Author to whom correspondence should be addressed.
This paper is an extended version of our conference paper: Abe, N.; Kuroda, K.; Kamata, Y.; Midoritani, S. A Fast Area Labeling Method using Auxiliary Lines. In Applied Computing & Information Technology, Proceedings of the 5th International Conference on Applied Computing and Information Technology (ACIT 2017), 9–13 July 2017; Lee, R. Eds.; Springer: New York, NY, USA, 2017; pp. 91–101.
ISPRS Int. J. Geo-Inf. 2020, 9(9), 529; https://doi.org/10.3390/ijgi9090529
Submission received: 16 July 2020 / Revised: 26 August 2020 / Accepted: 31 August 2020 / Published: 2 September 2020

Abstract

:
Appropriate place labels, which provide the name or attribute of a graphical feature, are important in geographical information systems and cartography. Herein, an internal label placement method was proposed for area features, such as cities, prefectures, and lakes, on a map. For internal label placement, placing a large label for an extremely narrow or small area, such that the label does not protrude from the corresponding area is challenging. In such cases, a label can overlap with protruding labels from other areas. Meanwhile, tablet devices have been rapidly employed in recent years. Because tablet devices can easily zoom in on a map, it is possible to eliminate the overlaps by enlarging the map without changing the label size. Therefore, we proposed a method that enables real-time processing, even on tablet devices. The label positions are determined by detecting the intersections of the auxiliary and boundary lines of a given area feature. The proposed method adequately labels the positions of area features, even those with indents and narrow sections. Moreover, it can find tens of thousands of label positions within 100 ms, even on low-performance computers, such as tablet devices.

1. Introduction

This paper proposes a real-time method for placing the labels of area features, such as cities, prefectures, and lakes on a map displayed on a tablet device screen. Each area feature A is described by a polygon and it is assigned a label of specified size, which corresponds to a name or attribute. The proposed method places the label inside the corresponding area feature A. Moreover, it can find an adequate label position even for area features with indents and narrow sections. The appropriate placement of graphical feature labels is important for geographical information systems and cartography. A label placement inside A should avoid the near-boundary regions or narrow sections of A. Placing most of the label outside A is also undesired, but may be unavoidable when A is very small.
Tablet devices have rapidly spread in recent years. Tablet devices can easily zoom in and out of a map, necessitating a fast determination of the label positions. In industrial applications, an area feature labeling method should satisfy the following conditions [1].
  • Capability of real-time processing on tablet devices, i.e., all label positions of the area features in the display frame should be defined within 100 ms.
  • Effective label placement (in both wholly and partially displayed areas), preferably near the centroid of a large convex polygon in the area.
Note that overlapping labels should also be avoided, although overlaps can be eliminated by magnifying the map on the tablet device.
Map features are usually classified into three types: point features, line features, and area features. Among the many methods proposed for point feature labeling [2,3,4,5,6,7,8,9,10,11,12,13,14,15,16,17,18,19,20], the following two models are commonly used.
(a)
The fixed-position model, which places each point feature label, such that one fixed point on its boundary touches the corresponding point feature.
(b)
The slider model, which allows continuous sliding of the label in one or more directions under one constraint: the label boundary must touch the corresponding point feature.
Real-time processing of model (a) has been attempted [12,13,14]. Kameda and Imai [15] presented methods for both point feature and line feature labeling, and Zhang and Harrie [16] developed similar methods for real-time processing. The real-time method of Zhang and Harrie [17] places labels for the point and line features, and icons for the area feature. The icons are placed at randomly selected locations using leader lines.
By contrast, to date, area feature labeling has received little attention (See similar descriptions in [18,21], which have been published recently). The methods of Aonuma et al. [22], Barrault [23], Dorschlag et al. [24], and Lu et al. [18] employ the skeleton of an area. Lu et al.’s method also places point and line feature labels. The skeleton is derived by Voronoi diagrams (or Delaunay triangles). These methods are unsuitable for real-time processing of areas with many boundary lines, because their Voronoi diagrams must be drawn from all endpoints of the boundary lines of A, which significantly increases the execution time. Kakoulis and Tollis [19] and Wagner et al. [20] proposed methods for placing area, point, and line feature labels. Both of the methods first create several candidate label positions (hereafter referred to as label candidates) for each feature. Appropriate label candidates are essential for effective label placement in these methods, but a process that creates good label candidates for given areas has not been described in detail. An alternative method by Edmondson et al. [25] quasi-randomly generates the area feature label candidates for placing area, point, and line features. This method requires creating many label candidates for good area feature labeling, which increases the execution time. The methods of van Roessel [26] and Pinto and Freeman [27] are also known, but they are time consuming. Rylov et al. [21] proposed an efficient method that places labels outside the area, which differs from our objective.
In this study, we propose a real-time internal label placement method for area features. For internal label placement, it is difficult to place a large label for an extremely narrow area, such as Republic of Chile, or an extremely small area, such that the label does not protrude from the corresponding area. Even with an outstanding method, such as the methods that employ the skeleton of the area [18,22,23,24], a label can overlap with protruding labels from other areas. To address this problem, the rapid use of tablet devices provides one suggestion. Because tablet devices can easily zoom in on a map, it is possible to eliminate the overlaps by enlarging the map without changing the label size. Moreover, it is desirable to immediately replace the labels. However, most tablet devices have poor performance. Therefore, we propose an internal label placement method for area features that enables real-time processing, even on tablet devices. The proposed method is a sublinear time algorithm if appropriate preprocessing is employed. Overlapping can be eliminated by enlarging; however, it is desirable to achieve minimum overlapping even without enlarging. Moreover, each label must be placed in an adequate position to easily identify its corresponding area. Thus, in this study, the real-time applicability is the most important goal, followed by the appropriateness of the label placement after enlargement, and finally the appropriateness of the label placement without enlargement. The proposed method aims to place the label at a position as close as possible to the centroid of the large convex polygon existing in the area. The appropriate label position is determined from the intersections of auxiliary horizontal and vertical lines and the area boundary lines.
The remainder of this paper is organized, as follows. Section 2 explains the proposed methods and Section 3 presents the experimental results. Section 4 demonstrates the proposed method on partial displays of the target area. This section also considers areas with inclusion relationships, such as cities within prefectures. Conclusions are presented in Section 5.

2. Proposed Method

This Section presents a simple and fast area feature labeling method and discusses its limitations. It then introduces the proposed method and the preprocessing steps that accelerate the method. Finally, it describes the algorithm of the proposed method.

2.1. A Simple and Fast Method

In the simple and fast approach, labels are positioned at the center of the minimum bounding rectangle of each A. This method frequently achieves good label placement in areas hat form a convex polygon (Figure 1a), but in areas forming a concave polygon, it often places the label in a narrow section (Figure 1b), or even outside the area (Figure 1c).

2.2. Proposed Label Placement Method

The proposed area feature labeling method employs the distances between the intersections of some auxiliary lines and the boundary lines of A. Note that auxiliary lines can be horizontal or vertical.
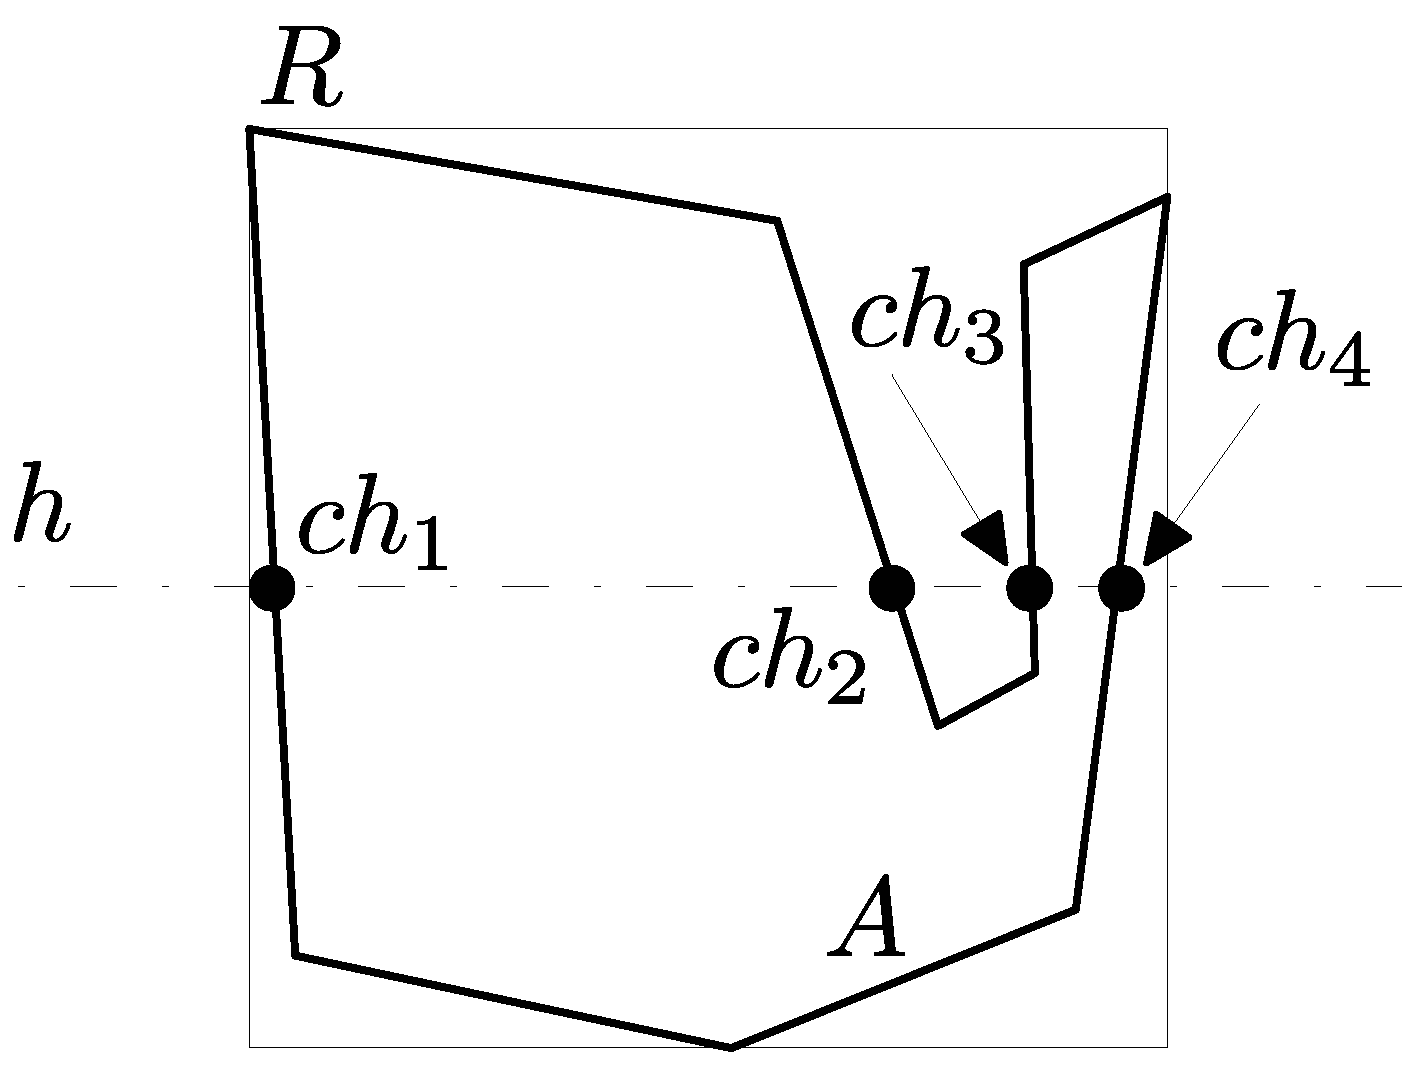
Assuming that area A is wholly displayed, the proposed method first finds the minimum bounding rectangle R of A (see Figure 2). This process can be sped up by a preprocessing step that stores the left-, right-, top-, and bottom-most endpoints of the boundary lines of A. In Figure 2, the auxiliary line h (dashed-dotted line) bisects R horizontally, and intersects the boundary lines of A at four points. The intersection points are designated c h 1 , c h 2 , c h 3 , and c h 4 . Here, let k be the number of intersections and i be an odd number less than k. Note that k is always even, and each line segment c h i c h i + 1 ¯ exists inside A. We then find the i with the longest c h i c h i + 1 ¯ among the is, and assign it to m. Note that, in Figure 2, m = 1 .
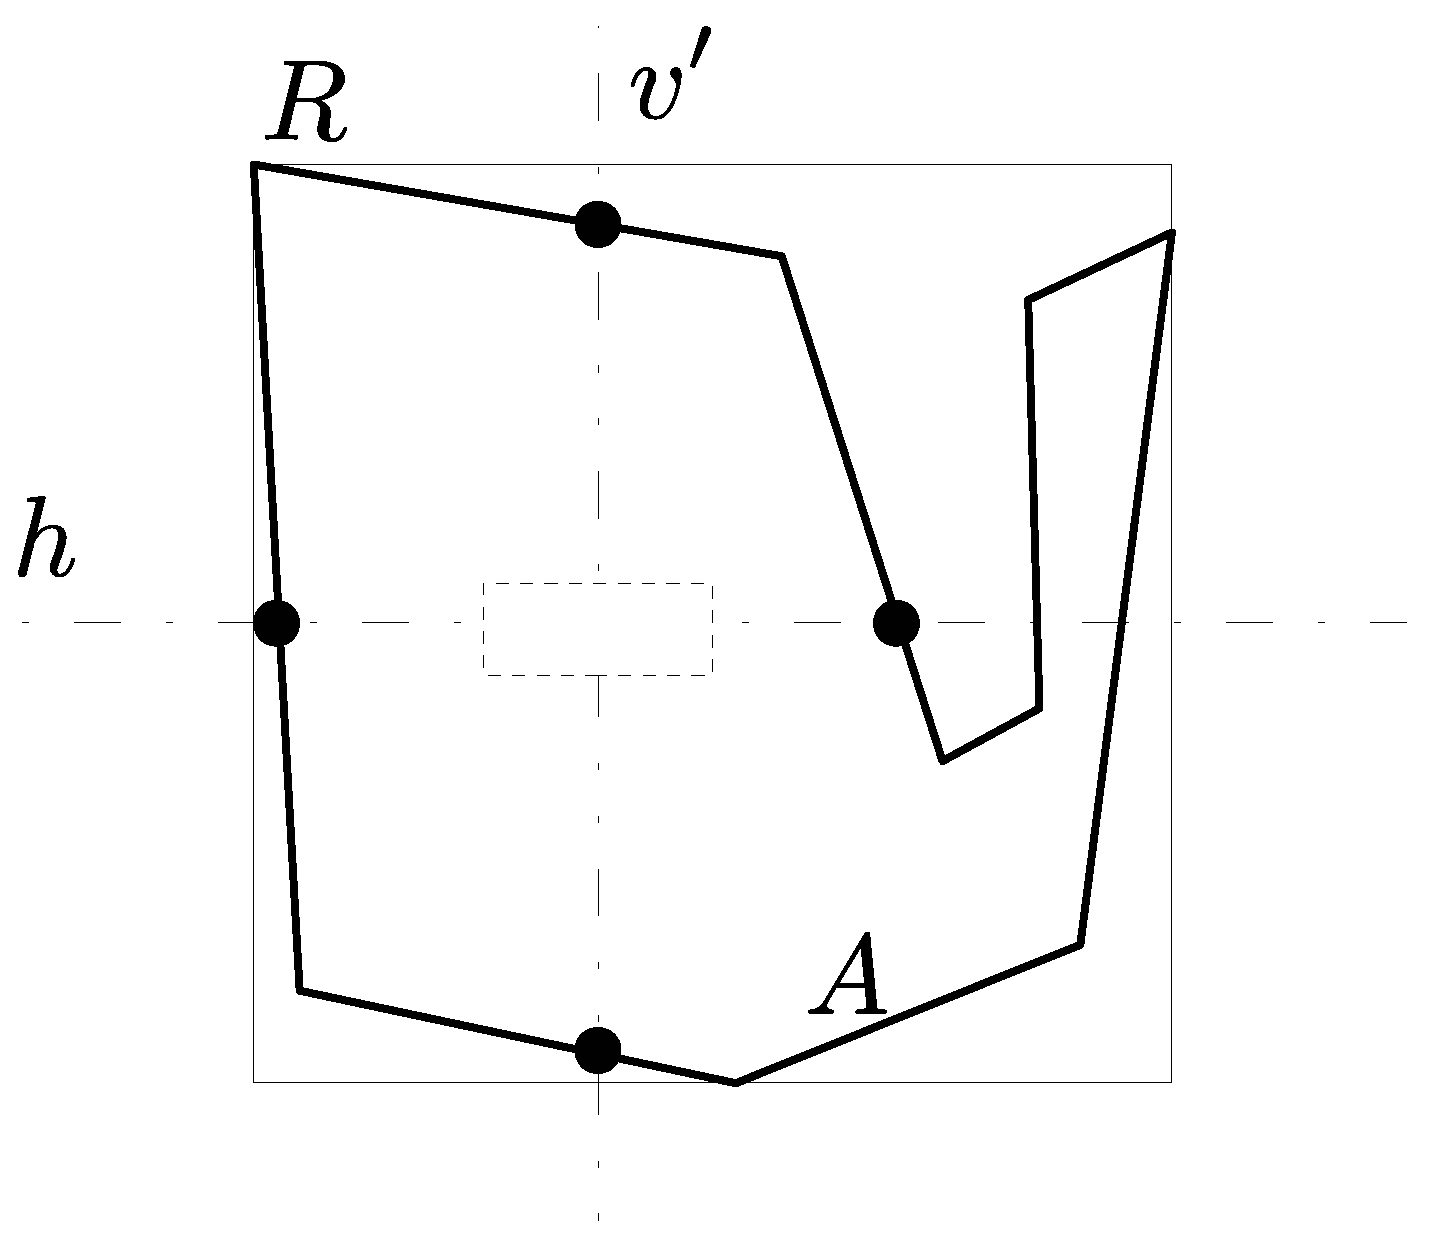
In Figure 3, the vertical line v (dashed double-dotted line) is derived from c h m c h m + 1 ¯ and is drawn through its midpoint. Let c v 1 , c v 2 , ⋯ be the intersections of v and the vertical boundary lines of A, and let j be an odd number. We then find the line segment c v j c v j + 1 ¯ that intersects c h m c h m + 1 ¯ , and create a label candidate (dashed rectangle) at the midpoint of c v j c v j + 1 ¯ . Additional label candidates can be derived from other auxiliary lines (including vertical ones) in the same manner.
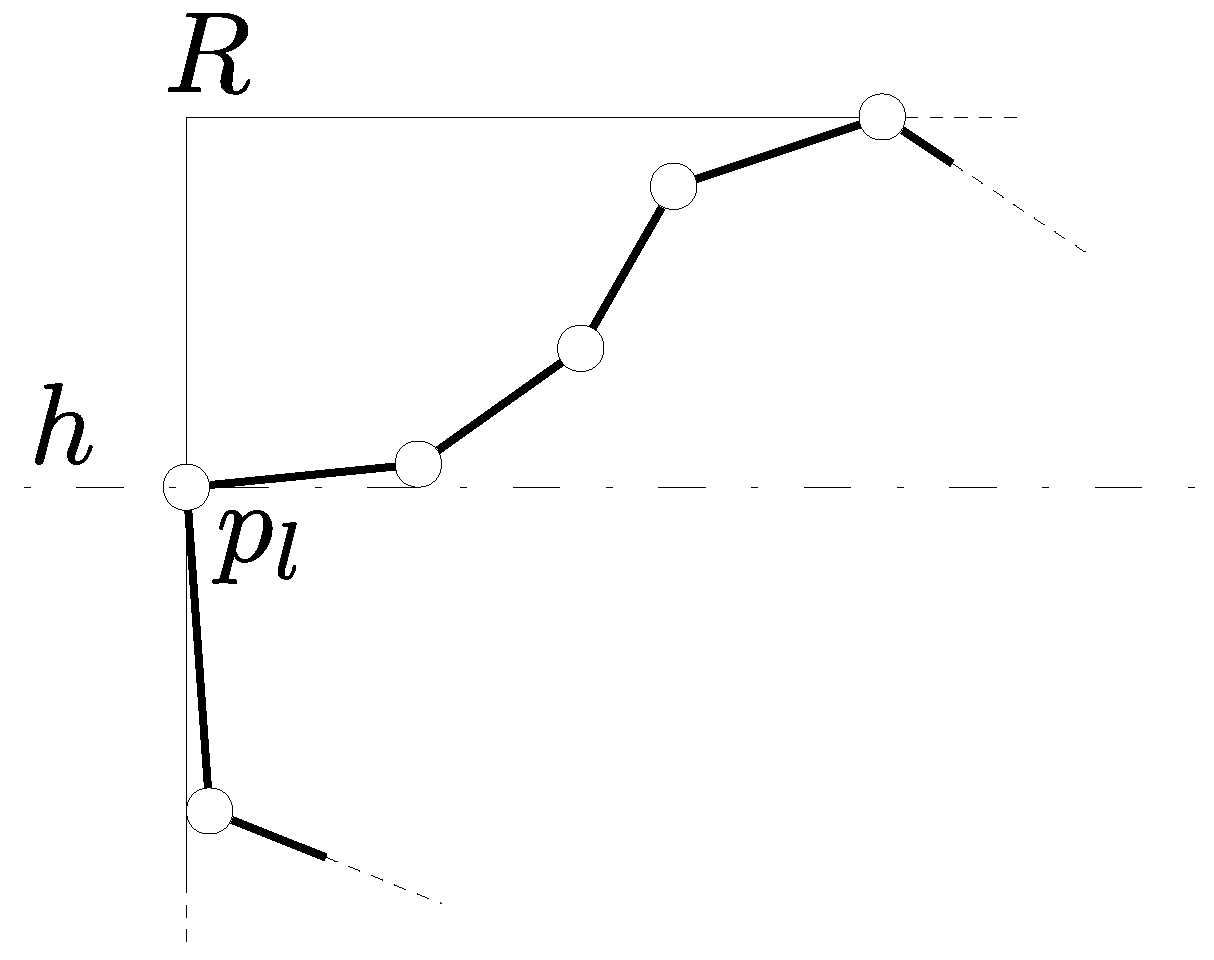
The proposed method selects the final label position from ten label candidates. Three candidates are derived from three horizontal auxiliary lines that quadrisect R, and three are derived from three vertical lines that quadrisect R. The remaining four label candidates are created by considering the shape of A. Two of these candidates are derived from two horizontal auxiliary lines drawn through the left- and right-most endpoints of the boundary lines of A, and two are derived from two vertical lines drawn through the top- and bottom-most endpoints of the boundary lines of A. Figure 4 shows an example of the auxiliary line drawn through the left-most endpoint p l . It is expected that there is at most width of R space on the right-hand side of p l . Thus, these additional label candidates are constructed because wide spaces are expected at the opposite sides of the extrema endpoints.
Let h o r l c and v e r t l c be the horizontal and vertical lines through the midpoint of label candidate l c , respectively. In addition, let L l c be the set of intersections of h o r l c and the boundary lines of A to the left of the midpoint of l c . Similarly, let R l c , A l c , and B l c be the sets of intersections to the right of, above, and below the midpoint of l c , respectively. To select the final label position, the proposed method computes the following distances for each label candidate l c .
d i s t l
Distance between the midpoint of l c and the right-most intersection of L l c .
d i s t r
Distance between the midpoint of l c and the left-most intersection of R l c .
d i s t a
Distance between the midpoint of l c and the bottom-most intersection of A l c .
d i s t b
Distance between the midpoint of l c and the top-most intersection of B l c .
The ratios of d i s t l and d i s t r to the width of the label, and the ratios of d i s t a and d i s t b to the height of the label, are also computed. The smallest of these four ratios defines the flexibility of the label candidate. In the proposed method, the label candidate with maximum flexibility is selected as the final label position.
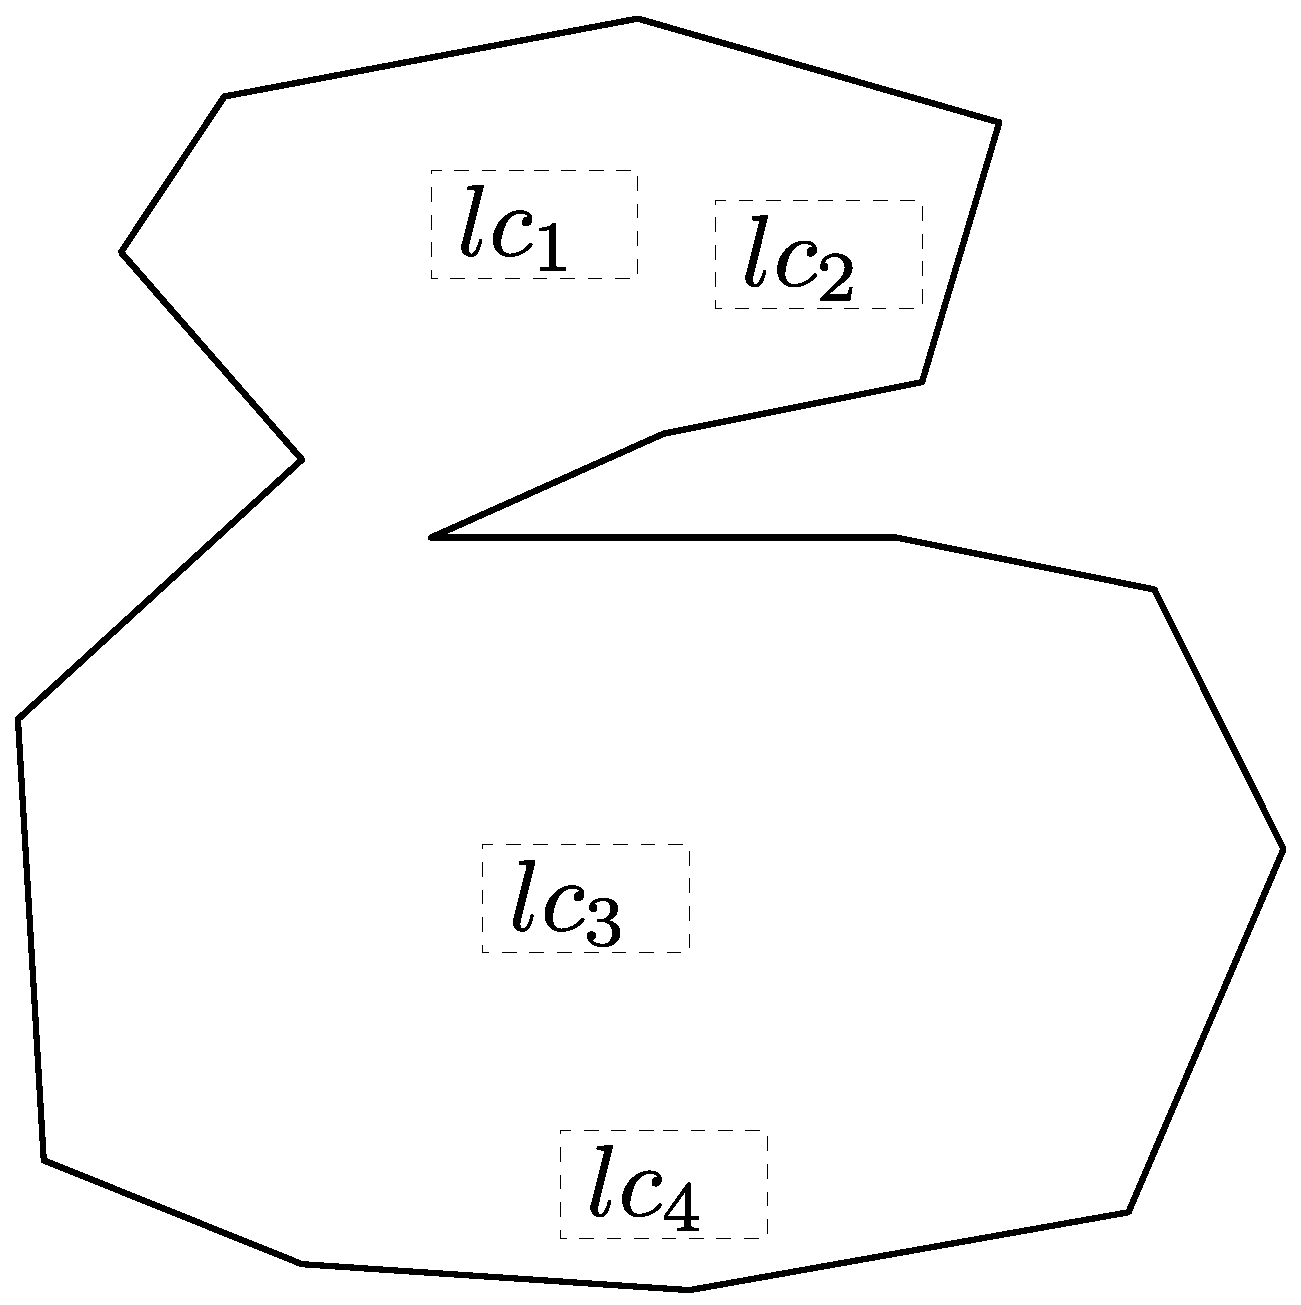
Figure 5 shows an example of label candidates. The proposed method creates ten label candidates; however, for simplicity, we only show four label candidates l c 1 , l c 2 , l c 3 , and l c 4 in the figure. Because l c 2 has a very small d i s t r , it achieves very small flexibility by dividing very small d i s t r by the label width. Similarly, l c 4 achieves very small flexibility by dividing very small d i s t b by the label height. Thus, it is rare that candidates created near-boundary regions of A are selected as the final label positions. Because d i s t l , d i s t r , d i s t a , and d i s t b of l c 3 are all larger than those of l c 1 , the proposed method selects l c 3 as the final label position in the example in this figure. Thus, the candidates created near the centroid of the large convex polygon in A are usually selected as the final label position. Note that because the label height and label width are divisors when calculating the flexibility of label candidates, horizontally (vertically) long convex polygons will be selected for horizontally (vertically) long label positions.

2.3. Preprocessing Steps

This subsection explains the two preprocessing steps that speed up the intersection detection. The first preprocessing step computes the midpoints of the boundary lines of A. The boundary lines are stored in order of horizontal and vertical coordinates of their midpoints. For a very simple example, in Figure 6, horizontal ( p 1 p 4 ¯ , p 1 p 2 ¯ , p 3 p 4 ¯ , p 2 p 3 ¯ ) and vertical ( p 3 p 4 ¯ , p 1 p 4 ¯ , p 2 p 3 ¯ , p 1 p 2 ¯ ) progressions are created.
By executing a binary search on these two progressions, single intersections are quickly found if auxiliary lines intersect the boundary lines of A. The second preprocessing step iterates through the boundary lines of A. For each boundary line b l of A, this step stores all boundary lines of A that partially lie within the horizontal and vertical ranges of b l . For example, in Figure 7, boundary lines p 5 p 6 ¯ , p 6 p 7 ¯ , p 10 p 11 ¯ , and p 11 p 12 ¯ lie partly within the horizontal range of boundary line p 1 p 2 ¯ , so these are stored for p 1 p 2 ¯ in the horizontal direction. In most cases, the number of stored boundary lines is significantly smaller than the total number of boundary lines. By binary-searching for intersections and only considering the stored boundary lines of A, we can detect all intersections quite quickly.

2.4. Algorithm Description

The algorithm of the proposed method is described below.
(1)
Execute the following preprocessing steps.
(1-a)
Store the left-, right-, top-, and bottom-most endpoints of the boundary lines of A.
(1-b)
Store the boundary lines of A in order of horizontal and vertical coordinates of their midpoints.
(1-c)
For each boundary line b l of A, store all boundary lines of A having partial commonality with b l in the horizontal and vertical directions.
(2)
For each auxiliary line, execute the following steps.
(2-a)
Obtain one intersection of the auxiliary line and the boundary lines of A by binary search.
(2-b)
Detect all intersections by considering only the boundary lines stored in step (1-c).
(2-c)
Create a label candidate.
(3)
Select the label candidate with maximum flexibility as the final label position.
We now consider the time complexities of steps (2) and (3), which are involved in real-time processing. Step (2-a) executes in O(log n) time, where n is the total number of b l s. Let s t b l be the number of boundary lines stored for each b l and m a x s t be the maximum number of that. Step (2-b) executes in O( m a x s t ) time, and step (2-c) executes in O( m a x s t log m a x s t ) time because the intersections must be sorted. Although the size of m a x s t is O(n), in most cases, m a x s t is significantly smaller than n. Meanwhile, if an auxiliary line intersects a b l for which many boundary lines are stored, the section near the auxiliary line is usually not suitable for label placement. A typical example is shown in Figure 8. In this figure, the horizontal auxiliary line h intersects boundary lines p a p b ¯ and p c p d ¯ , for which many boundary lines have been stored. Therefore, the vicinity of h is complicated and unsuitable for label placement. To exclude this situation, if step (2-a) obtains an intersection with a boundary line having more than t h stored boundary lines, where t h is some threshold, a label candidate is not created for that auxiliary line. Under this treatment, which little adverse effect on label placement, m a x s t becomes a constant order parameter, so the time complexity of the whole step (2) is O(log n). The number of label candidates is a constant order parameter. Thus, the time complexity of step (3) is O(log n + m a x s t ) if the intersections are found in the same manner as steps (2-a) and (2-b), and it is O(log n) if the aforementioned treatment concerned with t h is used.

3. Computational Experiments

The effectiveness of the proposed method was confirmed in computational experiments. This section explains the experimental conditions, evaluation method, and results of the proposed method.

3.1. Experimental Conditions

As the input, we used fifteen areas obtained from Fundamental Geospatial Data provided by the Geospatial Information Authority of Japan [28]. Each area includes indents or narrow sections, so were unsuitable for label placement by the simple method described in Section 2.1. Here, two label sizes were set, as follows:
(A)
The label height was set to 5% of the height of the corresponding area. The label width was set to the height times l e t / 2 , where l e t is the number of letters in the label.
(B)
The label height was set to 10% of the height of the corresponding area. The label width was set to the height times l e t / 3 .
The experiments were implemented in the C programming language on an Intel Core i7-7700 processor. To examine the behavior on a low-performance computer, such as a tablet device, we set the clock speed to 1.0 GHz.

3.2. Evaluation

We employed a method that enumerates the convex polygons inside an area feature A, which requires significant computational time, in order to evaluate the performance of the proposed method.
The inputs of this method are the coordinates of the boundary lines of area feature A, the label size, and the center coordinates of the label position obtained by the proposed method. First, the label width is increased or decreased to form a square label. Note that this procedure changes the coordinates of the boundary lines and the central label position. Let A denote the area A after size expansion or reduction, which enables a label size-independent evaluation.
Next, starting from one endpoint of a boundary line, the other endpoints are connected in clockwise order by line segments. We denote the starting endpoint by p s and assume that all endpoints p 1 , p 2 , p 3 , ⋯, p s 1 , p s , p s + 1 , ⋯, p n 2 , p n 1 , and p n are in clockwise order. If three or more endpoints are assessed relative to p s , the method examines whether
(i)
the connected endpoints exist inside area A and
(ii)
the connected endpoints form a convex polygon.
If either condition is violated, the method discards the last-assessed endpoint and assesses the next endpoint. For example, suppose that the endpoint p 1 in Figure 9a is the starting endpoint p s . The method first assesses endpoint p 2 , followed by p 3 . It then examines polygon p 1 p 2 p 3 . As seen in Figure 9b, polygon p 1 p 2 p 3 is satisfies both conditions (i) and (ii) above. Next, the method assesses p 4 , but as polygon p 1 p 2 p 3 p 4 violates condition (ii) above (Figure 9c), p 4 is discarded. p 5 is also discarded because polygon p 1 p 2 p 3 p 5 violates both conditions (i) and (ii) above (Figure 9d).
Let p d be the first discarded endpoint that satisfies condition (i), but not condition (ii). In Figure 9, the point p d , which is stored for the next convex polygon to be enumerated, is p 4 . After assessing the endpoints up to p s 1 (up to p n if s = 1 ), the method calculates the size of the obtained convex polygon. This polygon is the first polygon to be enumerated. For the next convex polygon, the method connects p s and p d 1 ( p n if d = 1 ). If p s p d 1 ¯ exists inside A , then p d = p d 1 . Otherwise, the method explores beyond the endpoint of p d 1 until it finds endpoint p d for which p s p d ¯ lies inside A . After finding p d , the method explores beyond the endpoint of p d and creates convex polygons while performing the abovementioned examinations. For example, in Figure 9, p d is p 3 , so the method examines polygon p 1 p 3 p 4 . Throughout this series of examinations, p d is stored for the next convex polygon to be enumerated, as described above. Note that the new candidates p d _ n e w for p d are limited to d _ n e w > d or 1 < d _ n e w < s 1 . The enumeration of the starting endpoint p s terminates when no new p d is stored, or when the endpoints are too few to form a polygon between p d and p s . This process is repeated, sequentially setting each p 1 , p 2 , p 3 , ⋯, p n as the starting endpoint p s .
After enumerating a number of convex polygons, the method finds the largest convex polygon c m , and the largest convex polygon c l containing the central position of the label obtained by the proposed method. Note that, if the long side of the minimum bounding rectangle is more than five times longer than the short side, then the polygon is discarded because such polygons are unsuitable for internal label placement.

3.3. Experimental Results

Let d i s t be the distance between the centroid of c l and the center position of the label obtained by the proposed method and d i a g be the length of the diagonal of the minimum bounding rectangle of A . The experimental results for label sizes (A) and (B) defined in Section 3.1 are shown in Table 1 and Table 2, respectively.
When c l / c m is high, the proposed method places a label inside the large convex polygon. Meanwhile, when d i s t / d i a g is small, the proposed method places a label near the centroid of c l . The influence of label size on label placement was small. Note that the run time excludes the preprocessing steps. The proposed method executed quickly, determining more than ten thousand of label positions in 100 ms, the time limit requested by the employees of the Dawn Corporation. Note that, in 23 out of 30 instances, c l / c m reached 100%.
The minimum c l / c m was 48.2%, and the maximum d i s t / d i a g was 15.29%. Using more auxiliary lines is expected to improve the quality of the label positions. The proposed method uses six auxiliary lines drawn at equal intervals and four auxiliary lines drawn by considering the shape of A, as described in Section 2.2. The label positions of 28 out of 30 instances were derived from the equal-interval auxiliary lines; the remaining two label positions were derived from the shape-based auxiliary lines. This suggests that considering the diversity of positions is beneficial.
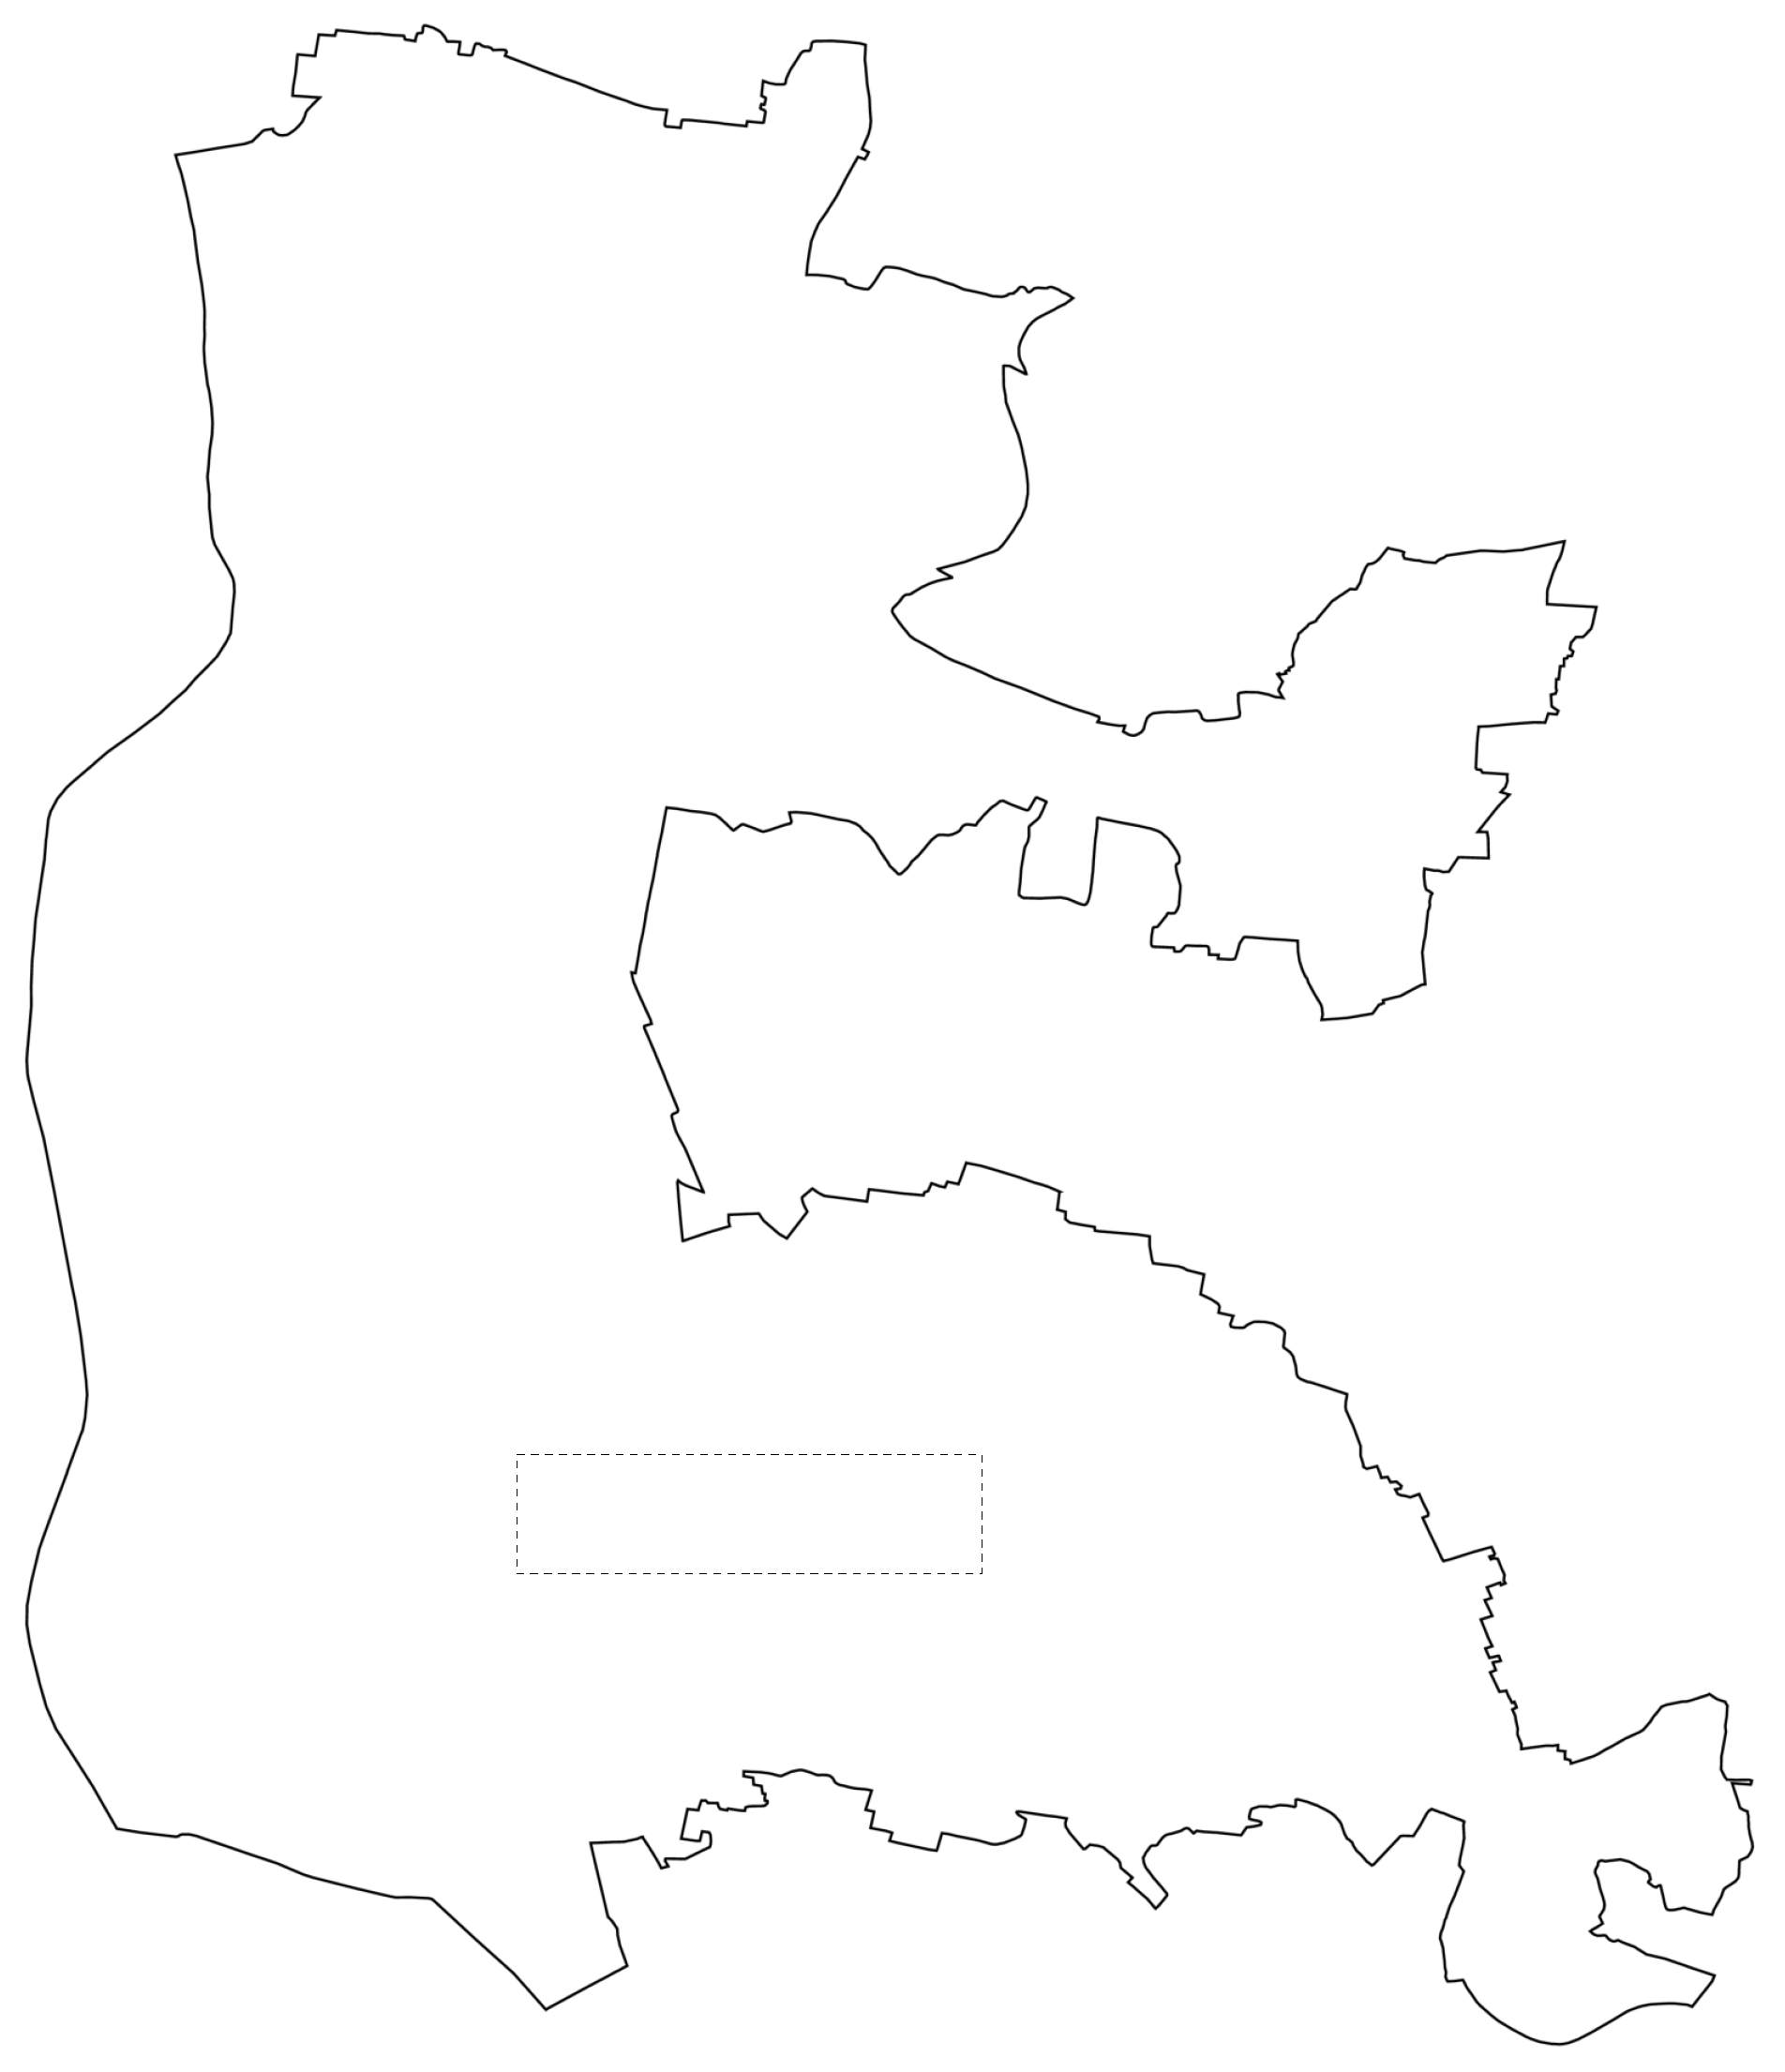
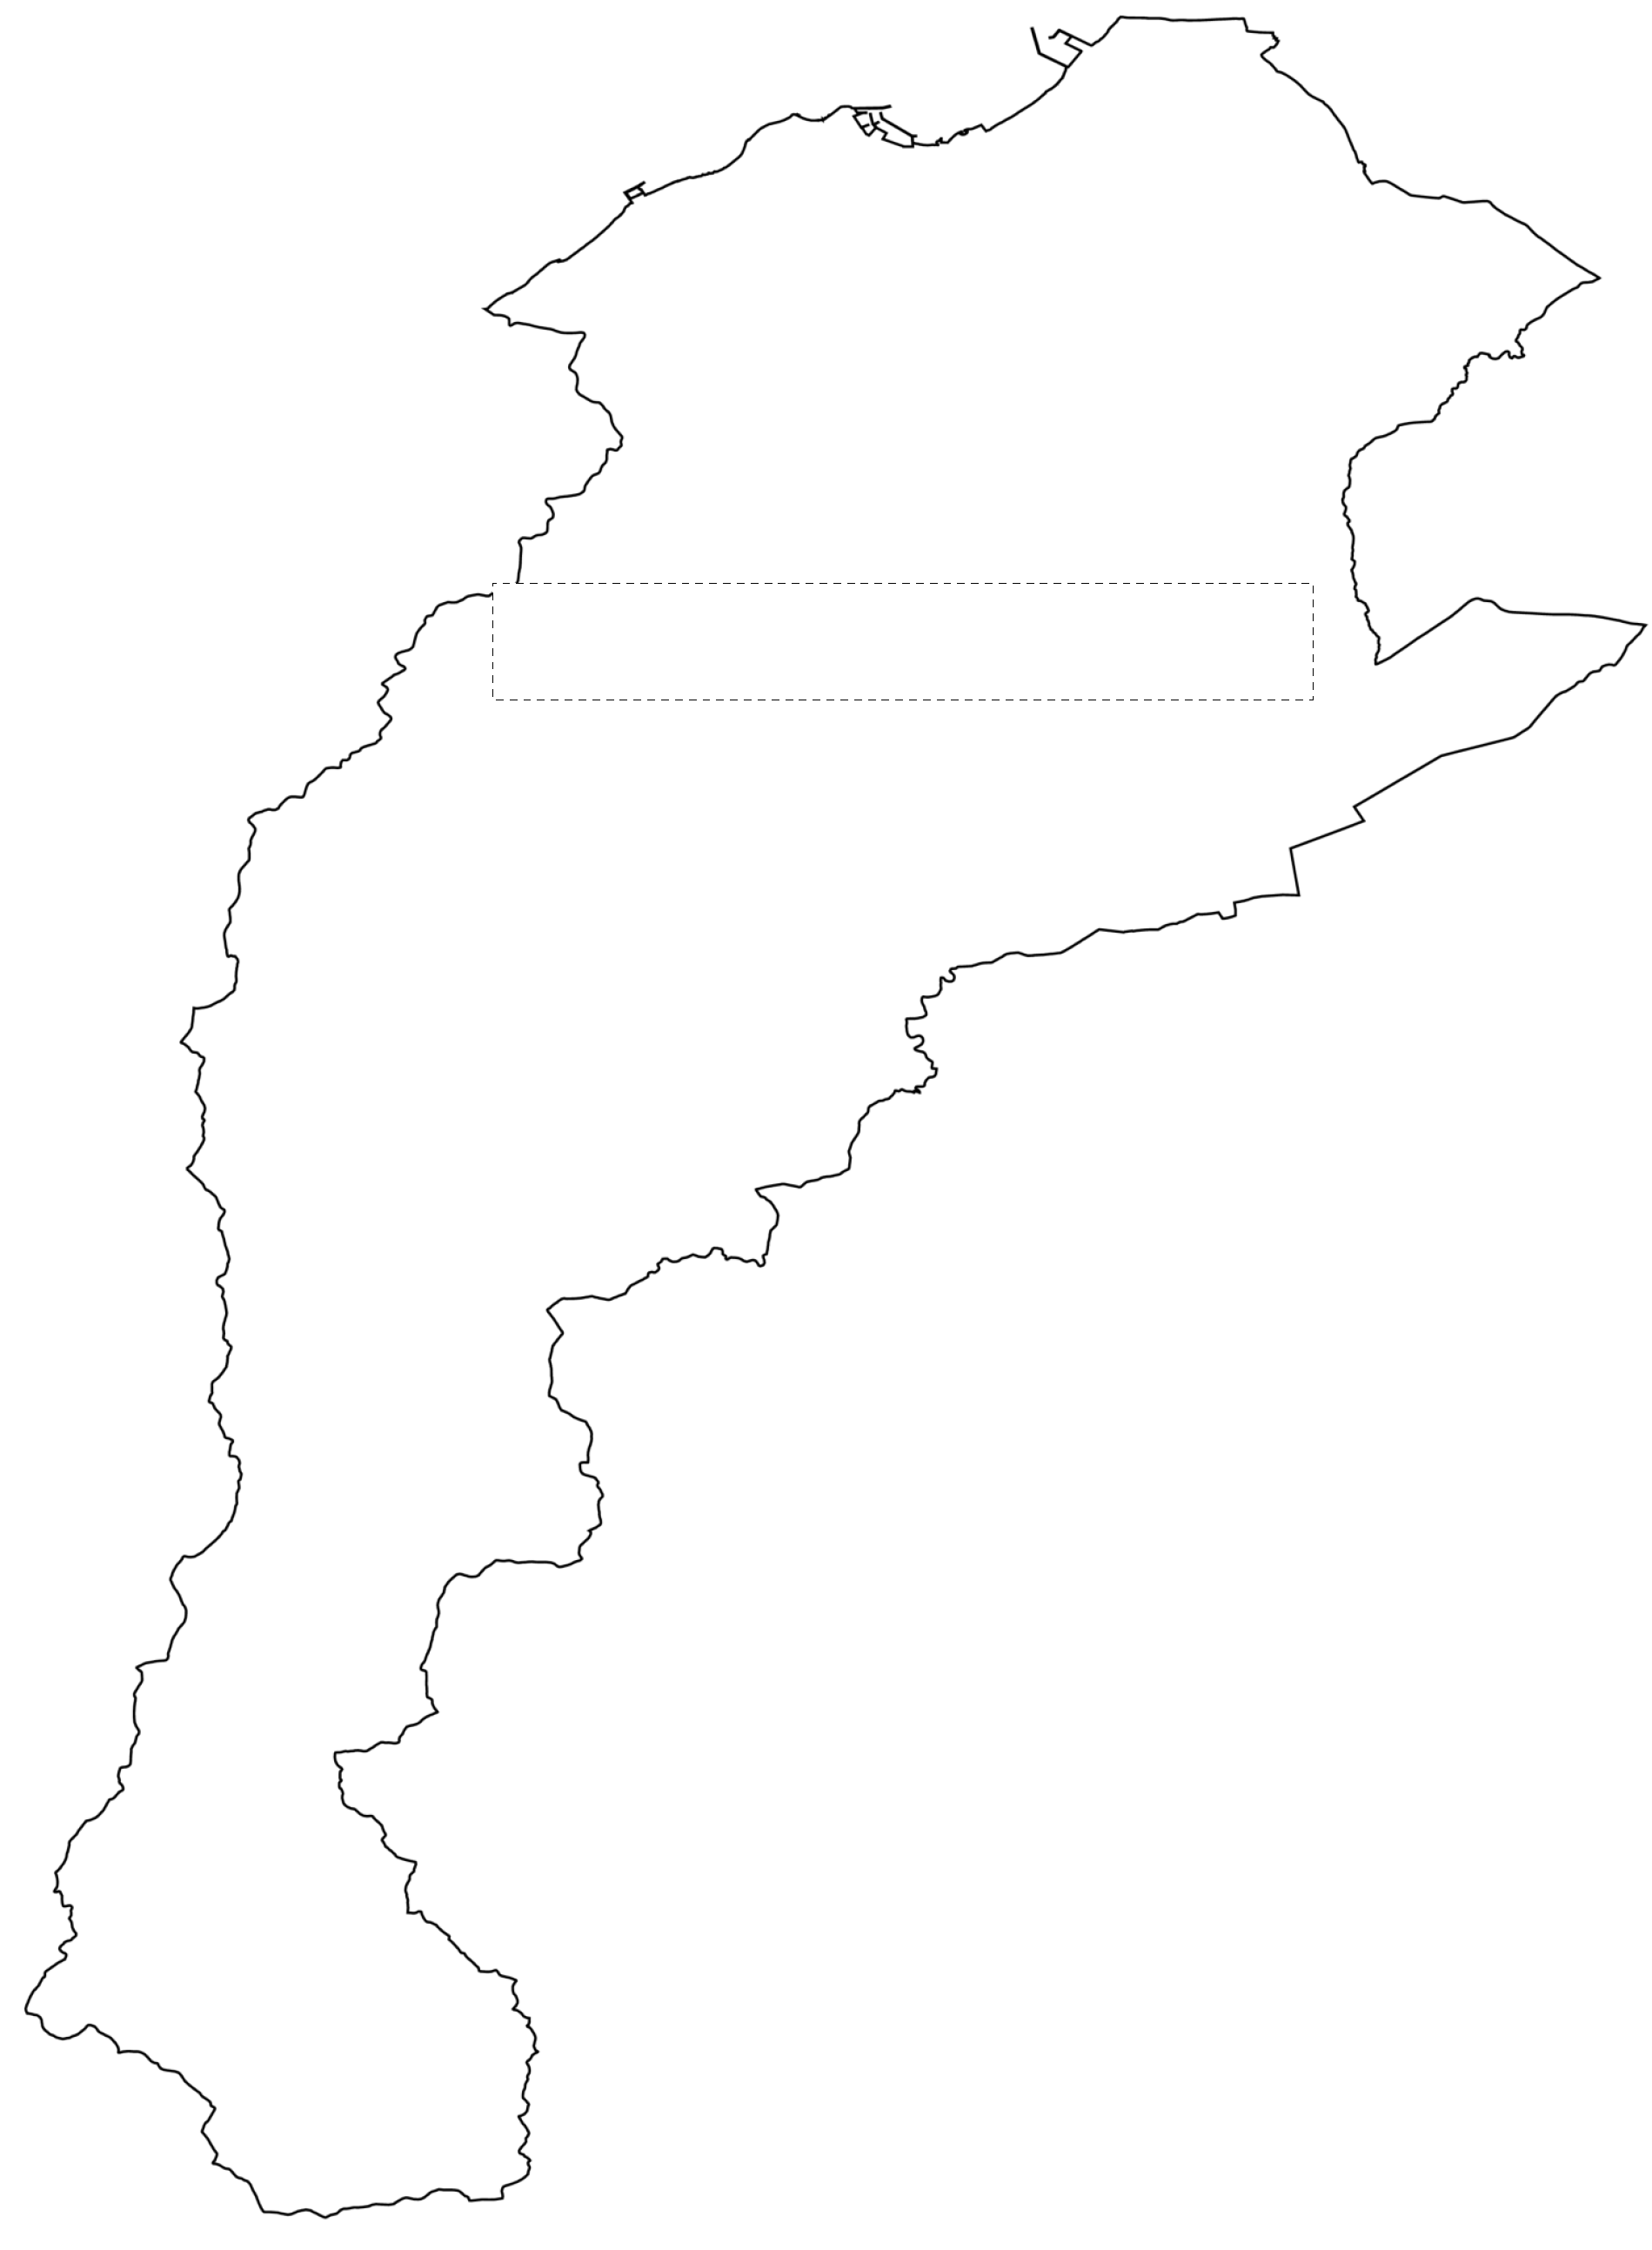
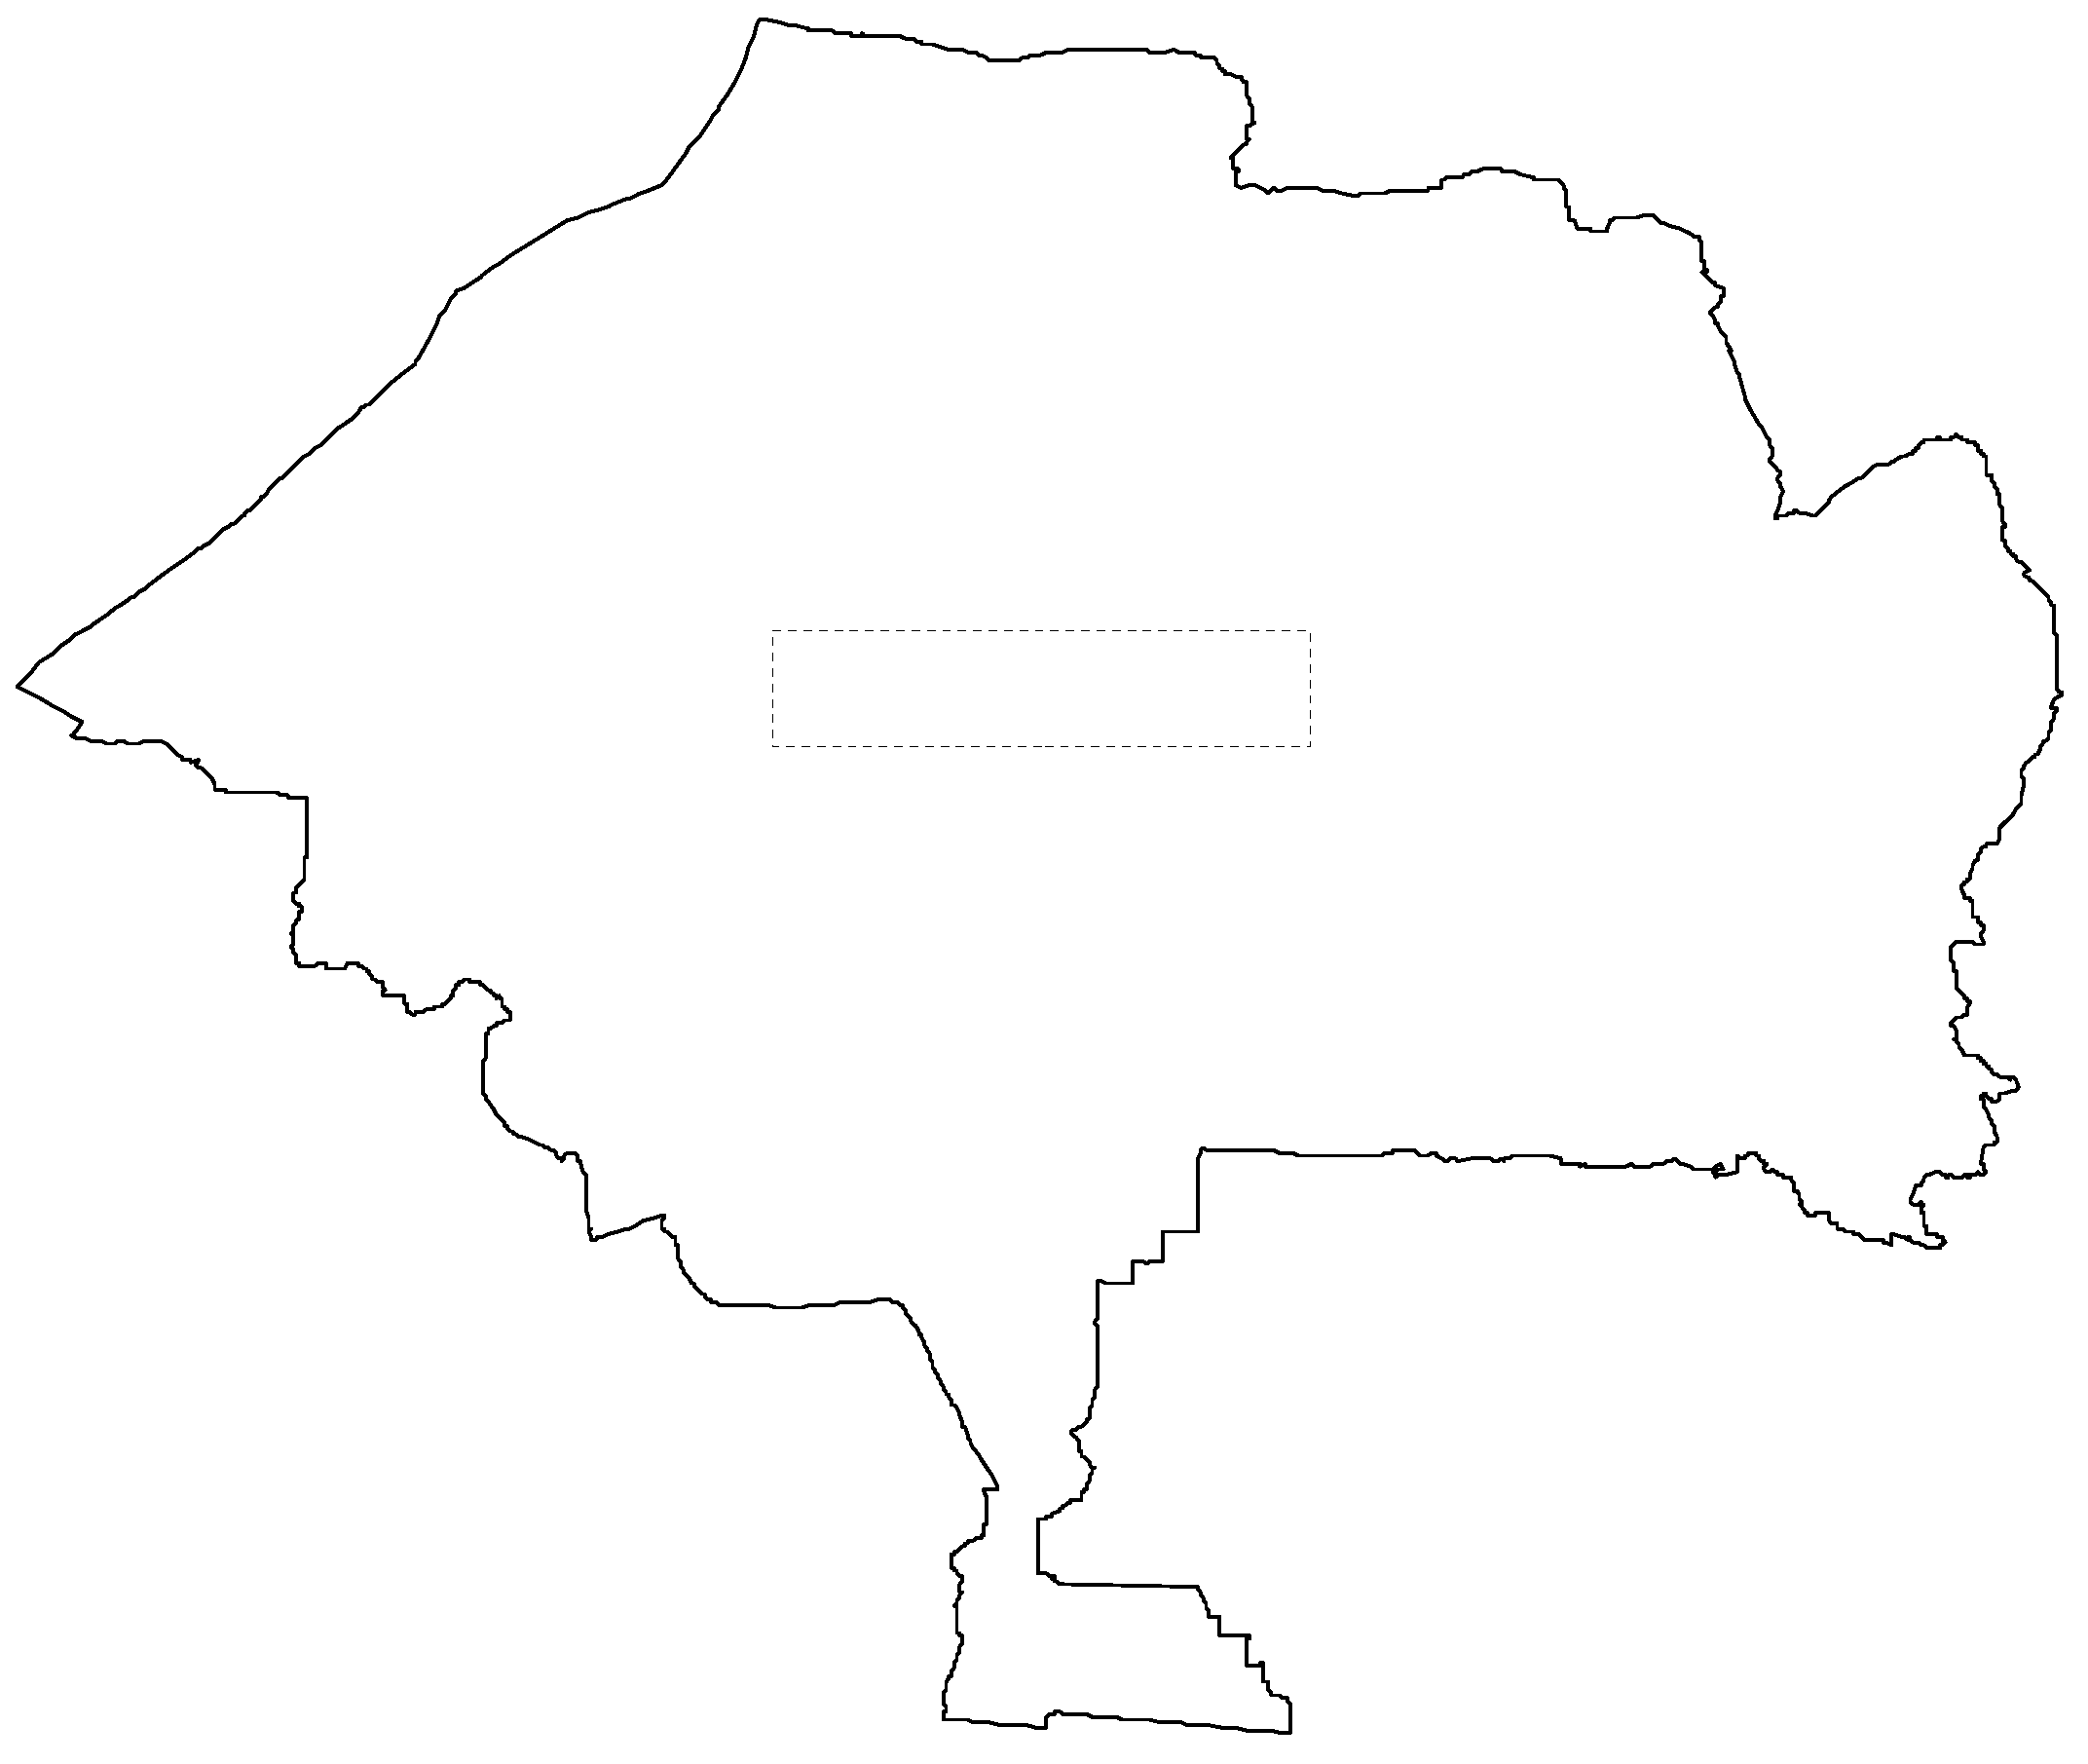
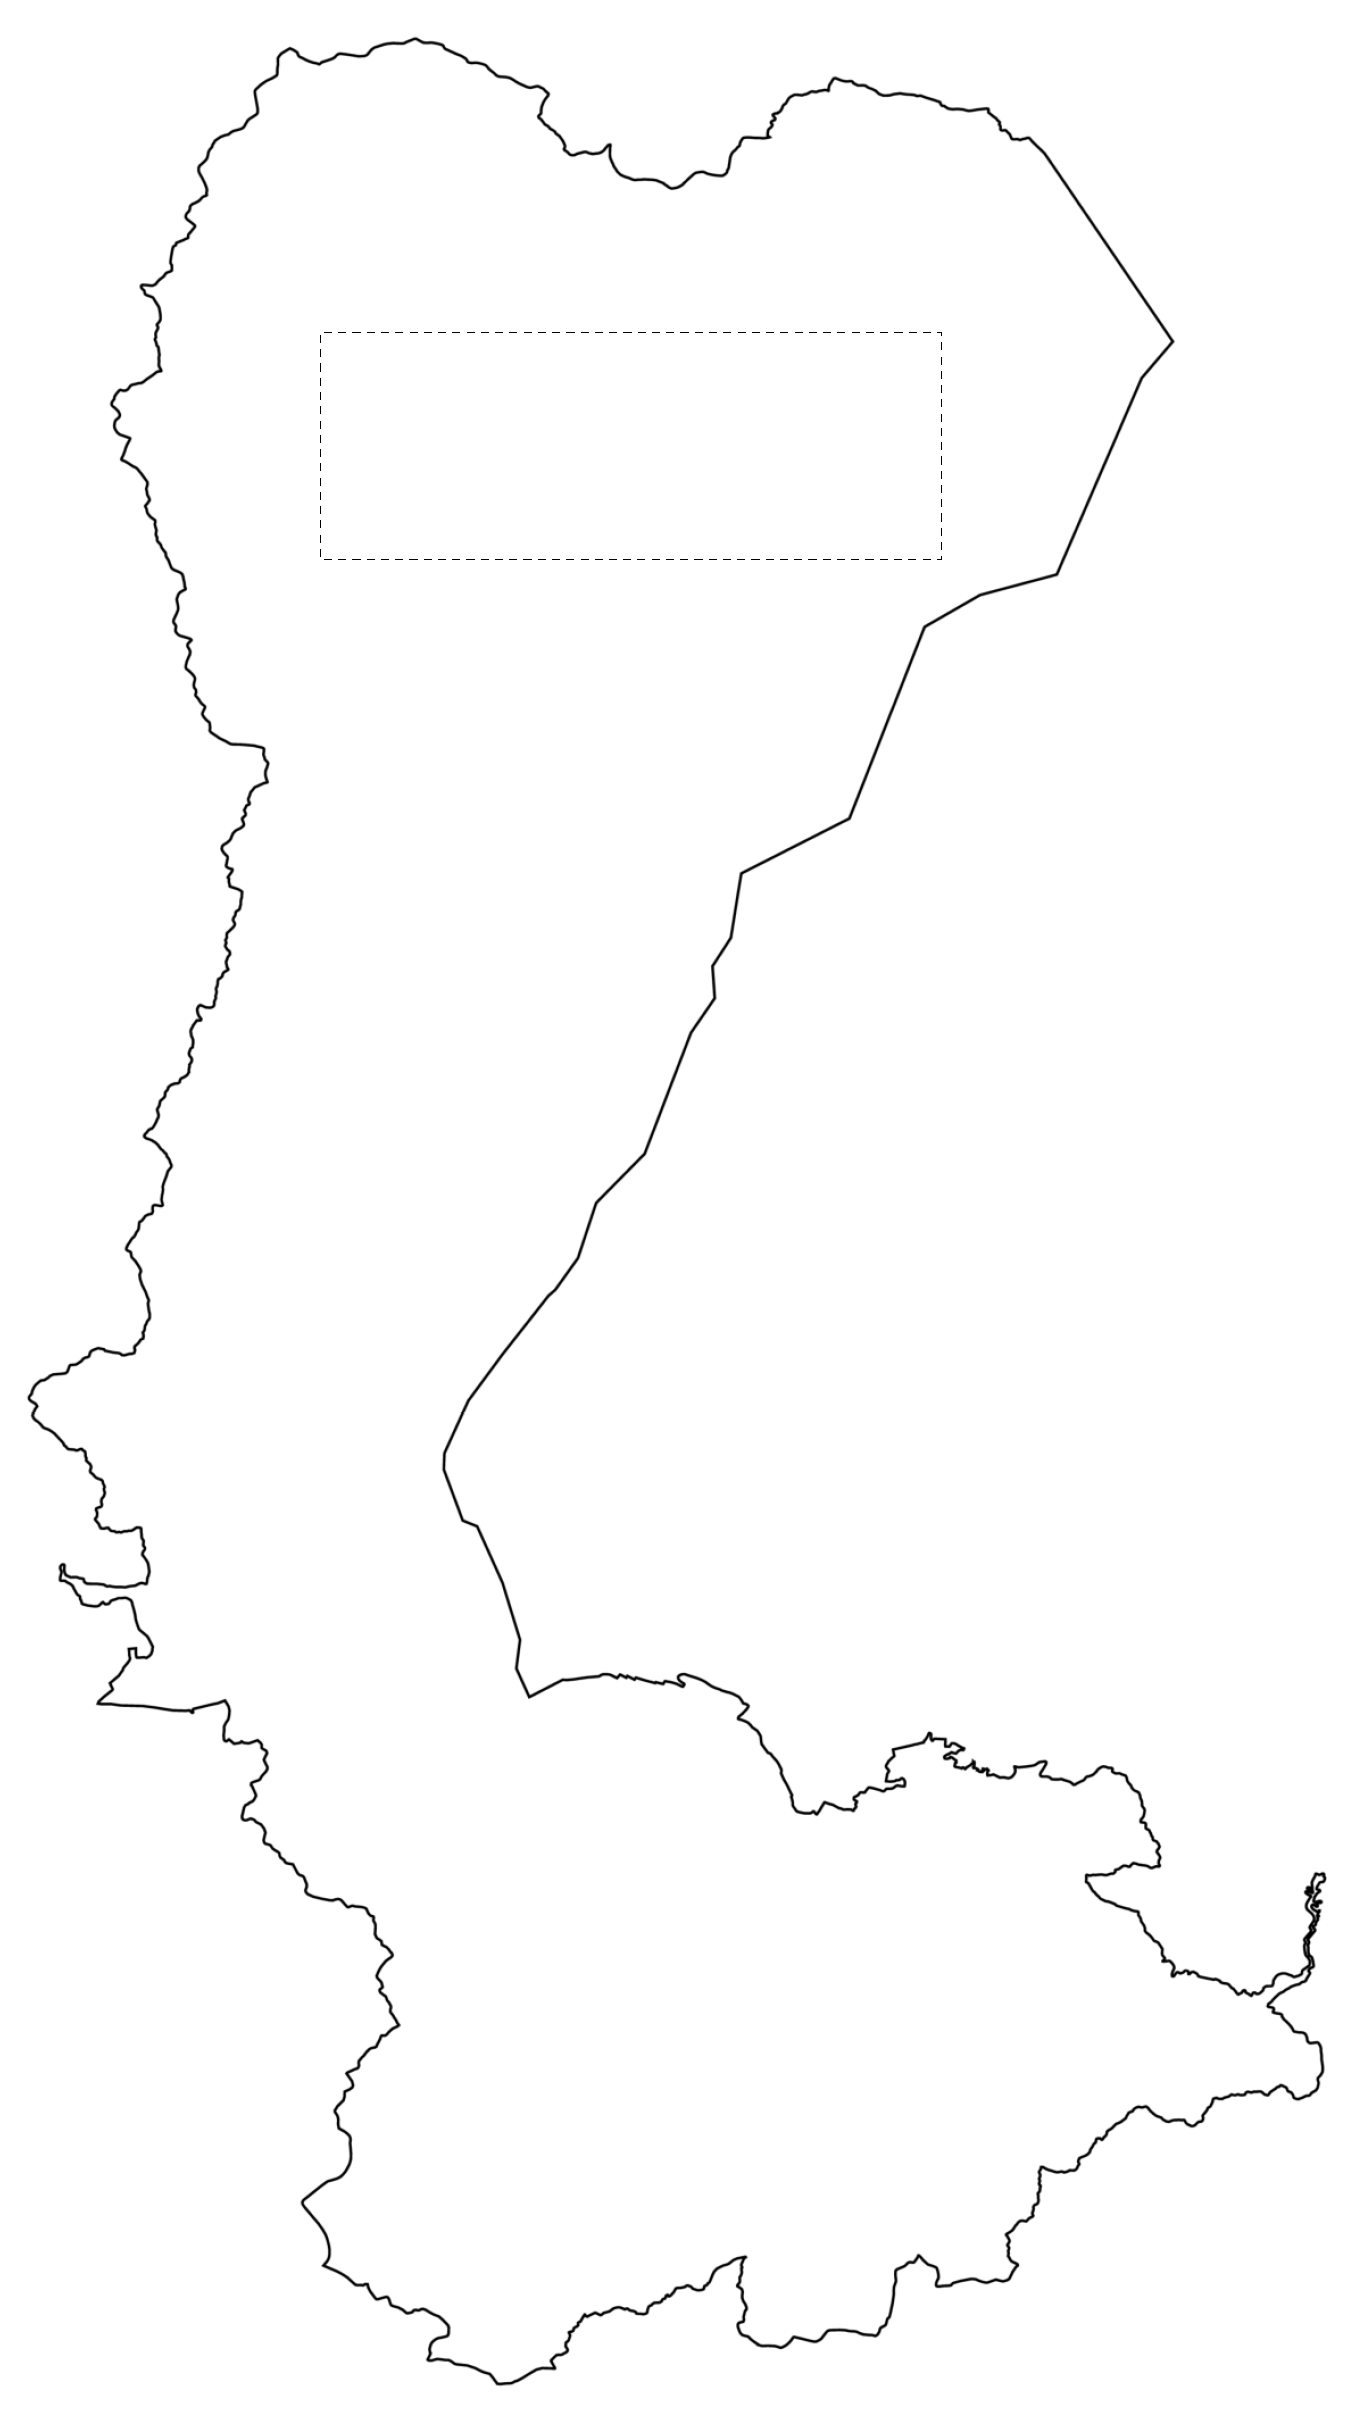
Figure 10, Figure 11 and Figure 12 demonstrate label placements while using the proposed method for label size (A) in Aisai-shi (located in Aichi prefecture, Japan), Ajigasawa-cho (located in Aomori prefecture, Japan), and Neyagawa-shi (located in Osaka prefecture, Japan), respectively. The Aisai-shi area has 2255 boundary lines, and c l / c m and d i s t / d i a g were calculated as 100% and 0.50%, respectively. As seen in Figure 10, the proposed method found a reasonable label position for Aisai-shi, an irregular area with many indents and narrow sections. The Ajigasawa-cho area has 6568 boundary lines, and c l / c m and d i s t / d i a g were calculated as 100% and 9.91%, respectively. The label placement is not bad; however, d i s t / d i a g is high to some extent and a slight label protrusion is observed, as seen in Figure 11. The label placement of Neyagawa-shi (with 3586 boundary lines) is excluded from Table 1 and Table 2, because this area contains few indents and it is suitable for simple label placement. The proposed method also found reasonable label position in this less complex area (Figure 12). Figure 13 shows the label placement for label size (B) in Otsu-shi (located in Shiga prefecture, Japan). The value of its c l / c m is 48.2%, which is significantly bad. By increasing the number of horizontal and vertical auxiliary lines to divide the area into eight equal parts, a good label placement was obtained, as shown in Figure 14.
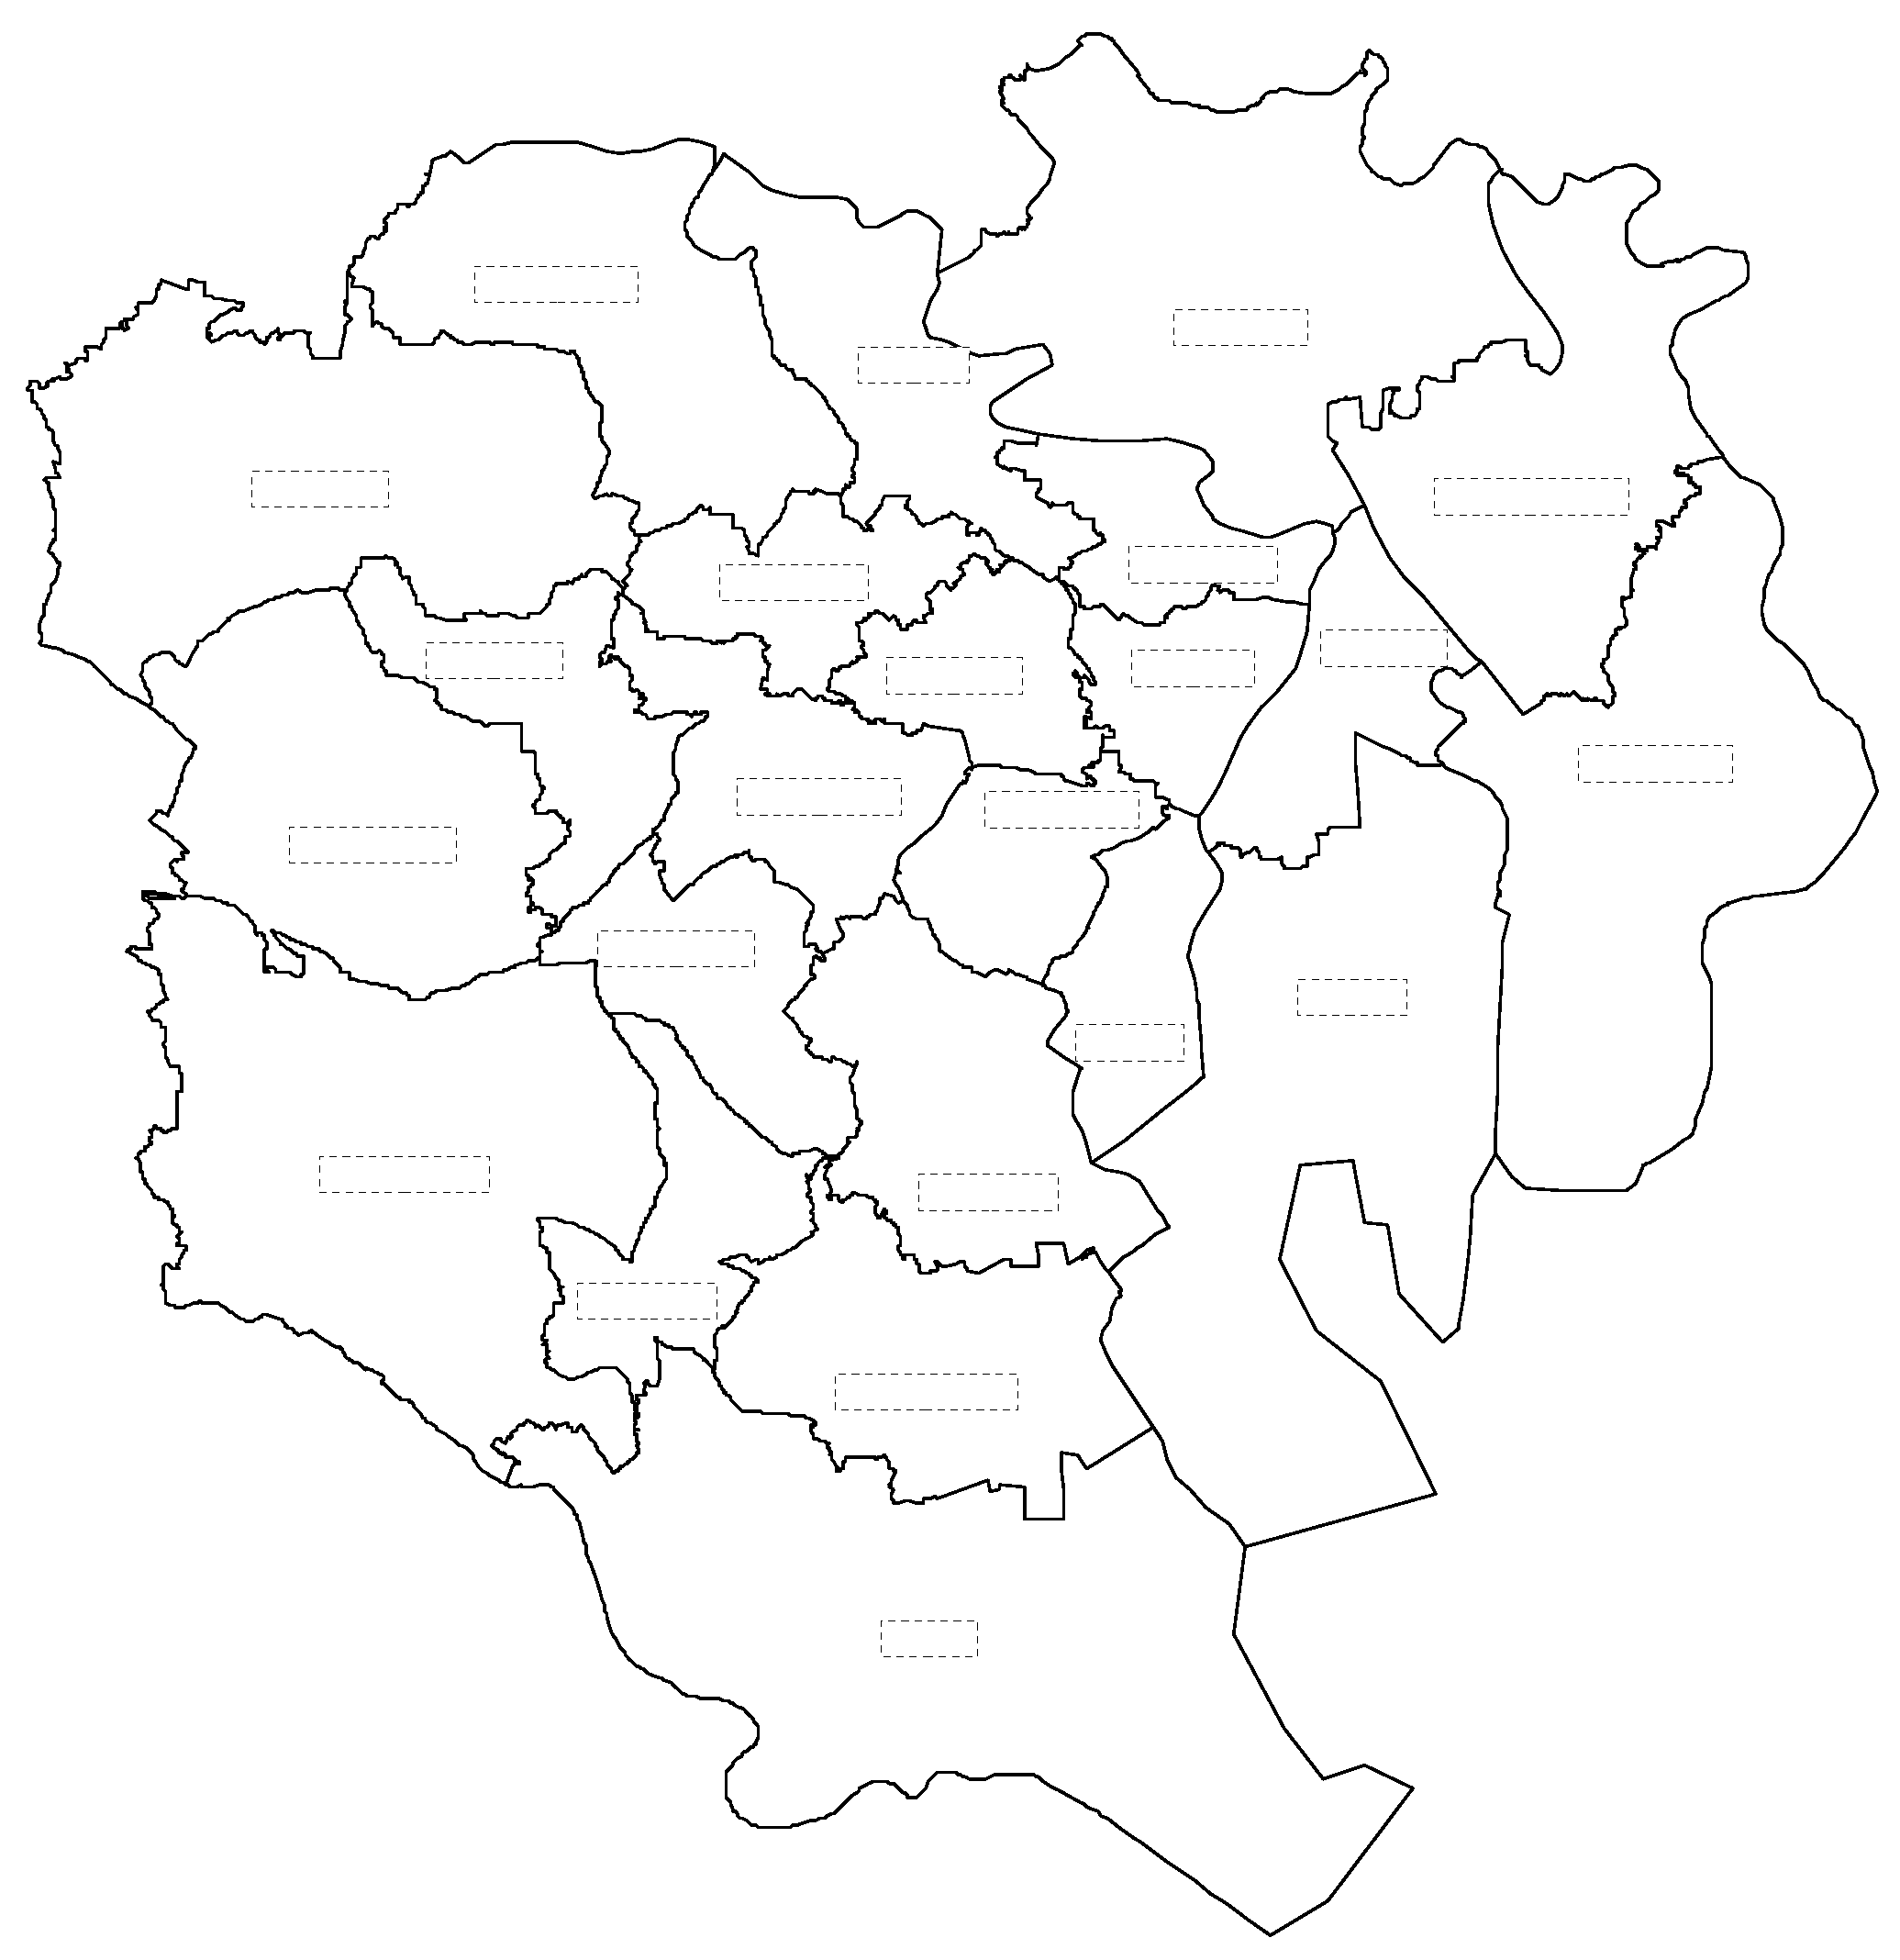
Finally, we show the label placement in the 23 wards of Tokyo in Figure 15. The input was obtained from GIS Open Educational Resources [29]. The height of all labels was set to 5% of the height of Ota-ku, the bottom most area in the figure. Each label width was set to the height times l e t / 2 , where l e t is the number of letters in the corresponding label. The total number of the boundary lines of the 23 areas was 21,438, and the run time excluding preprocessings was 0.13 ms. The label placement is not bad and there is no overlap of labels; however, there is one slight label protrusion.

4. Extending the Proposed Method

This section considers label placement in areas that is only partially visible, or in areas with inclusion relations.

4.1. Label Placement in a Partial Area

From the following conditions, we can determine whether A exists inside the display frame, is only partially displayed, or exists outside the display frame.
(i)
Do the boundary lines of A intersect the display frame?
(ii)
Does an arbitrary point p within A lie inside the display frame?
Condition (i) can be quickly determined by the preprocessing steps described in Section 2.3. If any intersection exists, then the area is partially displayed. If no intersections exist and condition (ii) is satisfied (not satisfied), then A exists inside (outside) the display frame. Condition (ii) can be quickly determined by drawing a half line from p in one direction and counting the number of intersections of this line with the display frame. If the number of intersections is even, then p exists outside the display frame. Conversely, if the number of intersections is odd, then p exists inside the display frame.
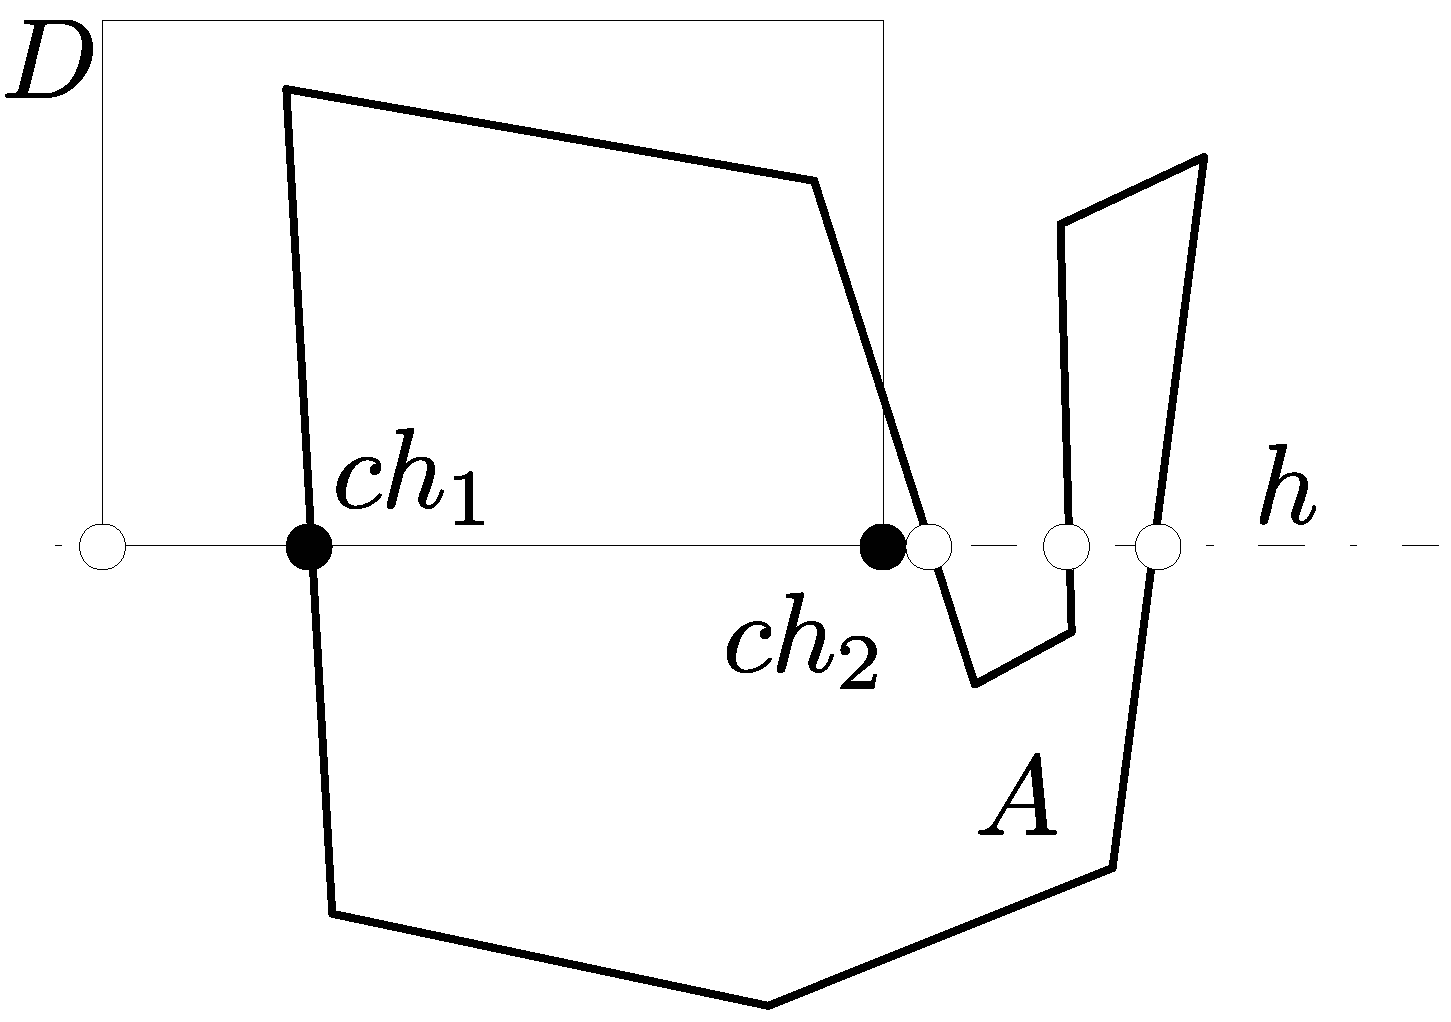
When an area A partially lies in display frame D (see Figure 16), the proposed method first finds where the boundary lines of A intersect the display frame D. As an example, we consider the bottom side of frame D. As shown in Figure 16, the bottom side of D was extended as a horizontal auxiliary line h. The intersections c h 1 , c h 2 , ⋯ were then identified, as described in Section 2.2, but excluding the intersections outside D. The corners of D on h (excluding those outside A) were also identified, and were treated identically to the intersections of h and the boundary lines. Note that, in Figure 16, the lower right corner is treated as the intersection c h 2 . After drawing a vertical line v , a label candidate was created as described in Section 2.2 (see Figure 17). Note that with regard to v , the intersections with the boundaries of D are also identified and the intersections are excluded when they lie outside the overlap region of A and D.

4.2. Label Placement of Area Features with Inclusion Relations

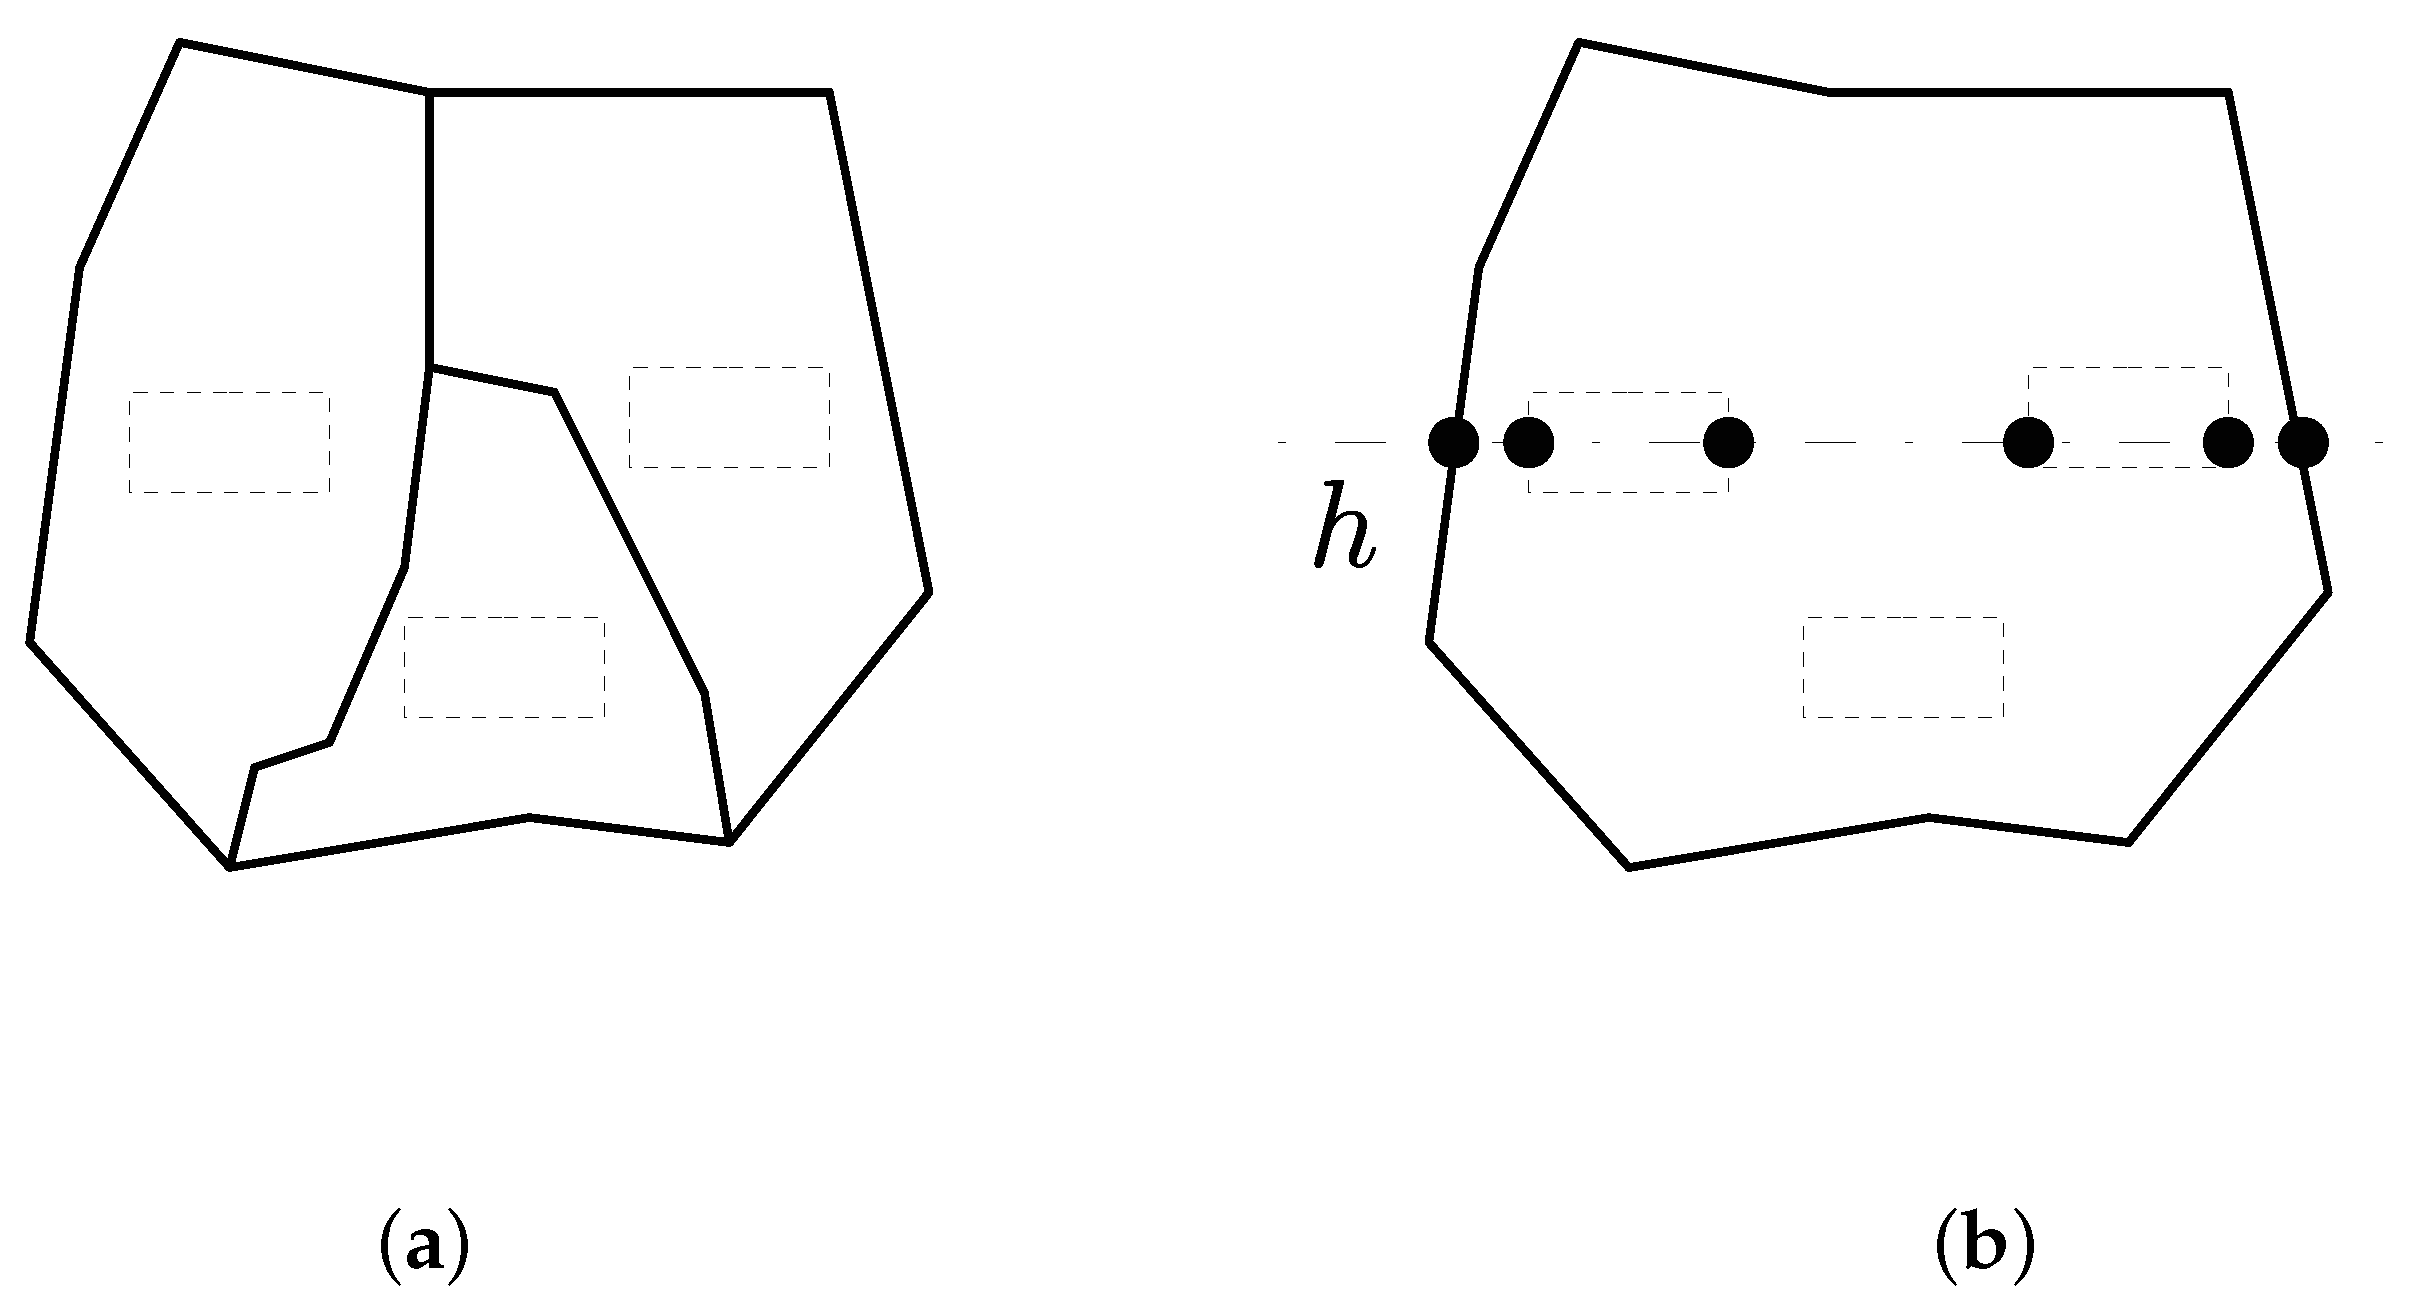
Here, we consider the labeling of area features with inclusion relations, such as prefectures and cities. In such cases, overlaps of the labels for prefecture and city names should be avoided whenever possible. To this end, the proposed method places the area feature labels first at the lowest level of the inclusion relations (see Figure 18a), and then at the next level of the inclusion relations. At this time, the placed labels are considered to lie outside the areas, as shown in Figure 18b, and the intersections of the auxiliary line and the placed labels are treated identically to the intersections of the auxiliary and boundary lines. This process is recursively iterated up to the highest-level areas. In this way, the proposed method can place less overlapping labels for area features with inclusion relations.

5. Conclusions

The appropriate placement of graphical feature labels is important for geographical information systems and cartography. To date, area feature labeling has received insufficient attention. We proposed a very fast internal labeling method for area features on a map. For internal label placement, placing a large label, such that the label does not protrude from the corresponding area is challenging. In such cases, a label can overlap with protruding labels from other areas. Because tablet devices can easily zoom in on a map, it is possible to eliminate overlaps by enlarging the map. Moreover, it is desirable to immediately replace the labels. Hence, we proposed a label placement method that enables real-time processing, even on tablet devices. Using some preprocessing steps, the time complexity of the steps involved in real-time processing of the proposed method was O(log n), where n is the total number of boundary lines of a given area feature. The proposed method aims to place the label at a position as close as possible to the centroid of the large convex polygon existing in the area. It can determine reasonable label positions for area features, even in areas with indents and narrow sections.
We performed computational experiments to confirm the effectiveness of the proposed method. Experiments were implemented in the C programming language and performed on a clocked-down CPU to examine the behavior on a low-performance computer such as a tablet device. The experimental results demonstrate the effectiveness and real-time applicability of the proposed method. In future work, we will create more effective label candidates by devising the positions of the auxiliary lines.

Author Contributions

Noboru Abe initiated this research project, implemented the algorithms, and contributed to the experiments and the writing of the manuscript. Kohei Kuroda contributed conceptualization of the algorithm. Yosuke Kamata and Shogo Midoritani contributed to the algorithm design and data curation. All authors have read and agreed to the published version of the manuscript.

Funding

This research received no external funding.

Conflicts of Interest

The authors declare no conflict of interest.

References

  1. Okamoto, S.; Sakaguchi, R.; (Dawn Corporation, Kobe, Japan). Personal communication, 2015.
  2. Hirsch, S.A. An algorithm for automatic name placement around point data. Am. Cartogr. 1982, 9, 5–17. [Google Scholar] [CrossRef]
  3. Christensen, J.; Marks, J.; Shieber, S. An empirical study of algorithms for point-feature label placement. ACM Trans. Graph. 1995, 14, 203–232. [Google Scholar] [CrossRef] [Green Version]
  4. Van Kreveld, M.; Strijk, T.; Wolff, A. Point labeling with sliding labels. Comput. Geom. Theory Appl. 1999, 13, 21–47. [Google Scholar] [CrossRef] [Green Version]
  5. Funakawa, K.; Abe, N.; Yamaguchi, K.; Masuda, S. Algorithms for the map labeling problem with priorities. IEICE Trans. Fund. Electron. Commun. Comput. Sci. 2005, J88-A, 677–681. (In Japanese) [Google Scholar]
  6. Bekos, M.A.; Kaufmann, M.; Symvonics, A.; Wolff, A. Boundary labeling: Models and efficient algorithms for rectangular maps. Comput. Geom. Theory Appl. 2007, 36, 215–236. [Google Scholar] [CrossRef] [Green Version]
  7. Alvim, A.C.F.; Taillard, É.D. POPMUSIC for the point feature label placement problem. Eur. J. Oper. Res. 2009, 192, 396–413. [Google Scholar] [CrossRef]
  8. Li, L.; Zhang, H.; Zhu, H.; Kuai, X.; Hu, W. A Labeling Model Based on the Region of Movability for Point-Feature Label Placement. ISPRS Int. J. Geo-Inf. 2016, 5, 159. [Google Scholar] [CrossRef] [Green Version]
  9. Haunert, J.-H.; Wolff, A. Beyond Maximum Independent Set: An Extended Integer Programming Formulation for Point Labeling. ISPRS Int. J. Geo-Inf. 2017, 6, 342. [Google Scholar] [CrossRef] [Green Version]
  10. Marín, A.; Pelegrín, M. Towards unambiguous map labeling - Integer programming approach and heuristic algorithm. Expert Syst. Appl. 2018, 98, 221–241. [Google Scholar] [CrossRef]
  11. Wolff, A. The Map-Labeling Bibliography. Available online: https://i11www.iti.kit.edu/map-labeling/bibliography/ (accessed on 26 August 2020).
  12. Roy, S.; Bhattacharjee, S.; Das, S.; Nandy, S.C. A fast algorithm for point labeling problem. In Proceedings of the 17th Canadian Conference on Computational Geometry, Windsor, ON, Canada, 10–12 August 2005; pp. 155–158. [Google Scholar]
  13. Yamamoto, M.; Camara, G.; Lorena, L. Fast point-feature label placement algorithm for real time screen maps. In Proceedings of the 7th Brazilian Symposium on GeoInformatics, Campos do Jordão, Brazil, 20–23 November 2005; pp. 1–13. [Google Scholar]
  14. Mote, K. Fast point-feature label placement for dynamic visualizations. Inf. Vis. 2007, 6, 249–260. [Google Scholar] [CrossRef]
  15. Kameda, T.; Imai, K. Map label placement for points and curves. IEICE Trans. Fund. Electron. Commun. Comput. Sci. 2003, E86-A, 835–840. [Google Scholar]
  16. Zhang, Q.; Harrie, L. Real-time map labelling for mobile applications. Comput. Emviron. Urban Syst. 2006, 30, 773–783. [Google Scholar] [CrossRef]
  17. Zhang, Q.; Harrie, L. Placing text and icon labels simultaneously. Cartogr. Geogr. Inf. Sci. 2006, 33, 53–64. [Google Scholar] [CrossRef]
  18. Lu, F.; Deng, J.; Li, S.; Deng, H. A hybrid of differential evolution and genetic algorithm for the Multiple Geographical Feature Label Placement Problem. ISPRS Int. J. Geo-Inf. 2019, 8, 237. [Google Scholar] [CrossRef] [Green Version]
  19. Kakoulis, K.G.; Tollis, I.G. A unified approach to labeling graphical features. In Proceedings of the 14th Annual Symposium on Computational Geometry, Minneapolis, MH, USA, 7–10 June 1998; pp. 347–356. [Google Scholar]
  20. Wagner, F.; Wolff, A.; Kapoor, V.; Strijk, T. Three rules suffice for good label placement. Algorithmica 2001, 30, 334–349. [Google Scholar] [CrossRef] [Green Version]
  21. Rylov, M.; Reimer, A. A practical algorithm for the external annotation of area features. Cartogr. J. 2017, 54, 61–76. [Google Scholar] [CrossRef]
  22. Aonuma, H.; Imai, H.; Tokuyama, T. Some Voronoi diagrams for character placing problems in map databases. IPSJ SIG Tech. Rep. 1989, 89-AL-10-5, 1–7. (In Japanese) [Google Scholar]
  23. Barrault, M. A methodology for placement and evaluation of area map labels. Comput. Emviron. Urban Syst. 2001, 25, 33–52. [Google Scholar] [CrossRef]
  24. Dörschlag, D.; Petzold, I.; Plümer, L. Placing objects automatically in areas of maps. In Proceedings of the 21st International Cartographic Conference, Durban, South Africa, 10–16 August 2003; pp. 269–275. [Google Scholar]
  25. Edmondson, S.; Christensen, J.; Marks, J.; Shieber, S. A general cartographic labeling algorithm. Cartographica 1996, 33, 13–23. [Google Scholar] [CrossRef] [Green Version]
  26. Van Roessel, W. An algorithm for locating candidate labeling boxes within a polygon. Am. Cartogr. 1989, 16, 201–209. [Google Scholar] [CrossRef]
  27. Pinto, I.; Freeman, H. The feedback approach to cartographic areal text placement. In Advances in Structural and Syntactical Pattern Recognition; Springer: New York, NY, USA, 1996; pp. 341–350. [Google Scholar]
  28. Fundamental Geospatial Data by the Geospatial Information Authority of Japan. Available online: https://www.gsi.go.jp/kiban/ (accessed on 26 August 2020).
  29. GIS Open Educational Resources. Available online: https://gis-oer.github.io/gitbook/book/index.html (accessed on 26 August 2020).
Figure 1. Label placement by the simple method: (a) correct placement in a simple shape; (b) inappropriate placement in a shape with a narrow region; and, (c) placement outside an area with a large indent. The solid shapes and dashed rectangles lines delineate the area and label boundaries, respectively.
Ijgi 09 00529 g001
Figure 2. The auxiliary line h intersects the boundary lines of A at c h 1 , c h 2 , c h 3 , and c h 4 .
Ijgi 09 00529 g002
Figure 3. A label candidate determined by the proposed method.
Ijgi 09 00529 g003
Figure 4. The horizontal auxiliary line drawn through the left-most endpoint p l .
Ijgi 09 00529 g004
Figure 5. Example of label candidates.
Ijgi 09 00529 g005
Figure 6. The boundary lines to be stored in order of horizontal and vertical coordinates of their midpoints. The white circles indicate the midpoints of each boundary line.
Ijgi 09 00529 g006
Figure 7. The boundary lines to be stored in the horizontal direction are highlighted in bold.
Ijgi 09 00529 g007
Figure 8. Example of an auxiliary line that intersects a boundary line having many stored boundary lines.
Ijgi 09 00529 g008
Figure 9. Enumeration of convex polygons: (a) part of the area boundary. Starting from endpoint p 1 , the method examines (b) polygon p 1 p 2 p 3 , (c) polygon p 1 p 2 p 3 p 4 , and (d) polygon p 1 p 2 p 3 p 5 .
Ijgi 09 00529 g009
Figure 10. Label placement using the proposed method in Aisai-shi.
Ijgi 09 00529 g010
Figure 11. Label placement using the proposed method in Ajigasawa-cho.
Ijgi 09 00529 g011
Figure 12. Label placement using the proposed method in Neyagawa-shi.
Ijgi 09 00529 g012
Figure 13. Label placement using the proposed method in Otsu-shi.
Ijgi 09 00529 g013
Figure 14. Label placement obtained by increasing the number of auxiliary lines in Otsu-shi.
Ijgi 09 00529 g014
Figure 15. Label placement using the proposed method in the 23 wards of Tokyo.
Ijgi 09 00529 g015
Figure 16. Horizontal auxiliary line in an area that is partially displayed in frame D. The white circles indicate the excluded intersections and corners.
Ijgi 09 00529 g016
Figure 17. Label candidate for a partial area.
Ijgi 09 00529 g017
Figure 18. Auxiliary lines for area features with inclusion relations at the (a) lowest level and (b) highest level.
Ijgi 09 00529 g018
Table 1. Experimental results for label size (A) ( c l / c m is the relative size of the convex polygon found by the proposed method, and d i s t / d i a g defines the closeness of the label position determined by the proposed method to the centroid of the convex polygon c l ).
LabelNumber of Boundary Lines c l / c m [%] dist / diag [%]Run Time [ms]
Aisai-shi2255100.00.500.0085
Ajigasawa-cho6568100.09.910.0070
Ashoro-cho12,849100.08.990.0096
Iida-shi10,051100.02.760.0071
Ishikari-shi10,30498.61.850.0083
Iyo-shi4760100.04.520.0079
Esashi-cho4902100.02.910.0088
Ozu-shi6593100.09.560.0077
Otsu-shi462763.21.840.0078
Onojo-shi1799100.03.430.0074
Onagawa-cho18,416100.00.730.0145
Kagoshima-shi11,57792.64.510.0127
Kasaoka-shi437960.815.290.0100
Katsuragi-cho370386.45.770.0071
Kushiro-shi15,200100.05.360.0081
average6470.893.45.200.0088
Table 2. Experimental results for label size (B)
LabelNumber of Boundary Lines c l / c m [%] dist / diag [%]Run Time [ms]
Aisai-shi2255100.00.630.0083
Ajigasawa-cho6568100.00.220.0069
Ashoro-cho12,849100.011.260.0094
Iida-shi10,051100.02.660.0071
Ishikari-shi10,304100.04.800.0079
Iyo-shi4760100.04.260.0075
Esashi-cho4902100.01.330.0068
Ozu-shi6593100.011.120.0078
Otsu-shi462748.22.460.0078
Onojo-shi1799100.00.590.0076
Onagawa-cho18,416100.09.270.0149
Kagoshima-shi11,577100.013.310.0126
Kasaoka-shi437973.88.200.0098
Katsuragi-cho3703100.04.010.0072
Kushiro-shi15,200100.06.010.0083
average6470.894.85.340.0087