Article

Marine Heatwaves, Upwelling, and Atmospheric Conditions during the Monsoon Period at the Northern Coast of the Gulf of Guinea

1
Laboratory of Environmental Sciences and Techniques (LSTE), University Jean-Lorougnon Guédé, Daloa BP 150, Côte d’Ivoire
2
Laboratory of Matter Sciences, Environment and Solar Energy (LASMES), University Felix Houphouet Boigny of Cocody-Abidjan, Abidjan 22 BP 582, Côte d’Ivoire
3
UFR of Marine Sciences, University of San-Pédro, San-Pédro 01BP 18100, Côte d’Ivoire
*
Author to whom correspondence should be addressed.
Climate 2022, 10(12), 199; https://doi.org/10.3390/cli10120199
Submission received: 3 November 2022 / Revised: 25 November 2022 / Accepted: 29 November 2022 / Published: 14 December 2022
(This article belongs to the Section Climate Dynamics and Modelling)

Abstract

:
Ocean conditions influence the economies and climate of West Africa. Based on the 30-year daily Optimum Interpolation Sea Surface Temperature (OISST) dataset during May–October, upwelling surface variability and marine heatwaves (MHWs) at the northern coast of the Gulf of Guinea are investigated. The cooling surface decreases more rapidly around Cape Palmas than around Cape Three Points and extends eastward. MHWs variability exhibits a frequent occurrence of such events since 2015 that is consistent with the observed oceanic warming and the decrease in upwelling surface. The empirical orthogonal functions performed on the annual cumulated intensity of MHWs show four variability modes that include the whole northern coast, an east–west dipole between the two capes, a contrast between the northern coast at the two capes and the meridional section east of 5° E, and a north–south opposition. These patterns show 3-year, 6-year, and 8-year trends, and are related to coastal upwelling at the northern coast of the Gulf of Guinea. Similarly, surface ocean and atmospheric conditions are modified according to MHW periods. These changes take place before, during, and after MHW events. These results could be used to understand how this change influences the marine ecosystem, the local fisheries resources, and the extreme rainfall episodes in West Africa.

1. Introduction

The Gulf of Guinea is a region in which upper ocean variability is noticeable through sea surface temperature (SST) anomalies that extend southward along the coast, and strongly influence the hydrology and coastal upwelling of adjacent regions. SST magnitudes on diurnal, seasonal, and interannual time scales are important when considering their impacts on the ocean–air turbulent flow exchanges. The spatial pattern of SST, which could be like a dipole between the southern and northern basins of the tropical Atlantic some years and like the El-Niño mode of the Pacific other years, could be influenced by the upwelling signal at the African coast. Hence, understanding the variability of the ocean conditions in this area and its relationship with the climate and atmosphere is of great interest, (i) firstly because the Gulf of Guinea is the main source of water vapor, constituting most of the precipitation on the continent [1,2]; (ii) secondly, because this area of the tropical Atlantic has the largest seasonal SST amplitude of about 5–8 °C [3].
Pauly and Christensen [3] reported that upwelling areas are economically important even though the overall surface of these regions represents less than 1% of the world ocean. In addition, coastal upwellings have a great impact on the local climate. Particularly, the surface conditions of the coastal ocean in the Gulf of Guinea in the northeast tropical Atlantic influence the West African climate [4,5]. A coastal upwelling is seasonally observed along the northern coast of the Gulf of Guinea during the boreal winter and summer periods, i.e., from January to February (minor upwelling) and from June to October (major upwelling), respectively, off Côte d’Ivoire and Ghana [6,7]. June and October are transitional periods when the major upwelling is observed and are part of the Gulf of Guinea monsoon period [8]. These months are characterized by a progressive weakening of SST in June and a return of warm waters in October, corresponding to the beginning and the end of the upwelling season, respectively.
A recent report of the Intergovernmental Panel on Climate Change [9] stated that the global temperature had increased by 1 °C compared to the pre-industrial period. This warming has also been experienced in the tropical Atlantic. Indeed, a regional analysis of SST trends in the tropical Atlantic [10] showed that the whole basin warmed from the mid-1970s, with a stronger positive trend in the northern basin (~1 °C) than in the southern basin (~0.6 °C). Particularly, this warming was important in the upwelling regions of West Africa and along the equator in the Gulf of Guinea. In this respect, Ali et al. [5] found an increase in positive SST anomalies at the northern coast of the Gulf of Guinea, associated with a decrease in the coastal upwelling intensity. Odekunle and Eludoyin [11] also showed that strong positive SST anomalies in the tropical Atlantic Ocean were associated with rainfall in West Africa. Finally, Asuquo and Oghenechovwe [12] suggested that some of these observed positive anomalies may be associated with the onset and the enhancement of marine heatwaves (MHWs) in this region. MHWs are defined as a prolonged discrete anomalously of high sea surface temperature (SST) in a particular location [13,14]. These last phenomena differ considerably from atmospheric heatwaves [15], although they are calculated according to the same convention [13]. MHWs can occur mainly during favorable ocean conditions such as positive SST anomalies or enhanced warm ocean currents [16,17,18]. Their contribution to the influence of atmospheric conditions is mainly explained by the accumulation of heat flux in the ocean due to the weakening of the wind speed [19,20]. MHW events are classified as oceanic extreme events which could negatively and sustainably influence marine ecosystems [20,21,22]. This situation could also negatively affect the populations who depend on the marine environment for their food. The consequences of these extreme oceanic events and their potential impact on the economies and climate of West African countries make the study of the variability of upwelling and MHWs, and their relationship with ocean–atmospheric conditions, essential for risk planning associated with these hazards. Similarly, MHWs are poorly documented at the northern coast of the Gulf of Guinea, and a limited number of studies have been conducted in this area [12,23].
The main objective of this study is to investigate the variability of upwelling and MHWs at the northern coast of the Gulf of Guinea and their relationships with atmospheric and ocean surface conditions. Section 2 presents the dataset and the method used. In Section 3, the analysis of the upwelling variability and the trends and patterns of MHWs variability is performed. This section also describes the relationships between upwelling and MHWs and presents the atmospheric and ocean surface conditions that occur during MHW events. Finally, a discussion and conclusion are provided in the last section.

2. Data and Methods

2.1. Data

The oceanic study area is the northern coast of the Gulf of Guinea, bordering the West African coast. It extends from 2° N to the northern coast at 6° N, between 10° W and 10° E. It includes Cape Palmas around 7° W at the border of Côte d’Ivoire and Liberia, and Cape Three Points around 2° W at the west of Takoradi in Ghana (Figure 1). This zone experiences two seasonal upwellings that are important for the marine ecosystem and the fishery in this area [24,25,26]. Such SST enhancement was associated with extreme rainfall precipitations in littoral areas [27] and could have disastrous consequences on fishery resources.
The relationships between the coastal upwelling, marine heatwaves (MHWs), and oceanic and atmospheric conditions are established by using the sea surface temperature (SST), horizontal and vertical winds, specific humidity, and latent heat flux. The coastal upwelling, MHWs, and sea surface conditions are documented for the tropical Atlantic using the National Oceanic and Atmospheric Administration (NOAA) Optimum Interpolation (OI) sea surface temperature (SST) daily data [28]. These data are reported on a 0.25° × 0.25° grid for 1991–2020. May-to-October periods of each year are used for this study since they comprise the major coastal upwelling season at the northern coast of the Gulf of Guinea. They also correspond to the monsoon period [8]. This period is characterized by a progressive decrease in SST in June and a return of warm waters in October. Daily horizontal (at 2 m at the surface) and vertical wind fields, specific humidity, and latent heat flux are extracted from the National Center for Environmental Prediction–National Center for Atmospheric Research (NCEP–NCAR) reanalysis dataset [29] for the same periods (1991–2020). These data are reported on a 2.5° × 2.5° grid, with 17 pressure levels from 1000 hPa to 10 hPa for vertical wind and 8 pressure levels from 1000 hPa to 10 hPa for specific humidity.

2.2. Detection of Coastal Upwelling Indices and Marine Heatwaves

The current definition of coastal upwelling indices used in this study follows Caniaux et al. [30]. These authors found a large interannual variability of the equatorial Atlantic cold tongue variability by using the spread of these indices. Based on NOAA OISST daily data, a threshold temperature of 25 °C is chosen as it is lower than the mean SST reached in June in the eastern equatorial Atlantic [25,31]. Then, the coastal upwelling surface (CUS, in km2) is defined as the daily total surface reached by the grids in which the temperature is lower than the threshold. In this study, the CUS is attributed to be zero when the SST is above the chosen threshold.
A complementary index used is the coastal upwelling index (CUI, in °C·km2·day). For each grid representing a pixel or a surface, the cooling is shown by the positive difference between the threshold and SST. The CUI is then performed daily as the sum of each difference between threshold and SST multiplied by the total surface reached by the cooled grids. These indices can be performed daily or yearly at the northern coast of the Gulf of Guinea (10° W–10° E; 2° N–6° N) where coastal upwelling occurs. They allow for the estimation, each year, of the duration of the upwelling.
The original definition of Hobday et al. [13] is applied to detect marine heatwave (MHW) events. Three occurrences of these phenomena were analyzed for different areas. In conclusion, they suggest the use of MHWs to better understand their variability. An MHW event is defined as anomalous ocean warming on at least five consecutive days with an SST greater than the 90th percentile. The 90th percentile and the climatology of the SST are calculated for each calendar day from the daily SSTs, using an 11-day window centered on each day of the year, and smoothed using a 31-day running average on the daily SST. The 90th percentile varies seasonally and makes it possible to identify MHWs at any time of the year [32]. The MHW events’ identification was performed over the May–October period from 1991 to 2020. Four parameters are computed to detect MHW events. These parameters are duration, frequency, intensity, and reference climatology. Let us note that an MHW event intensity is defined as being the difference between the absolute SST and the climatological value. In this study, the MHW intensity is attributed to be zero when no MHW occurs during a certain period.

3. Results

3.1. Upwelling Variability in the Gulf of Guinea

Figure 2 shows the Hovmöller diagrams of the monthly cooling surface (Figure 2a) and the monthly anomaly diagram (Figure 2b) of the cooling surface (CUS) at the northern coast of the Gulf of Guinea. This figure is performed for the defined area (10° W–10° E; 2° N–6° N), by spatially averaging the CUS. Then, the anomalies are computed for every month by differentiating the value of its CUS by the climatology of that month. The largest cooling areas (>0.30 × 10⁶ km2) are observed during the 1991–2005 period, and particularly during August which represents the core of the major upwelling season in this area (see Figure 2a). Figure 2b shows that at the northern coast of the Gulf of Guinea, the upwelling season occurs generally from July to September, with extension in June and October some years. The CUS alternates between decreasing and increasing during 1991–2005. From 2006 up to 2020, there is a persistent decrease in the CUS, which could indicate a warming at the northern coast of the Gulf of Guinea.
Figure 3 depicts the longitude–time diagram of the CUS at the northern coast of the Gulf of Guinea averaged over 2° N–6° N (Figure 3a). It also displays the annual evolution of the coastal upwelling index (CUI) and its duration (Figure 3b), as well as the correlations between the three upwelling indices (Figure 3c). The CUS evolution (Figure 3a) shows that the coastal upwelling ranges between 7° W and 3° E with two main cores, one core being centered at 5° W (i.e., between 6° W and 2.5° W) around the Cape Palmas and the other core centered at 0° E (i.e., between 2° W and 2° E) around the Cape of the Three Points. The spatial extension of the CUS core at Cape Three Points (at 0°) is larger than that of the core at Cape Palmas (at 5° W) most years and is consistent with previous studies [5]. These two cores have almost the same cooling area (~28,000 km2) from 1991 to 1994. From 1995 to 2006, the cooling surface narrows around Cape Palmas relative to Cape Three Points. The cooling surfaces of both upwelling cores remain almost constant with 24,000 km2 and 28,000 km2 at Cape Palmas and at Cape Three Points, respectively. Then, a global narrowing of the cooling surface occurs at both cores from 2006 to 2020, where it ranges from 14,000 km2 to 20,000 km2, resulting on a mean 17,000 km2 surface. A comparison of the mean cooling surface of the two cores between 1991 (~28,000 km2) and 2020 (~17,000 km2) indicates a half drop of cooling surface during these last 30 years, i.e., a loss of about 567 km2 per year. This decrease is consistent with the warming of the southern tropical Atlantic basin since 1975 [10] and particularly with the increase in positive SST anomalies at the northern coast of the Gulf of Guinea [8].
The evolution of the coastal upwelling index (CUI) and the duration of the phenomenon (Figure 3b) agree with the CUS observations. There is a downward trend of CUI and duration that has accelerated since 2012. The correlations (Figure 3c) between the upwelling parameters (CUS, CUI, duration) indicate a significant positive correlation (~0.95) between CUI and CUS, while this relationship is weak and non-significant between duration and CUS (~0.38) and duration and CUI (~0.32). Therefore, this figure suggests a similar evolution of CUS and CUI. Hereafter, the CUS is used when referring to the coastal upwelling at the northern coast of the Gulf of Guinea.

3.2. Trend Analysis and Patterns of MHWs Variability

3.2.1. Temporal Variability of MHWs

To investigate MHWs variability, daily SST anomalies were spatially averaged across 10° W–10° E; 2° N–6° N to generate a time series, for which intensities, number, and duration of MHWs were determined. Days with no MHWs were assigned a value of zero. Then, wavelets were applied to the resulting new daily series. Figure 4a displays the interannual evolution of MHW numbers during May–October. Only one event occurred in 1999 and 2000. From 2006, the number of events substantially increases by two to four which is the highest value during 2015–2020 and in 2007. The linear regression shows an increasing tendency of events which is statistically significant at 95% by using the Student’s t-test.
Figure 4b shows the wavelets of MHWs at the northern coast of the Gulf of Guinea during May–October. It indicates an intensification and a frequent occurrence of these events that range between two days and eight days since 2015. The average and the standard deviation of the duration reach 10 days and 6 days, respectively (not shown). This occurrence of MHWs is consistent with the number of events (see Figure 4a) and the decrease in upwelling surface during this period (see Figure 3a). During 1991–2008, MHWs are almost inexistent, except in 1999–2000 and 2006–2010. In 2000, MHWs are observed with periods ranging between three and seven days. Similarly, scattered low-period MHWs are observed during 2006–2010. The spectrum of MHW intensities shows a weak intensity on average (Figure 4c). These intensities reach approximately 0.7 °C for 6-day MHWs. Thus, MHWs at the northern coast of the Gulf of Guinea could be categorized as moderate based on Hobday et al.’s [14] classification.

3.2.2. Patterns of MHWs Variability

This subsection outlines the patterns of MHWs variability. It is performed by using empirical orthogonal functions (Eofs) of the cumulated annual intensities of MHWs in May–October during 1991–2020. Figure 4 illustrates the first four Eof spatial structures of the cumulated intensity of MHWs (Figure 5a–d) and their corresponding time series (Figure 5e–h). Only those Eof patterns that are physically significant are selected [33,34]. These four patterns represent 78% of the explained variance. The dotted area on Eof structures illustrates the significant areas at the 95% confidence level of Student’s t-test.
The first Eof (~42%) (Figure 5a) shows a negative and significant area in the whole littoral zone. Such pattern could indicate a full presence of cold waters, or a generalized occurrence of MHWs some years. This structure is also characterized by a weak positive and non-significant area downstream of Cape Palmas and Cape Three Points that are the two areas where coastal upwelling occurs (see Figure 3a). The time series of this mode (Figure 5e) does not exhibit any MHW events in 1991–1999, which agrees with the wavelet results. MHWs occur during 2002–2006 and 2012–2013, but with weak amplitudes. This time series suggests a low-frequency fluctuation, with a 4-year periodicity, characterized by periods of MHW intensification (2002 to 2006) and upwelling periods (2007–2011 and 2014–2020) over the whole study area. Opposite scores agree with this alternation and could indicate that MHWs are present throughout the area some years, whereas they are practically absent other years. The highest MHW intensities are recorded in 2002, 2012, and 2013.
The second mode (Figure 5b) represents 17% of the total variance. It illustrates an east–west dipole between the two capes where the coastal upwelling occurs. It shows that one cape could experience MHW events, while these events would not occur at the other cape. For example, the associated time series (Figure 5f) shows that MHW events occur downstream of Cape Palmas during 2000–2001, 2009–2011, 2015–2016, and 2018–2019 as scores of these years are consistent with the significant Eof structure in that upwelling area. The years 2004–2008, 2012–2015, 2017, and 2020 exhibit MHW events in Cape Three points as the scores of these years are in accordance with the Eof structure in that upwelling area. Particularly, the 2020 event is the most intense, considering its score.
The third mode (Figure 5c) represents 13% of the total variance. It illustrates a contrast between the northern coast represented by the two capes and the meridional section east of 5° E. This mode shows negative significance in the Ghana–Benin upwelling area and west of Côte d’Ivoire in contrast to the positive significance in the east. The time series (Figure 5g) displays a prolonged period (2002–2016) of cooling in both capes, with the highest value in 2007. This is consistent with Ali et al. [5] and Da-allada et al. [35], who observed a significant cooling at the coast during this period. The high positive value in 2017 and 2020 indicates an intensification of MHWs east of 5° E.
The fourth mode (Figure 5d) accounts for ~6% of the total variance. It illustrates a weak north–south contrast. The significant positive area south of 4° N could be associated with an intensification of MHWs towards the tropical Atlantic cold tongue. This weak north–south contrast is confirmed by lower scores of the time series (Figure 5h).

3.2.3. MHWs Trend Analysis

A complementary analysis of the interannual study of the Eof time series is now conducted by using a statistical diagnostic based on linear regression [36]. This method is used to objectively identify one or several tendency breaks in the Eof scores and when they occur. Figure 6 displays every possible trend for each Eof and the corresponding confidence Student’s t-test on each time segment from a 2-year period to a 22-year period corresponding to the total length of the available Eof time series. For example, when considering the first time series of Eofs (see Figure 6a), the value plotted at the point x = 2012, y = 6 corresponds to the 6-year trend (~5 °C/year) computed over the time segment 2006–2012. One can note that the trends with longer segments are rather weak compared to those corresponding to shorter segments.
For Eof1 (Figure 6a), there is no long-term trend break above 10 years for this structure, even if for time segments above this period the trend remains negative. A significant negative trend is observed from 2013 to 2020, with time segments ranging from 3 to 10 years. There are significant positive 3-year and 6-year trends between 2011 and 2012. The Eof2 graph (Figure 6b) presents significant negative trends in 2004–2006 for a time segment of 3–5 years, in 2013 for a time segment of 3 years and 6 years, and in 2016 for a time segment of 8 years. The only significant positive trend is observed in 2015 for a 3-year time segment. In the case of Eof3 (Figure 6c), a significant negative trend is observed in 2018 for a time segment of 3 years. The latter concerns Eof4 (Figure 6d) for which the time segments range between 3 and 8 years. It shows significant positive trends in 2002, 2008, and 2016, and significant negative trends in 2012–2015 and 2020.

3.3. Overview of the Atmospheric and Ocean Conditions during the MHW Events

In this section, the surface oceanic and atmospheric conditions that could occur before, during, and after MHW events are discussed by analyzing the zonal wind, vertical velocity, and specific humidity in the troposphere (700–1000 hPa), and the LH and SST off the Gulf of Guinea (10° W–10° E; 2° N–6° N). Atmospheric and oceanic parameter composites are constructed by averaging daily anomalies surrounding MHW events, and by averaging daily anomalies six days before and six days after these events. The 6-day period corresponds to the standard deviation of the MHW duration. Daily anomalies of each variable are calculated using the arithmetical difference between each daily value and the long-term daily climatology (1991–2020) during the same calendar periods.

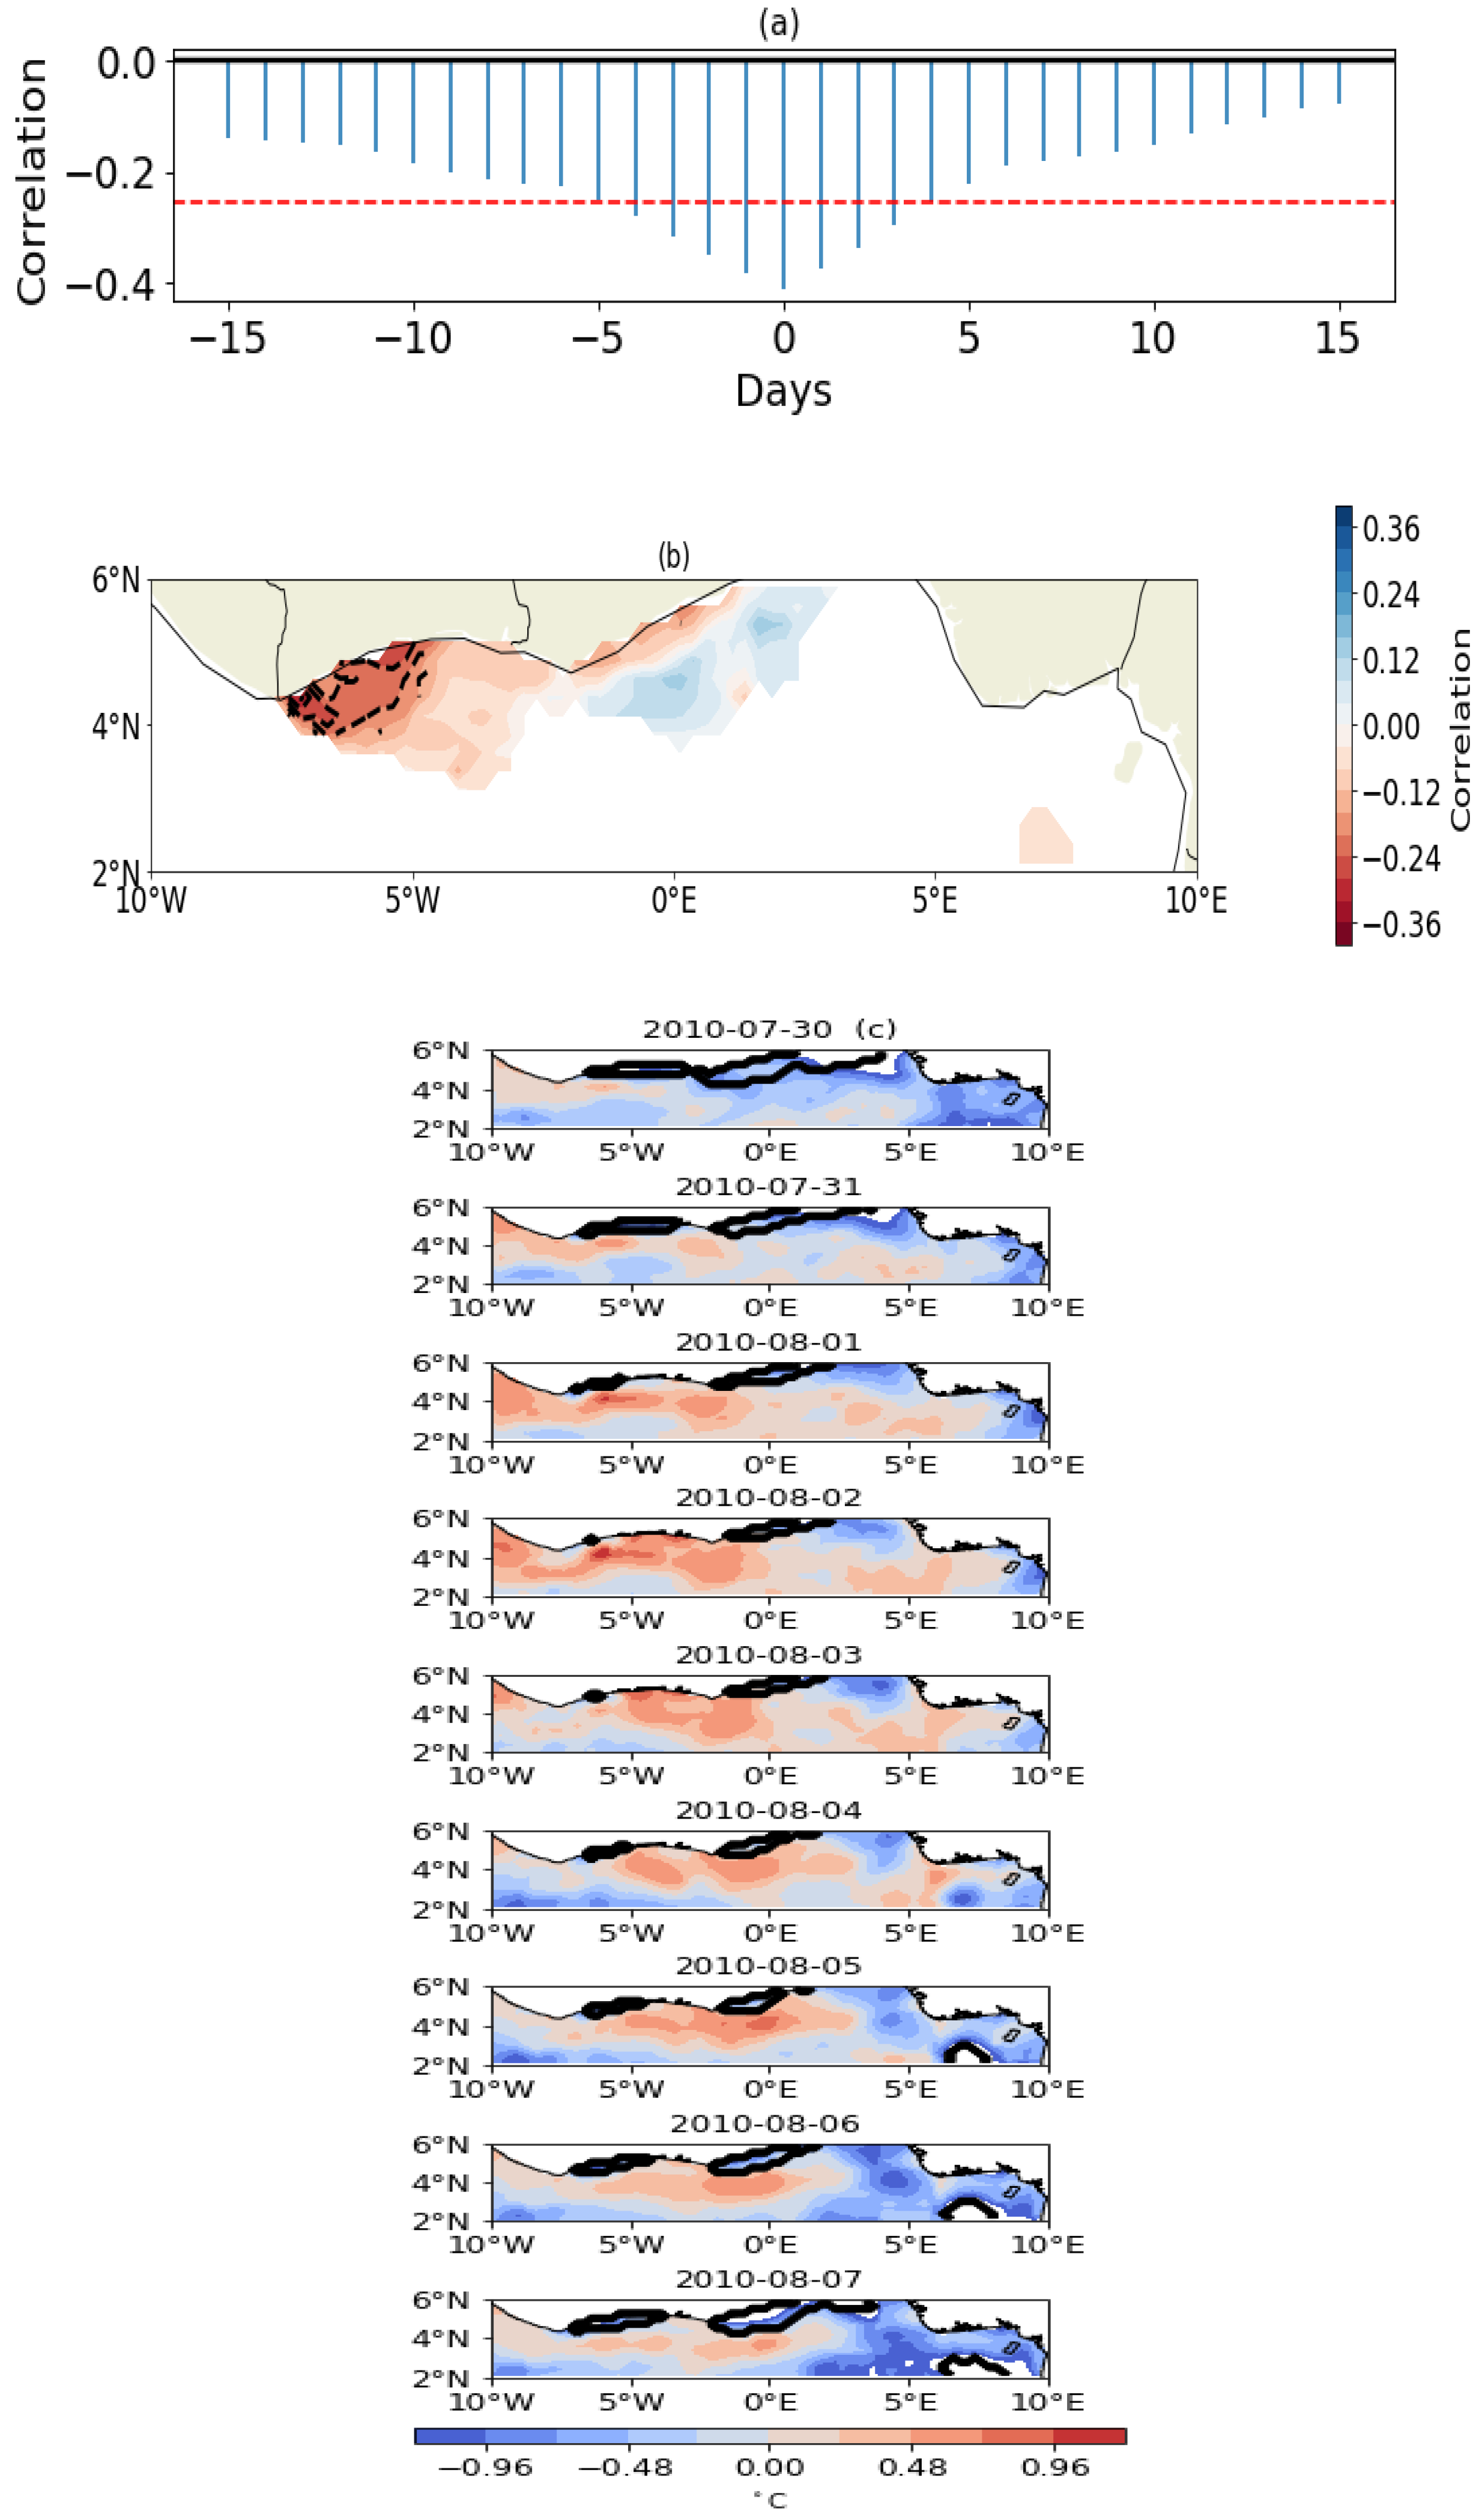
3.3.1. Daily Relationship between MHW and Cooling Surface

A preliminary analysis is carried out by relating the daily values of MHW intensities to cooling surface. Figure 7 shows the lagged correlation series (Figure 7a) and the spatial correlation between these two variables (Figure 7b). Figure 7a shows an opposite and significant evolution between MHWs and the cooling surface. It indicates an onset of MHWs that gradually intensify and reach their maximum values at lag 0. Thereafter, they gradually vanish and are substituted by cold waters. These correlations are more localized, at lag 0, off Cape Palmas (Figure 7b).
A sample evolution of the SST anomalies from 31 July to 06 August 2010 (Figure 7c) indicates a progressive increase in SST off Cape Palmas, associated with a decrease in the cooling surface. The warming west of Cape Palmas (~5° W) seemingly progresses eastwards and inhibits the cooling that is observed there. Later, there is a gradual extinction of warming and a replacement by cold water. This structure is similar to Eof2, but some periods of SST evolution could also be similar to other Eof structures.

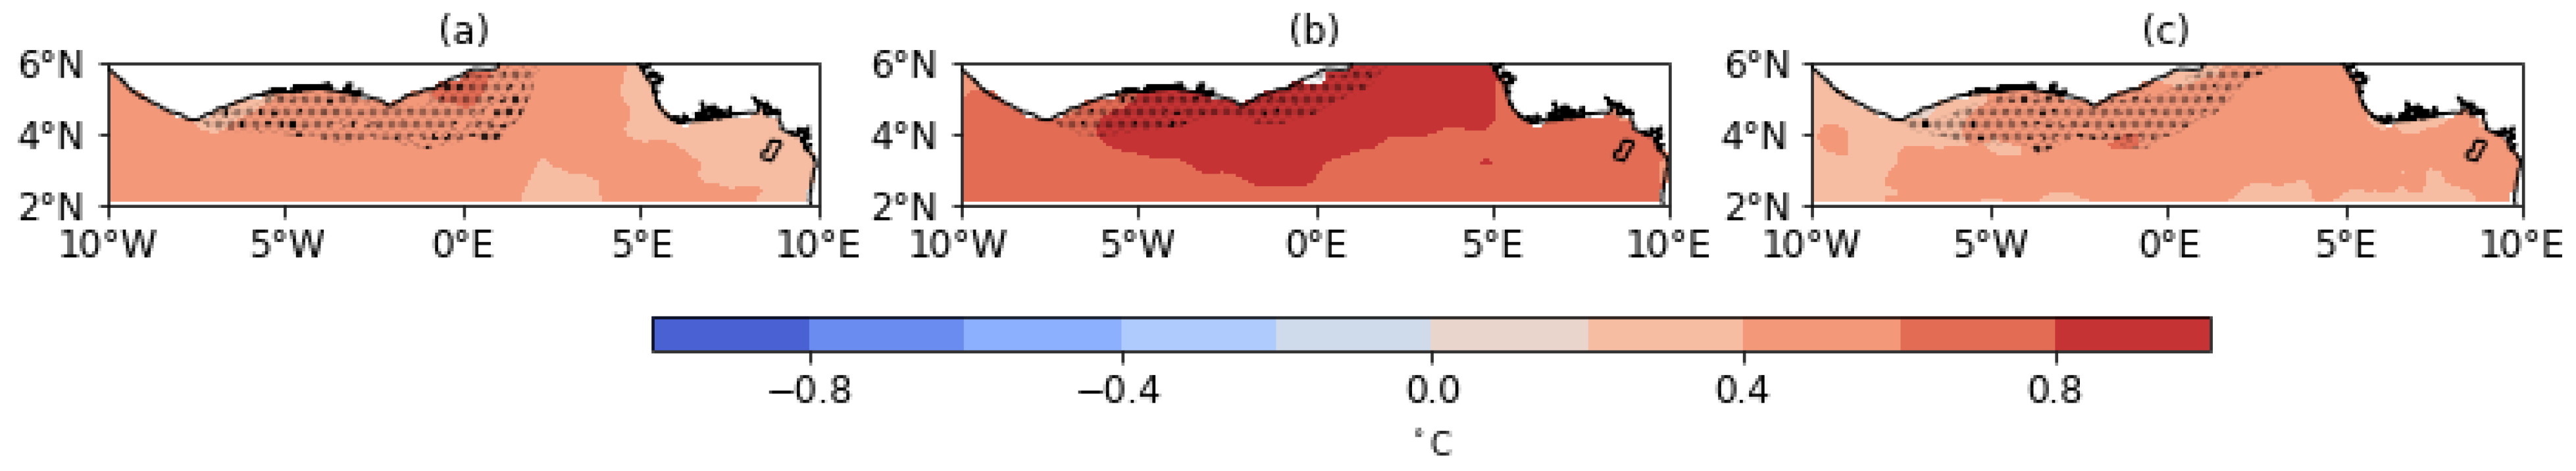
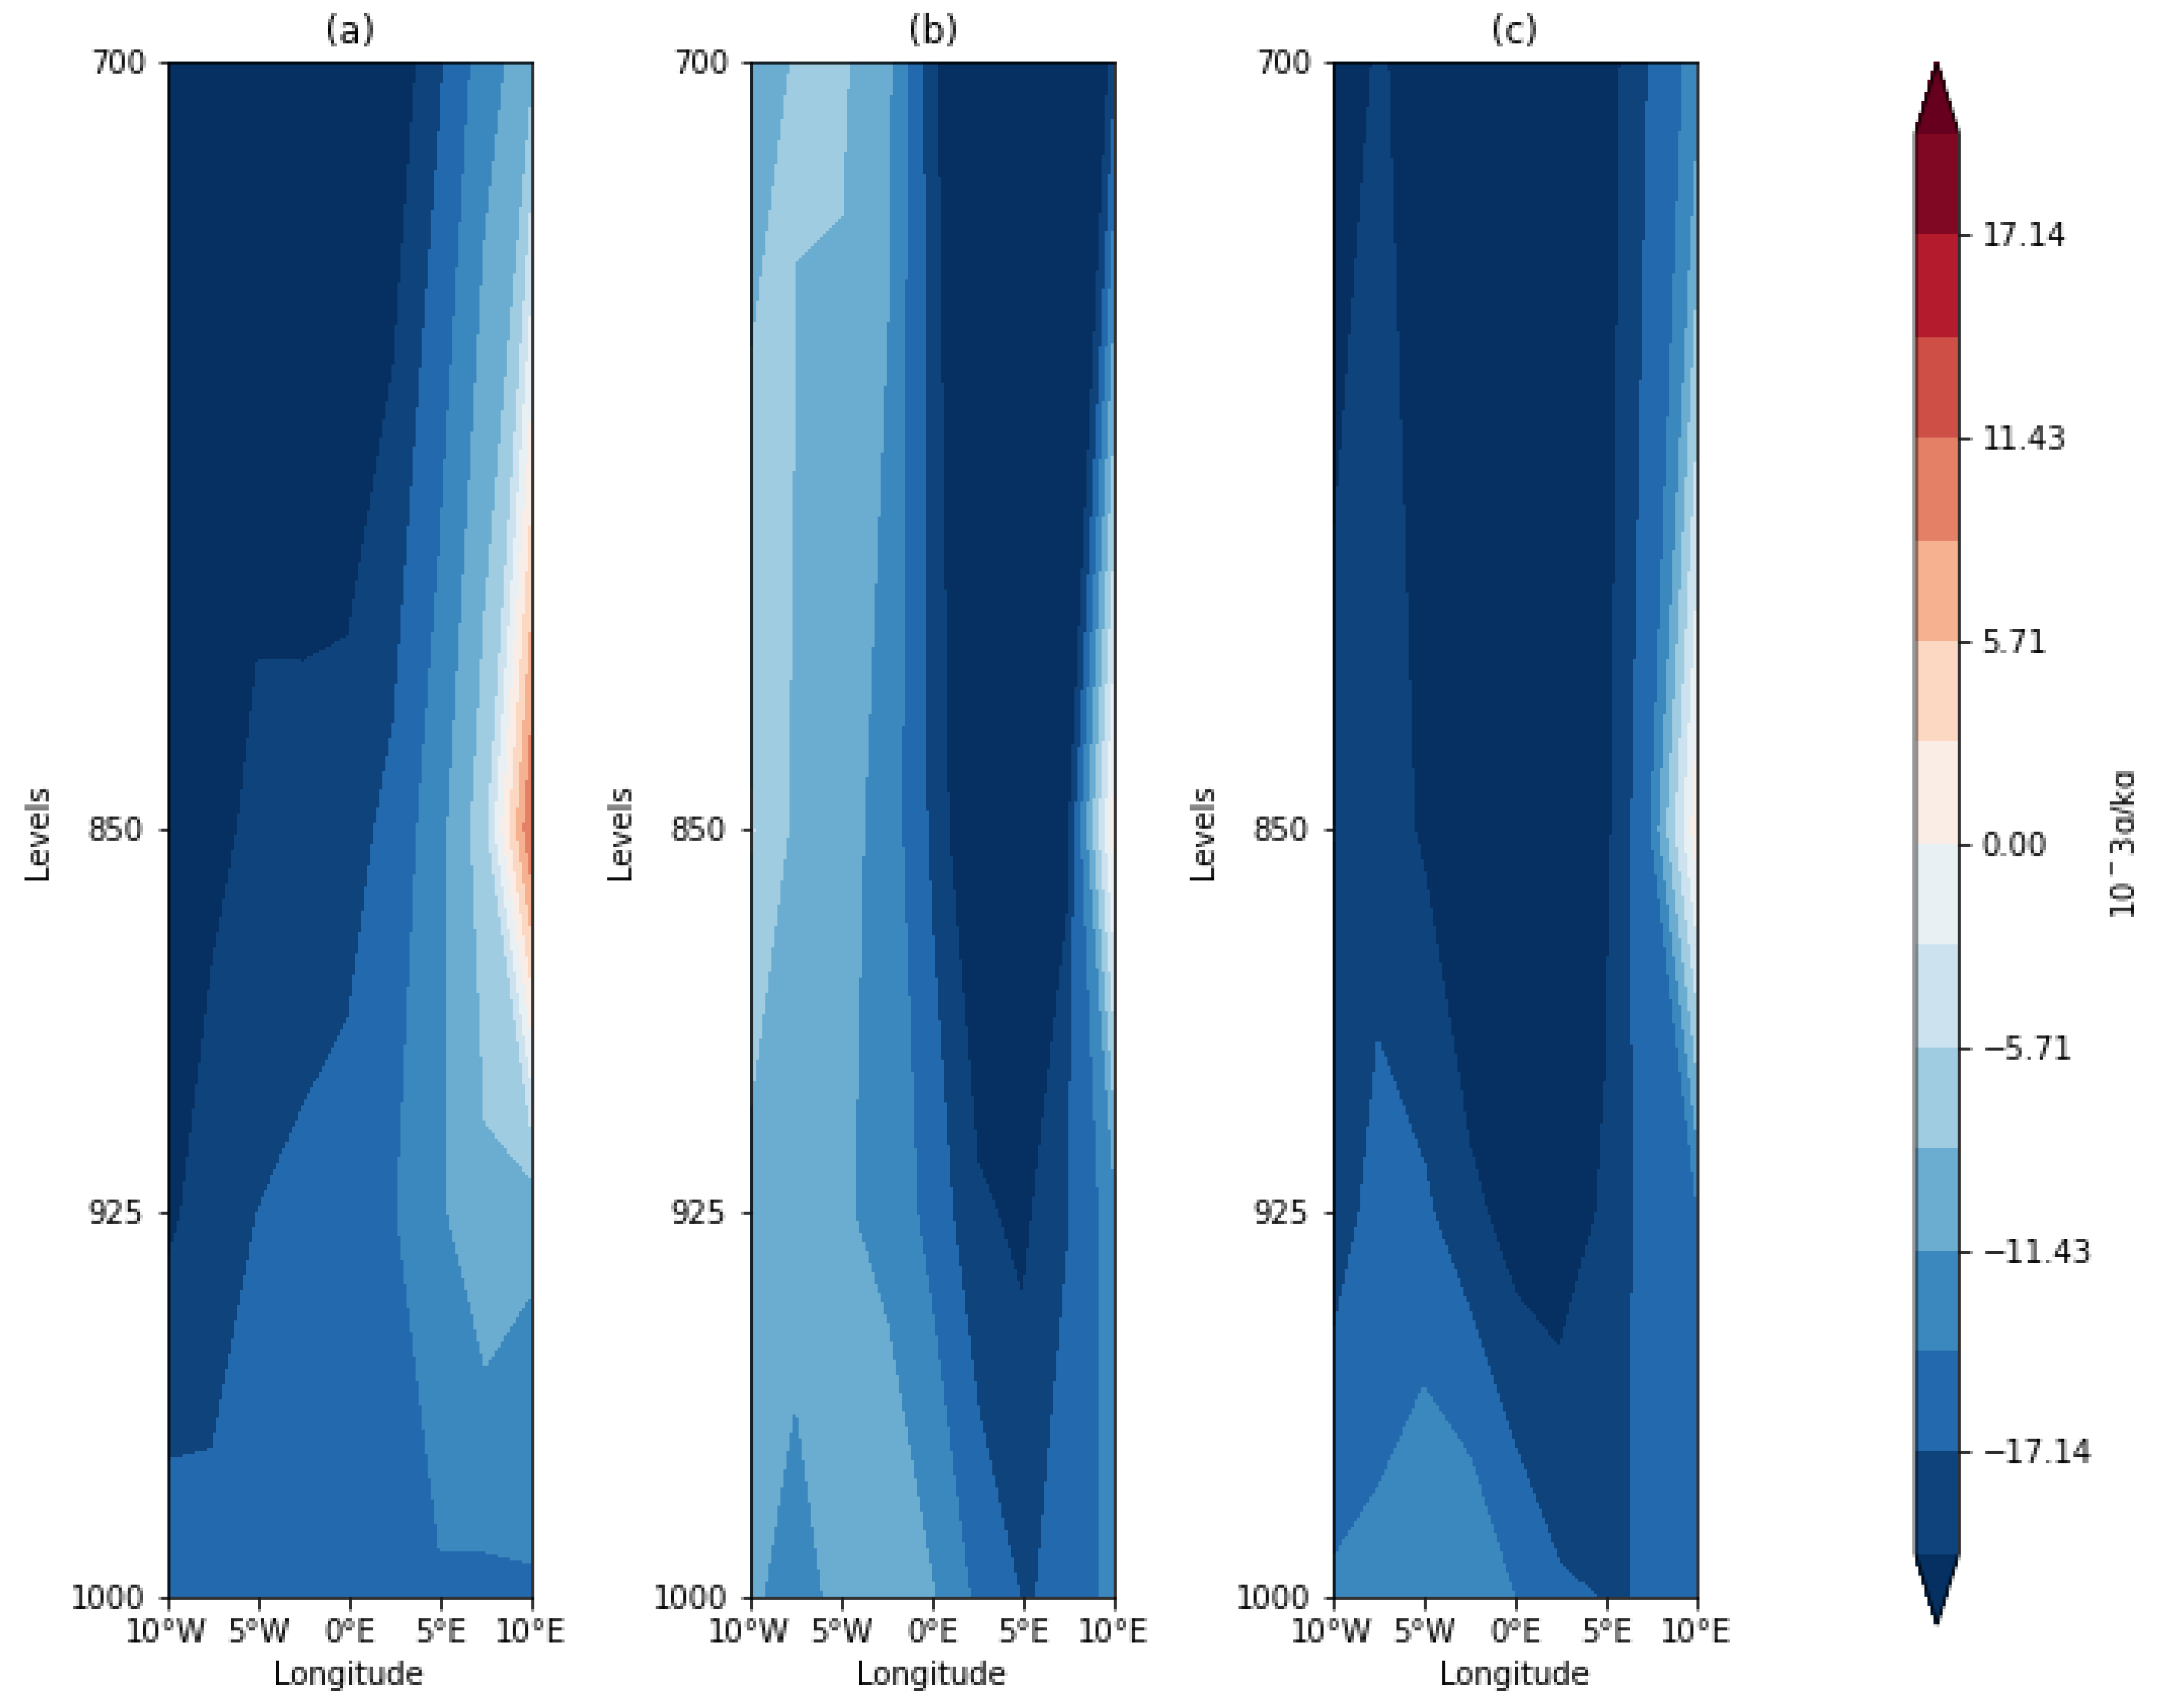
3.3.2. Ocean Surface and Atmospheric Conditions

Figure 8 depicts SST and CUS composites 6 days before (Figure 8a), during (Figure 8b), and 6 days after (Figure 8c) the MHW events. Weak positive SST anomalies (>0.38 °C) are observed prior to MHW events off the Gulf of Guinea (Figure 8a). Along Cape Three Points, a strong warming (>0.4 °C) is noticed at 5° N; 0° E. That surface warming later intensifies during MHW events (>1 °C) by spreading longitudinally between 5° W and 5° E, and latitudinally between 3° N and 6° N (Figure 8b). By the end of the MHW events (Figure 8c), the surface warming decreases significantly (<0.3 °C). This pattern of SST anomalies is characterized by a weak spatial extension of upwelling surface before and during MHW events, whereas it increases at the end.
LH anomaly composites (Figure 9) indicate weak evaporation, marked by positive values between 0 and 7 W·m−2 before the events onset (Figure 9a). These values are located in the eastern part of the study area and lie between 2.5° N and 5° N. This weak evaporation is corroborated by wind anomalies which are almost null along the coast at 4° N or are directed offshore at 3° N. This wind anomaly pattern does not allow for any moisture transport to the continent. During the MHW events (Figure 9b), an excess of evaporation is noticeable in the eastern part of the study area. Positive LH anomalies (>7 W·m−2) are observed around Cape Three Points where positive SST anomalies were previously registered during the occurrence of MHW events. Finally, an increase in excess of evaporation (>14 W·m−2) is observed at the end of the MHW events (Figure 9c). These LH anomalies are almost two times those observed during MHW events. Similarly, they are located in the same region (5° W–5° E, 3° N–6° N) where a large surface warming of the SST was observed. The related wind anomalies’ structure shows vectors almost oriented toward the shoreline, which could reflect an oceanic moisture input on the continent.
Figure 10 depicts altitude–longitude composite diagrams of vertical velocity (in 10−2 Pa·s−1) averaged over 2° N–6° N along 10° W–10° E. Negative values indicate an upward motion of air, which can carry moisture from the ocean to the troposphere, while positive values indicate the subsidence of air. The composite of anomalies illustrates the mean atmospheric conditions before, during, and after the MHW events. The three panels of the composite vertical motion exhibit an upward motion in the troposphere. This upward motion intensifies from the surface into the lower troposphere during the events, and more after the events along the 0–10° E longitudinal band. This band coincides with the area of excess of evaporation observed with LH. The upward motion found in the 0–10° E longitudinal band at 1000 hPa before the MHW events (<−1.229 × 10⁻² Pa·s−1) increases by about 25% on average (<−1.536 × 10⁻² Pa·s−1) during and after those events. Particularly, the large negative values (<−1.843 × 10⁻² Pa·s−1) of upward motion above the surface move from the 0°–10° E band during MHW events to the whole 10° W–10° E longitudinal band in the lower troposphere after those events.
Analogously to the vertical velocity analyses, composite altitude–longitude diagrams of specific humidity anomalies (in g·kg−1) are presented for the same periods (Figure 11). Prior to the MHW events (Figure 11, left), a weak excess of moisture (<0.15 g·kg−1) is observed at 1000 hPa along 5° W–0°. The weak excess of moisture is likely to vanish during the MHW occurrence phase (Figure 11, middle). This value ranges between 0 g·kg−1 and 0.075 g·kg−1 within the same longitudinal band. After the MHW events (Figure 11, right), the specific humidity increases strongly. That suggests an excess of moisture along 10° W–7° E. The specific humidity anomaly is particularly high in the lower layers (925–1000 hPa) along 5° W–5° E, which corresponds to the area of excess of evaporation observed with LH anomalies.

4. Discussion and Summary

Various studies highlighted ocean warming in the tropical Atlantic related to global warming [37,38]. This warming is particularly noticeable along the northern coast of the Gulf of Guinea, off the coast of West African countries. This warming may be responsible for the onset and amplification of some extreme oceanic events known as marine heatwaves (MHWs). The study of the variability of these events and their relationship with coastal upwelling is poorly investigated at the northern coast of the Gulf of Guinea during the monsoon season, which includes the upwelling season. This fact motivates the present study. It also highlights the relationship between MHW events, atmospheric, and ocean surface conditions in this ocean area.
The use of a 30-year daily SST dataset showed a continuous decrease in the cooling surface of the coastal upwelling. This could result in an ocean warming tendency at the northern coast of the Gulf of Guinea as observed by Servain et al. (2014). Upwelling is more frequent around Cape Three Points during the boreal summer, and contrasts with an earlier weakening of upwelling intensity in the west, around Cape Palmas. In fact, the warming is more rapid around Cape Palmas than around Cape Three Points and extends from west to east.
The study of MHW variability indicates a frequent occurrence of such events since 2015 and a decrease in upwelling surface. This is consistent with the oceanic warming observed over the tropical Atlantic in recent decades, although MHWs at the northern coast of the Gulf of Guinea are listed as moderate, due to their weak intensity. The different spatial patterns of MHW events show 3-year, 6-year, and 8-year trends that are consistent with the SST fluctuations in the tropical Atlantic. Indeed, Serena [39] and Zébiak [40] suggested that a significant part of the energy is projected in the 1–5 year frequency band, and that the SST in the equatorial Atlantic also has a significant decadal component for 9–14 year periods. However, these climate fluctuations magnitudes are significantly lesser than those observed in the eastern equatorial Pacific, which are dominated by the El Niño signature.
The relationship between upwelling and MHWs indicates an eastward progression of these extreme oceanic events. This could be related to the transport of warm waters by the Guinea Current, which is closer to the coast. This remark is consistent with Djakouré et al. [26], who noticed that the upwelling east of Cape Palmas disappeared in the absence of the Guinea Current detachment that indicates the presence of warm waters, in contrast with the upwelling east of Cape Three Points, which was still present. Such a phenomenon occurred particularly in 2009–2011 [25].
MHW occurrences lead to an excess of evaporation at the ocean surface. The onset of excess of evaporation during MHW events is associated with a strong deceleration of surface winds that do not allow for the transport of generated oceanic moisture to the surface and then localized in the lower atmospheric layers to the coast of the Gulf of Guinea. During MHW events, the ocean surface warming associated with the wind deceleration could allow for more heat storage into the ocean. Such remark is consistent with Liu et al. [41], who showed that Ocean heat uptake penetrated deeply into the Atlantic and Southern Oceans during the recent warming. Then, the heat is released after the MHW events. The excess of evaporation observed post-MHW events could contribute to the ocean cooling at the northern coast of the Gulf of Guinea, and thus to the establishment of the coastal upwelling.
As a conclusion, different spatial patterns of MHW events are related to coastal upwelling at the northern coast of the Gulf of Guinea. Similarly, surface ocean and atmospheric conditions are modified according to MHW periods. These changes take place before, during, and after MHW events. Further research is required to understand how this change could influence the marine ecosystem and local fisheries’ resources, and how it could be quantified. Moreover, this research can help to understand how this change in weather conditions could influence or contribute to the intensification of extreme rainfall episodes on the continent.

Author Contributions

Conceptualization, Y.K.; methodology, M.K., Y.K. and S.T.; formal analysis M.K.; writing—original draft preparation, M.K., S.T., S.D., Y.K. and M.A.; writing—review and editing, M.K., S.D., S.T., Y.K. and M.A.; funding acquisition, S.D.; supervision, Y.K. All authors have read and agreed to the published version of the manuscript.

Funding

This research work was supported by the EU H2020 TRIATLAS project under Grant Agreement 817578.

Data Availability Statement

All data used in this study are publicly available. NOAA OISST dataset can be download at https://www.ncei.noaa.gov/products/optimum-interpolation-sst (accessed on 13 March 2022).

Acknowledgments

The authors thank the “Jeune Équipe Associée à l’IRD (JEAI)—Interactions et Variabilité Océan Atmosphère Régionales liées à l’Upwelling (IVOARE-UP)” for its financial support. The authors would like to thank the anonymous reviewers for their valuable comments and suggestions to improve the quality of the paper.

Conflicts of Interest

The authors declare no conflict of interest.

References

  1. Eltahir, E.A.B.; Gong, C. Dynamics of Wet and Dry Years in West Africa. J. Clim. 1996, 9, 1030–1042. [Google Scholar] [CrossRef]
  2. Gu, G.; Adler, R.F. Seasonal Evolution and Variability Associated with the West African Monsoon System. J. Clim. 2004, 17, 3364–3377. [Google Scholar] [CrossRef]
  3. Pauly, D.; Christensen, V. Primary Production Required to Sustain Global Fisheries. Nature 1995, 374, 255–257. [Google Scholar] [CrossRef]
  4. Kouadio, Y.K.; Ochou, D.A.; Servain, J. Tropical Atlantic and Rainfall Variability in Côte d’Ivoire. Geophys. Res. Lett. 2003, 30, 4. [Google Scholar] [CrossRef]
  5. Ali, K.E.; Kouadio, K.Y.; Zahiri, E.-P.; Aman, A.; Assamoi, A.P.; Bourles, B. Influence of the Gulf of Guinea Coastal and Equatorial Upwellings on the Precipitations along Its Northern Coasts during the Boreal Summer Period. Asian J. Appl. Sci. 2011, 4, 271–285. [Google Scholar] [CrossRef]
  6. Morlière, A. Les Saisons Marines Devant Abidjan. In Documents Scientifiques du Centre Recherche Océanographique; CRO: Abidjan, Côte d’Ivoire, 1970; Volume 1. [Google Scholar]
  7. Colin, C. Coastal upwelling events in front of the Ivory Coast during the FOCAL program. Oceanol. Acta 1988, 11, 125–138. [Google Scholar]
  8. Kouadio, Y.K.; Djakouré, S.; Aman, A.; Ali, K.E.; Koné, V.; Toualy, E. Characterization of the Boreal Summer Upwelling at the Northern Coast of the Gulf of Guinea Based on the PROPAO In Situ Measurements Network and Satellite Data. Int. J. Oceanogr. 2013, 2013, 1–11. [Google Scholar] [CrossRef] [Green Version]
  9. IPCC. Global Warming of 1.5 °C: An IPCC special Report on the Impacts of Global Warming of 1.5 °C above Pre-Industrial Levels and Related Global Greenhouse Gas Emission Pathways, in the Context of Strengthening the Global Response to the Threat of Climate Change, Sustainable Development, and Efforts to Eradicate Poverty; Sustainable Development, and Efforts to Eradicate Poverty: Geneva, Switzerland, 2018; p. 538. [Google Scholar]
  10. Servain, J.; Caniaux, G.; Kouadio, Y.K.; McPhaden, M.J.; Araujo, M. Recent Climatic Trends in the Tropical Atlantic. Clim. Dyn. 2014, 43, 3071–3089. [Google Scholar] [CrossRef]
  11. Odekunle, T.O.; Eludoyin, A.O. Sea Surface Temperature Patterns in the Gulf of Guinea: Their Implications for the Spatio-Temporal Variability of Precipitation in West Africa. Int. J. Climatol. 2008, 28, 1507–1517. [Google Scholar] [CrossRef]
  12. Francis, E.A.; Oghenekevwe, C.O. Detection and Spatio-Temporal Variation of Marine Heatwaves in the Gulf of Guinea, Nigeria. J. Oceanogr. Mar. Sci. 2019, 10, 11–21. [Google Scholar] [CrossRef] [Green Version]
  13. Hobday, A.J.; Alexander, L.V.; Perkins, S.E.; Smale, D.A.; Straub, S.C.; Oliver, E.C.J.; Benthuysen, J.A.; Burrows, M.T.; Donat, M.G.; Feng, M.; et al. A Hierarchical Approach to Defining Marine Heatwaves. Prog. Oceanogr. 2016, 141, 227–238. [Google Scholar] [CrossRef]
  14. Hobday, A.; Oliver, E.; Sen Gupta, A.; Benthuysen, J.; Burrows, M.; Donat, M.; Holbrook, N.; Moore, P.; Thomsen, M.; Wernberg, T.; et al. Categorizing and Naming Marine Heatwaves. Oceanography 2018, 31, 162–173. [Google Scholar] [CrossRef] [Green Version]
  15. Lee, S.; Park, M.-S.; Kwon, M.; Kim, Y.H.; Park, Y.-G. Two Major Modes of East Asian Marine Heatwaves. Environ. Res. Lett. 2020, 15, 074008. [Google Scholar] [CrossRef]
  16. Feng, M.; McPhaden, M.J.; Xie, S.-P.; Hafner, J. La Niña Forces Unprecedented Leeuwin Current Warming in 2011. Sci. Rep. 2013, 3, 1277. [Google Scholar] [CrossRef] [PubMed] [Green Version]
  17. Pearce, A.F.; Feng, M. The Rise and Fall of the “Marine Heat Wave” off Western Australia during the Summer of 2010/2011. J. Mar. Syst. 2013, 111–112, 139–156. [Google Scholar] [CrossRef]
  18. Oliver, E.C.J.; Benthuysen, J.A.; Bindoff, N.L.; Hobday, A.J.; Holbrook, N.J.; Mundy, C.N.; Perkins-Kirkpatrick, S.E. The Unprecedented 2015/16 Tasman Sea Marine Heatwave. Nat. Commun. 2017, 8, 16101. [Google Scholar] [CrossRef] [Green Version]
  19. Sparnocchia, S.; Schiano, M.E.; Picco, P.; Bozzano, R.; Cappelletti, A. The Anomalous Warming of Summer 2003 in the Surface Layer of the Central Ligurian Sea (Western Mediterranean). Ann. Geophys. 2006, 24, 443–452. [Google Scholar] [CrossRef]
  20. Olita, A.; Sorgente, R.; Natale, S.; Gaberšek, S.; Ribotti, A.; Bonanno, A.; Patti, B. Effects of the 2003 European Heatwave on the Central Mediterranean Sea: Surface Fluxes and the Dynamical Response. Ocean Sci. 2007, 3, 273–289. [Google Scholar] [CrossRef] [Green Version]
  21. Caputi, N.; Kangas, M.; Denham, A.; Feng, M.; Pearce, A.; Hetzel, Y.; Chandrapavan, A. Management Adaptation of Invertebrate Fisheries to an Extreme Marine Heat Wave Event at a Global Warming Hot Spot. Ecol. Evol. 2016, 6, 3583–3593. [Google Scholar] [CrossRef]
  22. Walsh, J.E.; Thoman, R.L.; Bhatt, U.S.; Bieniek, P.A.; Brettschneider, B.; Brubaker, M.; Danielson, S.; Lader, R.; Fetterer, F.; Holderied, K.; et al. The High Latitude Marine Heat Wave of 2016 and Its Impacts on Alaska. Bull. Am. Meteorol. Soc. 2018, 99, S39–S43. [Google Scholar] [CrossRef]
  23. Acheampong, E.; Mantey, P.; Weremfo, A. Potential Impact of Marine Heatwaves on Selected Phytoplankton Adapted to the Gulf of Guinea during Stable Hydrographic Periods. Afr. J. Mar. Sci. 2021, 43, 77–86. [Google Scholar] [CrossRef]
  24. Binet, D. Influence des variations climatiques sur la pêcherie des Sardinella aurita ivoiro-ghanéenne: Relation sécheresse-surpêche. Oceanol. Acta 1982, 5, 443–452. [Google Scholar]
  25. Djakouré, S.; Penven, P.; Bourlès, B.; Veitch, J.; Koné, V. Coastally Trapped Eddies in the North of the Gulf of Guinea. J. Geophys. Res. Oceans 2014, 119, 6805–6819. [Google Scholar] [CrossRef]
  26. Djakouré, S.; Penven, P.; Bourlès, B.; Koné, V.; Veitch, J. Respective Roles of the Guinea Current and Local Winds on the Coastal Upwelling in the Northern Gulf of Guinea. J. Phys. Oceanogr. 2017, 47, 1367–1387. [Google Scholar] [CrossRef]
  27. Ta, S.; Kouadio, K.Y.; Ali, K.E.; Toualy, E.; Aman, A.; Yoroba, F. West Africa Extreme Rainfall Events and Large-Scale Ocean Surface and Atmospheric Conditions in the Tropical Atlantic. Adv. Meteorol. 2016, 2016, 1940456. [Google Scholar] [CrossRef] [Green Version]
  28. Reynolds, R.W.; Rayner, N.A.; Smith, T.M.; Stokes, D.C.; Wang, W. An Improved In Situ and Satellite SST Analysis for Climate. J. Clim. 2002, 15, 1609–1625. [Google Scholar] [CrossRef]
  29. Kalnay, E.; Kanamitsu, M.; Kistler, R.; Collins, W.; Deaven, D.; Gandin, L.; Iredell, M.; Saha, S.; White, G.; Woollen, J.; et al. The NCEP/NCAR 40-Year Reanalysis Project. Bull. Am. Meteorol. Soc. 1996, 77, 437–471. [Google Scholar] [CrossRef]
  30. Caniaux, G.; Giordani, H.; Redelsperger, J.-L.; Guichard, F.; Key, E.; Wade, M. Coupling between the Atlantic Cold Tongue and the West African Monsoon in Boreal Spring and Summer. J. Geophys. Res. 2011, 116, C04003. [Google Scholar] [CrossRef]
  31. Bakun, A. Guinea Current Upwelling. Nature 1978, 271, 147–150. [Google Scholar] [CrossRef]
  32. Oliver, E.C.J.; Donat, M.G.; Burrows, M.T.; Moore, P.J.; Smale, D.A.; Alexander, L.V.; Benthuysen, J.A.; Feng, M.; Sen Gupta, A.; Hobday, A.J.; et al. Longer and More Frequent Marine Heatwaves over the Past Century. Nat. Commun. 2018, 9, 1324. [Google Scholar] [CrossRef] [Green Version]
  33. North, G.R.; Bell, T.L.; Cahalan, R.F.; Moeng, F.J. Sampling Errors in the Estimation of Empirical Orthogonal Functions. Mon. Weather Rev. 1982, 110, 699–706. [Google Scholar] [CrossRef]
  34. Servain, J.; Legler, D.M. Empirical Orthogonal Function Analyses of Tropical Atlantic Sea Surface Temperature and Wind Stress: 1964–1979. J. Geophys. Res. 1986, 91, 14181. [Google Scholar] [CrossRef]
  35. Da-Allada, C.Y.; Agada, J.; Baloïtcha, E.; Hounkonnou, M.N.; Jouanno, J.; Alory, G. Causes of the Northern Gulf of Guinea Cold Event in 2012. J. Geophys. Res. Oceans 2021, 126, e2021JC017627. [Google Scholar] [CrossRef]
  36. Liebmann, B.; Dole, R.M.; Jones, C.; Bladé, I.; Allured, D. Influence of Choice of Time Period on Global Surface Temperature Trend Estimates. Bull. Am. Meteorol. Soc. 2010, 91, 1485–1492. [Google Scholar] [CrossRef]
  37. Carton, J.A.; Huang, B. Warm Events in the Tropical Atlantic. J. Phys. Oceanogr. 1994, 24, 888–903. [Google Scholar] [CrossRef]
  38. Yang, Y.; Wu, L.; Guo, Y.; Gan, B.; Cai, W.; Huang, G.; Li, X.; Geng, T.; Jing, Z.; Li, S.; et al. Greenhouse Warming Intensifies North Tropical Atlantic Climate Variability. Sci. Adv. 2021, 7, eabg9690. [Google Scholar] [CrossRef] [PubMed]
  39. Illig, S. Variabilité Basse Fréquence de l’Atlantique Tropical: Rôle de la Dynamique Océanique Équatoriale et Influence d’El Niño Southern Oscillation. Ph.D. Thesis, Université Paul Sabatier—Toulouse III, Toulouse, France, 2005. [Google Scholar]
  40. Zebiak, S.E. Air–Sea Interaction in the Equatorial Atlantic Region. J. Clim. 1993, 6, 1567–1586. [Google Scholar] [CrossRef]
  41. Liu, W.; Xie, S.-P.; Lu, J. Tracking Ocean Heat Uptake during the Surface Warming Hiatus. Nat. Commun. 2016, 7, 10926. [Google Scholar] [CrossRef]
Figure 1. The tropical Atlantic Ocean. The orange box shows the northern coast of the Gulf of Guinea.
Climate 10 00199 g001
Figure 2. Hovmöller diagrams of (a) monthly cooling surface (b) and monthly cooling surface anomalies of the study area.
Climate 10 00199 g002
Figure 3. (a) Longitude–time diagram of the cooling surface at the northern coast of the Gulf of Guinea, (b) annual evolution of the index and duration of coastal upwelling, (c) and correlogram between the characteristic upwelling parameters. The numbers inside the correlogram represent the correlation coefficients and are proportional to the colors.
Climate 10 00199 g003aClimate 10 00199 g003b
Figure 4. (a) Number of MHWs during the May–October period from 1991 to 2020 calculated over 10° W–10° E; 2° N–6° N. (b) Wavelet of MHWs over the same area and period, and (c) the associated spectrum.
Climate 10 00199 g004
Figure 5. The first four Eof spatial patterns of MHW intensities (ad) and their corresponding time series (eh). The black dots show the significant areas at the 95% level while the blue curves are the time series.
Climate 10 00199 g005
Figure 6. Trends of the four Eof time series (ad) from 1991 to 2020 as a function of length of time segment and ending year of calculation; the black contours provide the confidence ranking Student’s t-test.
Climate 10 00199 g006
Figure 7. (a) Lag correlation between the upwelling surface and MHWs from May to October in the northern Gulf of Guinea. The dashed red horizontal line represents a 99% significance. (b) Correlation map determined at 99% significance (dashed line) between upwelling surface and MHWs from 1 May to 31 October. (c) Example of the evolution of the SST anomaly and the cooling surface from 31 July to 6 August 2010.
Climate 10 00199 g007
Figure 8. Latitude–longitude composite anomalies of SST (°C) and CUS (km2) averaged during six days before the MHW events (a), during the periods of the selected events (b), and during six days after the MHW events (c).
Climate 10 00199 g008
Figure 9. Latitude–longitude composite anomalies of LH (W·m−2) and surface wind (m·s−1) averaged during six days before the MHW events (a), during the periods of the selected events (b), and during six days after the MHW events (c). The arrows on the map show the wind speed.
Climate 10 00199 g009
Figure 10. Altitude–longitude composite anomalies of Omega (Pa·s−1) averaged (a) during six days before the MHW events, (b) during the periods of the selected events, and (c) during six days after the MHW events.
Climate 10 00199 g010
Figure 11. Altitude–longitude composite anomalies of specific humidity (g·kg−1) averaged (a) during six days before the MHW events, (b) during the periods of the selected events, and (c) during six days after the MHW events.
Climate 10 00199 g011
Publisher’s Note: MDPI stays neutral with regard to jurisdictional claims in published maps and institutional affiliations.

