


Climate 2025, 13(11), 220; https://doi.org/10.3390/cli13110220 (registering DOI) - 26 Oct 2025
Abstract
The hydrological response to meteorological drought is often nonlinear, due to physiographic features and human activities, necessitating methodologies that surpass simple drought indices. This study investigates whether drought propagation can be statistically modeled, identifies factors influencing the time lag between meteorological and hydrological
[...] Read more.
The hydrological response to meteorological drought is often nonlinear, due to physiographic features and human activities, necessitating methodologies that surpass simple drought indices. This study investigates whether drought propagation can be statistically modeled, identifies factors influencing the time lag between meteorological and hydrological droughts, and evaluates the most suitable temporal scales of drought indicators. Meteorological droughts were detected using Standardized Precipitation Index (SPI), while hydrological droughts were identified by the Adapted Threshold Level Method (ATLM), which balances available reservoir volume and the water demand, including withdrawals and evaporation losses. Castanhão, Banabuiú, and Orós reservoirs, in the State of Ceará, Brazil, were used to study drought events, across three aggregated time scales of 12, 24, and 36 months. The propagation time was determined using three indicators, corresponding to onset (Δb), peak (Δp), and conclusion (Δe) lags. Longer meteorological droughts were found to propagate more slowly to hydrological systems, with temporal lags following a consistent order of Δp > Δb > Δe. The combination of SPI-12 and ATLM-36 droughts provided the strongest and most consistent positive correlations (95% confidence level) between drought duration and all three lag markers. This combination offers a robust framework for modeling drought propagation dynamics and improving water resource management strategies.
Full article
(This article belongs to the Special Issue Global Warming and Extreme Drought)
►
Show Figures
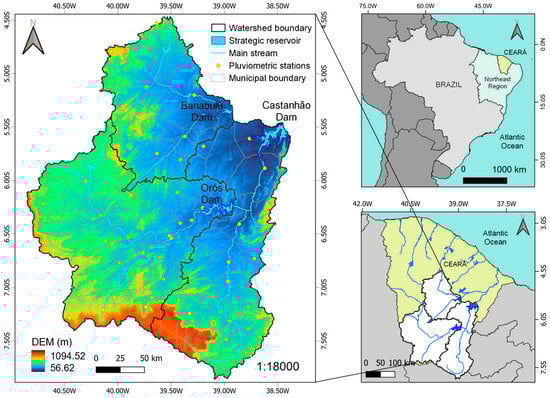
Figure 1


