1. Introduction
Drought and water scarcity is a topic that has always been considered a serious problem in water management in many countries. However, it resonates even more in previous years due to the increasing evidence of climate change impacts on the hydrological regime. The air temperature from 2015 to 2021 was the warmest on the record [
1] and is continuously predicted to rise [
2,
3,
4], which will possibly lead to increased rate of evapotranspiration, thus escalating the continuous deterioration of river ecosystems and the risk of increased appearance of low flows and droughts [
5,
6].
Low flows and droughts are being studied from various points of view, e.g., statistical test and trend analysis [
7,
8,
9,
10], variations of flow duration and flow duration frequency analysis [
11,
12,
13], and the use of indicators of hydrological alteration [
14].
The assessment of the changes in the runoff regime, especially in the area of low flows, is also important for appropriate setting of the so-called ecological flows [
15]. Ecological flow is a governance threshold for maintaining the sustainable status of river ecosystems while managing the increasing demands of human consumption, as the projected global water demand increase is 55% between 2000 and 2050 [
16]. The establishment of such a threshold widely varies from country to country by definition and resulting methodology, and there are still a number of questions and uncertainties to be addressed [
17,
18,
19,
20,
21,
22].
Even though droughts and low flows have also been studied in Slovakia [
23,
24,
25,
26,
27], the methodology for nationwide implementation of ecological flows is still being discussed by Slovak experts in various fields (e.g., management of dams, fisheries, energy consumption, ecology, etc.).
Therefore, this work is part of a broader study conducted by the Slovak Hydrometeorological Institute (SHMI), focused on the assessment of drought on surface watercourses in Slovakia [
28]. The article is focused on the methods driven mainly by the statistical analysis of the hydrological data: the flow duration curves (FDCs) in the area of low flows and the assessment of non-flow characteristics of drought (number of days below a selected threshold and the seasonality of their occurrence). The characteristics of the 2001–2015 period were also compared to those of the 1961–2000 reference period to identify the potential changes in the hydrological regime. The outputs of these analyses are important for water management, setting the design hydrological characteristics for water management decisions, planning and proposals of appropriate measures, and are intended to be used as a hydrological basis for the development of a new methodology for setting the values of ecological flow limits in Slovakia.
2. Materials and Methods
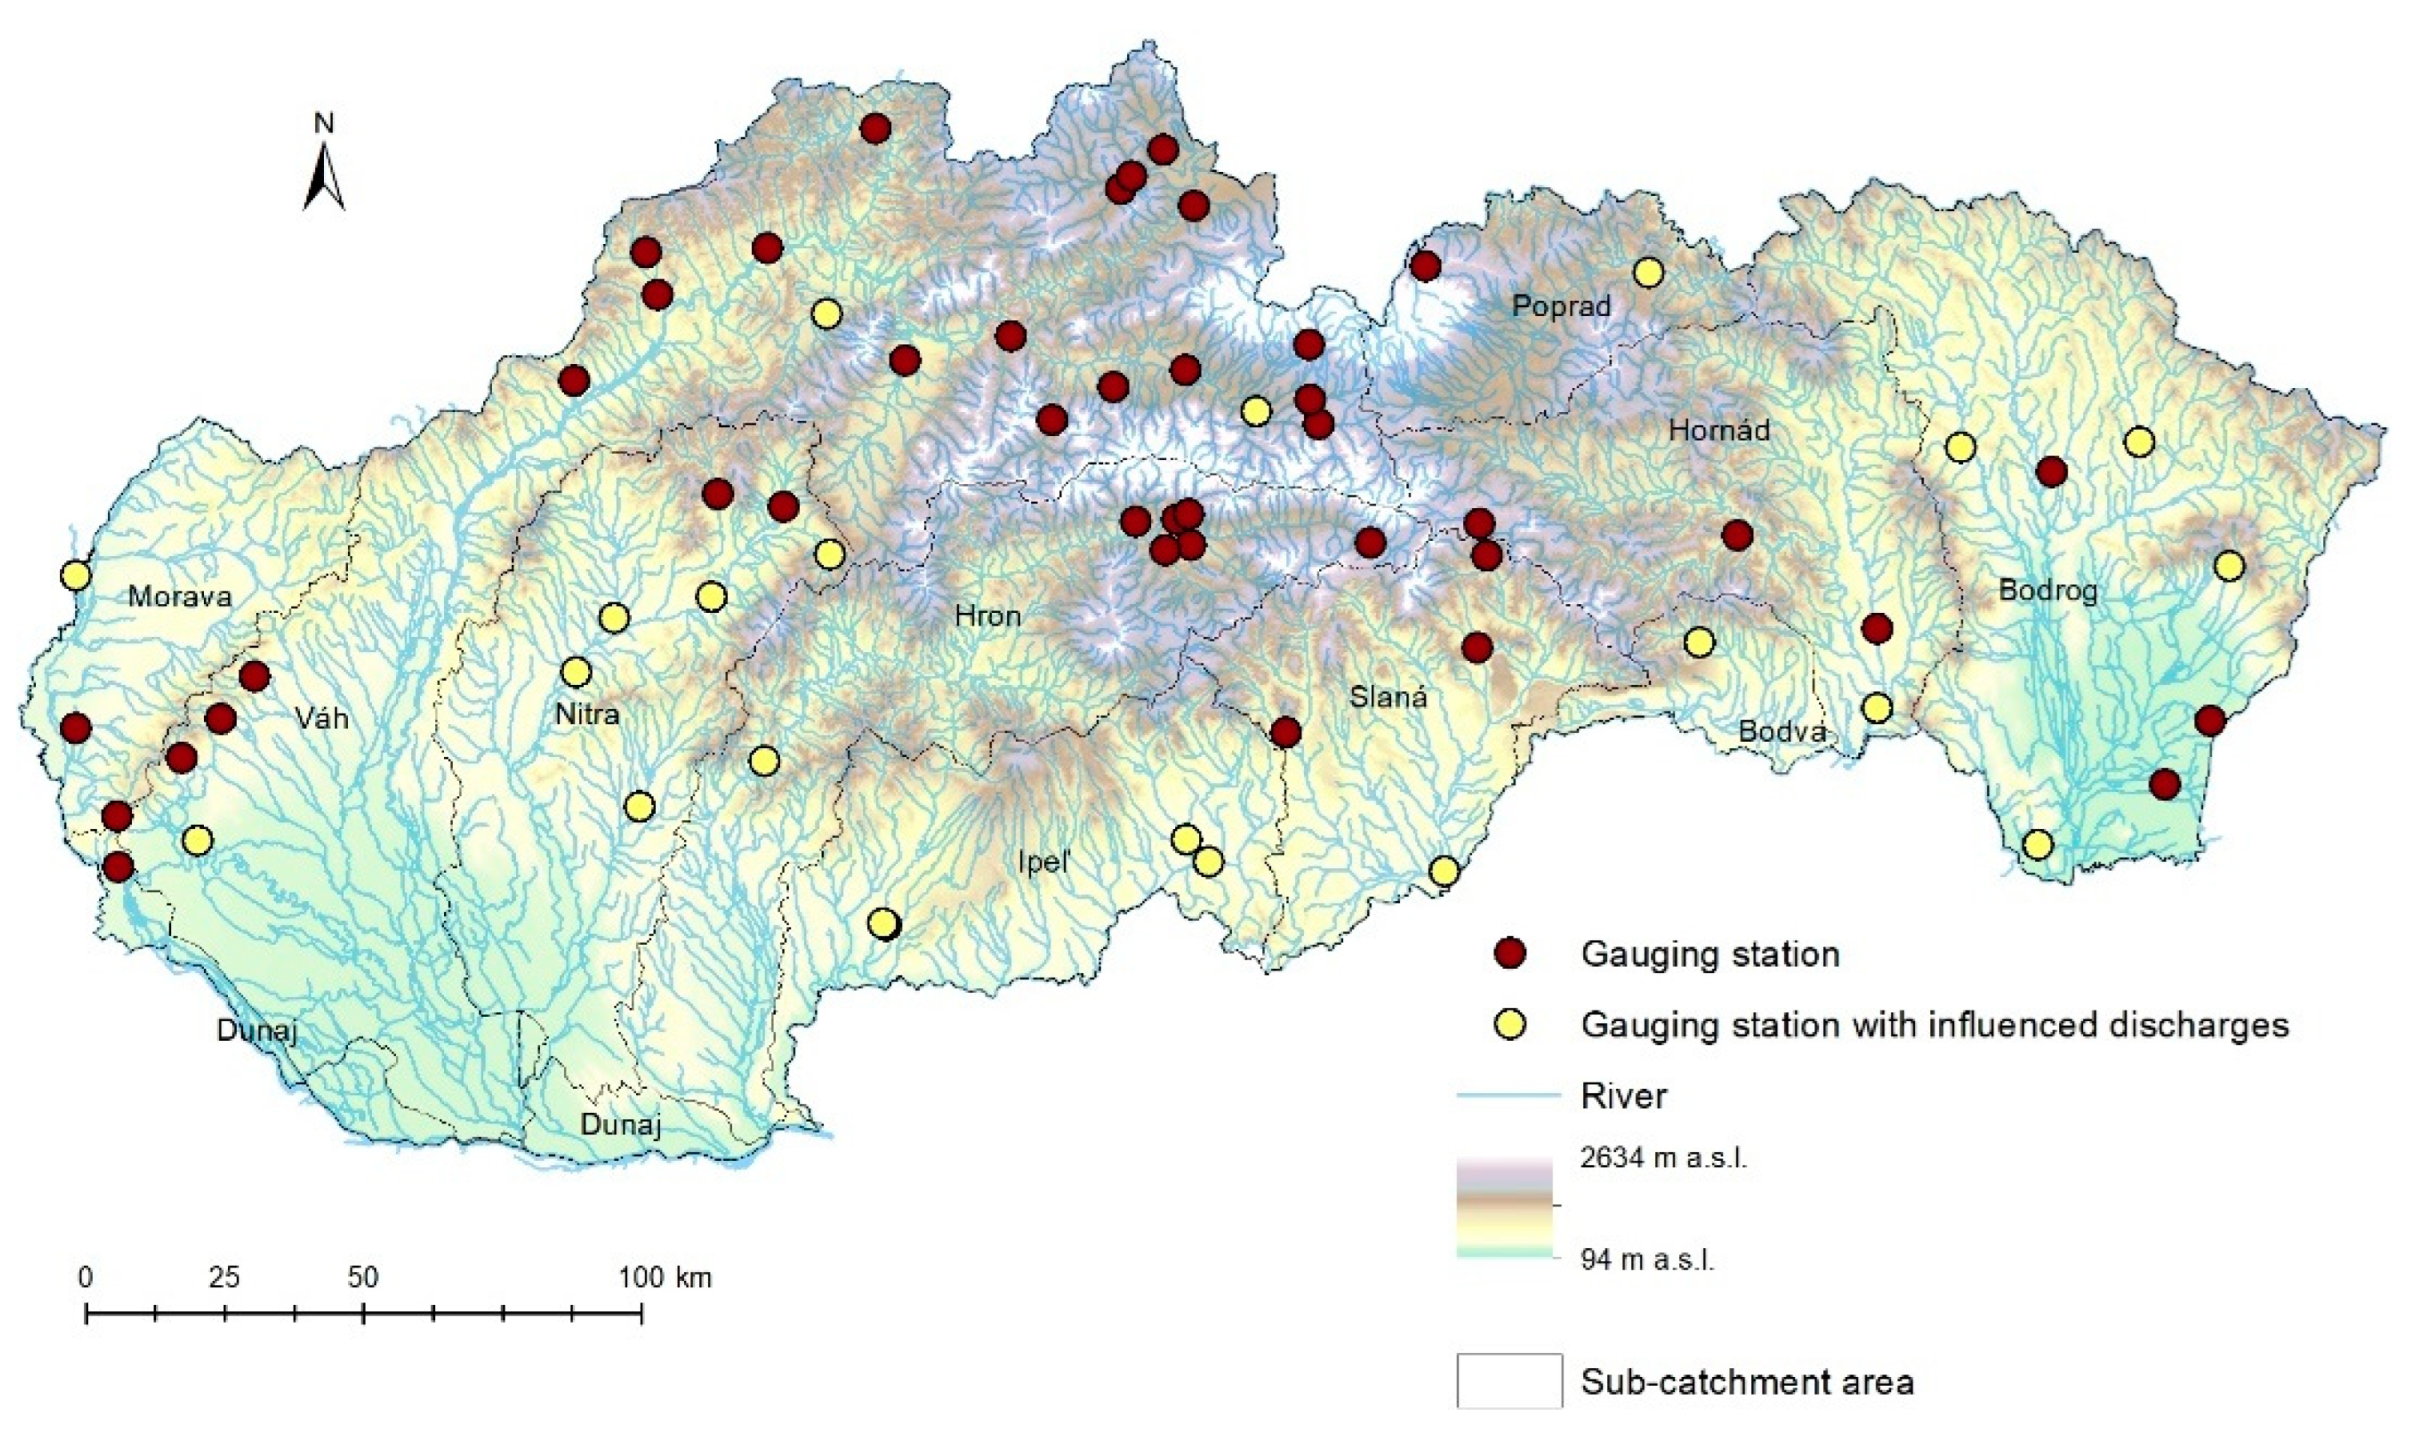
We selected 42 representative water-gauging stations (WSs) in Slovakia with a period of observation since at least 1961 and with little or no anthropogenic influence on discharges. For a more even coverage of the territory of Slovakia, we also added 21 stations with the hydrological regime partially influenced by human activities for evaluation because, especially in lowland areas, the regime at most WSs has been influenced by abstractions for agriculture and industry as well as by manipulations on water reservoirs. The results from these WSs were considered with respect to this fact and were not directly used to generalize the results. The spatial distribution of the selected WSs is presented in
Figure 1 and the catchment characteristics are summarized in
Table 1.
For the selected stations, we evaluated the low-flow characteristics and their changes between the 2001–2015 and 1961–2000 periods.
In this work, we compared FDCs calculated using two methods:
Method 1: The standard method (covered by national Slovak Technical Standard STN 75 1410-1:2008 in Section 5.1.3) [
29], is based on mean daily discharge (Q
d) data series for the whole evaluated period, sorted in descending order. Numerical values of the FDC are given for the average durations, when the mean daily discharge is reached or exceeded. In Slovakia, the average durations are most commonly given as the number of days in the year; such a procedure can only be applied to a year and a multiannual period. In many other countries, the percentage of duration in a period is used more often. The numerical discharge values of the crossing line corresponding to the selected durations in days (M) are referred to as M-day discharges (Q
Md), e.g., the characteristic Q
355d (corresponds to 97.2%) is often used as a limit in water abstraction permits in water resource management in Slovakia.
Method 2: An alternative method (also mentioned in STN 75 1410-1:2008 in Section 5.1.9) of [
29], is based on the calculation of FDCs for individual years of the evaluated period. Subsequently, the FDC for the multiannual period is determined by calculating the averages of the discharge values obtained from the FDCs of individual years, corresponding to the same values of M. The values calculated using this method were denoted as Q
Md,rr in this contribution.
The change was evaluated for both methods for the selected percentiles from FDCs: Q270d (73.9%), Q330d (90.3%), Q355d (97.2%), and Q364d (99.7%). These values of QMd and QMd,rr computed for the 1961–2000 reference period were subsequently used as the thresholds for the evaluation of non-flow characteristics of drought episodes in assessed time periods.
The non-flow characteristics are another way to assess the low-flow hydrological regime. These characteristics include temporal and volume characteristics [
30]. They relate to the time of occurrence of dry periods (occurrence dates, number of days of low-flow periods, and duration of drought episodes in the evaluated period) and deficit volumes (volumes of water missing on dry episode days for a given flow limit) [
24].
We analyzed the number of days with mean daily discharges below the set limits and the duration of the longest drought episodes as well as their timing. The input parameters include the discharge threshold, minimum duration of a low-flow event (5 days), and maximum short-time interruption of a low-flow event (exceedance of the threshold; 3 days).
3. Results
3.1. Comparison of the Results of the Two Methods for Calculation of the FDCs (QMd,rr vs. QMd)
As a first step, the values of the FDCs were computed for both methods for the 1961–2000 period. The ratios between the M-day discharges in the low-flow area determined using Method 2 and their counterparts obtained using standard Method 1, commonly used in Slovakia (i.e., values Q
330d,rr/Q
330d to Q
364d,rr/Q
364d), are significantly higher than 1, as shown in
Figure 2. However, the differences vary in the individual sub-catchments as well as at the individual WSs.
After excluding a few outliers (e.g., a small stream in a Danube sub-catchment, where a little change in the value of Q
364d corresponds to a change of several hundred percent), the mean values of the ratio Q
Md,rr/Q
Md for the 1961–2000 period were processed for the sub-catchments of Slovakia depicted in
Figure 1. For Q
364d,rr/Q
364d, the highest values were detected in the Ipeľ (3.4), Malý Dunaj (2.9), and Morava (2.9) sub-catchments. The lowest values of Q
364d,rr/Q
364d occurred in the Danube (Danube River; 1.2), Poprad (1.5), and Hron (1.5) sub-catchments. The average value of the ratios for the whole Slovak territory was 2.0.
For Q355d,rr/Q355d, the mean values of the ratios in the assessed sub-catchments (after the exclusion of the most significant outliers) were highest in the Malý Dunaj (1.8), Morava (1.8), and Ipeľ (1.7) sub-catchments. The lowest values of the ratio Q355d,rr/Q355d were observed for the Danube River (1.1) and the Poprad River (1.2) sub-catchments. The average ratio for the whole Slovak territory was 1.4.
For Q330d,rr/Q330d, the mean values in the sub-catchments ranged from 1.1 (Danube sub-catchment) to 1.3 (Morava, Malý Dunaj and Bodva sub-catchments). For other quantiles (i.e., in the area of higher flows), the values from these two methods gradually approached each other; for Q270d, the values for the sub-catchments remained in the range between 1.0 and 1.1.
The higher values of the M-day discharges in the low-flow area determined using Method 2 compared to the M-day discharges determined using standard Method 1 may indicate the weakness of the standard method used for low-flow water quantiles, especially for Q
364d and Q
355d. This method (No. 1) leads to lower values in the low-flow area because, in the series of sorted data, the smallest values often come from only few dry periods, sometimes only from one extremely dry period with a long duration [
31]. Method 2 thus includes the inputs of the driest periods from each year, not just several extreme years of the evaluated period. However, it should be noted that the dry periods from individual years do not have to come from the same period of the year (same seasonality). This, however, applies to both methods used.
3.2. Selected Characteristics of the 2001–2015 Period Versus Those of the 1961–2000 Reference Period
The evaluation of data of selected water-gauging stations in the 2001–2015 period versus the 1961–2000 reference period by the standard method showed a higher number of stations with a decrease in Q
330d,2001–2015 compared to Q
330d,1961–2000 (
Figure 3).
An increase in the values prevail in Q
355d,2001–2015 and Q
364d,2001–2015 in comparison with the corresponding reference values (
Figure 4 and
Figure 5), with a more significant increase related to Q
364d. The increase for all quantiles is noticeable, especially in the area of the northern parts of central and Eastern Slovakia (upper parts of the Váh, Hornád, and Poprad sub-catchments). The decline is noticeable in the eastern part of Slovakia (Bodrog sub-catchment) and in the southern and western parts of Slovakia. For Q
364d, it is obvious that the number of stations with increasing values significantly exceeds the number of stations where the value of Q
364d decreased in the evaluated period compared to the reference period (
Figure 5).
The results differ for the alternative method in comparison with the standard method. The number of stations with an increase in the values of the evaluated quantiles Q
Md,rr in the 2001–2015 period compared to the 1961–2000 reference period prevails for all quantiles. For the Q
364d quantile, the increases in the evaluated period are more significant for the standard method than for Method 2 (
Figure 6).
The increase in the values for all quantiles for the representative stations in comparison with the reference period is manifested mainly in the east of Slovakia, in the Hornád, Slaná and, Poprad sub-catchments. The decrease in the values of Q330d,2001–2015,rr compared to Q330d,1961–2000,rr is most numerous in the Morava and Váh sub-catchments.
3.3. Non-Flow Characteristics
In this study, we assessed the non-flow characteristics based on the number of days with a mean daily discharge below the specified limits. We set the following QMd values as the limits: Q270d, Q330d, Q355d, and Q364d, calculated using both methods mentioned above. The limits were set for the 1961–2000 reference period. We analyzed the number of days of low-flow episodes in the 1961–2015 period, as well as the change in the occurrence between the 2001–2015 period and the 1961–2000 reference period.
The total number of days with mean daily discharge under individual limits varied in relatively wide ranges (
Table 2), while the differences also occurred at WSs within one sub-catchment.
The differences are higher in connection with low values of limit discharges (Q
364d and Q
355d). When comparing the number of days of low-flow events for the limits defined by Method 1 to the results of Method 2 (
Table 2,
Figure 7), higher numbers of such days can be seen for the M-day discharges evaluated by Method 2. This results from the fact that the values of these limits are higher. The ratios of the average number of days (per year) of low-flow events for the limits of Method 2 to the average number of days for the limits of Method 1 are as follows:
Days for limit Q364d,rr/days for limit Q364d: 17.9
Days for limit Q355d,rr/days for limit Q355d: 3.1
Days for limit Q330d,rr/days for limit Q330d: 1.6
Days for limit Q270d,rr/days for limit Q270d: 1.1
Significant differences due to the methods of calculation are also in the ratios of the number of days for Q
Md,rr to the number of days for Q
Md for individual sub-catchments. After the exclusion of extreme outliers identified using more detailed analyses, we can see that for the Q
364d limits, the largest values of these ratios are in the sub-catchments of the Malý Dunaj (62.2) and Morava (49.6) rivers; the smallest ratios occur in the Bodva (5.7), Poprad, Nitra, Danube (only WS Bratislava—Danube considered), and Bodrog sub-catchments (
Table 3).
Similarly, the analysis of the longest drought events at WSs (
Figure 8) with mean, minimum, and maximum values determined, with the comparison of the results for both types of limits, shows the highest differences for the limits Q
364d (Q
364d,rr/Q
364d = 3.9) and Q
355d (Q
355d,rr/Q
355d = 1.7).
The comparison of the average number of days of low-flow events identified for individual flow limits at particular sub-catchments brings us an overview of the sub-catchments more prone to drought occurrence (colored in red and orange on the maps in
Figure 9 and
Figure 10). Based on the analysis, we can state that the Nitra and Bodva sub-catchments are the most sensitive sub-catchments (with the largest number of days of dry periods) for the lowest limits of Q
364d and Q
355d (
Figure 9). The numbers on the map represent the mean number of low-flow days in the individual sub-catchments.
For the Q
364d,rr limit, the sub-catchments Morava, Bodva, and Malý Dunaj were detected as the most drought-prone. For the Q
355d,rr limit, the Morava, Malý Dunaj, Bodva, and Slaná sub-catchments are the most sensitive sub-catchments with the highest number of days with Q
d lower than the set discharge limit (
Figure 10). (Important note: The results in the Morava and Malý Dunaj sub-catchments do not represent the fully natural hydrological regime, so the results point to the effects of manipulation on water reservoirs and/or water use as well.)
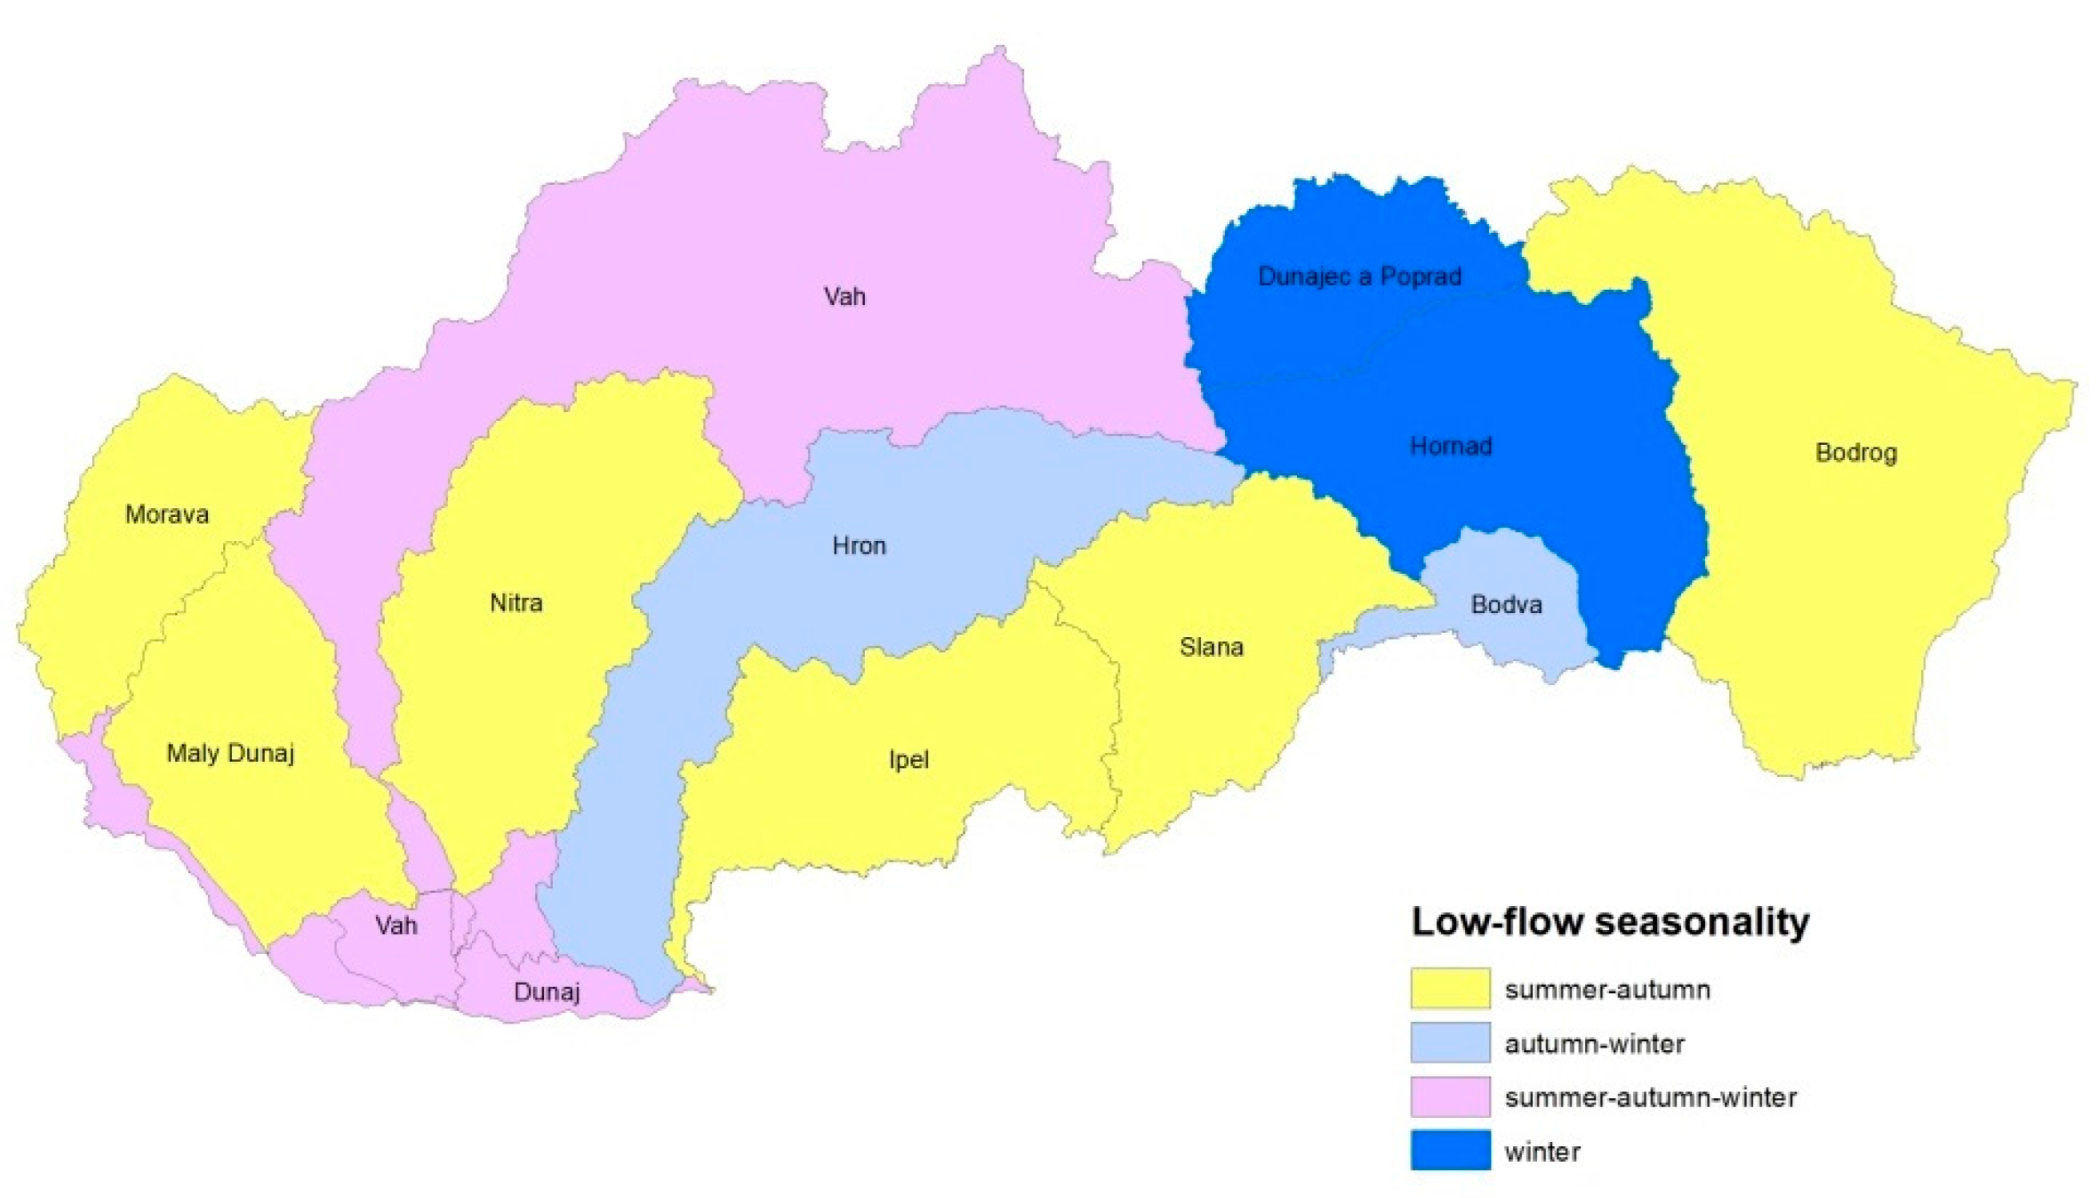
3.4. Analyses of the Seasonality of the Five Longest Low-Flow Episodes at Evaluated WSs
Long periods of drought are the most severe in water management because they have significant negative economic and environmental impacts. Therefore, the seasonality of the longest low-flow events was assessed based on the five longest low-flow episodes in each evaluated profile for individual limit values in the 1961–2015 period. The mean and extreme lengths of the five longest periods for particular limits are listed in
Table 4.
According to the timing of the five longest periods of drought at individual WSs, the overall situation of the sub-catchments was further analyzed. The occurrence of the longest low-flow events in the summer–autumn period (June to November) prevails in the evaluated profiles in Slovakia because it is visible, e.g., for the limit Q
355d (
Figure 11). However, the occurrence in the winter period (December to February) is also significant (especially in higher mountain areas) with an overlap into the spring months (March to May).
At higher values of selected limit discharges, when the low-flow episodes have a longer duration, the summer–autumn and winter low-water periods may become interconnected. The sub-catchments of Ipeľ, Slaná, and Malý Dunaj (with the streams originating in the Malé Karpaty Mountains) were identified as the most sensitive areas with the low flows (Q
364d) occurring in the summer period (
Figure 12). This can be considered a higher risk, e.g., for agriculture (deficit of water for irrigation in a growing season) or fisheries (negative effect of a combination of low flows and higher temperature on the river biota).
According to the evaluation of the five longest low-flow episodes at the selected WSs with respect to the years of their occurrence, the following years appeared to be the most affected hydrological years for individual limits in the 1961–2015 period (
Table 5):
These results are in line with the evaluation of dry years based on annual and monthly discharges in previous partial reports of the Hydrological Drought Assessment conducted at the SHMI [
32,
33]. In the evaluated period, the hydrological year 2012 was the most affected by drought (highest sum of low-flow events) with a longer duration. Of the other most frequently presented dry years, similar to the results of the assessments in previous partial reports, the 2003–2004, 1992–1993, and 1986–1987 periods were repeated.
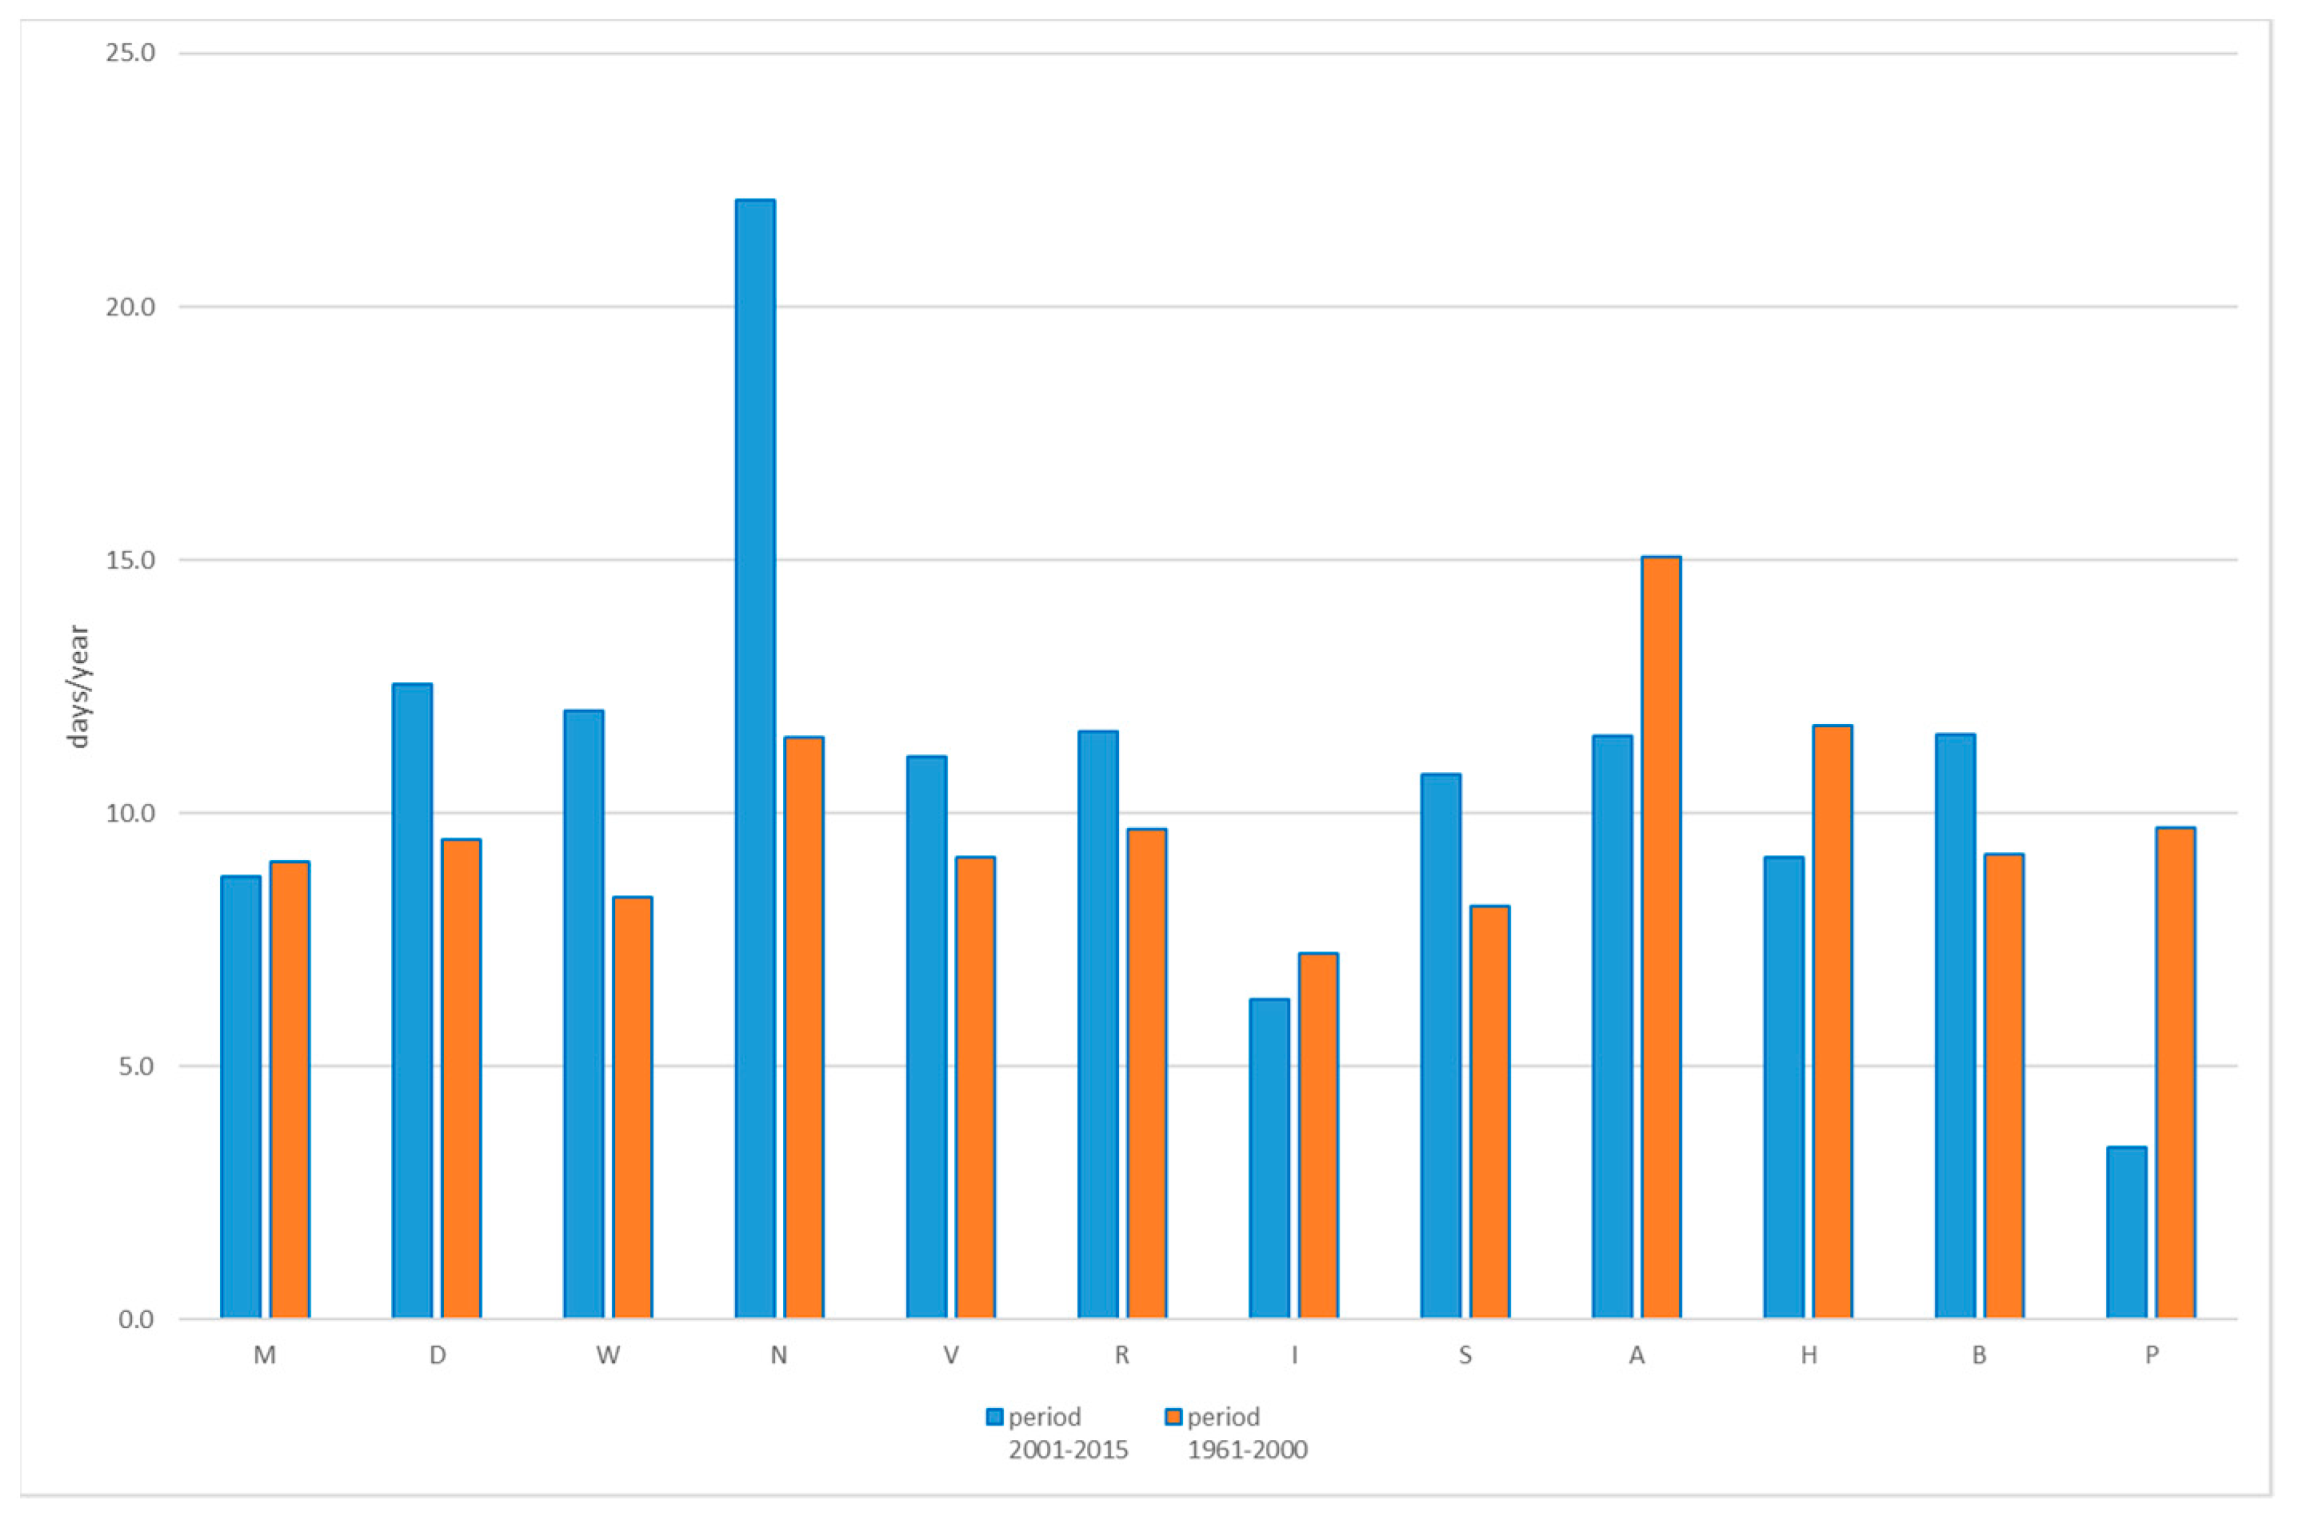
3.5. Comparison of the 2001–2015 Period Versus the 1961–2000 Reference Period
For the analysis of changes in non-flow characteristics between the 2001–2015 period and the 1961–2000 reference period, we analyzed the number of days for the WSs with long-term observations in which the mean daily discharge fell below the specified limit. This comparison has only been made for the quantiles Q
355d and Q
364d (the low-flow area), set for the 1961–2000 reference period. In general, there was an increase in the number of days below the limit discharge (on average per year) in the 2001–2015 period compared to the reference period (
Figure 13) but that was not the case for all WSs.
For the Q364d limit, no low-flow period with Qd < Q364d was detected at nearly half of the evaluated WSs in the 2001–2015 period. However, at a large portion of the rest of the WSs, an increase in the occurrence, compared to the 1961–2000 period, is visible.
For the Q355d limit, at four of the evaluated WSs in the 2001–2015 period, there was no observed low-flow event below the specified limit (of which three WSs are considered to be anthropologically affected). On average, for the rest of the assessed stations, the increase in the number of days with low-flow events prevails in the 2001–2015 period compared to the reference period. When it comes to the sum of WSs with a decrease or with no change between the evaluated 2001–2015 period and the 1961–2000 reference period in terms of the duration of low-flow episodes expressed as the days with values below the limit per year, it is almost the same as the number of WSs with the increase.
Predominance of the stations with a decrease in the number of low-flow days in the evaluated period occurred in the Poprad, Bodva, Hornád, Ipeľ, and upper Váh sub-catchments.
4. Discussion
The two methods used for the calculation of FDCs in this study differ in their approach to the calculation of the quantiles. Method 1 allows the small number of long dry periods to influence the lowest quantiles of the FDC (Q364d and Q355d). This can lead to very low values of these characteristics, especially for small streams with high variability of flows (steep course of FDC). Method 2 brings higher values in the area of low flows (Q330d,rr (90.3%), Q355d,rr (97.2%), and Q364d,rr (99.7%)), while in the area of higher discharges (in the area of Q270d (73,9%) and higher), the differences between Method 2 and Method 1 disappear. Method 2; however, to some extent, smooths out the extremity of the minimum flows. The extremely large percentage differences between the values of Q364d calculated by these two methods are observed for the smallest streams, where the low flows can be close to zero. For large rivers, such as the Danube or the Morava at the Slovak territory, where the FDCs have more balanced courses, the relative differences of these values are smaller. For other evaluated rivers, the differences also vary due to the hydrological regime of the region, resulting from the local hydrogeological, morphological, and climatic conditions. These findings indicate that the results of Method 1 in the area of the lowest quantiles need to be handled with care for small streams. Therefore, Method 2 appears to be more suitable for the calculation of hydrological characteristics, applicable as the basis for setting the minimum ecological flows.
Changes of M-day discharges in the low-flow area in the 2001–2015 period show regional differences. The regions of Slovakia highlighted by the red ellipses in
Figure 14 can be considered to be more sensitive. They are characterized by predominant negative changes in the Q
355d values at the assessed WSs. These regions cover the western, southwestern, and eastern parts of Slovakia. On the other hand, the middle blue ellipse in
Figure 14 representing the upper, mountainous parts of the Váh, Hornád, Hron, Poprad, and Slaná sub-catchments shows positive changes in these values. These findings are in line with the results of previous studies [
24,
31]. For the threshold Q
364d, the increase in the values prevails at the assessed WSs more significantly than for Q
355d. We should keep in mind that the results are partially affected by the values from WSs with the anthropogenically influenced hydrological regime, especially in the southern, more lowland regions of Slovakia. The positive changes in some cases (mostly in these southern, downstream areas), to some extent, point to the effects of manipulation on water reservoirs.
Concerning the seasonality of the longest periods of droughts, the evaluation of the main sub-catchments of Slovakia, based on the average status for all sub-catchments, can be partially misleading. Larger sub-catchments, such as Váh or Hron, have quite different physical-geographical conditions in the up- and downstream parts. While in the upper, mountain areas with higher altitudes, the winter season is typical for the drought occurrence, in the lowland, it is the summer–autumn season where the drought typically occurs. Therefore, in the continuation of our work, we want to divide these sub-catchments into smaller sections for assessment. The sensitivity of the sub-catchments (local areas) to the occurrence of long-lasting drought periods in the growing season can also be important knowledge for agriculture, fisheries, etc.
5. Conclusions
In the article, we compared two methods for estimating values of FDCs using mean daily discharges from selected water-gauging stations located in Slovakia. The weakness of the standard method (No. 1) is that it allows the values of the smallest quantiles (Q
364d and Q
355d) to be influenced by a small number of long-lasting drought episodes [
32]. This is also supported by the analysis of non-flow characteristics, which showed that in the 2001–2015 period that was evaluated using the standard method, the discharges at some stations did not at all fall under the Q
364d values determined using the standard method for the 1961–2000 reference period. The alternative method (No. 2) eliminates the aforementioned shortcoming of the standard method and, out of these two methods, it has a better precondition to be used as an input for determining the design values of ecological flows.
The seasonality of the longest low-flow episodes on Slovak rivers prevails in the summer–autumn period; however, in case of the mountain streams, the low-flow episodes with a longer duration also occur in the winter period, which is associated with the temporary freezing of watercourses and the entrapment of water in the form of snow and ice. For the summer period, the sub-catchments of the rivers Ipeľ, Slaná, and Malý Dunaj were identified as the most drought-prone areas in Slovakia (Q364d).
According to the mean values of the number of days with Qd < limit (limits set as Q270d, Q330d, Q355d, and Q364d) in the sub-catchments in Slovakia, we consider the Nitra, Bodva, Morava, and Slaná sub-catchments to be the most sensitive (with the highest number of dry days in the evaluated 1961–2015 period). According to the evaluation results, the choice of the threshold hydrological characteristic is of key importance for defining the low-flow periods. However, it has to be based on the purpose of intended use.
The subsequent analysis of the lengths of the low-flow periods in relation to the limits gives the necessary feedback for the assessment of the suitability of the limit, e.g., as a limiting flow value for the purposes of abstraction permits, while maintaining the flow in the stream for general water use and maintaining a good ecological status.
The next planned step is the assessment of selected limit values of discharges in low-flow areas by experts in the fields of biology and water resources management to see the possible impacts of the introduction of such limits into the river system.
Author Contributions
Conceptualization, L.B. and J.P.; methodology, L.B. and K.M.; data validation and curation, K.M., S.L., K.S. and B.S.; formal analysis, L.B., K.M. and K.J.; writing—original draft preparation, L.B.; writing—review and editing, L.B., K.M. and K.J.; visualization, L.B. and K.J.; supervision, J.P. All authors have read and agreed to the published version of the manuscript.
Funding
This research received no external funding.
Institutional Review Board Statement
Not applicable.
Informed Consent Statement
Not applicable.
Data Availability Statement
Restrictions apply to the availability of these data. Data were obtained from the SHMI and can be requested directly from the SHMI according to their data provision policies.
Conflicts of Interest
The authors declare no conflict of interest.
References
- WMO. 2021 One of the Seven Warmest Years on Record, WMO Consolidated Data Shows. Available online: https://public.wmo.int/en/media/press-release/2021-one-of-seven-warmest-years-record-wmo-consolidated-data-shows#:~:text=The%20warmest%20seven%20years%20have,to%20record%20global%20average%20warming (accessed on 20 February 2022).
- Meehl, G.A.; Stocker, T.F.; Collins, W.D.; Friedlingstein, P.; Gaye, A.T.; Gregory, J.M.; Kitoh, A.; Knutti, R.; Murphy, J.M.; Noda, A.; et al. Global Climate Projections. In Climate Change 2007: The Physical Science Basis. Contribution of Working Group I to the Fourth Assessment Report of the Intergovernmental Panel on Climate Change; Solomon, S., Qin, D., Manning, M., Chen, Z., Marquis, M., Averyt, K.B., Tignor, M., Miller, H.L., Eds.; Cambridge University Press: Cambridge, UK; New York, NY, USA, 2007; pp. 747–846. [Google Scholar]
- IPCC. Climate Change 2013: The Physical Science Basis. Contribution of Working Group I to the Fifth Assessment Report of the Intergovernmental Panel on Climate Change; Stocker, T.F., Qin, D., Plattner, G.-K., Tignor, M., Allen, S.K., Boschung, J., Nauels, A., Xia, Y., Bex, V., Midgley, P.M., Eds.; Cambridge University Press: Cambridge, UK; New York, NY, USA, 2013; 1535p. [Google Scholar]
- IPCC. Climate Change 2021: The Physical Science Basis. Contribution of Working Group I to the Sixth Assessment Report of the Intergovernmental Panel on Climate Change; Masson-Delmotte, V., Zhai, P., Pirani, A., Connors, S.L., Péan, C., Berger, S., Caud, N., Chen, Y., Goldfarb, L., Gomis, M.I., et al., Eds.; Cambridge University Press: Cambridge, UK; New York, NY, USA, 2021; in press. [Google Scholar]
- Chang, J.; Zhang, H.; Wang, Y.; Zhang, L. Impact of climate change on runoff and uncertainity analysis. Nat. Hazards 2017, 88, 1113–1131. [Google Scholar] [CrossRef]
- Hari, V.; Rakovec, O.; Markonis, Y.; Hanel, M.; Kumar, R. Increased future occurrences of the exceptional 2018–2019 Central European drought under global warming. Sci. Rep. 2020, 10, 12207. [Google Scholar] [CrossRef] [PubMed]
- Douglas, E.M.; Vogel, R.M.; Kroll, C.N. Trends in floods and low flows in the United States: Impact of spatial correlation. J. Hydrol. 2000, 240, 90–105. [Google Scholar] [CrossRef]
- Khaliq, M.N.; Ouarda, T.B.M.J.; Gachon, P.; Sushama, L. Temporal evolution of low-flow regimes in Canadian rivers. Water Resour. Res. 2008, 44, W08436. [Google Scholar] [CrossRef] [Green Version]
- Yu, K.X.; Gottschalk, L.; Zhang, X.; Li, P.; Li, Z.; Xiong, L.; Sun, Q. Analysis of nonstationarity in low flow in the Loess Plateau of China. Hydrol. Process. 2018, 32, 1844–1857. [Google Scholar] [CrossRef]
- Dudley, R.W.; Hirsch, R.M.; Archfield, S.A.; Blum, A.G.; Renard, B. Low streamflow trends at human-impacted and reference basins in the United States. J. Hydrol. 2020, 580, 124254. [Google Scholar] [CrossRef]
- Zaidman, M.D.; Keller, V.; Young, A.R.; Cadman, D. Flow-duration-frequency behaviour of British rivers based on annual minima data. J. Hydrol. 2003, 277, 195–213. [Google Scholar] [CrossRef]
- Coufal, P. Evaluation of flow frequency on streams in the South Moravian Region for the last 40 years. Acta Hydrol. Slovaca 2021, 22, 187–199. [Google Scholar] [CrossRef]
- Orta, S.; Aksoy, H. Development of Low Flow Duration-Frequency Curves by Hybrid Frequency Analysis. Water Resour. Manag. 2022, 36, 1521–1534. [Google Scholar] [CrossRef]
- Gorbachova, L.; Khrystiuk, B. Extreme low flow change analysis on the Tysa River within Ukraine. Acta Hydrol. Slovaca 2021, 22, 200–206. [Google Scholar] [CrossRef]
- European Commission, Directorate-General for Environment. Ecological Flows in the Implementation of the Water Framework Directive, Guidance Document No. 31; Publication Office: Luxembourg, 2016; 106p, ISBN 978-92-79-45758-6. [Google Scholar] [CrossRef]
- OECD. OECD Environmental Outlook to 2050: The Consequences of Inaction; OECD Publishing: Paris, France, 2012; 350p. [Google Scholar] [CrossRef]
- Acreman, M.C.; Overton, I.C.; King, J.; Wood, J.P.; Cowx, I.G.; Dunbar, M.J.; Kendy, E.; Young, W.J. The changing role of ecohydrologial science in guiding environmental flows. Hydrol. Sci. J. 2014, 59, 433–450. [Google Scholar] [CrossRef]
- Arthington, A.H.; Kennen, J.G.; Stein, E.D.; Webb, J.A. Recent advances in environmental flows science and water management—Innovation in the Anthropocene. Freshw. Biol. 2018, 63, 1022–1034. [Google Scholar] [CrossRef] [Green Version]
- Chen, W.; Olden, J.D. Designing flows to resolve human and environmental water needs in a dam-regulated river. Nat. Commun. 2017, 8, 2158. [Google Scholar] [CrossRef] [PubMed]
- Ahn, J.M.; Kwon, H.G.; Yang, D.S.; Kim, Y.-S. Assessing environmental flows of coordinated operation of dams and weirs in the Geum River basin under climate change scenarios. Sci. Total Environ. 2018, 643, 912–925. [Google Scholar] [CrossRef] [PubMed]
- Ramulifho, P.; Ndou, E.; Thifhulufhelwi, R.; Dalu, T. Challenges to implementing an environmental flow regime in the Luvuvhu river Catchment, South Africa. Int. J. Environ. Res. Public Health 2019, 16, 3694. [Google Scholar] [CrossRef] [Green Version]
- Monico, V.; Solera, A.; Bergillos, R.J.; Paredes-Arquiola, J.; Andreu, J. Effects of environmental flows on hydrological alteration and reliability of water demands. Sci. Total Environ. 2022, 810, 151630. [Google Scholar] [CrossRef]
- Demeterová, B.; Škoda, P. Malá vodnosť vybraných vodných tokov Slovenska (Low flow in selected Streams of Slovakia). J. Hydrol. Hydromech. 2009, 57, 55–69. [Google Scholar] [CrossRef] [Green Version]
- Fendeková, M.; Poórová, J.; Slivová, V. (Eds.) Hydrologické Sucho na Slovensku a Prognóza jeho Vývoja (Hydrological Drought in Slovakia and Its Prognosis); Comenius University: Bratislava, Slovakia, 2017; 300p, ISBN 978-80-223-4510-1. (In Slovak) [Google Scholar]
- Fendeková, M.; Gauster, T.; Labudová, L.; Vrablíková, D.; Danáčová, Z.; Fendek, M.; Pekárová, P. Analysing 21st century meteorological and hydrological drought events in Slovakia. J. Hydrol. Hydromech. 2018, 66, 393–403. [Google Scholar] [CrossRef] [Green Version]
- Halmová, D.; Pekárová, P.; Pekár, J.; Miklánek, P.; Bačová Mitková, V. Identification of the historical drought occurrence on the Danube River and its tributaries. Acta Hydrol. Slovaca 2021, 22, 237–247. [Google Scholar] [CrossRef]
- Kubiak-Wójcicka, K.; Zeleňáková, M.; Blištan, P.; Simonová, D.; Pilarska, A. Influence of climate change on low flow conditions. Case study: Laborec River, eastern Slovakia. Ecohydrol. Hydrobiol. 2021, 21, 570–583. [Google Scholar] [CrossRef]
- Blaškovičová, L.; Melová, K. (Eds.) Hodnotenie Hydrologického Sucha, Časť 3: Hodnotenie M-Denných Prietokov a Neprietokových Charakteristík (Hydrological Drought Evaluation, Part 3: Evaluation of M-Daily Discharges and Non-Flow Characteristics); SHMÚ: Bratislava, Slovakia, 2020; 92p, ISBN 978-80-99929-26-6. (In Slovak) [Google Scholar]
- Makeľ, M.; Šipikalová, H.; Škoda, P.; Turbek, J. STN 75 1410-1:2008; Hydrológia. Hydrologické údaje Povrchových vôd. Kvantifikácia Priemernej Vodnosti. Časť 1: Charakteristiky Denných Vodných Stavov a Prietokov (Hydrology. Hydrological Data of Surface Water. Mean Water Bearing Quantification Part 1: Charakteristics of Daily Water Stages and Discharges). Slovenský ústav Technickej Normalizácie: Bratislava, Slovakia, 2008. (In Slovak)
- Fendeková, M.; Ženišová, Z.; Demeterová, B.; Fendek, M.; Fľaková, R.; Gavurník, J.; Krčmář, D.; Macura, V.; Némethy, P.; Slivová, V. Hydrogeologické Sucho (Hydrogeological Drought); Fendeková, M., Ženišová, Z., Eds.; Vyd. SAH: Bratislava, Slovakia, 2010; 190p, ISBN 978-80-969342-7-0. (In Slovak) [Google Scholar]
- Blaškovičová, L.; Melová, K.; Poórová, J. Vplyv voľby limitných charakteristík na hodnotenie nedostatku vody v obdobiach malých vodností (Impact of limit characteristics selection on assessment of water scarcity in low flow periods). Acta Hydrol. Slovaca 2017, 18, 145–153. (In Slovak) [Google Scholar]
- Poórová, J. (Ed.) Hodnotenie Hydrologického Sucha, Časť 1: Hodnotenie Vodnosti Roka a Zmien Rozdelenia Odtoku v Roku (Hydrological Drought Evaluation, Part 1: Evaluation of Yearly Water Bearing and Changes of Yearly Runoff Distributions); SHMÚ: Bratislava, Slovakia, 2019; 110p, ISBN 978-80-99929-09-9. (In Slovak) [Google Scholar]
- Blaškovičová, L. (Ed.) Hodnotenie Hydrologického Sucha, Časť 2: Hodnotenie Zmien a Trendov Mesačných a Ročných Prietokov (Hydrological Drought Evaluation, Part 3: Evaluation of Changes and Trends in Monthly and Yearly Discharges); SHMÚ: Bratislava, Slovakia, 2019; 64p, ISBN 978-80-99929-14-3. (In Slovak) [Google Scholar]
Figure 1.
Location of the selected water-gauging stations.
Figure 1.
Location of the selected water-gauging stations.
Figure 2.
Comparison of QMd values calculated using both methods in the 1961–2000 period (M—Morava, D—Danube, V—Váh, W—Malý Dunaj, N—Nitra, R—Hron, I—Ipeľ, S—Slaná, A—Bodva, H—Hornád, B—Bodrog, P—Poprad).
Figure 2.
Comparison of QMd values calculated using both methods in the 1961–2000 period (M—Morava, D—Danube, V—Váh, W—Malý Dunaj, N—Nitra, R—Hron, I—Ipeľ, S—Slaná, A—Bodva, H—Hornád, B—Bodrog, P—Poprad).
Figure 3.
Changes in values of Q330d from 2001–2015 vs. 1961–2000 (% of increase/decrease).
Figure 3.
Changes in values of Q330d from 2001–2015 vs. 1961–2000 (% of increase/decrease).
Figure 4.
Changes in values of Q355d from 2001–2015 vs. 1961–2000 (% of increase/decrease).
Figure 4.
Changes in values of Q355d from 2001–2015 vs. 1961–2000 (% of increase/decrease).
Figure 5.
Changes in values of Q364d from 2001–2015 vs. 1961–2000 (% of increase/decrease).
Figure 5.
Changes in values of Q364d from 2001–2015 vs. 1961–2000 (% of increase/decrease).
Figure 6.
Changes in values of Q364d,rr from 2001–2015 vs. 1961–2000 (% of increase/decrease).
Figure 6.
Changes in values of Q364d,rr from 2001–2015 vs. 1961–2000 (% of increase/decrease).
Figure 7.
Average number of days with Qd < limit from 1961–2015 (comparison for limits QMd and QMd,rr).
Figure 7.
Average number of days with Qd < limit from 1961–2015 (comparison for limits QMd and QMd,rr).
Figure 8.
The longest drought event duration (mean and extremes of individual WSs), 1961–2015.
Figure 8.
The longest drought event duration (mean and extremes of individual WSs), 1961–2015.
Figure 9.
Sub-catchments in Slovakia colored according to the mean number of days with Qd< Q355d, 1961–2015. The dots represent the individual WSs and are colored using the same key as the sub-catchments.
Figure 9.
Sub-catchments in Slovakia colored according to the mean number of days with Qd< Q355d, 1961–2015. The dots represent the individual WSs and are colored using the same key as the sub-catchments.
Figure 10.
Sub-catchments in Slovakia colored according to the number of days with Qd< Q355d,rr, 1961–2015. The dots represent the individual WSs and are colored using the same key as the sub-catchments.
Figure 10.
Sub-catchments in Slovakia colored according to the number of days with Qd< Q355d,rr, 1961–2015. The dots represent the individual WSs and are colored using the same key as the sub-catchments.
Figure 11.
Sub-catchments in Slovakia according to the prevailing seasonality of the five longest low-flow episodes; 1961–2015, limit Q355d.
Figure 11.
Sub-catchments in Slovakia according to the prevailing seasonality of the five longest low-flow episodes; 1961–2015, limit Q355d.
Figure 12.
Sub-catchments in Slovakia according to the prevailing seasonality of the five longest low-flow episodes; 1961–2015, limit Q364d.
Figure 12.
Sub-catchments in Slovakia according to the prevailing seasonality of the five longest low-flow episodes; 1961–2015, limit Q364d.
Figure 13.
Mean number of low-flow event days from 2001–2015 compared to 1961–2000.
Figure 13.
Mean number of low-flow event days from 2001–2015 compared to 1961–2000.
Figure 14.
Areas of prevailing increases (blue) and decreases (red) of Q355d from 2001–2015 compared to 1961–2000.
Figure 14.
Areas of prevailing increases (blue) and decreases (red) of Q355d from 2001–2015 compared to 1961–2000.
Table 1.
Catchment characteristics of the selected water-gauging stations.
Table 1.
Catchment characteristics of the selected water-gauging stations.
| Sub-Catchment | Average Area (km2) | Average WS Altitude (m a.s.l.) | No. of WSs | No. of
Influenced WSs |
|---|
| Morava | 12,088.2 | 145.3 | 2 | 1 |
| Dunaj | 65,669.2 | 224.8 | 2 | 0 |
| Malý Dunaj | 40.6 | 217.2 | 4 | 1 |
| Váh | 252.5 | 528.2 | 19 | 2 |
| Nitra | 563.9 | 242.4 | 7 | 5 |
| Hron | 694.7 | 512.1 | 7 | 1 |
| Ipeľ | 351.8 | 157.9 | 4 | 3 |
| Slaná | 535.1 | 288.2 | 4 | 1 |
| Hornád | 1551.3 | 367.5 | 4 | 1 |
| Bodva | 90.2 | 310.2 | 1 | 1 |
| Bodrog | 2583.3 | 152.1 | 7 | 4 |
| Poprad | 648.7 | 707.6 | 2 | 1 |
Table 2.
The number of days with Qd < limit (1961–2015); statistics from all WSs.
Table 2.
The number of days with Qd < limit (1961–2015); statistics from all WSs.
| Limit | Q270d | Q330d | Q355d | Q364d | Q270d,rr | Q330d,rr | Q355d,rr | Q364d,rr |
|---|
| mean number of low-flow days | 5163 | 1896 | 556 | 66 | 5886 | 2941 | 1745.5 | 1183 |
| minimum number of low-flow days | 3367 | 832 | 107 | 6 | 5011 | 1999 | 1015 | 566 |
| maximum number of low-flow days | 6992 | 2663 | 1196 | 266 | 8843 | 6066 | 5043 | 3821 |
| mean number of low-flow days/year | 93.9 | 34.5 | 10.1 | 1.2 | 107 | 53.5 | 31.7 | 21.5 |
| mean number of days of longest low-flow event | 200 | 126 | 73 | 26 | 212 | 159 | 124 | 101 |
| minimum number of days of longest low-flow event | 92 | 67 | 42 | 6 | 92 | 76 | 53 | 48 |
| maximum number of days of longest low-flow event | 304 | 248 | 178 | 72 | 372 | 273 | 270 | 236 |
Table 3.
Comparison of the ratios of limit values QMd,rr/QMd (1961–2000) and the ratios of related number of days of low-flow events; mean values for sub-catchments (1961–2015).
Table 3.
Comparison of the ratios of limit values QMd,rr/QMd (1961–2000) and the ratios of related number of days of low-flow events; mean values for sub-catchments (1961–2015).
| Sub-Catchment | Q270 | Q330 | Q355 | Q364 |
|---|
| Q270d,rr/Q270d | Low-Flow Days Ratio | Q330d,rr/Q330d | Low-Flow Days Ratio | Q355d,rr/Q355d | Low-Flow Days Ratio | Q364d,rr/Q364d | Low-Flow Days Ratio |
|---|
| M | 1.1 | 1.2 | 1.3 | 2.1 | 1.8 | 6.1 | 2.9 | 49.6 |
| D | 1.0 | 1.1 | 1.1 | 1.3 | 1.1 | 2.6 | 1.2 | 16.2 |
| V | 1.1 | 1.1 | 1.1 | 1.4 | 1.3 | 2.8 | 2.0 | 18.1 |
| W | 1.1 | 1.1 | 1.3 | 1.8 | 1.8 | 4.6 | 2.9 | 62.2 |
| N | 1.0 | 1.0 | 1.1 | 1.4 | 1.3 | 2.5 | 1.9 | 16.0 |
| R | 1.1 | 1.2 | 1.1 | 1.6 | 1.3 | 3.4 | 1.5 | 26.9 |
| I | 1.1 | 1.2 | 1.2 | 1.5 | 1.7 | 3.3 | 3.4 | 21.8 |
| S | 1.1 | 1.2 | 1.2 | 1.8 | 1.4 | 4.3 | 2.0 | 32.7 |
| A | 1.1 | 1.1 | 1.3 | 1.6 | 1.5 | 2.9 | 1.7 | 5.7 |
| H | 1.1 | 1.2 | 1.2 | 1.9 | 1.3 | 4.4 | 1.7 | 20.7 |
| B | 1.1 | 1.2 | 1.2 | 1.4 | 1.4 | 2.9 | 2.0 | 16.4 |
| P | 1.0 | 1.1 | 1.1 | 1.3 | 1.2 | 2.6 | 1.5 | 15.3 |
Table 4.
The number of days with Qd < limit for the five longest low-flow episodes at each WS.
Table 4.
The number of days with Qd < limit for the five longest low-flow episodes at each WS.
| Limit | Q270d | Q270d,rr | Q350d | Q330d,rr | Q355d | Q355d,rr | Q364d | Q364d,rr |
|---|
| mean | 159 | 172 | 94 | 119 | 50 | 92 | 15 | 75 |
| max | 304 | 372 | 248 | 273 | 178 | 270 | 72 | 236 |
| min | 81 | 82 | 28 | 48 | 6 | 31 | 2 | 26 |
Table 5.
The driest hydrological years according to the sum of the occurrence of the five longest dry events at each WS.
Table 5.
The driest hydrological years according to the sum of the occurrence of the five longest dry events at each WS.
| Limit | Hydr. Years with the Highest Number of the Longest Dry Episodes Occurrence at WSs |
|---|
| Q270d | 1973–1974, 1983–1984, 1986–1987, 1992–1993, 2003–2004, 2011–2012 |
| Q330d | 1961–1963(1994), 1986–1987, 1992–1993, 2003–2004, (2011)–2012 |
| Q355d | 1961–1962, 1973, 1992–1993, 2003, 2012 |
| Q364d | 1973, 1987, 1992–1993, 2003, 2012 |
| Q270d,rr | 1973–1974, 1983–1984, 1986–1987, 2003–2004, 2011–2012 |
| Q330d,rr | 1962–1963, 1983–1984, 1986–1987, 2003–2004, 2011–2012 |
| Q355d,rr | 1961–1963, 1973, 1983–1984, 1986–1987, 1992–1993, 2003–2004, 2012 |
| Q364d,rr | 1961–1963, 1987, 1992–1993, 2003, 2012 |
| Publisher’s Note: MDPI stays neutral with regard to jurisdictional claims in published maps and institutional affiliations. |
© 2022 by the authors. Licensee MDPI, Basel, Switzerland. This article is an open access article distributed under the terms and conditions of the Creative Commons Attribution (CC BY) license (https://creativecommons.org/licenses/by/4.0/).


 ,
, 


