Article

Assessing the Long-Term Production of Suspended Sediment and the Climate Changes Impact on Its Deposition in Artificial Lakes—A Case Study of Lake Trakošćan, Croatia

1
Faculty of Geotechnical Engineering, University of Zagreb, Hallerova al. 7, 42000 Varaždin, Croatia
2
Faculty of Mining, Geology and Petroleum Engineering, University of Zagreb, Pierottieva 6, 10000 Zagreb, Croatia
3
Hrvatske Vode, Međimurska ul. 26B, 42000 Varaždin, Croatia
*
Authors to whom correspondence should be addressed.
Climate 2023, 11(8), 167; https://doi.org/10.3390/cli11080167
Submission received: 30 June 2023 / Revised: 24 July 2023 / Accepted: 31 July 2023 / Published: 2 August 2023

Abstract

:
A prevalent engineering task in practice is calculating the annual balance of sediments on some watercourses. This is particularly challenging when assessing the backfilling of river reservoirs that have a multifunctional purpose. Trakošćan Lake was built in the period from 1850 to 1862 as a pond and landscape addition to the park and Trakošćan castle. After 60 years, the lake was drained in 2022, and the work began on sediment excavation to improve the lake’s ecological condition due to about 200,000 cubic meters of deposited silt in the lake. In this research, the annual sediment production is calculated for the long-term period 1961–2020, based on empirical parametric methods (Fleming, Brunne). The results are compared with results from previous projects and recent sediment deposit investigations. Since there are no changes in LC/LU on this natural catchment, the decreasing trends in long-term sediment transport were compared with meteorological values, daily rainfall, and snow days. It is concluded that the intensity characteristics of the rainfall should be investigated more in detail and could provide much more tangible information regarding climate change impacts. Some targets for future monitoring design and research techniques are set.

1. Introduction

In recent years, due to the influence of climate change [1,2,3], more and more watershed systems have encountered unusually high precipitation amounts and increased intensities. Such events not only represent danger in terms of sudden flood events, they also form a significant amount of debris flow as a result of increased erosion and organic material transport [4,5]. As reported by several investigations, the increased sediment and debris flow amounts from torrents present a significant threat to natural lakes with poor or neglected sediment management systems [6,7,8]. Over the past several decades, a considerable amount of research has been done on the relationships between precipitation, discharge, and sediment transport. However, much of this work has been focused on individual discharge events or in predominately agricultural areas in small hillslope plots or areas with drastically different physiographic and climatic regimes. The identification of sediment source areas, transport patterns, and erosion processes can aid in managing watersheds and mitigating sediment-driven watershed degradation. This information can help policymakers and land/water managers target erosion-prone areas or erosion-prone time periods with control efforts such as Best Management Practices [9].
Similarly, the artificial lake Trakošćan, Croatia, built by Count Juraj V. Drašković on the Čemernica torrent in the 19th century, in recent years made rumours due to significant sediment and debris filling and, therefore, poor water quality due to increased plant growth. When first formed, the lake had a functioning sediment removal system, where during fall, the lake was drained, while the winter period was used to clean the mud and sludge and refill the lake with water. The aim was to remove the deposited silt from the lake and use low winter temperatures to freeze it for easier cleaning. However, the system was neglected over the years, and the lake was filled with considerable amounts of sediment and debris.
Realising the importance of preserving the Trakošćan castle and the lake’s environment, there was a desire to decorate the castle and the environment. Thus, in 1961, the Republic Water Fund began to partially finance the construction of the Trakošćan Lake dam, the construction of a pool for non-swimmers, and regulation downstream of the dam [10]. Measurements of the amount of water and silt in the lake made in 1969 have shown considerable filling with organic material and silt from torrential streams. The irregularity of torrential streams, sanitary and economic, felling of fir and spruce in the watershed, and hauling of logs on the ground disturbed the sandstone soil and a large amount of sediment was introduced to the lake. By measuring in 1969, there was 146,000 m3 of mud, representing 37% of the lake filling [10].
According to the prepared Čemernica project (1981) for arranging the Čemernica torrent with its tributaries, the Čemernica torrent was arranged and rehabilitated for a total length of 5.74 km. Then the design of the arrangement of the southern torrents of the Trakošćan Lake was carried out—a total of nine torrents with a length of 3.25 km [10]. In 1991–1994, the reconstruction of the castle building, lodgings, and catering facilities under the castle was carried out, as well as the expansion of the Trakošćan hotel, which was renovated and put into operation. However, the lake remained neglected. Only a single pond, Jurin Creek, was put into operation and rented to a fishing company for fish farming. However, access to this pond was difficult due to the existing macadam road, often eroded by torrents on the steep northern slopes of Lake Trakošćan. Other watercourses from the northern slopes of Lake Trakošćan are completely neglected, with very difficult access.
In 2007, the Trakošćan castle management commissioned a study of determining the state of water in Lake Trakošćan with an assessment of measures for rehabilitation and revitalisation [10,11]. In 2019, the Croatian Waters (Hrvatske vode) commissioned a survey of sediment thickness and composition and water quality in Lake Trakošćan [12], estimating the thickness of the sediment from 1.4 to 2.7 m, and a total volume of 238,095 m3. The report states that the sediment and sludge contain highly plastic organic clays with a strong odour, with a high percentage of plant remains and some sand [12]. Due to that, the lake’s volume has been reduced by 60% of the original volume. Therefore, the lake was drained in November 2021 to clean the lake from the sediment, and during the process, the fish were moved to other locations. In 2022, works on sediment excavation began to improve the lake’s ecological condition and the projected depth of the lake after cleaning would be about 6 m.
The touristic value, historical significance, and beauty of this castle and the park are unquestionable. The problem of Lake Trakošćan sedimentation became very topical and resonated negatively with the public. It has gained great importance in the Republic of Croatia because the lake was drained after 60 years. That was the occasion for this research, going in four directions, as outlined in the Introduction.
With the present study, the goals are as follows:
  • Exploring landscape processes with a particular focus on changes in vegetation and catchment land use during the observed period;
  • An analysis of meteorological and hydrological data and calculating the trends in the period of 1961–2020 to define the influences of climate changes on sediment production;
  • Calculation of the annual sediment production in the catchment by parametric methods and comparing the results with previous studies as well as the measured sediment transport values in Bednja River;
  • Calculating the sediment deposition time in Trakošćan Lake for future management activities.

2. Materials and Methods

2.1. Study Area

The Trakošćan Lake is in the Bednja municipality, Varaždin County, about 30 km west of Varaždin city and 50 km north of the capital city Zagreb, near the Slovenian border (Figure 1). The lake was formed between 1853 and 1862 as part of the park forest and the planned Nature Park Trakošćan. It is a shallow, artificial pond and landscape addition to the castle; fish were bred in it. The lake was created by damming a small torrential stream, Čemernica, that flows through. Besides Čemernica, the lake is fed by several torrent streams (Figure 2), which mostly dry out during summer. The topographic catchment area of the lake is 10.7 km2. The lake itself has a length of 1.5 km and covers an area of 0.17 km2 with an average depth of 2.5 m. The total lake volume was estimated to be around 392,000 cubic meters (according to a project done in 1961). The outflow waters of the lake are considered one of several origins of the Bednja River (Figure 1) [13]. The Lake is located at an elevation of 240 m a.s.l., surrounded by small hills lower than 400 m, on the north Mali and Veliki Skrnik (344 and 377 m. a.s.l, respectively) and the south Bukov Peak (360 m a.s.l.). Although there are minor elevation differences, the terrain varies, with very steep and sharp ridges and trenches forming specific forest vegetation.
Geologically, the Trakošćan Lake area is composed of sedimentary rocks, primarily clay, sandstone, and limestone. The region is characterised by a complex system of faults and fractures, which play an essential role in the area’s hydrogeology. Hydrogeologically, the Trakošćan Lake area is dominated by a karstic aquifer system formed by the dissolution of limestone and other carbonate rocks, mostly of secondary porosity dating back to the Mesozoic Era [13]. The aquifer thickness is estimated to be several hundred meters [14], with permeabilities of the rocks between 3 and 25% [15]. This aquifer system is characterised by a high degree of permeability, allowing water to deeper layers. The area is also known for its numerous springs and wells fed by the karstic aquifer. The hydrology of Trakošćan Lake is closely linked to the hydrogeology of the surrounding area.

2.2. Meteorological and Hydrological Data

The region is characterised by a temperate continental climate, with cold winters with occasional snow and mild summers with frequent rainfall. The average annual temperature in the area is around 11 °C, and the average annual precipitation is about 900–1000 mm.
Meteorological and hydrological data from 1961 to 2021 was obtained by the Croatian Meteorological and Hydrological Service [16] (from now on, DHMZ). The analysed data consisted of daily measurements of precipitation [mm], snow depth [cm], discharge [m3/s], suspended sediment concentration (SSC) [g/m3], and suspended sediment transport (SST) [t/day]. To calculate the SSC [g/m3], daily water samples are taken, and filtered over Munktell 100/N, 320 mm 85 g/m2 filter paper, which is later dried out and weighed. The weight difference between the filter paper before and after the water filtering is used to calculate the sediment concentration. Then, the concentration is multiplied with discharge and unit conversion factor 0.0864 in order to acquire the SST [t/day] [16,17].
Near the Trakošćan Lake, three meteorological gauges are available (Donji Macelj, Bednja, Klenovnik and Križovljan); however, only the station Donji Macelj presented a continuous long enough time-series of precipitation and snow depth recordings necessary for such an analysis. Although being a climatological station, the Bednja station was established recently, in the year 2006, and therefore, the data series was not considered long enough for this investigation. Furthermore, the station Klenovnik had considerable interruptions in the measurements, while the Križovljan station was neglected due to the distance and geographically flat terrain (Figure 1). In Table 1, the list of available meteorological and hydrological stations is presented, while in Table 2, the results of a simple statistical analysis of the available data from the stations is given.
As for hydrological data, the two most upstream gauges on the Bednja River were considered, namely Lepoglava and Željeznica (Figure 1). Due to the requirements for suspended sediment transport data, the Željeznica station was considered, since at the Lepoglava station, only water level and discharge are measured.
In order to be able to statistically analyse the time series and, therefore, take into account the series from the relevant meteorological and hydrological stations, it is necessary to analyse the homogeneity of the time series. For this purpose, numerous absolute and relative homogeneity tests can be used to detect the artificial and natural inhomogeneity of the statistical properties of time series of hydrological and climate variables [18].
In hydrological practice, the Wilcoxon nonparametric (rank) test is used for this purpose [19]. This statistical test essentially checks whether the mean values of the two data series differ, and the central assumption of the hydrological data is that the time series follows a normal distribution, with a confidence level of α = 0.05 (5%). The condition is that the observed standard unit deviation should be
U 0 = S 0 E S σ S 1 , 96
That is, if the p-value is p > 0.05, and where E(S) is the expected value of the sum of the ranks of the modified series:
E S = n 2 n 1 + n 2 + 1 2
n1 is the number of members of the original series, and n2 is the number of members of the modified series. The standard deviation of the sum of the ranks of the modified series σS is
σ S = n 1 n 2 n 1 + n 2 + 1 12
The sum of the ranks of the modified series S0 is
S 0 = j = 1 n 2 k j
where kj is the rank of the member of the modified series when the members of the modified and original series are ordered by size.
The test’s null hypothesis that the series is homogeneous is accepted when Equation (1) is satisfied, that is, when the p-value of the test is greater than 0.05.
On the time series of precipitation data and snow depth data (number of snow days) (1961–2021), the modified series was selected (1987–2021), since the suspended sediment transport measurements for the station Željeznica (Bednja) started in 1987. Since at some stations the beginning of the measurement does not have complete data (for example precipitation data at the Donji Macelj station), the year 1962 was taken as the starting year of the complete series.
Table 3 shows the p-values of the homogeneity test for precipitation data.
Table 4 shows the p-values of the homogeneity test for number of snow days during a year.
In order to assess the trends and their significance in time series data, the nonparametric Mann-Kendall test [20,21] has been used. First the Mann-Kendall statistic S for the variable of interest x is calculated following the Equation (5) [20]:
S = i = 1 n 1 j = i + 1 n s g n x j x i
where sgn is the signum function. The variance of the S statistic is calculated from the Equation (6) [21]:
V S = n n 1 2 n + 5 k = 1 m t k t k 1 2 t k + 5 18
where m is the number of groups and tk is the number of data points in group k. In cases where the variable consists of more than ten values, the test statistic Z(S) is calculated from:
Z S = S 1 V S ,       i f   S > 0 0 ,                           i f   S = 0 S + 1 V S ,       i f   S < 0
Positive Z(S) values indicate increasing trends, while negative Z(S) indicates decreasing trends. Trends are considered significant if |Z(S)| are greater than the standard deviation Z1−α/2 for the selected value of α = 0.95.

2.3. CORINE LAND Cover Data

The CORINE (Coordination of information on the environment) Land Cover (CLC) (https://land.copernicus.eu/pan-european/corine-land-cover; accessed: 20 April 2023) inventory was initiated in 1985 to standardise data collection on land use in Europe and to support environmental policy development. The European Environment Agency (EEA) coordinates the project in the frame of the EU Copernicus program and is implemented by national teams. The number of participating countries has increased over time currently, including 33 (EEA) member countries and six cooperating countries (EEA39) with a total area of over 5.8 M km2 [22]. CORINE Land Cover (CLC) is a pan-European land use and land cover mapping project that aims to provide a standardised and harmonised land cover classification system for the entire continent. It was initiated by the European Commission in the 1980s and has since been updated several times, with the latest version being the CLC2018 dataset.
The CLC product is based on a hierarchical classification system that distinguishes between 44 land cover classes, further aggregating into three main categories: artificial surfaces, agricultural areas, and natural and semi-natural areas. The classification is based on satellite imagery and other spatial data sources, and the mapping is carried out at a spatial resolution of 100 × 100 m. The CLC product has many applications in environmental and land use planning, policy development, and research. It provides information on the distribution and characteristics of different land cover types, which can be used to assess the impacts of land use changes on biodiversity, ecosystem services, and climate change. It also supports implementing EU policies such as the Water Framework Directive, the Habitats Directive, and the Common Agricultural Policy [22].

2.4. Methods

2.4.1. G. Fleming’s Method for Average Annual Sediment Production

The average annual sediment production of the watershed depends on the climate [23], topography [24], soil type, land cover and land use [25,26,27], and the presence of natural and artificial retention areas. The mean annual amount of sediment production Qs as a function of mean annual flow Q is determined by the empirical formula derived by Fleming [28]:
Q s = a Q n
where the parameters a and n depend on the different vegetation types in the watershed, which are given in Table 5:
Fleming derived this equation based on data he had obtained by measuring suspended sediment in 250 watersheds worldwide.

2.4.2. G.M. Brune’s Empirical Method for Sediment Deposition Time in Reservoirs

Sediment deposition is the main problem of reservoirs because it reduces their useful volume and thus significantly impairs the purpose of the lake, whether it is power generation, water supply, hydration, flood control, or tourism. Sediment input to reservoirs varies widely, and the rate at which the available storage area of the lake decreases as it is filled with sediment depends on three main factors:
  • The amount of sediment introduced into the reservoir;
  • The amount of sediment retained in the lake;
  • The density of the deposited sediment.
In the case of sediments deposited in reservoirs, it should be remembered that the material is submerged. Table 4 gives the density ranges of certain types of sediments deposited in the reservoir [29] (Chow, 1988). Brune’s empirical method is being used to calculate the time required to fill the lake with sediment based on the free lake volume denoted as Va′. The procedure is not performed for the total volume of sediment deposited, but for the elements (segments) of the volume, and the total deposition time for these segments is then added at the end. Calculation of the filling of the reservoir can be carried out using the same procedure, but for the entire lake as a whole. However, practice shows that parameters X and Y are more precise when the calculation procedure is carried out for lake segments. The choice of segment volume is a personal choice. Theoretically, the volume of the segment can be infinitesimally small, so in that case the result would be the most precise; however, this increase in the precision of the result would not justify the time spent for the calculation itself. The choice of volume is, therefore, determined by the rule of thumb.
The average annual inflow of water into the reservoir is
Q = A   c   P
where A is the drainage area in km2, c is the dimensionless runoff coefficient, and P is the mean annual precipitation in mm.
The average annual amount of sediment that enters the reservoir is
V n = G ρ s
where G is the sediment production calculated by following the Fleming equation (Equation (8)), and ρ s is the mean sediment density in kg/m3.
For the first segment of the reservoir volume Va′, the average reservoir volume is V1 = 3.75 × 10⁵ m3, so the relationship between the volume in the reservoir V1 and the average water inflow Q is
X 1 = V 1 Q = 0.0938
Taking the mean curve from Table 6 as the governing Brune curve, the coefficients a and n of this curve are used to calculate the percentage contribution of deposited sediment Y to the accumulation according to Equation (12).
Based on a comparison of sediments in reservoirs with sediment inflows determined by measurements, Brune (1953) [30] defined the relationship between the percentage of incoming sediments retained in the reservoir and the mean annual water inflow into the lake. The percentage of sediment filling reservoir Y is defined by the expression (Equation (12)):
Y = 100 1 1 1 + a X n %
where X is the relationship between the volume of the reservoir and the annual inflow of water into the lake, and a and n are the regression parameters between X and Y for the mean curve and the upper and lower envelopes of that curve, given in Table 7.

3. Results

3.1. Homogeneity and Trend Analysis

The trend assessment according to the Mann-Kendall test has been performed for all mentioned stations in Table 3 and Table 4 on the entire period of available data, except the calculated number of snow days at the station Donji Macelj, where a homogeneity break was observed in the year 1987 (Table 4). Therefore, the Mann-Kendall test for the number of snow days at Donji Macelj was performed separately for periods 1962–1987 and 1988–2021. The results of the Mann-Kendall test are presented in Table 8 and Table 9. The trend assessment for precipitation was done on total yearly precipitation amounts measured at each of the considered meteorological gauges.
The only meteorological forcing and station where a statistically significant trend could be observed is the Križovljan station, where a decreasing trend in the number of snow days is present. Although both of the other two stations show a decrease in the number of snow days during a year, none of the observed trends can be considered statistically significant according to the Mann-Kendall test.
When precipitation is considered, none of the tested series of data resulted in a statistically significant trend.
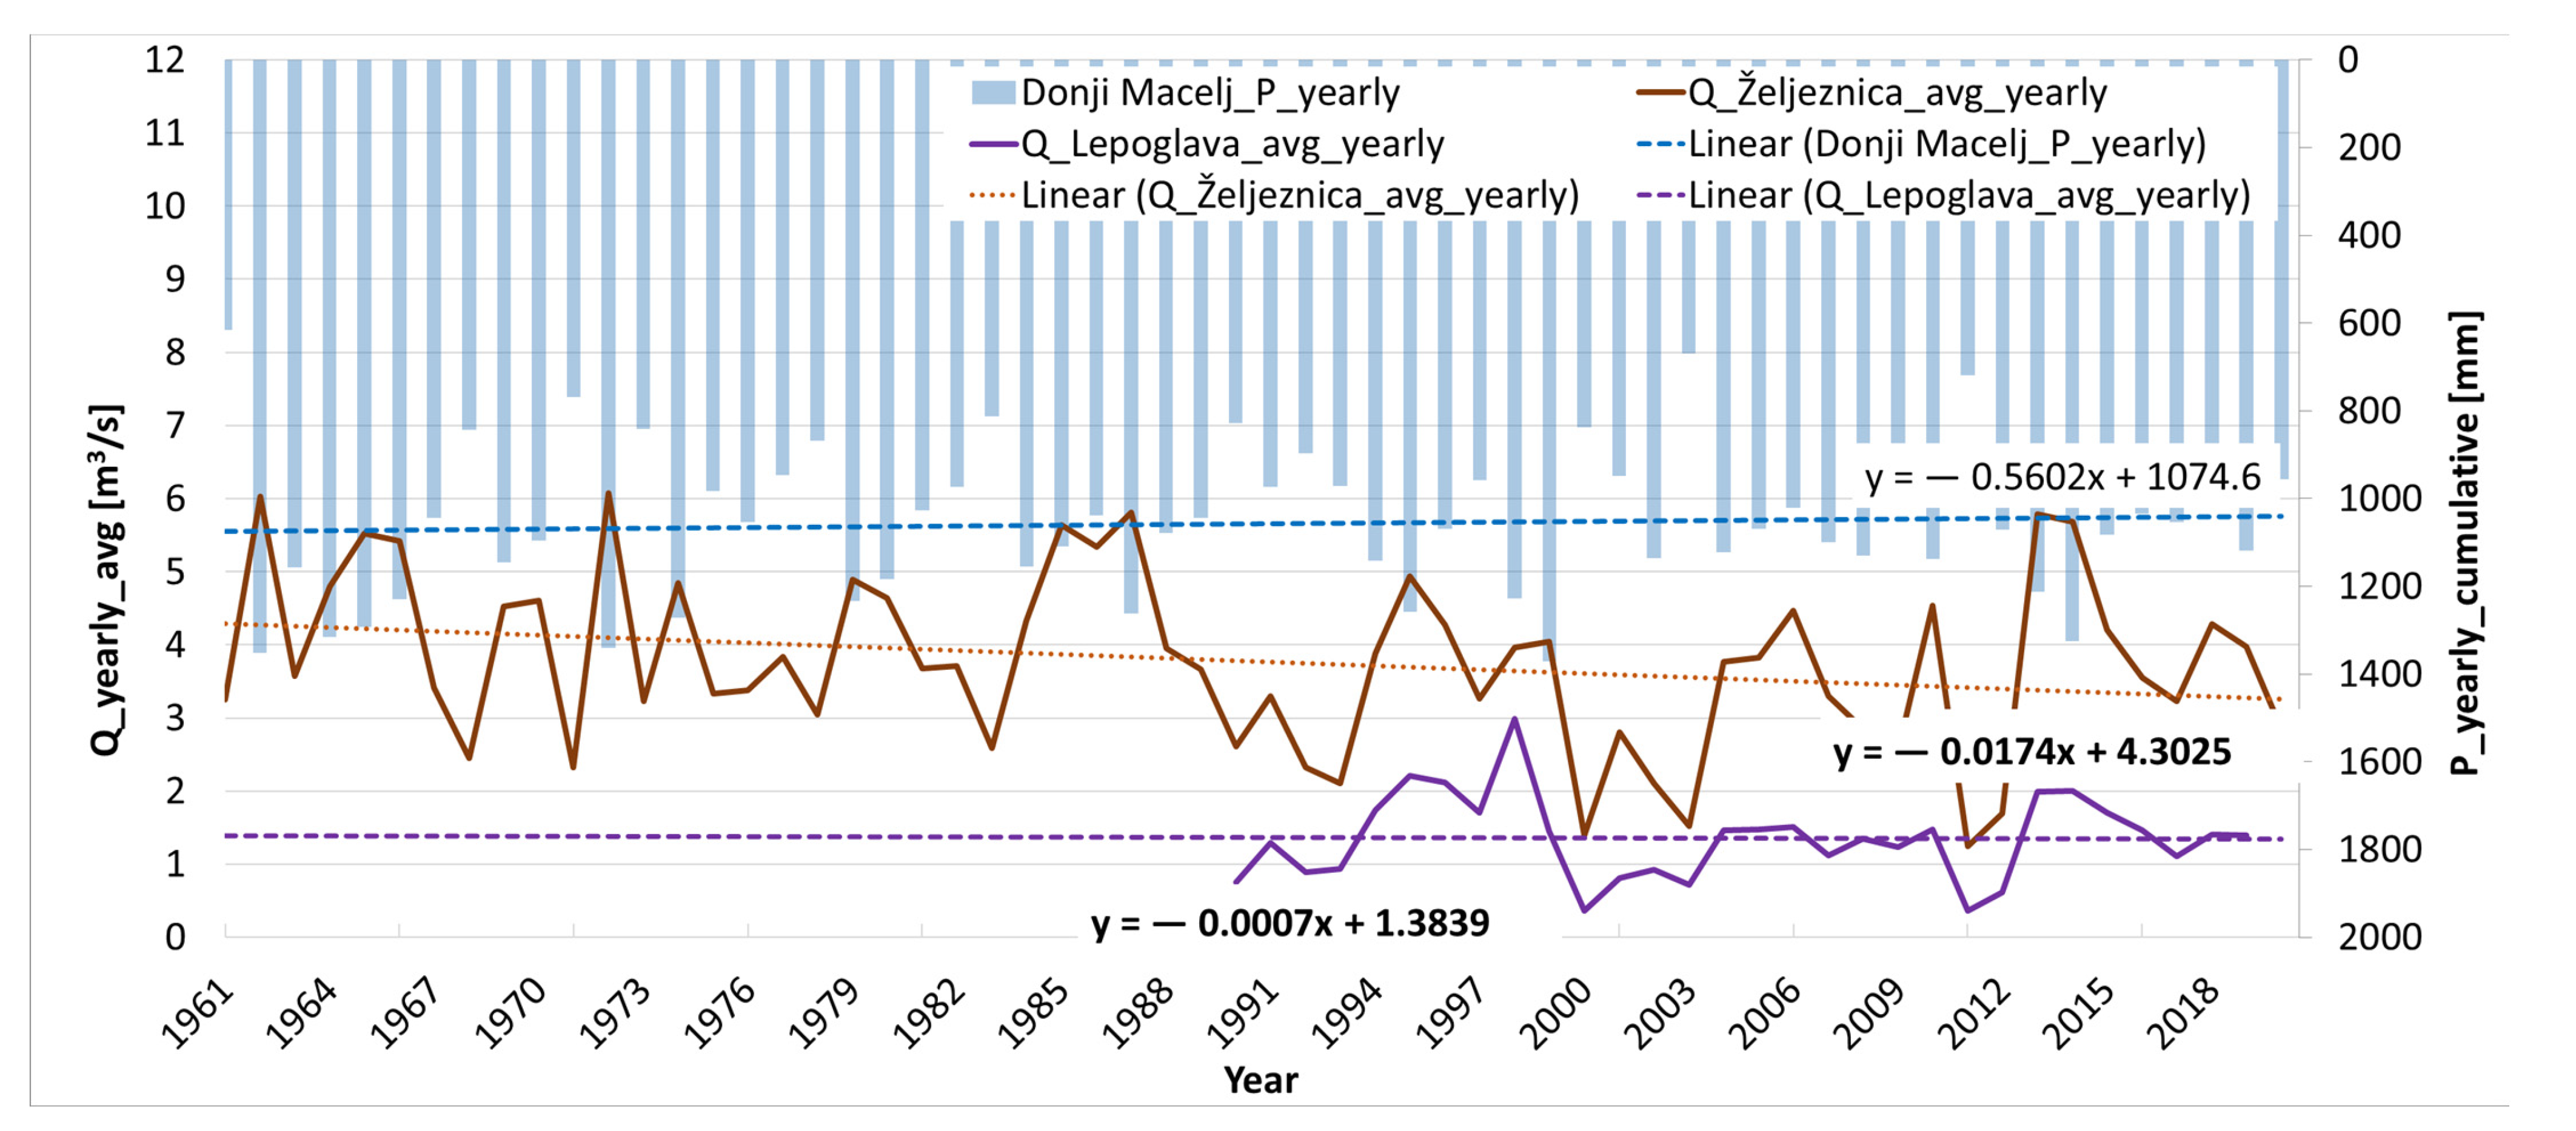
In Figure 3, a comparison of the mean annual precipitation measured at the most relevant meteor station Donji Macelj and the discharge at Bednja River: 1. Gauging station Lepoglava (11.5 km downstream of Trakošćan Lake) and Željeznica (20 km downstream of Trakošćan) are presented. Although the visual plot of precipitation and discharge at the Lepoglava station indicates a slight negative trend, none of the trends were found to be statistically significant (Table 6). Similarly, the discharge at the Željeznica gauging station indicates a decreasing trend. However, the Mann-Kendall test again showed no significance in this trend at the 95% confidence level.
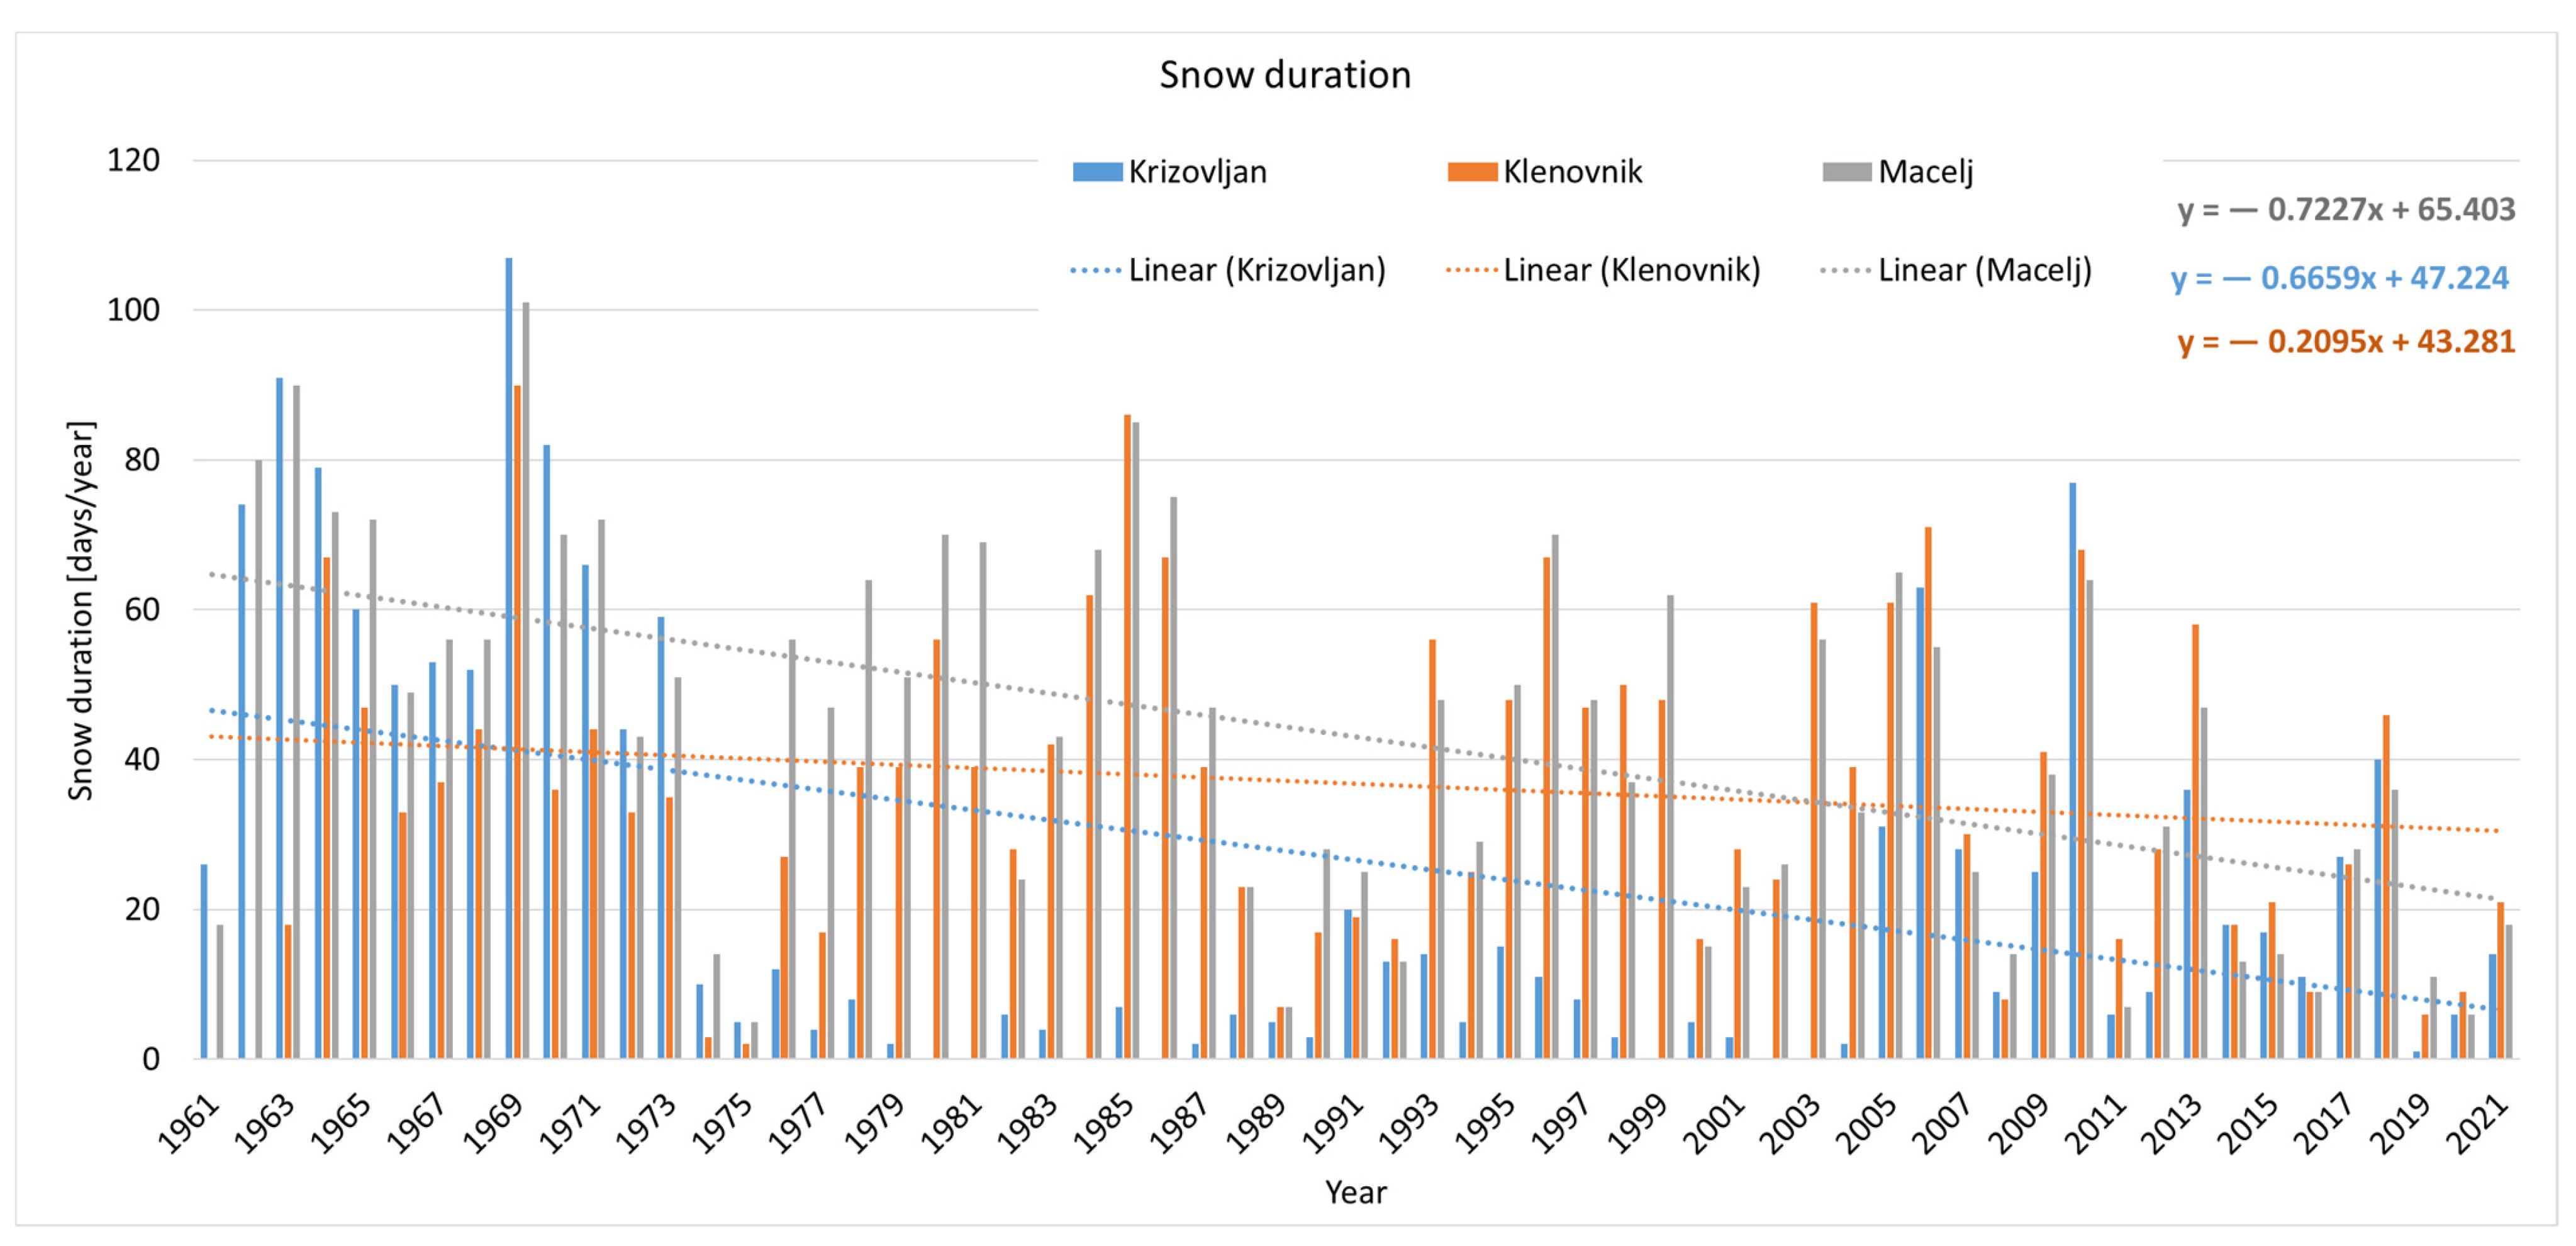
Additionally, understanding the role of snow cover on erosion and turbidity will allow for better planning in the face of a changing snowpack due to climate change. The amount of snow days was plotted (Figure 4) for three meteorologic stations, namely Donji Macelj, Križovljan, and Klenovnik, where all three plots indicate, again, decreasing trends; however, only the trend at station Križovljan was found to be statistically significant (Table 5).

3.2. Corine Land Cover Analysis

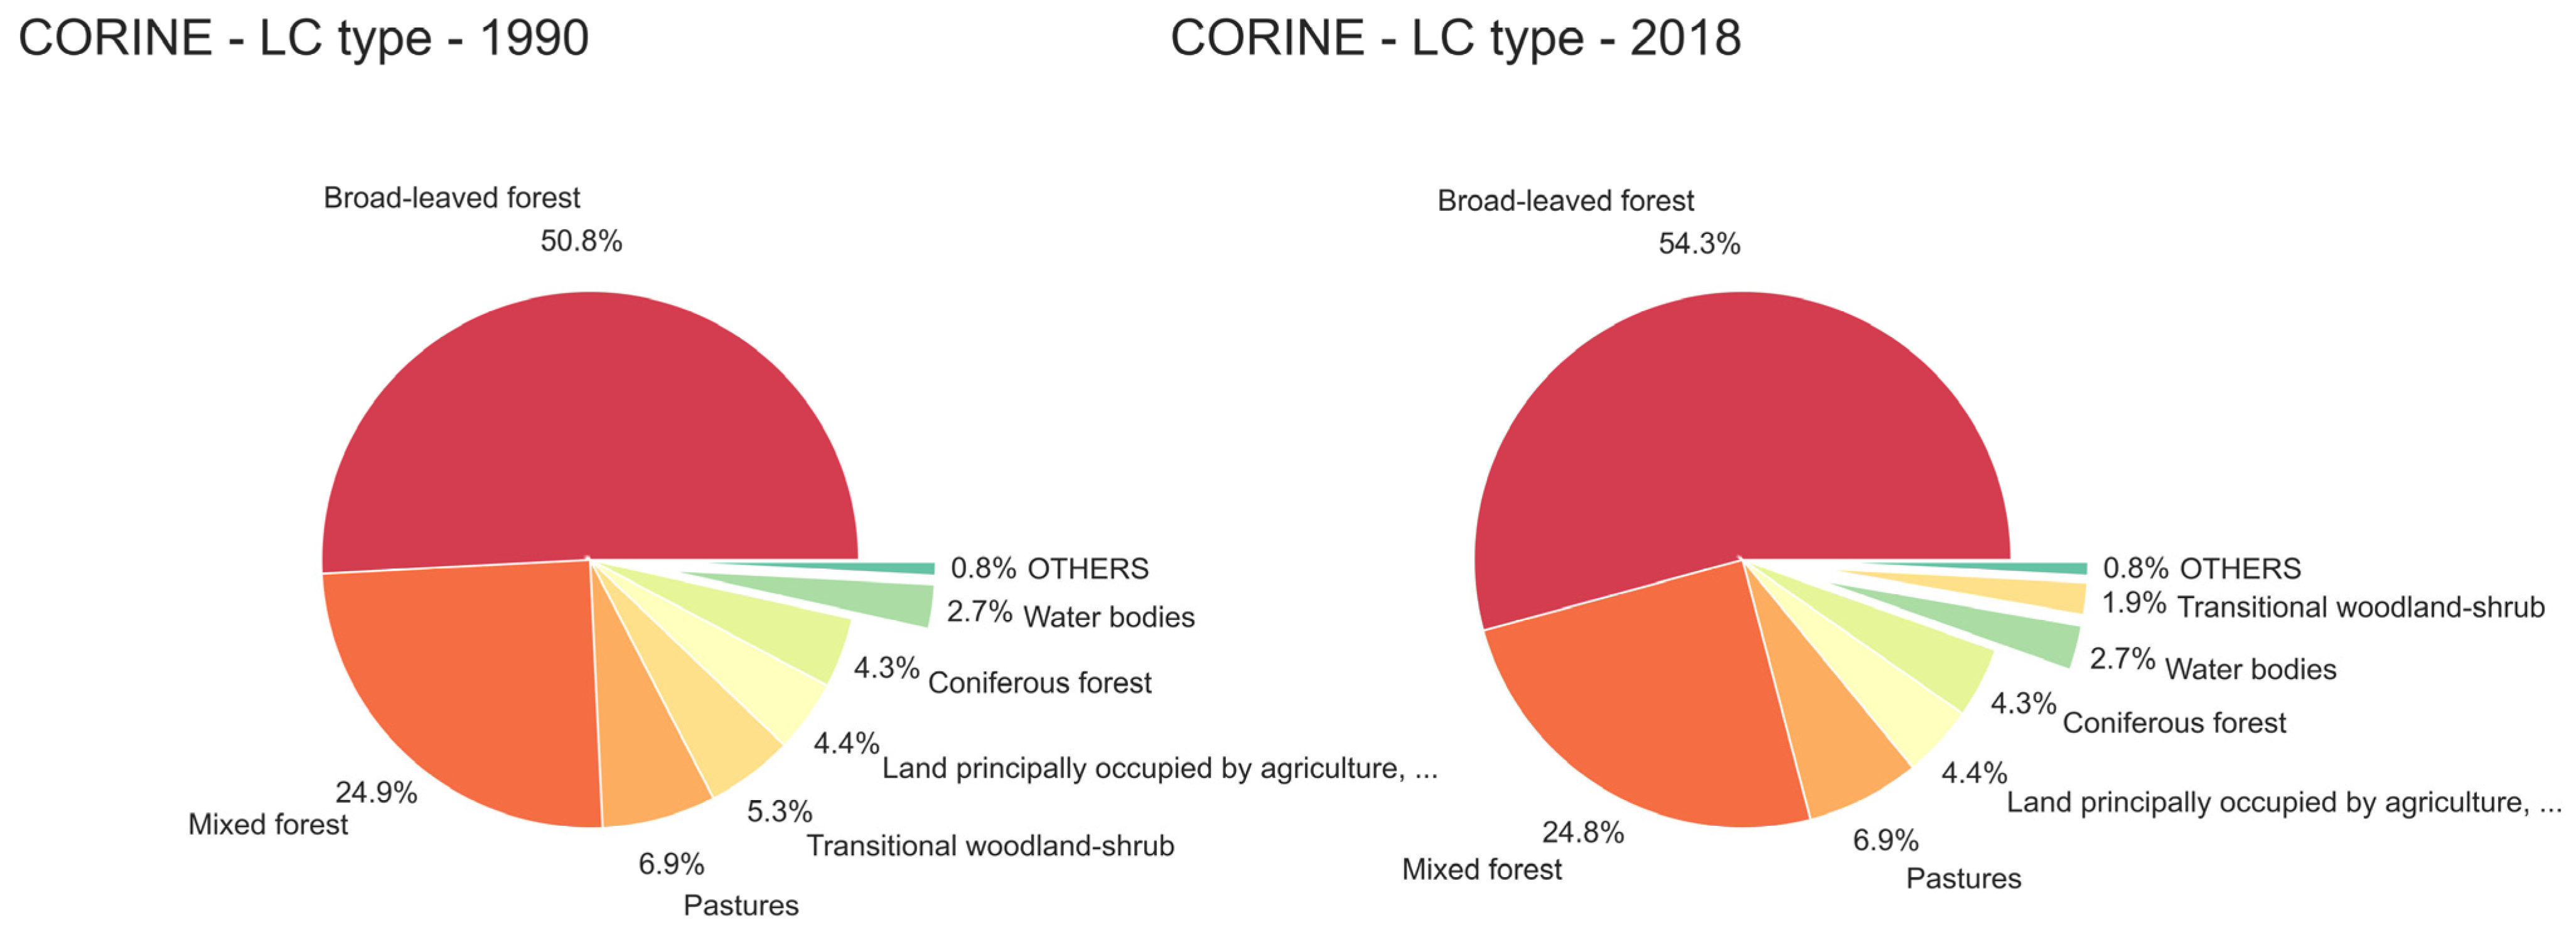
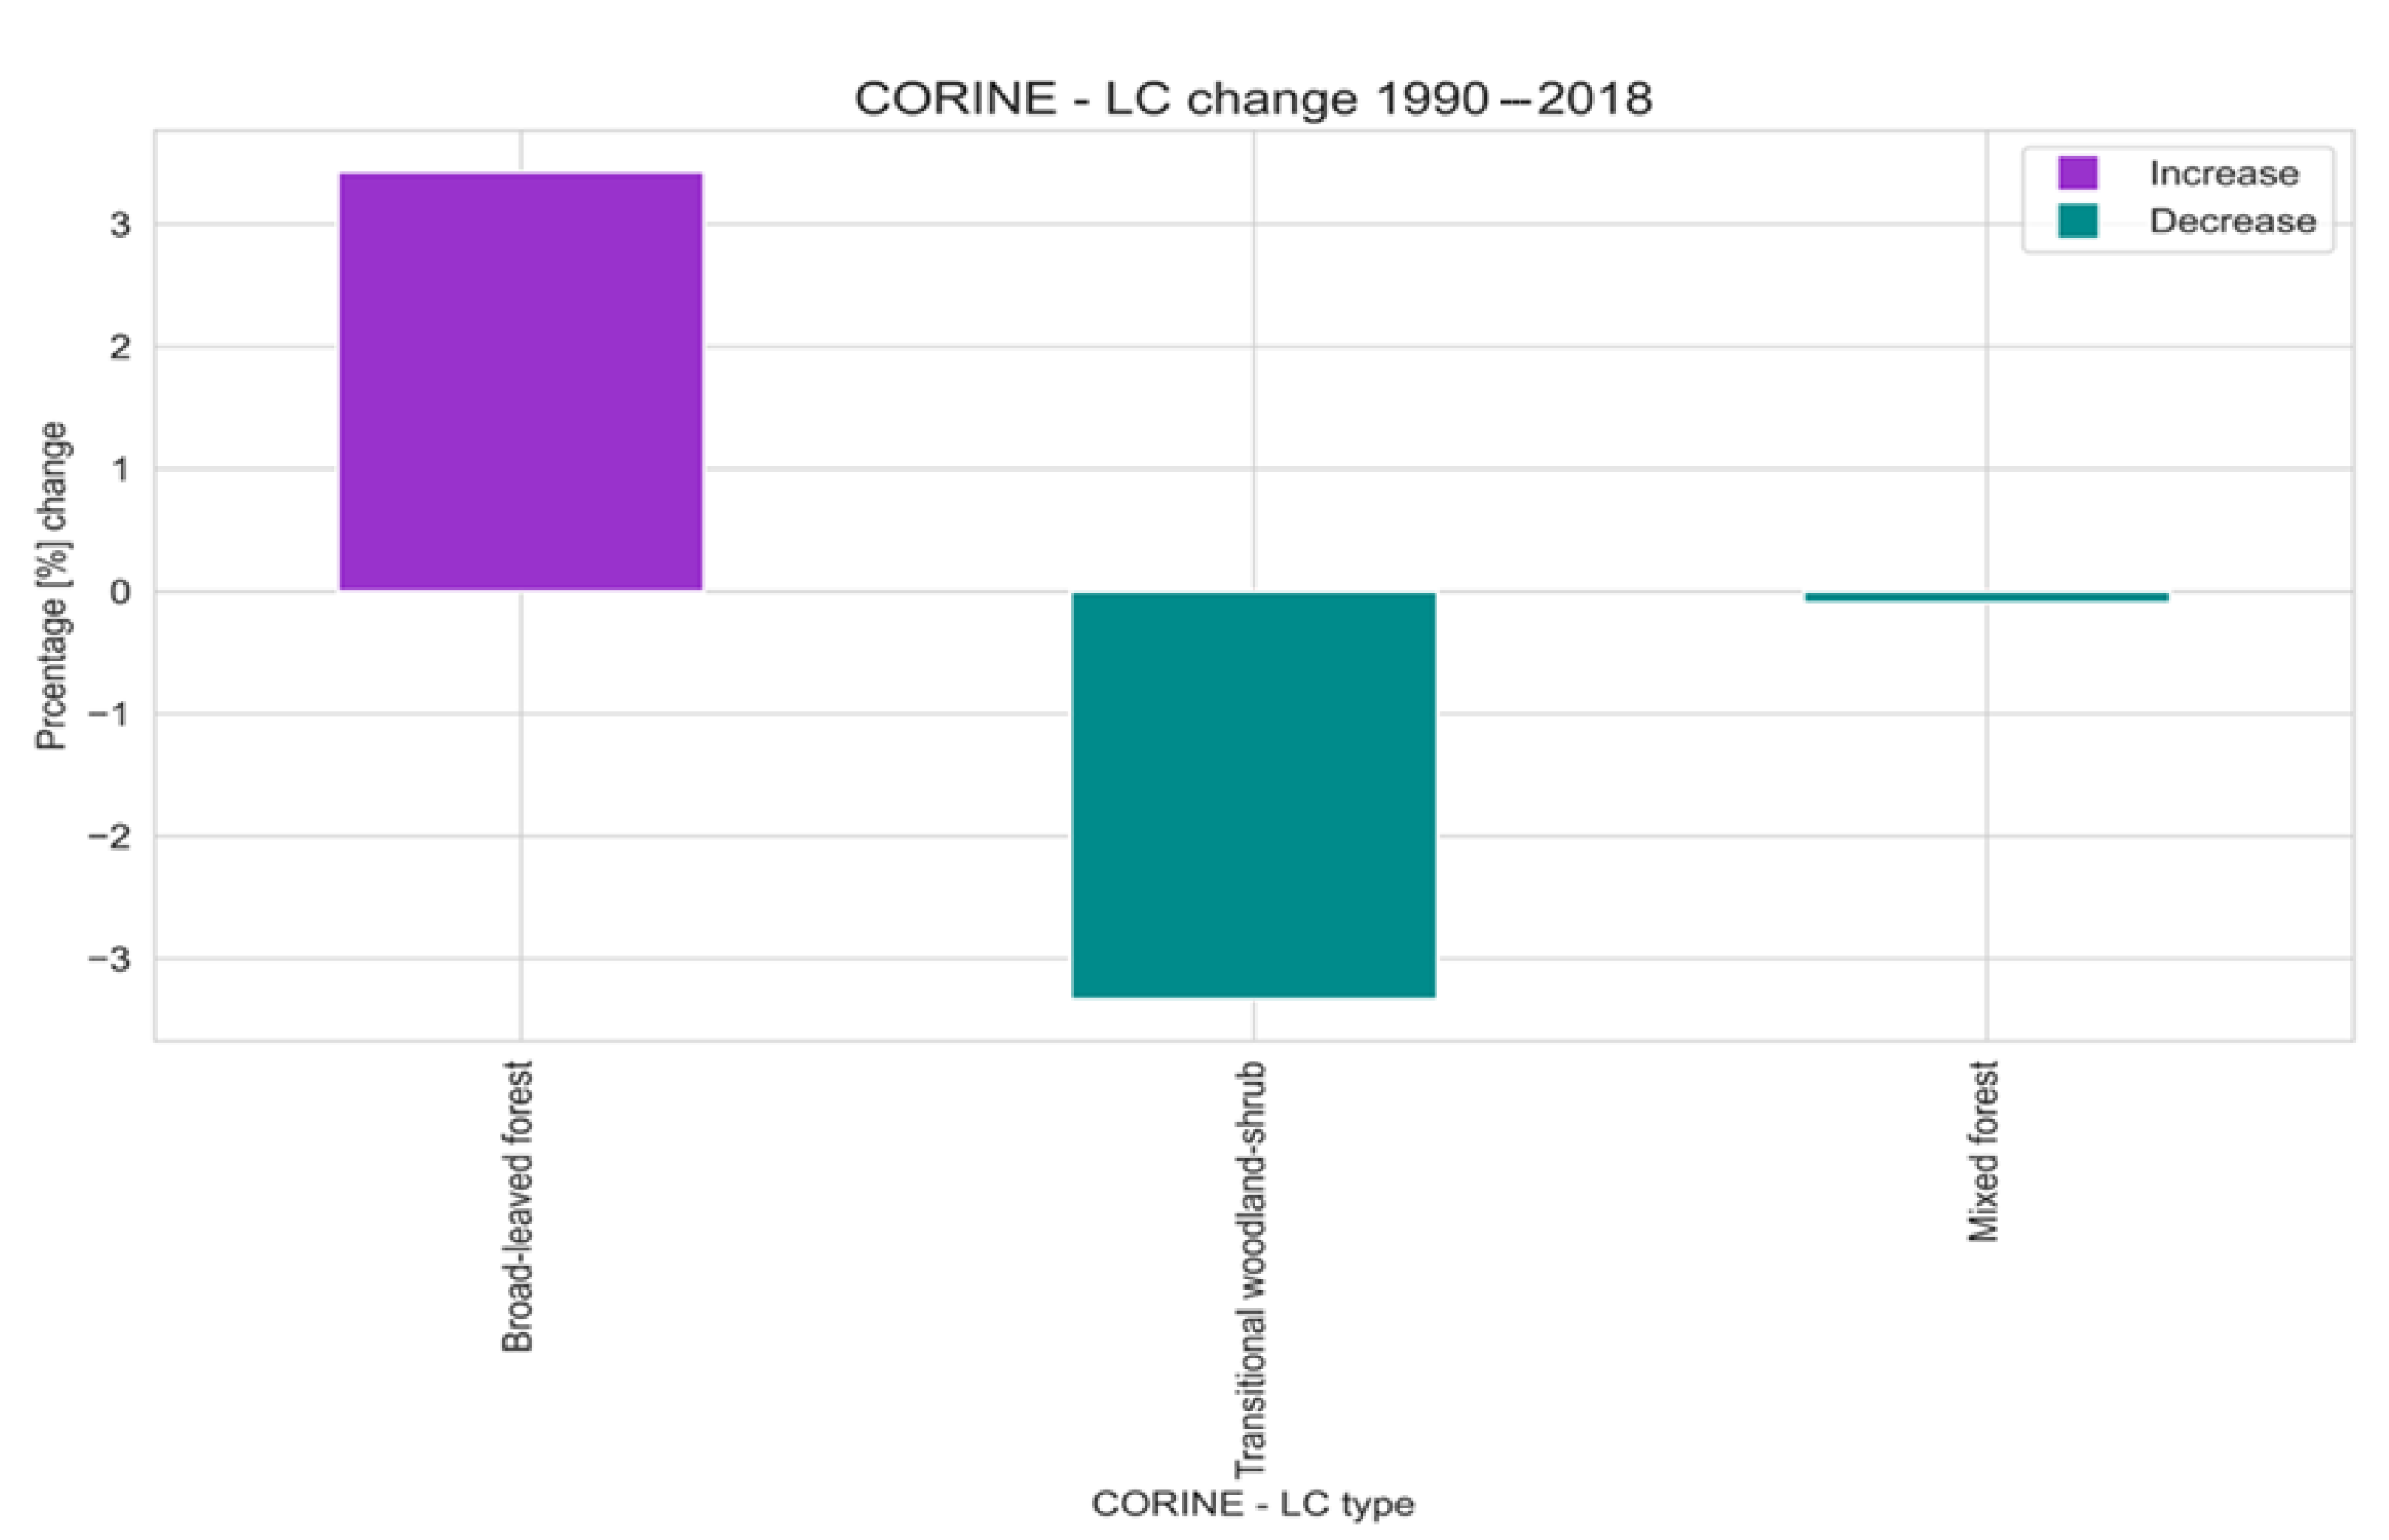
The CLC analysis consists of two stages. First, the most dominant land cover classes at the start and end of the observed period (and available CORINE data) are explained and displayed. In the second stage, the changes between the two datasets are calculated and presented as a bar chart. For example, Figure 5 presents the most dominant land cover classes between 1990 and 2018. As mentioned, the study is mostly covered by forested areas made of broad-leaved and mixed forests, more than half and quarter, respectively, some grasslands, lower vegetation, agricultural areas, and by a minor degree, coniferous forests, and water bodies (Trakošćan Lake). The land cover classes are consistent over the nearly 30-year period, with some slight changes. However, the changes are related only to the growth of the low vegetation into broad-leaved forests, as shown in Figure 6.

3.3. Sediment Production

In catchments where inflow and sediment quantity measurements have not been made, or have been made only in part, Fleming’s formula (Equation (1)) can be used to estimate the magnitude of annual sediment yields. The catchment area of Lake Trakošćan is mostly covered with mixed deciduous and mixed forest, which cover more than ¾ of the lake drainage area, with an increasing rate since 1990 (Figure 3). Therefore, the coefficients n = 1.02 and a = 4000 were chosen for the estimation of sediments according to Equation (1) from Table 2. The mean annual precipitation was taken from the Table 2 for the period 1961–2020. Based on these values, the annual mean sediment production is Qs = 524 t/year. Since 10% of the total sediment is dragged sediment, and the Fleming method can yield up to 50% errors [28], the determined mean value Qs was increased by 50% so that the annual total sediment, according to Fleming, was Qs′ = 865 t/year. To gain knowledge about the lake’s behaviour in terms of sediment accumulation, prior projects were consulted, i.e., “The state of Trakoscan lake and its torrent tributaries” [10], where the Fleming’s equation with an increase of 50% was also applied, and proved with in situ measurements of sediment thickness. Furthermore, the total sediment production, according to Fleming’s equation, from 1961 to 2020 equals 31,454.77 tons.
If the annual sediment production in the catchment area of Lake Trakošćan is known, Brune’s equation (Equation (6)) can be used to calculate the time needed to deposit this sediment in the lake for a given volume of the lake. The values of specific hydrological and meteorological parameters are shown in Table 10.
Sediment production is calculated using Fleming’s equation (Equation (1)), and in addition to the already mentioned parameters from Table 10, the parameters from Table 7 and Table 8 are needed for the calculation. These parameters are shown in Table 11.
For the first volume segment Y = 0.8591. The filling time of the first segment of the reservoir is
t = V a Y   V 1 = 60.6   y e a r s
The results of the calculation of other available segments of the volume of the reservoir are shown in Table 12.

4. Discussion

4.1. Contribution from the Previous Project

Knowing the timing and source areas for sediment that causes turbidity will help managers know when and where to focus erosion control measures and structures. Under normal erosion conditions, the importance of in-channel sources over hillslope sources may indicate in-channel sediment control structures such as weirs or check dams rather than hillslope erosion control measures [9].
The main project of Čemernica from 1981, followed by the arrangement of its torrents (1–9) of the southern part of the Trakošćan Lake, by barriers constructions (Figure 2) solved the problem of sedimentation in landfills in the number of Qs = 7 415 m3 (Table 13). However, this is insufficient compared to the much more significant amounts reaching the lake. According to the budget from the project “Conceptual solution of the water system of the Bednja basin, 1989”, the part of annual sediment production W (m3/year) was 9836 m3. Following this dynamic, the project assumed that in 10 years, 98,000 m3 of sediment would reach Lake Trakošćan, or 294,000 m3 in 30 years [10].
According to measurements made in 1969, the lake’s total volume was 392,000 m3. The sediment in the lake in 1969 was 146,000 m3, which was 37% of the filling of the lake. Thus, the remaining water volume in 1969 was 392,000 − 146,000 = 246,000 m3. Annually, 9836 m3 of sediment is introduced into the lake from torrents that flow directly into the lake, so according to the available data, it was expected that in a period of 25–30 years, the lake would be filled with sediment [10].
The study of sediment thickness in the lake was carried out in 2019 using 12 penetration probes, of which four samples were analysed. It was determined that the sediment composition is organic clay of high plasticity, dark grey to black colour, intense organic smell containing plant residues, and a little fine sand in places. Also, based on the sediment thickness from 1.4 to 2.7 m, the total volume of deposited sediment in the lake was estimated to be Vs = 238,095 m3 [12].

4.2. Results from This Investigation

According to Fleming calculation, the yearly production of sediment is 865 t/year or 961 m3/year in the period 1961–2020. In comparison with the results of sediment calculation via Fleming’s equation from project Arrangement of torrent Čemernica with tributaries, 1981 (Table 14), it can be concluded to match these results.
Figure 7 presents the comparison of the annual volume of sediment washed from the lake catchment (A = 10.7 km2), using the parametric Fleming method and the actual measured annual amount of suspended sediment at the 20 km downstream hydrological station Bednja, Željeznica.
The average value for sediment production calculated according to Fleming is 865 tons, while the mean SST value based on the measured daily SSC on HS Bednja, Željeznica is ten times higher and is 8609 tons. This is understandable because the catchment area of HS Željeznica is 309 km2, which represents approx. 45% of the whole Bednja catchment. In comparison, the Trakošćan Lake catchment is almost 30 times smaller and belongs to the original part of the basin.
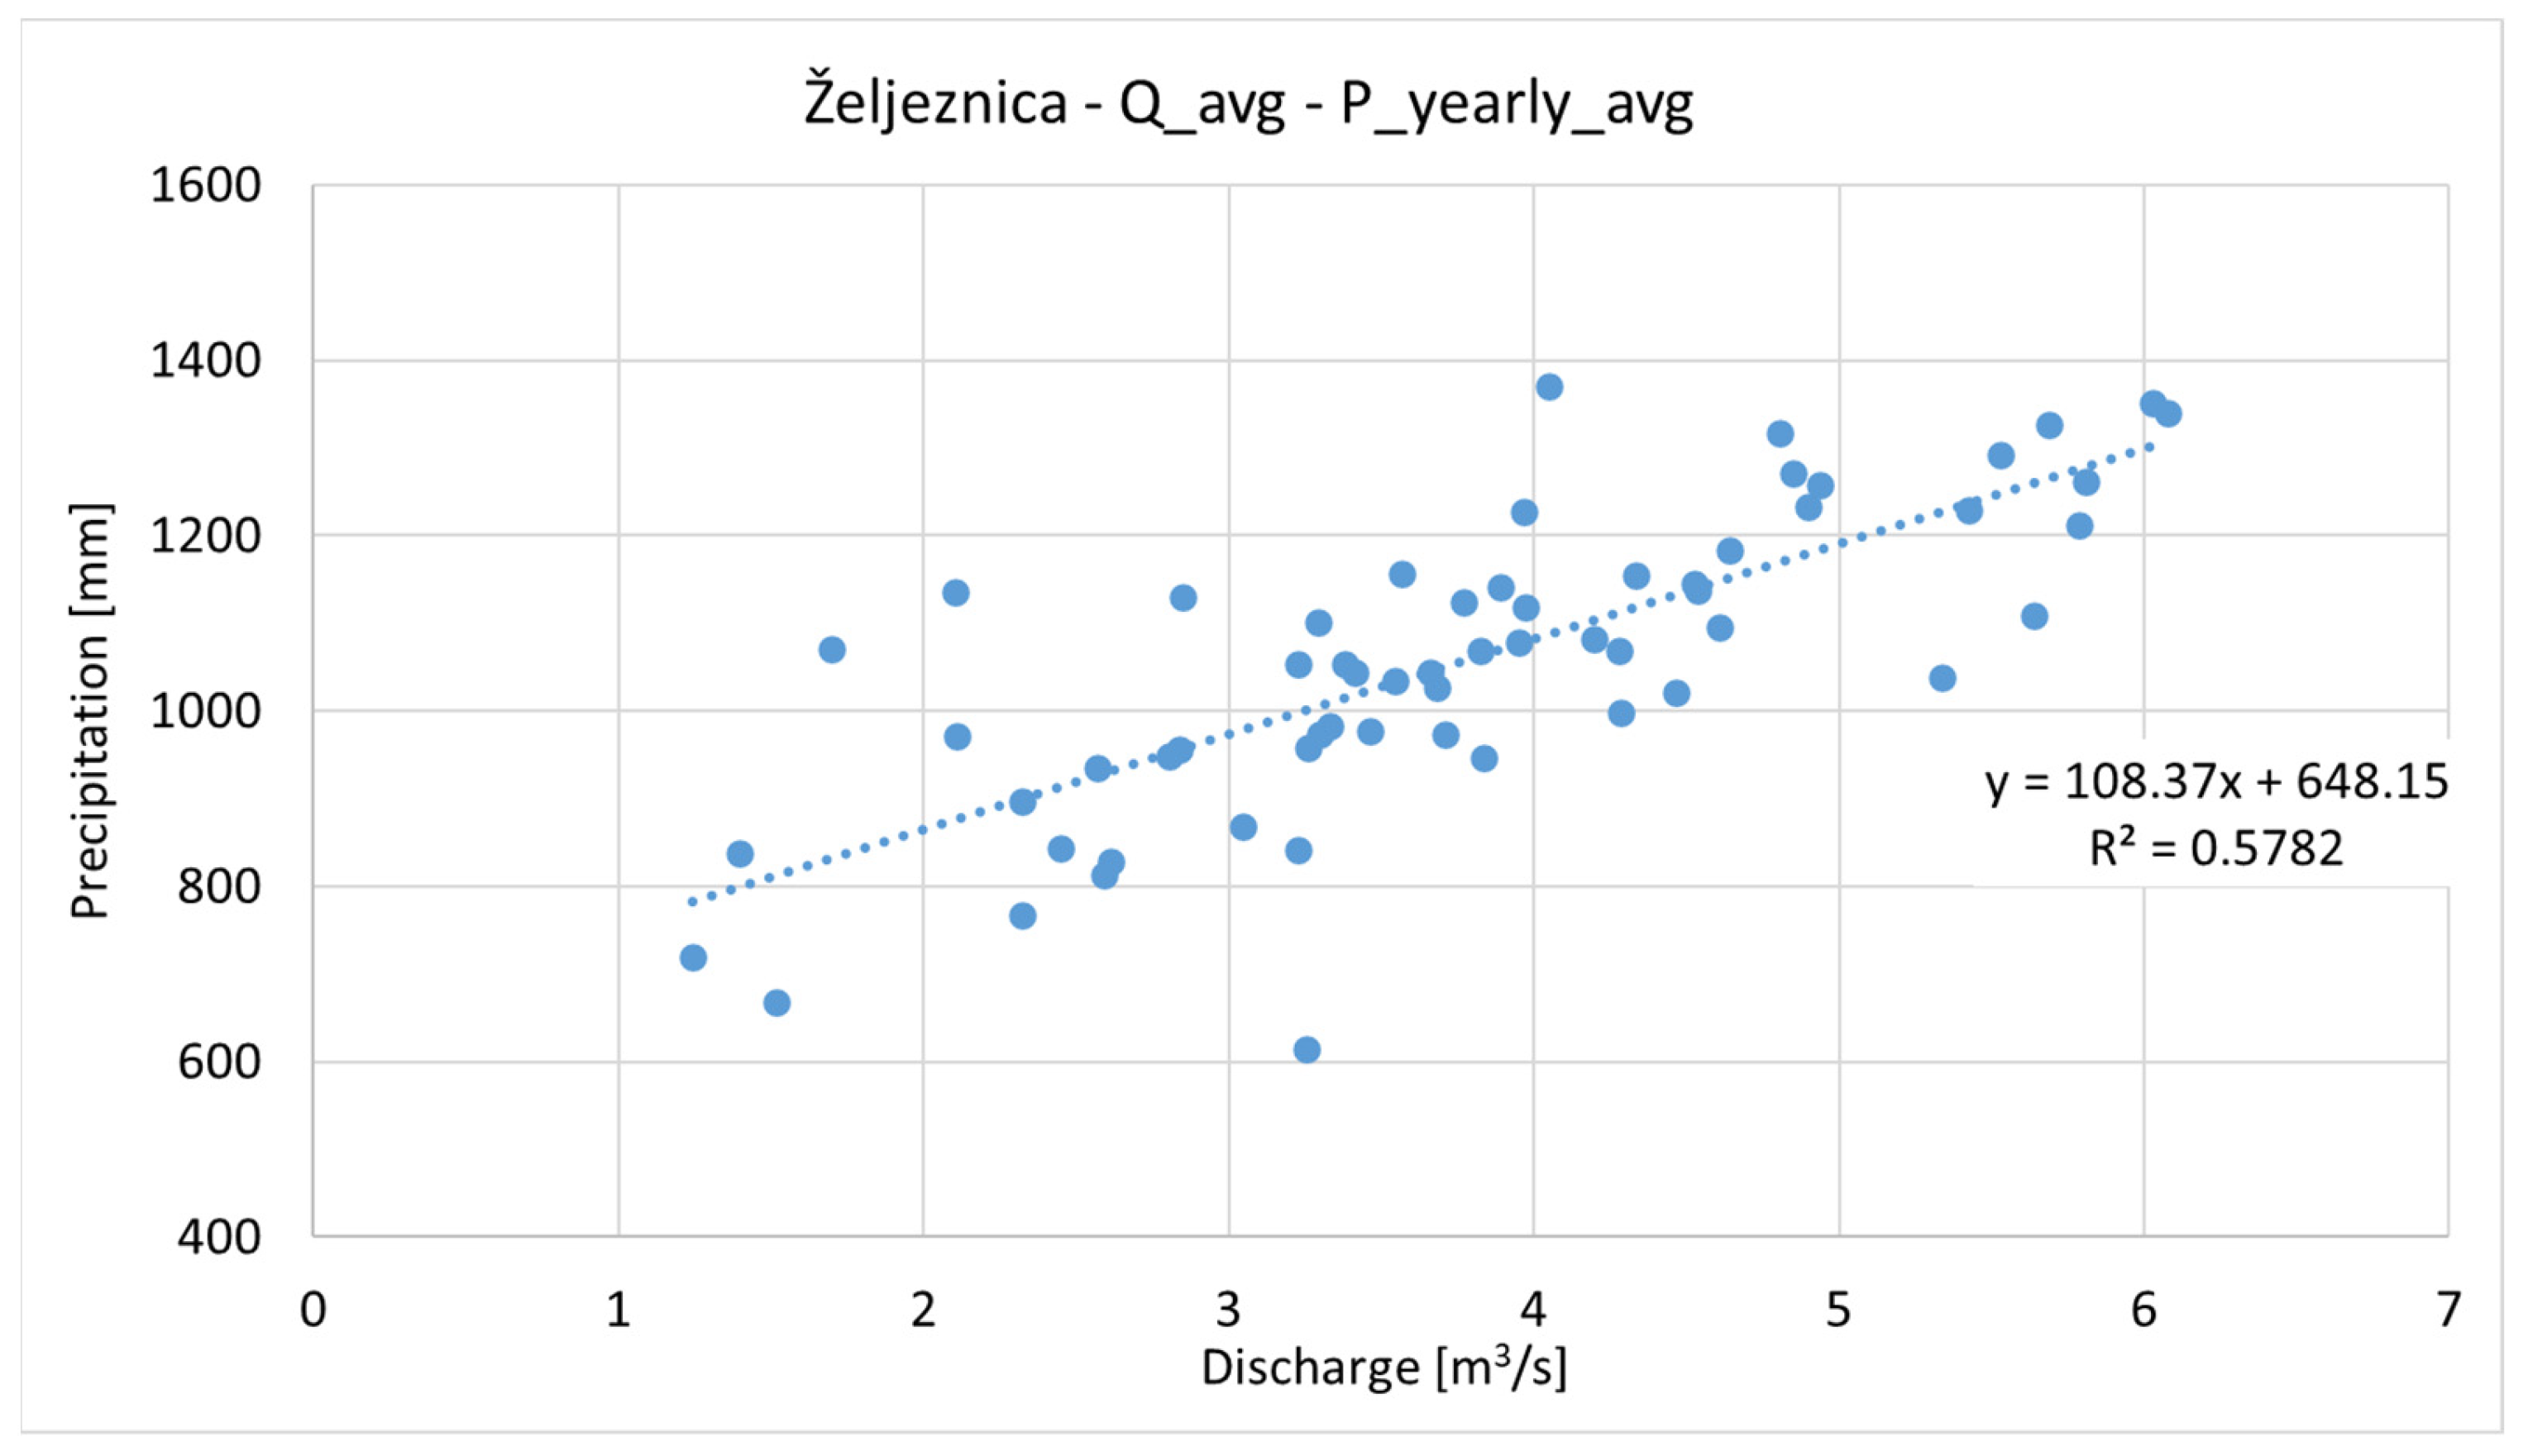
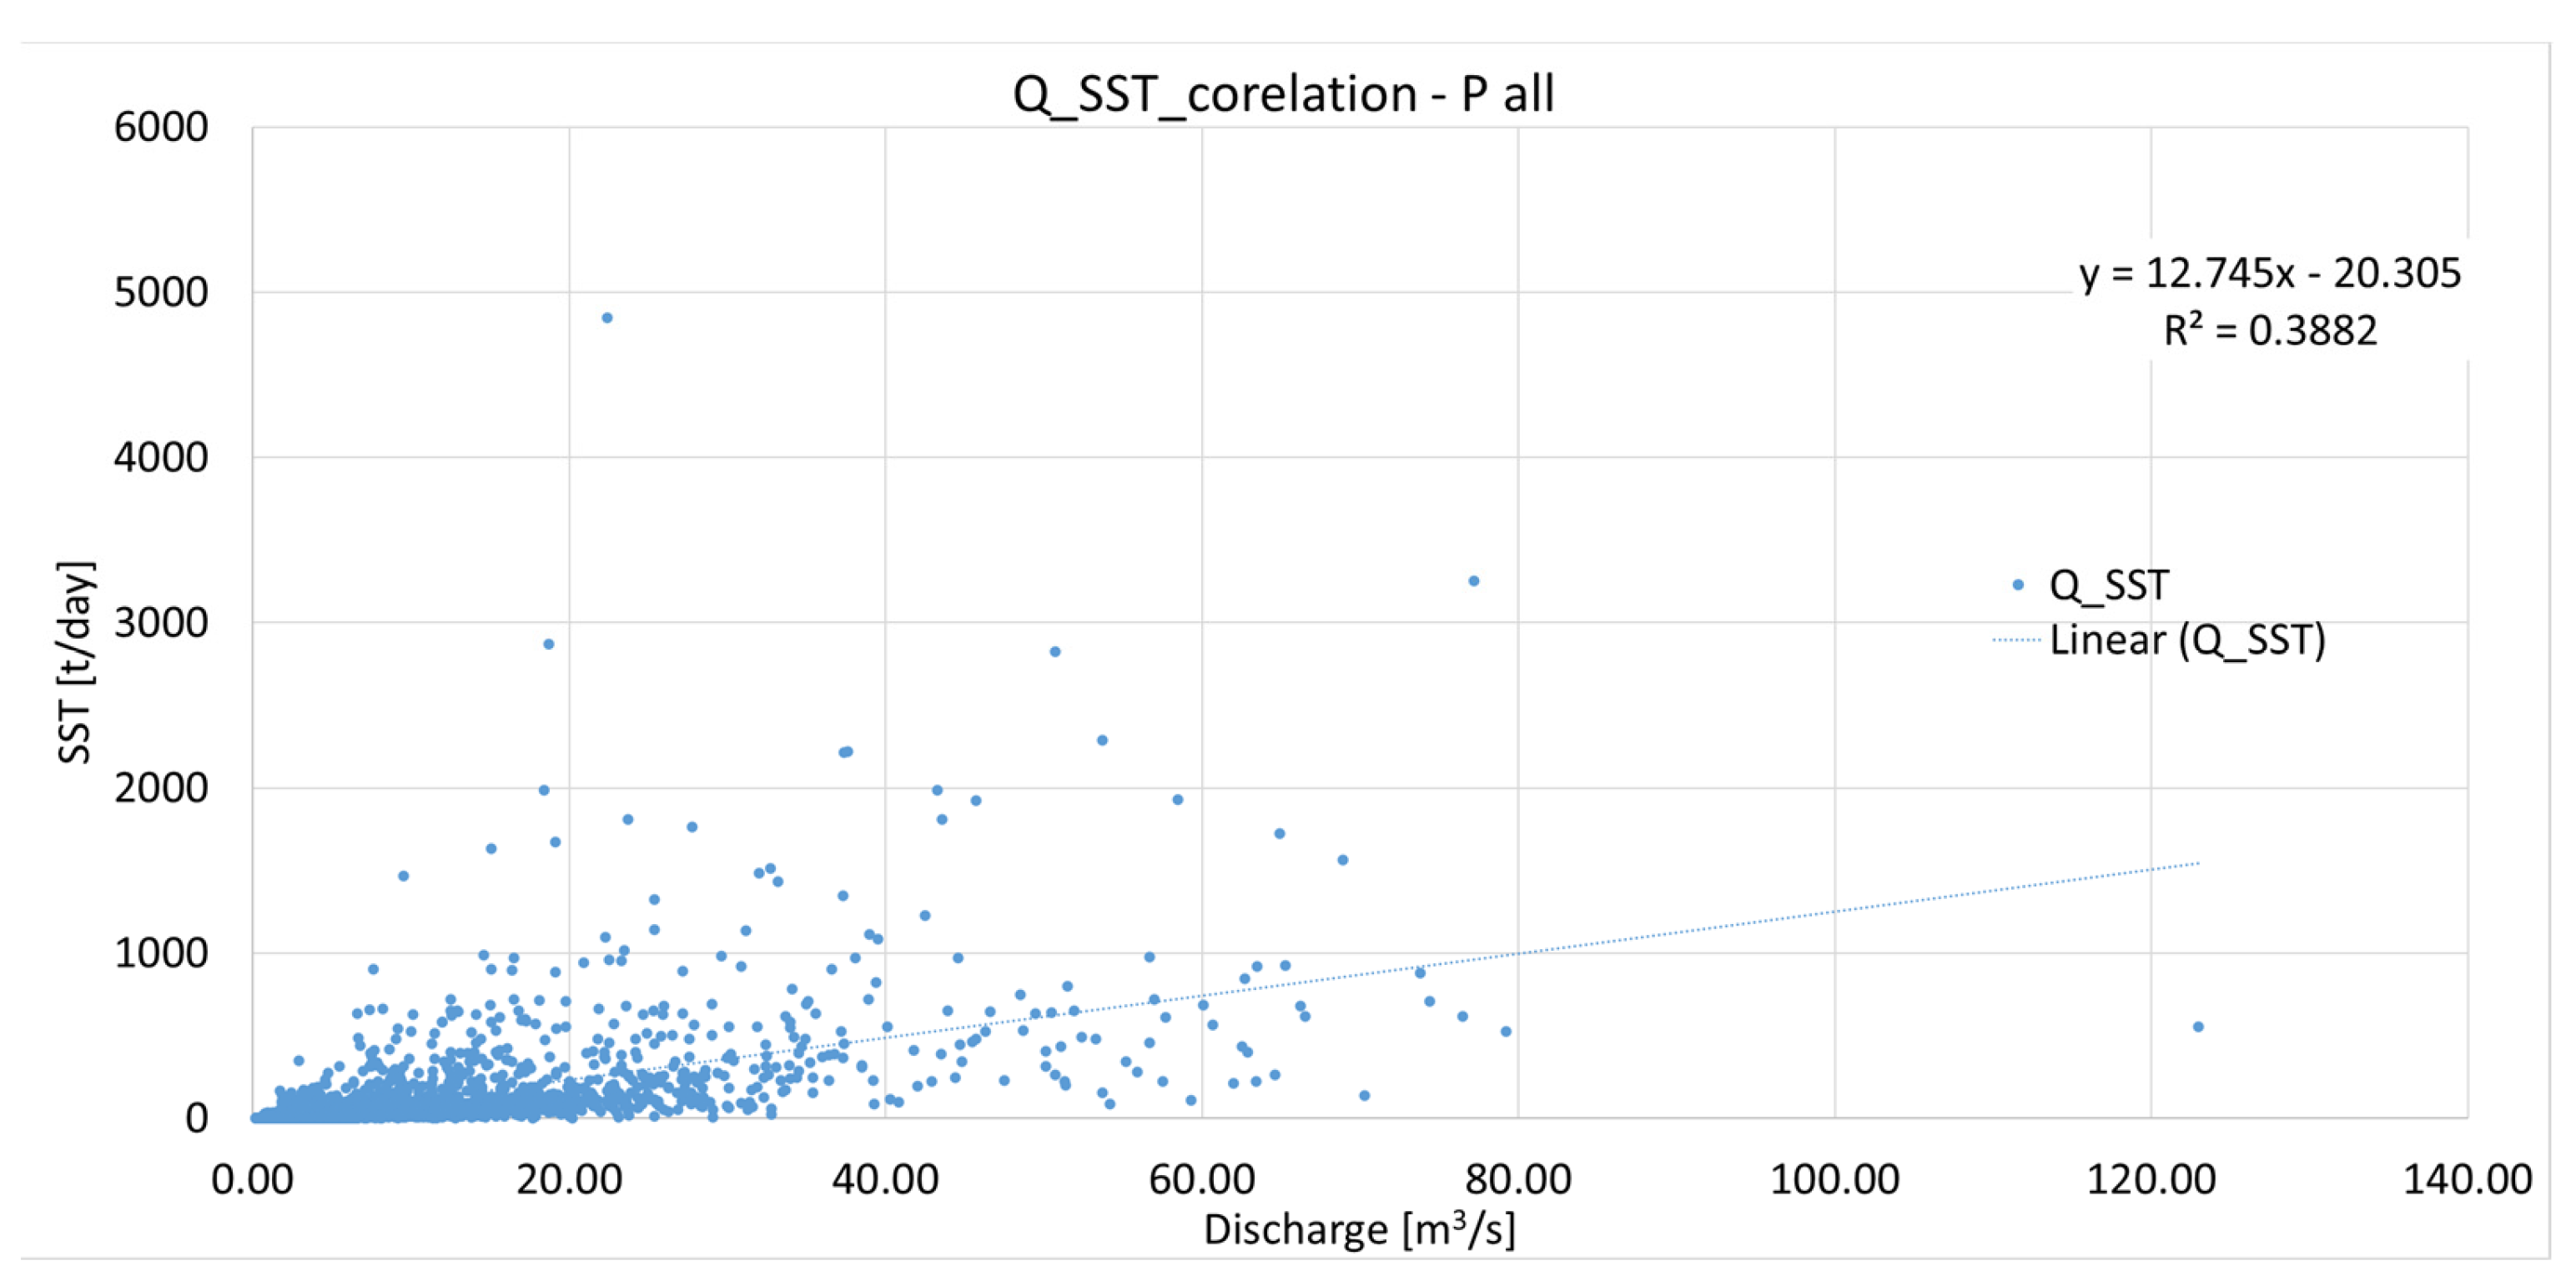
Figure 8 shows the correlation between mean annual discharge [m3/s] and mean annual precipitation [mm] for HS Bednja, Željeznica, period 1961–2021, and Figure 9 shows the correlation between daily mean discharge [m3/s] and daily SST [t/day], measured on HS Bednja, Željeznica, period 1987–2020. In both correlations, the R2 is approx. 0.4, which is considered low. Because of these reasons, there is no realistic basis to build relevant models on daily or mean annual values.
A better understanding of sediment sources and their event, seasonal, and annual variability can also aid sediment and water-quality modelling in catchments. More precise data of continuous gauging precipitation intensity on this catchment is needed to analyse the characteristics of the rainfall and rainfall-runoff erosivity factor in more detail [9]. Unfortunately, only one climatological station has a continuous record of precipitation intensity, the Bednja climatological station, which was established recently, in the year 2006 (Figure 1). Therefore, the data series was not considered long enough in this investigation. Based on the data from the Bednja climatological station, an analysis was carried out, and some extreme rain events were singled out for further research modelling of the rainfall-runoff erosivity factor.
As all three meteorological stations displayed a positive homogeneity when precipitation time series were tested, the Mann-Kendall test for trend assessment was done on the complete series. All Mann-Kendall tests are given at a confidence level of 0.05, meaning all results with a p value higher than 0.05 (in Table 8 and Table 9) are considered as statistically insignificant. Therefore, none of the analysed precipitation gauge data series resulted in a statistically significant trend, although a slight decrease in total yearly precipitation is noticeable (see example of station Donji Macelj presented in Figure 3).
When the number of snow days per year is considered, at the three gauges in the vicinity of the basin, all displayed a decrease in the number of days with snow (see Figure 4); however, the Mann-Kendall test showed that only the trend at the station Križovljan can be considered as significant with a sen slope of −0.33, meaning that there were 0.33 snow days per year from 1962 to now.
However, what is evident is that there is no negative trend in the data series related to the calculated values of sediment production by the Fleming parametric method in contrast to the strong negative trend in the measured data series on HS Bednja, Željeznica (Figure 7).
Possible reasons include:
  • Construction works that were carried out in 1980 in the Trakošćan lake basin and the impact of barriers on reducing the input of sediment carried by torrents into the lake;
  • Change in climate patterns, which is manifested in a time series decreasing trend (although not statistically significant) of yearly precipitation amount on Donji Macelj, and the number of days with snow cover on three nearby meteorological stations (Figure 3 and Figure 4);
  • The slight changes in land cover of 3.5% during the observed period 1990–2018 are minor and related only to the growth of the low vegetation into broad-leaved forests, as shown in Figure 5 and Figure 6.
As for the time to fill the lake with sediment, according to Brune’s method, 961 m3 is obtained per year, which means that it would take 253 years to fill the lake with only inorganic material entirely, and for a volume of 275,000 m3 (which roughly corresponds to the estimate based on research from 2019 [12] would take 130 years).
However, since 238,095 m3 of sediment was deposited in a much shorter period of 60 years (1961–2020), the conclusion is that the total amount of organic material washed from the catchment (aquatic plants, leaves, branches from forests and even trees) equals the amount of inorganic material that is washed from the soil. This assumption is confirmed by the result of the sediment composition analysis: “It was determined that the sediment composition is organic clay of high plasticity, dark grey to black colour, intense organic smell containing plant residues and in places a little fine sand” [12].
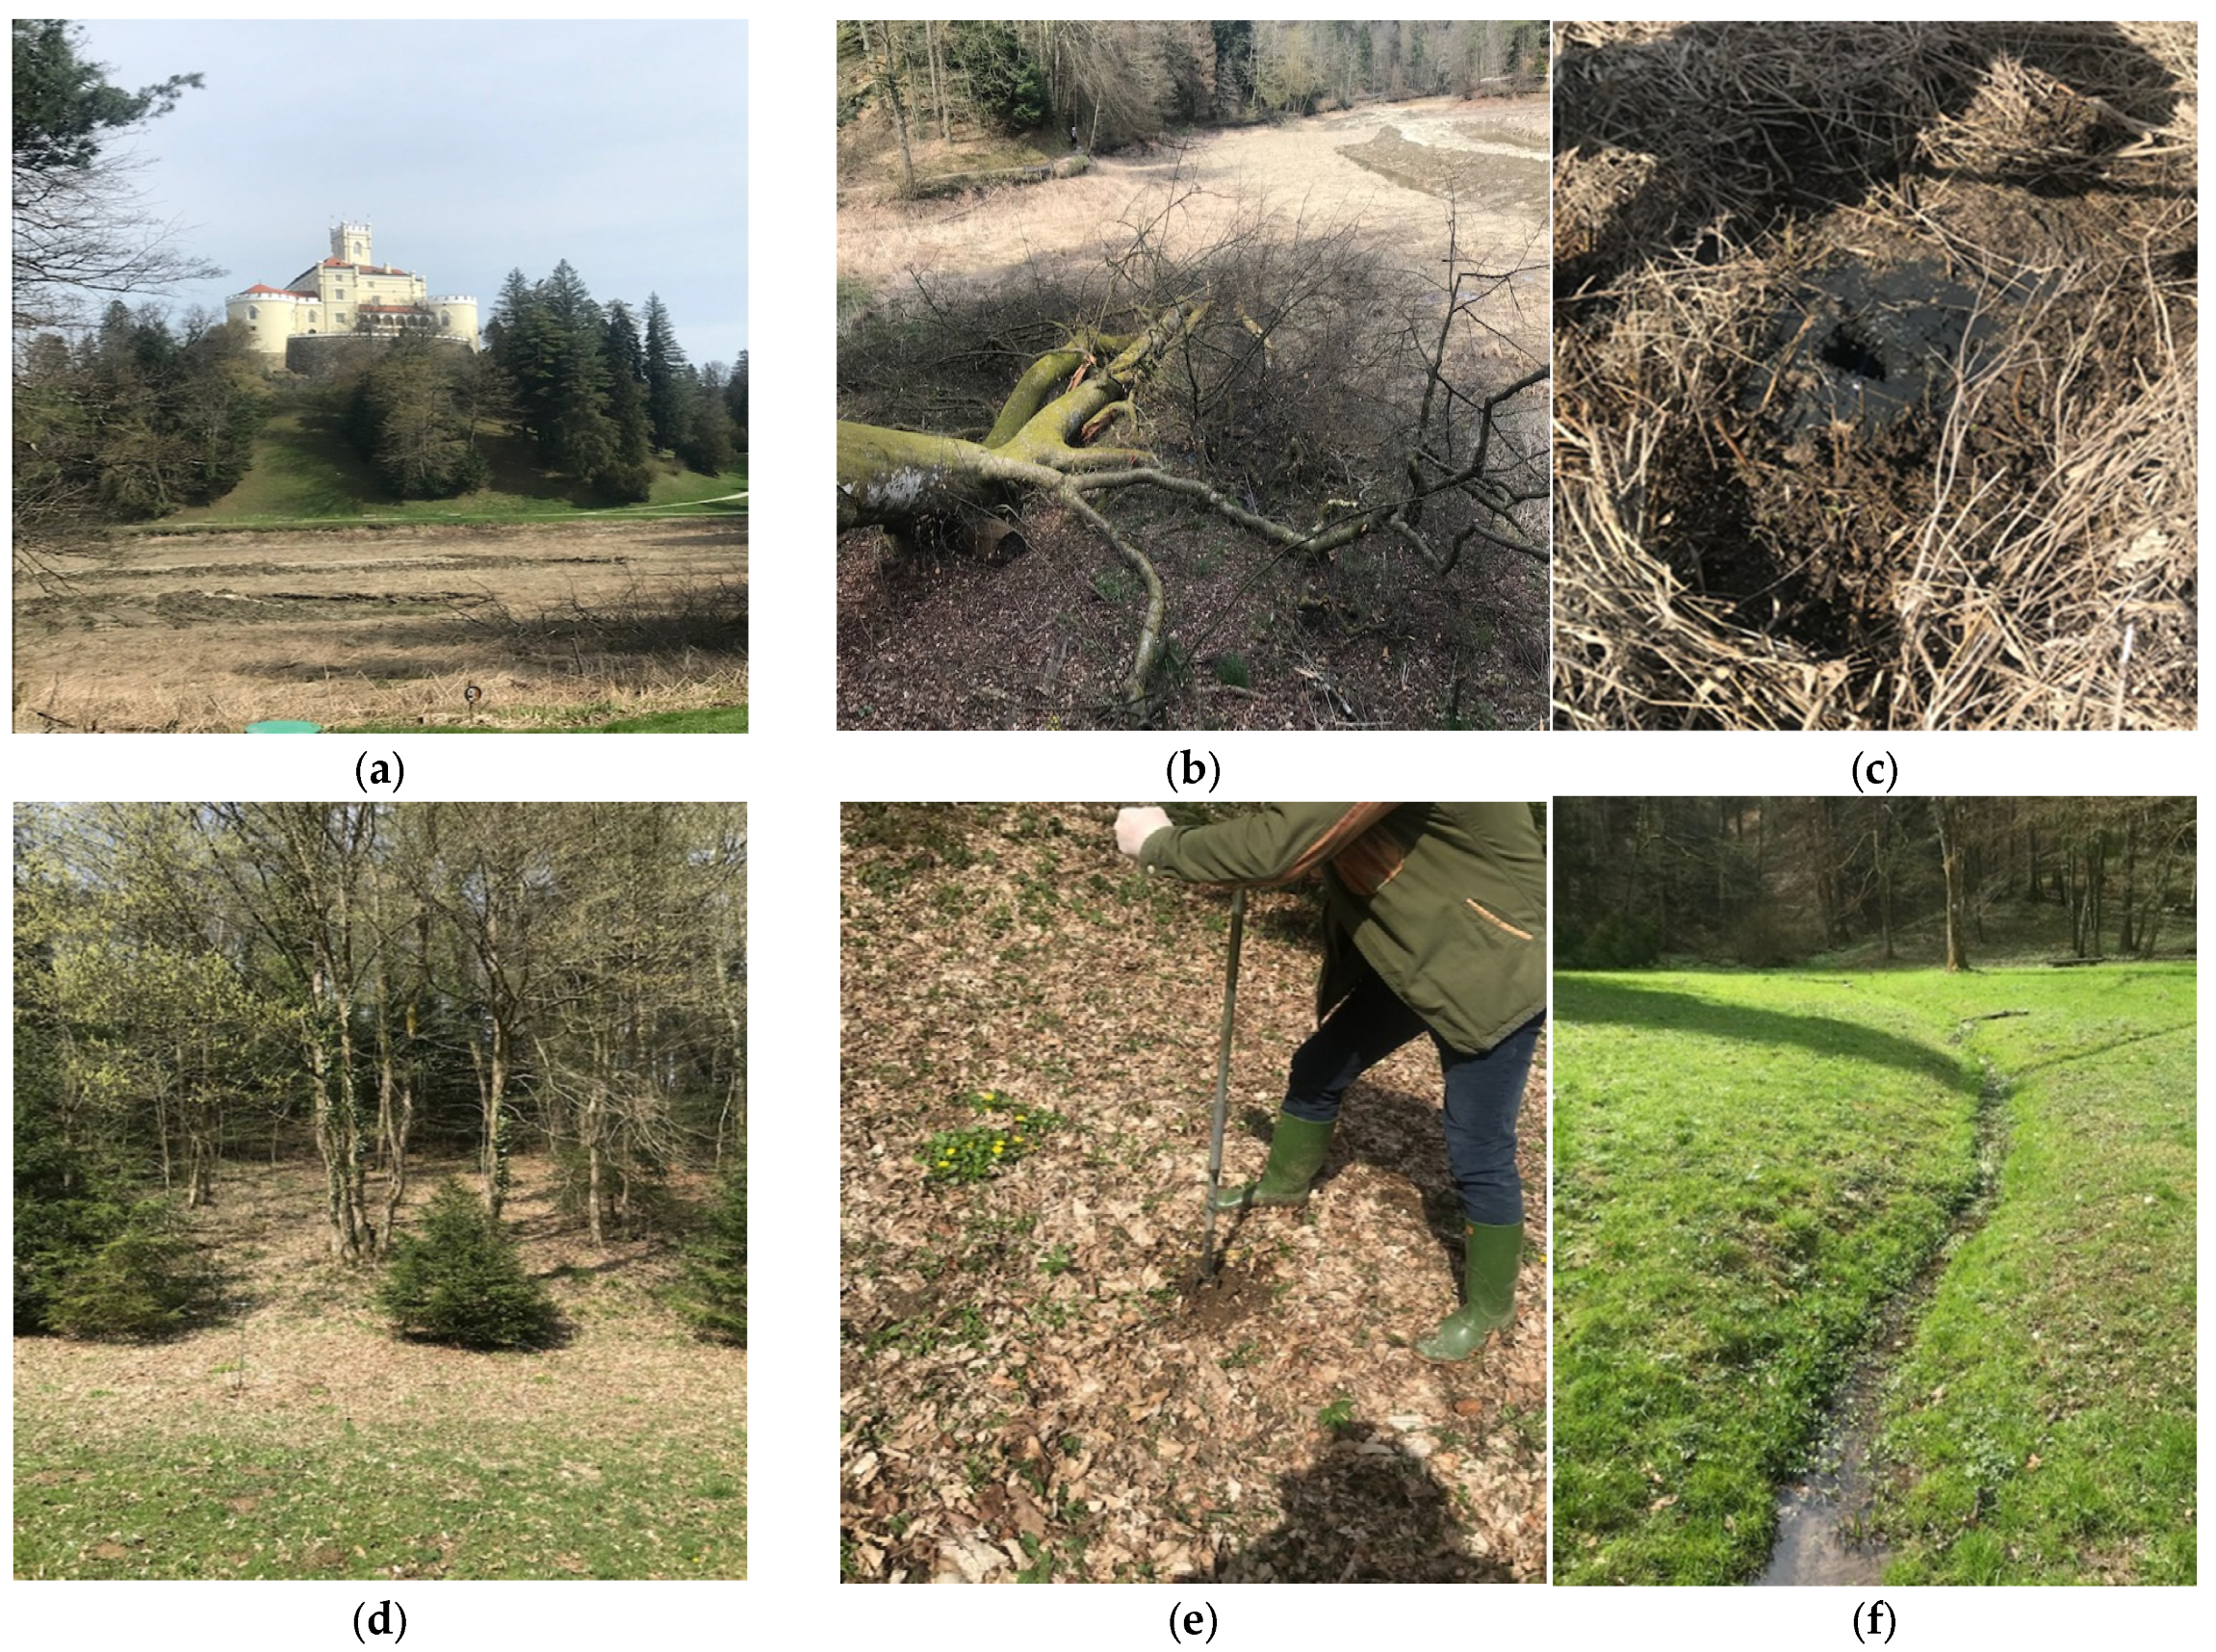
A recent on-site tour and sediment sampling from the bottom of the lake confirmed the aforementioned (Figure 10a–f).

4.3. Future Research Directions

Intending to develop measures of sustainable landscape rehabilitation and nature-friendly solutions, reliable data, advanced methodological approaches, and sophisticated models is mandatory. Therefore, improvement in catchment and sediment management of the Trakošćan Lake through the following measures is suggested:
  • Preventing sediment transport from the torrents and the deposition of organic and inorganic materials in the lake, which significantly reduces the water quality.
Through constructing and maintaining previously designed embankments upstream of the lake, the small retentions would be put into operation to receive large amounts of natural sediment, thus freeing the lake from the introduction of sediment. This would be especially important for the reception of large amounts of leaves and other plant material that are washed out of forests after heavy rains or after winter freezing of lake and forest vegetation.
2.
Improvement of methods for calculating sediment production and forecasting the time of its deposition in the lake to plan procedures for the effective operational management of the Trakošćan basin.
For the operational management of sediment in Lake Trakošćan, it is necessary to create an integrated model of sediment production that would be calibrated with measured values, not just estimates from old studies and projects. Therefore, it is necessary to design comprehensive meteorological and hydrological monitoring in the basin that would provide relevant data on the intensity of precipitation, snow cover, amount of sediment in torrents and the lake, input and output flow of water, as well as analysis of water and sediment samples.
3.
For better and permanent monitoring of all meteorological, hydrological, geological, chemical, and biological processes, it is necessary to define Lake Trakošćan as an experimental catchment.
The data collected on such an experimental, typically forested mountain watershed in the source part of the Bednja River, where the processes are still mainly influenced by physical and climatic factors, would be of inestimable value. Furthermore, the data could be used for modelling similar watersheds, that is, as a reference state compared to other locations where anthropogenic pressure is present (traffic, urbanisation, sewage pollution, etc.).

5. Conclusions

Due to climate changes recently, many of the time series homogeneity studies point to a change in the annual discharge regime in the early 1980s in different basins in Croatia. Moreover, studies confirmed the interruption of homogeneity in the early 1980s in air pressure, precipitation, surface runoff, and a time series of differences between rainfall amounts and potential evapotranspiration [18,31,32].
Understanding snow cover’s role in erosion and turbidity will allow for better planning in the face of a changing snowpack due to climate change. This knowledge will enable management practices to be chosen that will make the most efficient use of erosion mitigation resources [9].
Climate change patterns manifest in the time series decreasing trend of yearly precipitation amount on Donji Macelj, and the number of days with snow cover on two nearby meteorological stations are not statistically significant. In this investigation, the only meteorological station where a statistically significant trend could be observed was the Križovljan station, located at the lowest altitude, where a decreasing trend in the number of snow days in the period 1961–2021 was present.
There is no urbanisation or industry in the catchment area. It is a typical natural basin without significant anthropogenic pressures and changes over time, confirmed by a recent field trip and the CORINE LU/LC analysis in Figure 5 and Figure 6.
The lake sediment measurements in 1969 showed 392,000 m3 water + silt and 146,000 m3 sludge, which amounts to 37% of the total lake volume. According to the investigations from 2019, about 60% of the designed volume of the lake was filled with sediment.
For a long time, there was no proper conservation system for the lake and sediment management. Finally, in 2022, the works on sediment extraction began as part of the implementation project “Cleaning of Trakošćan reservoir from accumulated sediment” [33]. The extraction work is still in progress, and it is expected to show the actual amount of deposited sediment, its composition, and the eligibility for its disposal on agricultural land.
Since Trakošćan castle is the most visited castle in northwestern Croatia, including Lake Trakošćan, its added value after the extraction works on the revitalisation of the lake includes opportunities for the construction of hiking trails in the entire length of the lake are opening. Investing in this infrastructure would further increase the tourist attraction of the landscape itself.
This paper presents the parametric methods used to estimate the amount of sediment from the catchment and the time of its deposition, i.e., the filling of the lake. These methods refer to assessing the production of inorganic material from watersheds covered by broad-leaved and mixed forests. However, the composition of the sediment, which was determined by the analysis, indicates significant amounts of organic matter, which is a consequence of the introduction of plant material, branches, and leaves from the forest slopes, which significantly contributes to the volume of material introduced into the lake. All the aforementioned are resulting in the problem of its decomposition and the storage of greenhouse gases and nitrogenous compounds at the bottom of the lake.
For the operational management of sediment in Lake Trakošćan, it is necessary to create an integrated model of sediment production that would be calibrated with measured values, not just estimates based on parametric methods. The next step of the investigation of Lake Trakošćan involves a project emphasising the importance of the catchment and stream network preservation and adding a hydrological gauge just after the lake to enable calibration and model development. The idea involves collecting more significant amounts of data, which can be used later for developing machine learning-based models for sediment transport and deposition prediction for such small artificial lakes.

Author Contributions

Conceptualisation, D.O. and K.P.; methodology, D.O.; software, K.L.; validation, D.O. and K.P.; formal analysis, D.O., K.P. and K.L.; investigation, D.O. and K.P.; resources, I.T.; data curation, D.O. and I.T.; writing—original draft preparation, D.O., K.P. and K.L.; writing—review and editing, D.O., K.P., K.L. and I.T.; visualisation, D.O. and K.L.; supervision, D.O. All authors have read and agreed to the published version of the manuscript.

Funding

This research received no external funding.

Acknowledgments

The authors would like to thank the Croatian Meteorological and Hydrological Service (DHMZ) for providing the necessary meteorological, hydrological, and sediment measurements-related data, enabling this research.

Conflicts of Interest

The authors declare no conflict of interest.

References

  1. Old, G.; Lofts, S. (Eds.) Integrated Sediment Management: Guidelines and Good Practices in the Context of the Water Framework Directive [Draft]; 2022; Available online: https://environment.ec.europa.eu/system/files/2022-09/CISdocumentsedimentfinalTO_BE_PUBLISHED_1430554724.pdf (accessed on 22 April 2023).
  2. Hrnjica, B.; Bonacci, O. Lake Level Prediction using Feed Forward and Recurrent Neural Networks. Water Resour. Manag. 2019, 33, 2471–2484. [Google Scholar] [CrossRef]
  3. Beniston, M. Impacts of climatic change on water and associated economic activities in the Swiss Alps. J. Hydrol. 2012, 412–413, 291–296. [Google Scholar] [CrossRef] [Green Version]
  4. Stefanidis, P.; Stefanidis, S.; Tziaftani, F. The threat of alluviation of lakes resulting from torrents (case study: Lake volvi, North Greece). Int. J. Sustain. Dev. Plan. 2011, 6, 325–335. [Google Scholar] [CrossRef] [Green Version]
  5. Stefanidis, S.; Chatzichristaki, C. Response of soil erosion in a mountainous catchment to temperature and precipitation trends. Carpathian J. Earth Environ. Sci. 2017, 12, 35–39. [Google Scholar]
  6. Jain, S.K.; Singh, P.; Seth, S.M. Assessment of sedimentation in Bhakra Reservoir in the western Himalayan region using remotely sensed data. Hydrol. Sci. J. 2002, 47, 203–212. [Google Scholar] [CrossRef] [Green Version]
  7. Issa, I.E.; Al-Ansari, N.; Sherwany, G.; Knutsson, S. Sedimentation Processes and Useful Life of Mosul Dam Reservoir, Iraq. Engineering 2013, 5, 779–784. [Google Scholar] [CrossRef] [Green Version]
  8. Hrissanthou, V. Comparative application of two mathematical models to predict sedimentation in Yermasoyia Reservoir, Cyprus. Hydrol. Process. 2006, 20, 3939–3952. [Google Scholar] [CrossRef]
  9. Martin, S.E.; Conklin, M.H.; Bales, R.C. Seasonal accumulation and depletion of local sediment stores of four headwater catchments. Water 2014, 6, 2144–2163. [Google Scholar] [CrossRef] [Green Version]
  10. Hrvatske Vode Zagreb. Vodnogospodarski Odjel za Vodno Područje Sliva Drave i Dunava Osijek—Vodnogospodarski odsjek Varaždin. In Stanje Trakošćanskog Jezera i Pripadajućih Bujica koje se Ulijevaju u Jezero, pr. Number: 447/98; Hrvatske Vode: Varaždin, Croatia, 1998. [Google Scholar]
  11. Kerovec, M.; Ternjej, I.; Plenković-Moraj, A.; Hršak, V.; Mihaljević, Z.; Gottstein, S.; Lajtner, J.; Popijač, A.; Gligora, M.; Žganec, K.; et al. Study of Determining the State of Water in Lake Trakošćan with an Assessment of Measures for Rehabilitation and Revitalisation; University of Zagreb, Faculty of Science, Department of Biology: Zagreb, Croatia, 2007. [Google Scholar]
  12. Geokon, D.D. Geotechnical Study of a Survey of the Thickness and Composition of Sediment and Water Quality in Lake Trakošćan; Geokon-Zagreb d.d.: Zagreb, Croatia, 2019. [Google Scholar]
  13. Leskovar, K.; Mrakužić, P.; Meaški, H. Evaluation of remotely sensed precipitation product in a hydrological model of the Bednja watershed. Gradjevinar 2021, 73, 335–348. [Google Scholar] [CrossRef]
  14. Šimunić, A.N.; Pikija, M.; Hećimović, I. Basic Geological Map of Croatia 1:100 000—Sheet Varaždin; Croatian Geological Survey: Zagreb, Croatia, 1982. [Google Scholar]
  15. Dragičević, I.; Blašković, I.; Mayer, D.; Žugaj, R.; Tomljenović, B. Gorski i Prigorski Vodonosnici Sjeverne Hrvatske (Izvješće o Radovima u 1996. Godini); Fond Struĉne Dokumentacije RGNF: Zagreb, Croatia, 1997. [Google Scholar]
  16. DHMZ. Croatian Meteorological and Hydrological Service. Available online: https://meteo.hr/index_en.php (accessed on 22 April 2023).
  17. Oskoruš, D. Contribution to the Analysis of Suspended Load Dynamics in the Transfer Zone of the River Sava; Faculty of Civil Engineering, University of Zagreb: Zagreb, Croatia, 2015. [Google Scholar]
  18. Pandžić, K.; Kobold, M.; Oskoruš, D.; Biondić, B.; Biondić, R.; Bonacci, O.; Likso, T.; Curić, O. Standard normal homogeneity test as a tool to detect change points in climate-related river discharge variation: Case study of the Kupa River Basin. Hydrol. Sci. J. 2020, 65, 227–241. [Google Scholar] [CrossRef]
  19. Gibbons, J.D.; Chakraborti, S. Nonparametric Statistical Inference; Chapman and Hall/CRC: Boca Raton, FL, USA, 2010; ISBN 9781439896129. [Google Scholar]
  20. Mann, H.B. Nonparametric Tests against Trend. Econometrica 1945, 13, 245. [Google Scholar] [CrossRef]
  21. Kendall, M.; Gibbons, J. Rank Correlation Methods—Charles Griffin Book, 5th ed.; Oxford University Press: London, UK, 1990; ISBN 0195208374. [Google Scholar]
  22. CORINE Land Cover—Copernicus Land Monitoring Service. Available online: https://land.copernicus.eu/pan-european/corine-land-cover (accessed on 11 September 2018).
  23. Asselman, N.E.M. The impact of climate change on suspended sediment transport in the river Rhine. Stud. Environ. Sci. 1995, 65, 937–942. [Google Scholar] [CrossRef]
  24. Cheng, N.N.; He, H.M.; Yang, S.Y.; Lu, Y.J.; Jing, Z.W. Impacts of topography on sediment discharge in Loess Plateau, China. Quat. Int. 2017, 440, 119–129. [Google Scholar] [CrossRef]
  25. Dwarakish, G.S.; Ganasri, B.P. Impact of land use change on hydrological systems: A review of current modeling approaches. Cogent Geosci. 2015, 1, 1115691. [Google Scholar] [CrossRef]
  26. Stonestrom, D.A.; Scanlon, B.R.; Zhang, L. Introduction to special section on Impacts of Land Use Change on Water Resources. Water Resour. Res. 2009, 45. [Google Scholar] [CrossRef] [Green Version]
  27. Mao, D.; Cherkauer, K.A. Impacts of land-use change on hydrologic responses in the Great Lakes region. J. Hydrol. 2009, 374, 71–82. [Google Scholar] [CrossRef]
  28. Fleming, G. Design Curves for Suspended Load Estimation. Proc. Inst. Civ. Eng. 1969, 43, 1–9. [Google Scholar] [CrossRef]
  29. Te Chow, V.; Maidment, D.R.; Mays, L.W. Applied Hydrology; McGraw-Hill: New York, NY, USA, 1988; Volume 6. [Google Scholar]
  30. Brune, G.M. Trap efficiency of reservoirs. Trans. Am. Geophys. Union 1953, 34, 407. [Google Scholar] [CrossRef]
  31. Gentilucci, M.; Djouohou, S.I.; Barbieri, M.; Hamed, Y.; Pambianchi, G. Trend Analysis of Streamflows in Relation to Precipitation: A Case Study in Central Italy. Water 2023, 15, 1586. [Google Scholar] [CrossRef]
  32. Matoušková, M.; Fraindová, K. Trends of hydroclimatic variables and outflow in the Athabasca River basin. Geogr. CGS 2023, 128, 127–152. [Google Scholar] [CrossRef]
  33. Hidroplan, d.o.o. Cleaning of Trakošćan Reservoir from Accumulated Sediment—Implementation Project; Hidroplan d.o.o.: Zagreb, Croatia, 2020. [Google Scholar]
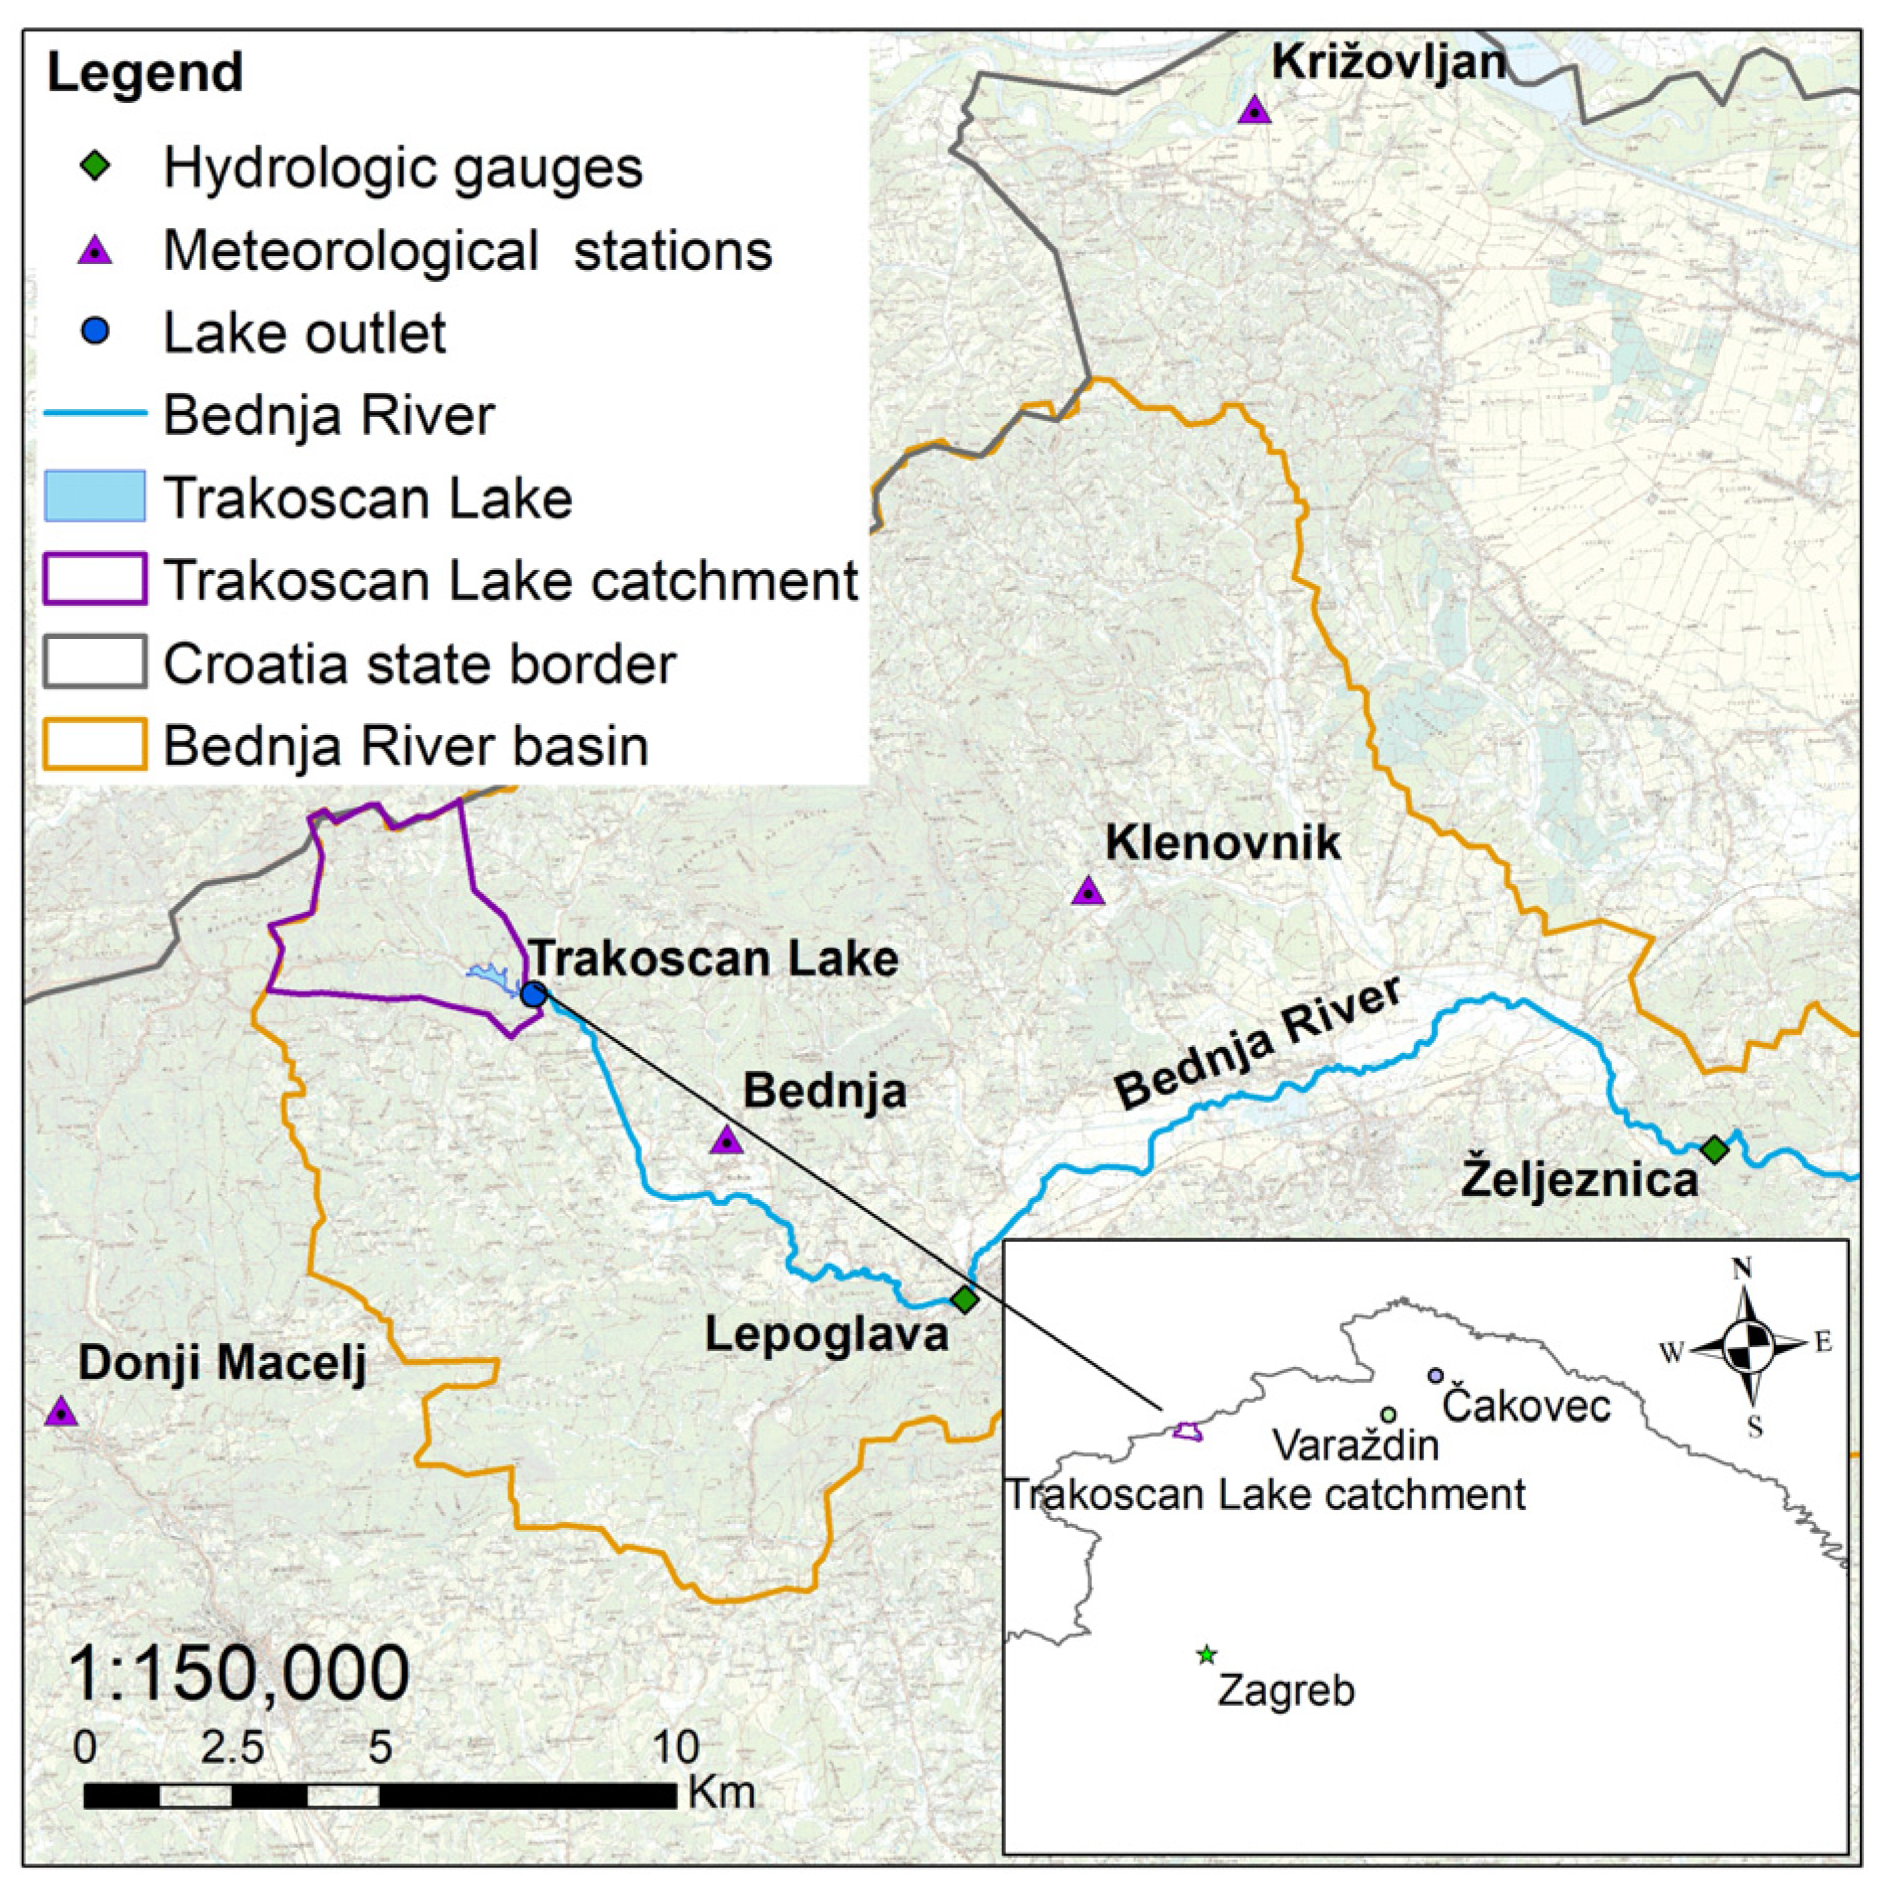
Figure 1. Study area with the catchment area of the Trakošćan Lake, Bednja River and meteorological and hydrological gauging stations.
Climate 11 00167 g001
Figure 2. Location map of Lake Trakošćan, the torrents and barriers—red line represents the watershed; purple squares—arranged torrents [10].
Climate 11 00167 g002
Figure 3. Comparison of the mean annual precipitation at the meteorological station Donji Macelj and the discharge at Bednja: GS Lepoglava and GS Željeznica.
Climate 11 00167 g003
Figure 4. Snow duration on meteorological stations D. Macelj, Klenovnik, and Križovljan.
Climate 11 00167 g004
Figure 5. Dominant land cover classes of the Trakošćan Lake drainage area by CORINE LC data—1990 and 2018.
Climate 11 00167 g005
Figure 6. Percentage of LC changes.
Climate 11 00167 g006
Figure 7. Comparison of the calculated yearly sediment production (t/year) from the Trakošćan Lake catchment and yearly sediment transport measured at hydrological station Bednja, Željeznica.
Climate 11 00167 g007
Figure 8. The correlation between mean annual discharge [m3/s] and mean annual precipitation [mm] for HS Bednja, Željeznica, period 1961–2021.
Climate 11 00167 g008
Figure 9. The correlation between mean daily discharge [m3/s] and daily SST [t/day], HS Bednja, Željeznica, period 1987–2020.
Climate 11 00167 g009
Figure 10. (af) Intake of plant material in the lake and sediment samples from the lake bottom (images taken by D. Oskoruš, 30 March 2023).
Climate 11 00167 g010
Table 1. Meteorological and hydrological data available.
Data TypeData SourceNo. StationsTimestepSt. name/Elevation (m a.s.l.)Station Latitude/Longitude
Meteorological
precipitation [mm]
snow depth [cm]
DHMZ4dailyDonji Macelj (208 m), Bednja (240 m), Klenovnik (230 m) Križovljan (199 m) 46.200/15.833
46.233/15.983
46.267/16.067
46.383/16.117
Hydrological
discharge [m3/s]
suspended sediment concentration [g/m3]
suspended sediment transport [t/day]
DHMZ2dailyLepoglava (219 m), Željeznica (197 m)
46.207/16.034
46.220/16.200
Table 2. Meteorological and hydrological data statistics.
MeteorologicalData PeriodMeanStdMin25%50%75%Max
Bednja precip [mm/day]2006–20212.8967.4970001.180
Donji Macelj precip [mm/day]1962–20212.9167.4550001.1110.4
Klenovnik precip [mm/day]1962–20213.0197.7190001.2103.9
Križovljan grad precip [mm/day]1961–20212.5306.354000199.2
Hydrological
Željeznica discharge [m3/s]1961–20213.7706.1770.20.981.833.71123
Željeznica SSC [g/m3]1987–202128.66478.02404.949.6220.352503
Željeznica SST [t/day]1987–202124.006125.88700.4321.175.034848
Table 3. p-values of the homogeneity test for precipitation data.
StationOriginal SeriesModified Seriesp-ValueHomogeneity
Donji Macelj1962–20211987–20210.401Yes
Klenovnik1963–20211987–20210.763Yes
Križovljan grad1962–20211987–20210.719Yes
Table 4. p-values of the homogeneity test for snow cover data (number of snow days).
StationOriginal SeriesModified Seriesp-ValueHomogeneity
Donji Macelj1962–20211987–20212.18 × 10−5No
Klenovnik1963–20211987–20210.192Yes
Križovljan grad1962–20211987–20210.179Yes
Table 5. Values of parameters a and n in Fleming’s Equation (Equation (8)).
Vegetation Coverna
mixed deciduous and coniferous forests1.024.000
coniferous forests and tall grass0.8259.000
short grass and bushes0.65177.000
desert and bush0.72446.000
Table 6. Fluctuations in sediment density after 50 years of deposition in the reservoir.
Type of DepositConstantly ImmersedWITH AIR
ρs′ (kg/m3)ρs″ (kg/m3)
Clay640–960960–1280
Mud, silt880–12001200–1360
Sand1360–16001360–1600
Weakly granulated sand and gravel1520–20801520–2080
Table 7. Values of parameters a and n in Brune’s Equation (Equation (2)).
Curvean
Upper envelope1301.0
Mean curve1001.5
Lower envelope652.0
Table 8. Mann-Kendall trend analysis for the number of snow days observed at meteorological stations.
KrižovljanKlenovnikDonji Macelj_1962Donji Macelj_1988
trendDecreasing *no trendno trendno trend
hTRUE *FALSEFALSEFALSE
p0.0321207120.2361749830.1708548220.218182155
z−2.142905193−1.184601653−1.369462266−1.231376304
Tau−0.201257862−0.106370544−0.193846154−0.14973262
s−288−182−63−84
var_s17937.33333233462049.6666674543.333333
Sen_slope−0.333333333−0.230769231−0.545454545−0.421052632
intercept23.6666666743.1538461566.8181818234.94736842
* only station with a statistically significant trend.
Table 9. Mann-Kendall trend analysis for precipitation time series at chosen meteorological stations.
Donji Macelj KlenovnikKrižovljan
trendno trendno trendno trend
hFALSEFALSEFALSE
p0.3410432510.964388430.244551669
z−0.9521059520.0446473121.163685053
Tau−0.0841530050.0045197740.10273224
s−1548188
var_s25,823.3333324,581.3333325,823.33333
Sen_slope−1.0633838380.0305537242.006666667
intercept1101.2015151068.468111842
Table 10. Hydrological and meteorological parameters.
Catchment AreaLake VolumeAnnual PrecipitationRunoff Coefficient
A (km2)V0 (m3)P (mm)c (-)
10.74.00 × 1059830.38
Table 11. Parameters for sediment deposition calculations.
Sediment ProductionSediment DensityInflow of Effective PrecipitationSediment VolumeFree Volume of the LakeBrune’s Coefficients
G (kg/year)ρs′ (kg/m3)Q (m3/year)Vn (m3/year)Va′ (m3)an
8.65 × 1059004.00 × 1069.61 × 1025.00 × 1041001.5
Table 12. Calculation of the duration of sediment deposition of the reservoir.
SegmentAverage Segment VolumeXYFilling Time
Va (105 m3)Vi (105 m3)--t (years)
3.5–43.750.09380.859160.6
3–3.53.250.08130.840361.9
2.5–32.750.06880.815863.8
2–2.52.250.05630.782566.5
Total time:253
Table 13. Information on torrents of Lake Trakošćan and landfills behind barriers [10].
Torrent NameTorrent Catchment Area
[km2]
Torrent Length
[km′]
Conceptual Solution from 1989
[m3]
Projected Landfill Volume
[m3]
Čemernica with tributaries 1–66.222.76
1.22
48943155
600
Torrents of the southern part of Trakošćan Lake (1–9)1.2173.2523403800
Torrents of the northern part of Trakošćan Lake (10–13)3.5274.002766---
TOTAL10.96411.2310,0007415
Table 14. Results of sediment calculation via Fleming’s equation from project Arrangement of torrent Čemernica with tributaries, 1981 [10].
Sediment Production-FLEMING
[t/year]
Increase of 50%
[t/year]
Sediment Volume
[m3]
Specific Sediment Production–Basin Wide
[t/year/km2]
Specific Sediment Volume
[m3/year/km2]
775116264611161
Disclaimer/Publisher’s Note: The statements, opinions and data contained in all publications are solely those of the individual author(s) and contributor(s) and not of MDPI and/or the editor(s). MDPI and/or the editor(s) disclaim responsibility for any injury to people or property resulting from any ideas, methods, instructions or products referred to in the content.