Abstract
This study examines the representation of blocking events in the Southeast Pacific and Southwest Atlantic regions using a set of 13 global climate models from phase 6 of the Coupled Model Intercomparison Project (CMIP6). Historical runs were employed to analyze blocking conditions in the recent past climate, spanning from 1985 to 2014, with ERA5 data utilized to represent observed blocking events. The majority of CMIP6 models underestimate the total number of blocking events in the Southeast Pacific. The MPI–ESM1–2–HR and MPI–ESM1–2–LR models come closest to replicating the number of blocking events observed in ERA5, with underestimations of approximately −10% and −9%, respectively. Nonetheless, these models successfully capture the seasonality and overall duration of blocking events, as well as accurately represent the position of blocking heights over the Southeast Pacific. Conversely, CMIP6 models perform poorly in representing blocking climatology in the Southwest Atlantic. These models both overestimate and underestimate the total number of blocking events by more than 25% compared to ERA5. Furthermore, they struggle to reproduce the seasonal distribution of blockings and face challenges in accurately representing the duration of blocking events observed in ERA5.
1. Introduction
Atmospheric blocking is a persistent and quasi–stationary high–pressure system that disrupts the prevailing westerly flow, obstructing or diverting the usual path of synoptic disturbances in mid–high latitudes [1]. Episodes of atmospheric blocking over the Southeastern (SE) Pacific and Southwest (SW) Atlantic oceans significantly affect the weather over South America. These blocking events have been associated with heatwaves, droughts, and abnormally wet periods. For instance, an intense heatwave during September–October 2020 resulted in record–breaking daily maximum temperatures in several central South American locations. Ref. [2] discusses how this intense heatwave was caused by a persistent atmospheric blocking situated in the region. These blocking conditions also exacerbated drought conditions in the Pantanal wetland and other central South American regions [3].
The higher–than–average occurrence of blocking conditions also contributed to concurrent drought and heatwave conditions, leading to a water crisis in southeastern Brazil during the austral summer seasons of 2013/14 and 2014/15 [4]. Furthermore, blocking events over subtropical South America during summer can reduce precipitation by preventing the establishment of the South Atlantic Convergence Zone (SACZ) [5].
It is known that blocking events are more frequent in the SE Pacific than in the SW Atlantic [6,7,8] and are most common during the austral winter. Additionally, compared to the Northern Hemisphere, blockings in the Southern Hemisphere have shorter duration, occur less frequently, and are situated at lower latitudes [9,10,11].
Given the significant impacts that atmospheric blockings can have on regional climate, it is important to investigate their simulation in general circulation models (GCMs) and document any inherent biases within these models. However, simulating atmospheric blocking has proven challenging, as many GCMs underestimate the frequency of events in key regions [12,13,14]. Problems in representing blocking in GCMs mainly arise from an incorrect representation of the mean state. Model parameters such as horizontal and vertical resolution and parameterization schemes can also affect blocking simulations. Additionally, an incorrect representation of the jet stream and storm tracks can negatively impact blocking simulations [7,14].
Few studies have examined the representation of Southern Hemisphere blockings on GCMs, especially for the SE Pacific and SW Atlantic regions. Ref. [15] found that the blocking frequency is overestimated by 70% in the southwest Pacific during July–August. Additionally, Ref. [16] identified differing biases in GCMs for the Australia–New Zealand Sector, with models underestimating blocking frequency during summer. Therefore, in this study, we investigate blocking representation in a set of 13 GCMs from the Coupled Model Intercomparison Project Phase 6 (CMIP6) in the SE Pacific and SW Atlantic regions. These areas are the primary focus of investigation due to their proximity to the South American continent.
2. Materials and Methods
2.1. Data
For this study, daily means of geopotential height at 500 hPa (Z500) from 13 CMIP6 models are used; Table 1 provides a full list of the examined models. For all the models, we use the r1i1p1f1 member. Historical runs are employed to analyze blocking conditions in the recent past climate, considering the 1985–2014 period, and Z500 data from the fifth generation of the European Centre for Medium–Range Weather Forecasts (ECMWF [17]) atmospheric reanalysis (ERA5) is used to represent the observed state of the atmosphere.

Table 1.
CMIP6 GCMs used in this study. The columns contain, from left to right, the name of the GCM, the name of the research centre developer of the GCM, and the resolution of the Z500 output. All data were downloaded from the ESGF (Earth System Grid Federation) portal, accessible at https://esgf.github.io/nodes.html (accessed on November 2023).
All datasets are regridded onto a common grid of before performing blocking calculations. The domain used covers the Southeastern Pacific Ocean with boundaries from S to S and W to W and the Southern Atlantic Ocean, with boundaries from S to S and W to W, as shown in Figure 1. In order to evaluate the spatial characteristics of blocking among ERA5 and CMIP6 models during the historical period of 1985–2014, the Z500 anomalies are computed. These anomalies are calculated by subtracting the mean state from the daily values of Z500 during the blocking events. The mean state is defined by the daily climatology of Z500 over the 30 year period from 1985 to 2014.
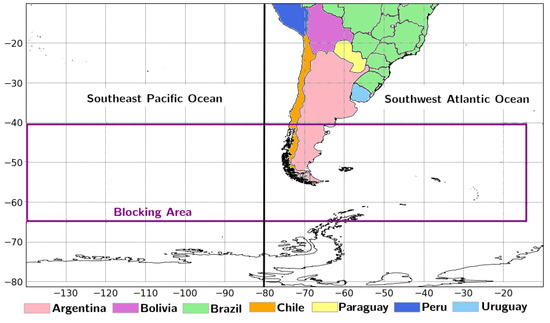
Figure 1.
Area of study subdivided into the sector of the Southeast Pacific Ocean and the sector of the Southwest Atlantic Ocean. The countries are indicated by colors.
2.2. Blocking Index
Blocking events are detected using the methodology proposed by [8], which is based on the Tibaldi index [10]. Following [8], the identification of blocking involves the analysis of two meridional gradients of Z500, denoted as Geopotential Height Gradient South (GHGS) and Geopotential Height Gradient North (GHGN). These meridional gradients are calculated according to the following Equations (1) and (2):
where
- ;
- ;
- ;
- ;
- .
The variable denotes the Z500 at longitude and latitude , where represents one latitudinal interval. Subsequently, employing the method established by Tibaldi et al. (1994), a particular longitude is characterized as “blocked” if, for at least one value of , the following conditions are met: (a) GHGN > 0 and (b) GHGS 10 m.
A sector is considered blocked on a certain day if at least 3 adjacent longitudes within the study area are blocked [8]. To satisfy the synoptic definition of a block [1] and thus to define a blocking event, a minimum time persistence of 5 consecutive days is applied.
3. Results
3.1. Frequency of the Blocking Events
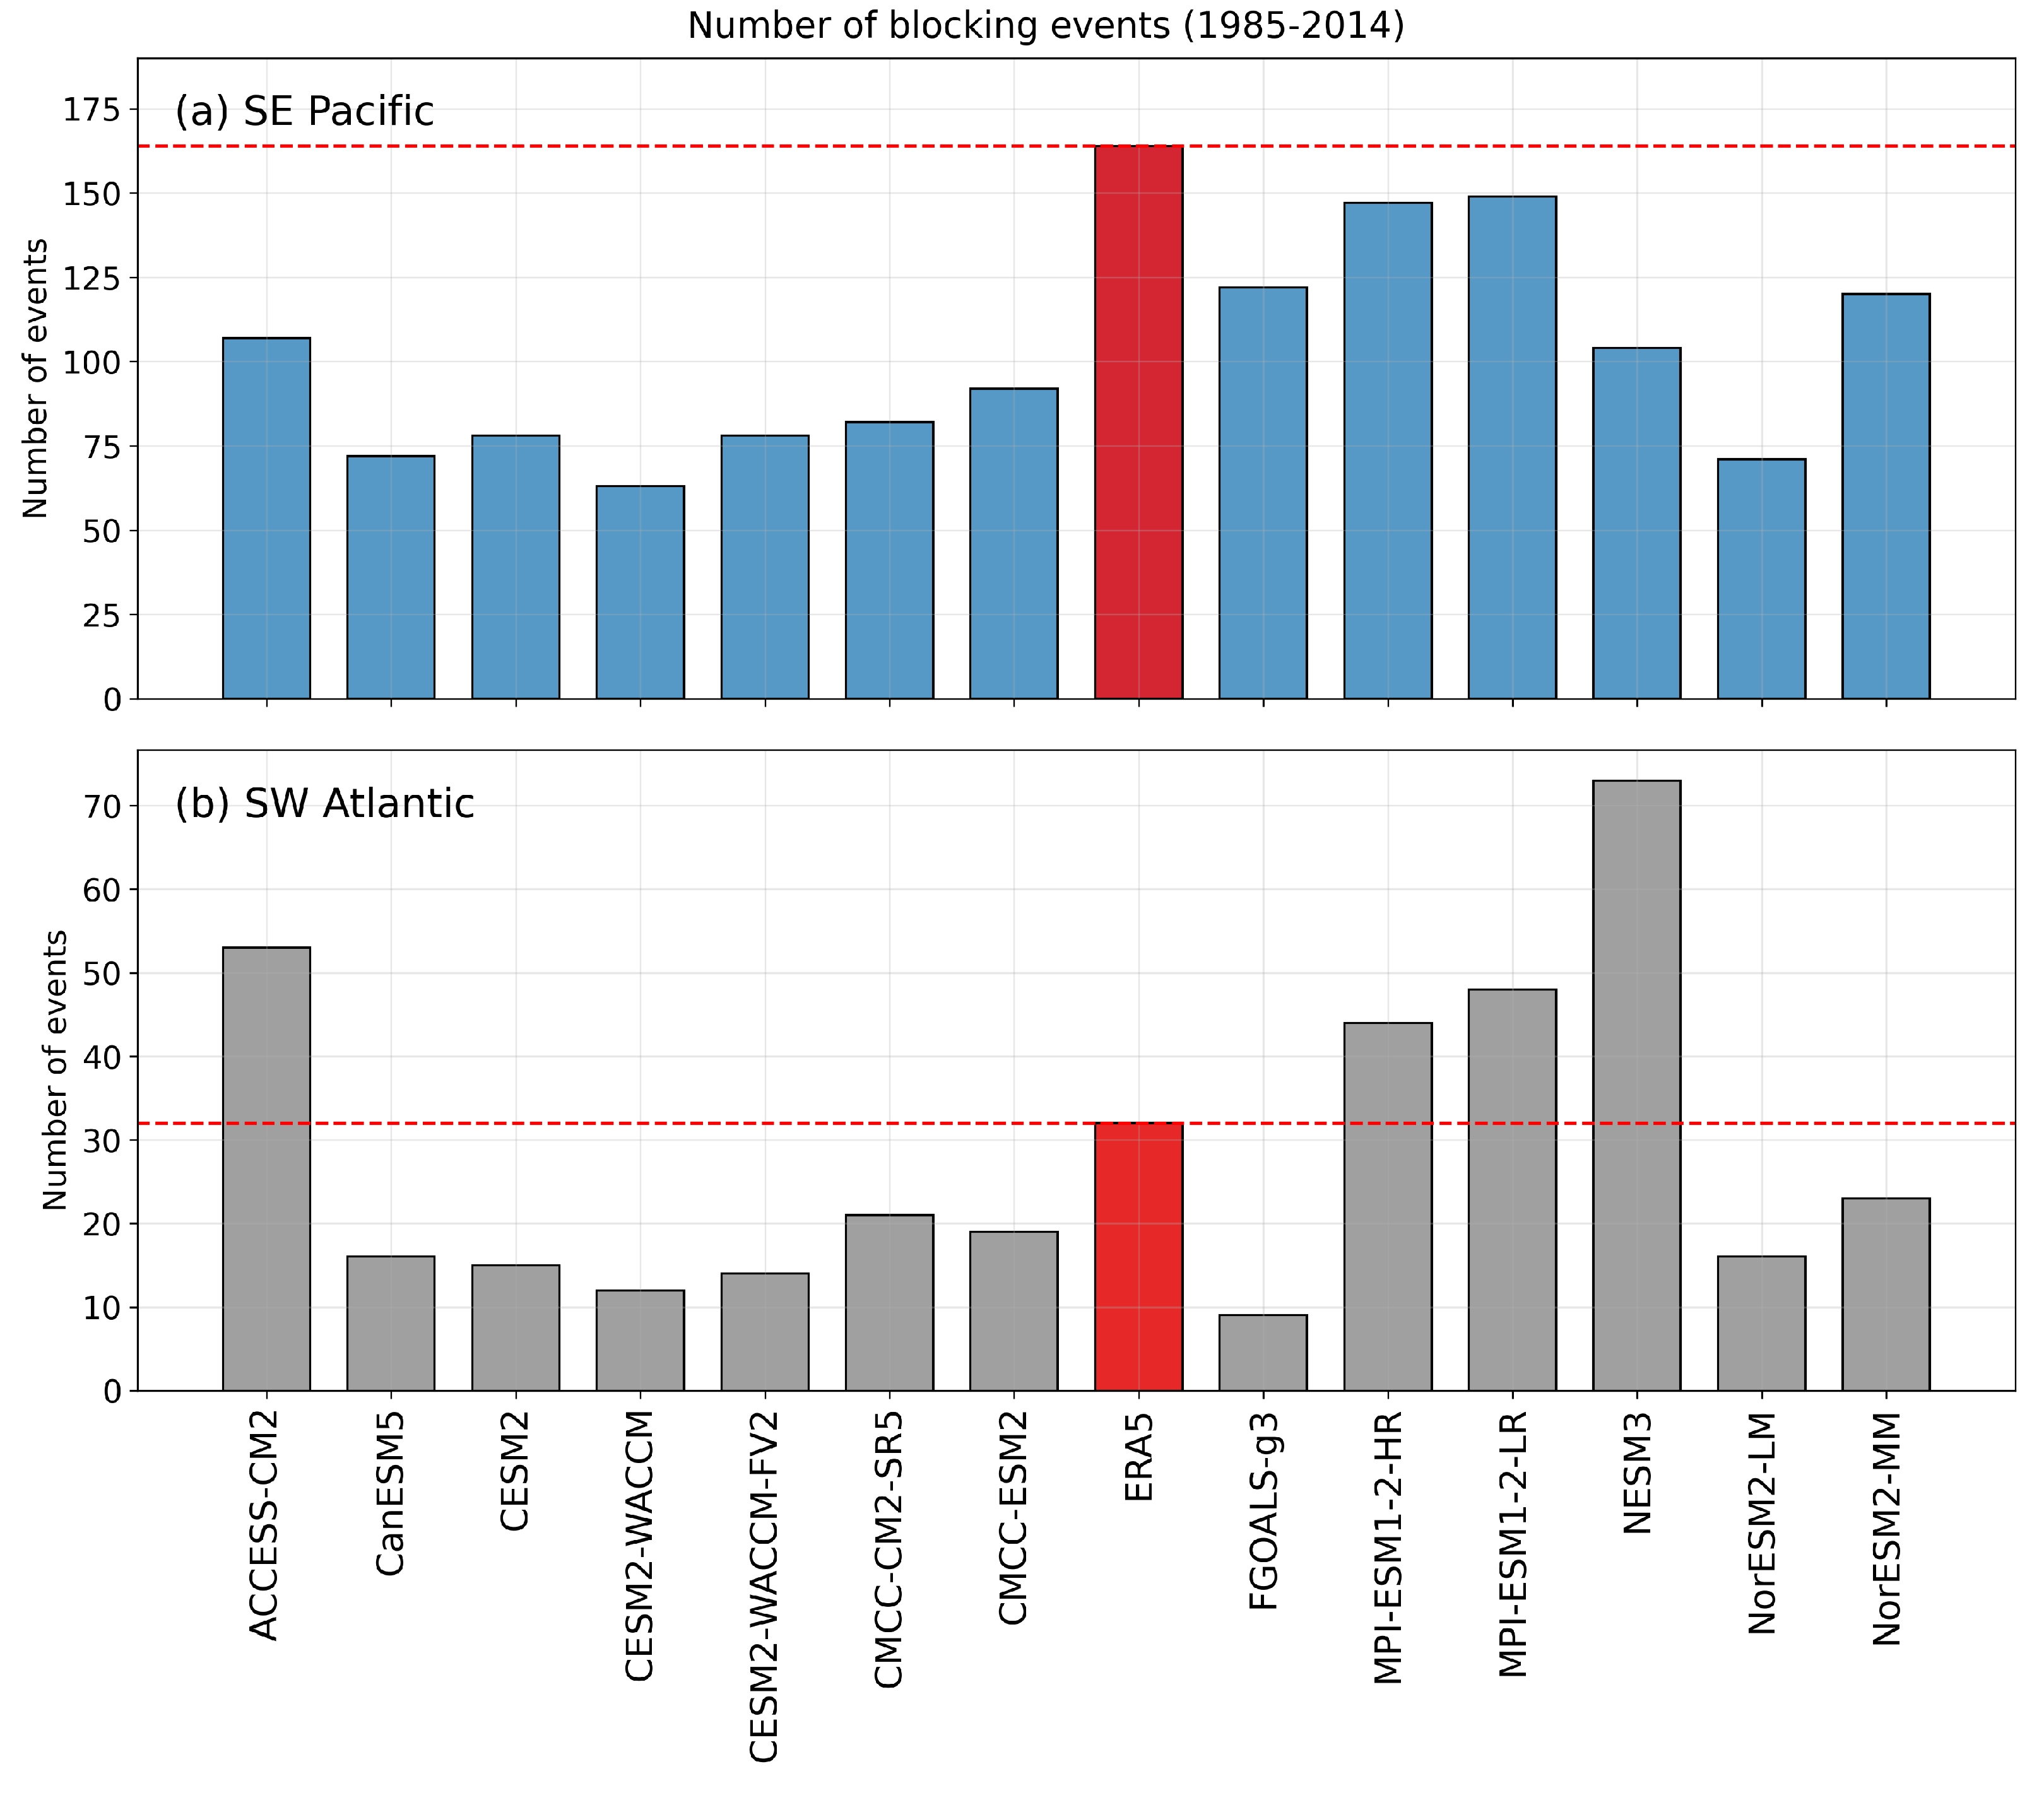
In the initial phase of the analysis, the ability of each CMIP6 model to reproduce the total number of atmospheric blocking events during the historical period (1985–2014) in both the SE Pacific and SW Atlantic regions was assessed. As seen in Figure 2, and by analyzing the results for ERA5, for the SW Atlantic sector, the number of blocking events is smaller than that for the SE Pacific. While in the SE Pacific, 164 blocking events were identified during the 1985–2014 period (an average of 5.4 blocks per year), only 32 events were observed in the SW Atlantic (an average of one block per year).
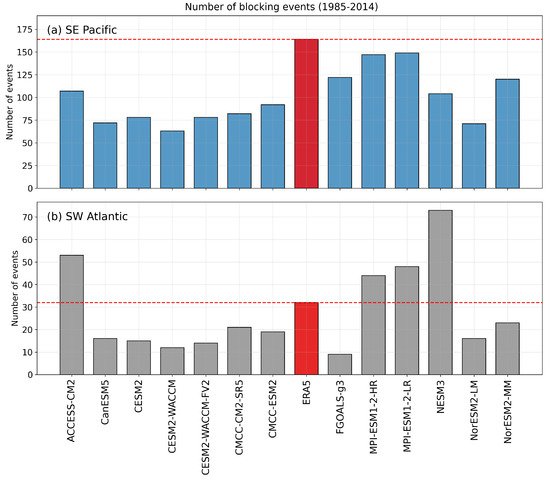
Figure 2.
Number of atmospheric blocking events identified from 1985 to 2014 for each CMIP6 model and ERA5 reanalysis, highlighted by the red bar and line.
This result is consistent with studies by [6,8,18,19,20], indicating that atmospheric blocking episodes over the South Atlantic Ocean are less frequent than over the Pacific Ocean. However, the number of blocking events over the SW Atlantic is smaller than the one recently found by [8]. They found an average of around 3.6 blocks per year over the SW Atlantic sector and 4.3 blocks per year over the SE Pacific region. Although we based our detection algorithm on the one used by [8], which relies on the Tibaldi index [10], this difference may arise from small variations in the adaptation of the blocking detection algorithm. Additionally, we used ERA5 reanalysis data for the 30 year period from 1985 to 2014, while Ref. [8] utilized ERA-Interim data spanning 37 years from 1979 to 2015. On the other hand, the results regarding the total number of blocking events are more consistent with the blocking climatology presented by [6]. They used the same blocking method as [8] and reported a total of 120 blocking events over the SE Pacific (around 3 blocks per year) and 63 (around 1.5 blocks per year) over the SW Atlantic for the 1960–2000 period based on the National Centers for Environmental Prediction and the National Center for Atmospheric Research (NCEP–NCAR) reanalysis [21]. Additionally, Ref. [19] applied an adapted version of the index developed by [10] to Climate Forecast System Reanalysis (CFSR [22]) data from 1979 to 2010 and found 164 blocking events over the SE Pacific (around 4 blocks per year) and 19 over the SW Atlantic (around 0.5 blocks per year).
As illustrated in Figure 2a, most of the GCMs analyzed significantly underestimate the total number of blocking events in the SE Pacific. However, both the MPI–ESM1–2–HR and MPI–ESM1–2–LR models were able to closely reproduce the number of blocking events observed in ERA5, with underestimations of around −10% and −9%, respectively. FGOALS–g3 underestimated the observed blocking by −25.6%, followed by NorESM2–MM with −26.8%, ACCESS–CM2 with −34.7%, and NESM3 with −36.6%. The total number of blocking events was underestimated by more than 50% in CanESM5, CESM2, CESM–WACCM–FV2, NorESM2–LM, CMCC–CM2–SR5, and CESM–WACCM. Among these, CESM–WACCM exhibited the highest underestimation, with 61.6% fewer blocking events compared to ERA5. On the other hand, Ref. [15] found an overestimation of up to 70% in blocking frequency over the SW Pacific region during the austral winter when analyzing a set of five CMIP6 models.
For the SW Atlantic, the performance of the CMIP6 models is more varied than for the SE Pacific, and the models seem to have more difficulty in capturing the observed blocking events. MPI–ESM1–2–HR overestimated the number of blocking events by +37%, and MPI–ESM1–2–LR by +50%, while ACCES–CM2 had two and NESM3 three times more blocking events than ERA5. On the other hand, all remaining GCMs underestimated the number of blockings, with NorESM2–MM having −28% fewer events and being the closest to ERA5, followed by CMCC–CM2–SR5 with −34%, CMCC–ESM2 with −41%, and other models with less than half of the number of observed blockings.
It is interesting to mention that none of the CMIP6 models analyzed successfully represented the total number of observed blocking events in both the SE Pacific and SW Altantic. The most reasonable performance was seen in MPI–ESM1–2–HR, with an underestimation of −10% over the SE Pacific and an overestimation of +37% over the SW Atlantic. In second place was NorESM2–MM, with a smaller number of events by −26.8% over the SE Pacific and −34% over the SW Atlantic.
Studies analyzing simulations of blockings in the Northern Hemisphere in GCMs have shown that, despite the improvements in CMIP6, many models underestimate the frequency of events [12,13,14]. For the Southern Hemisphere, Ref. [16] identified differing biases in GCMs for the Australia–New Zealand Sector, with models underestimating blocking frequency during summer.
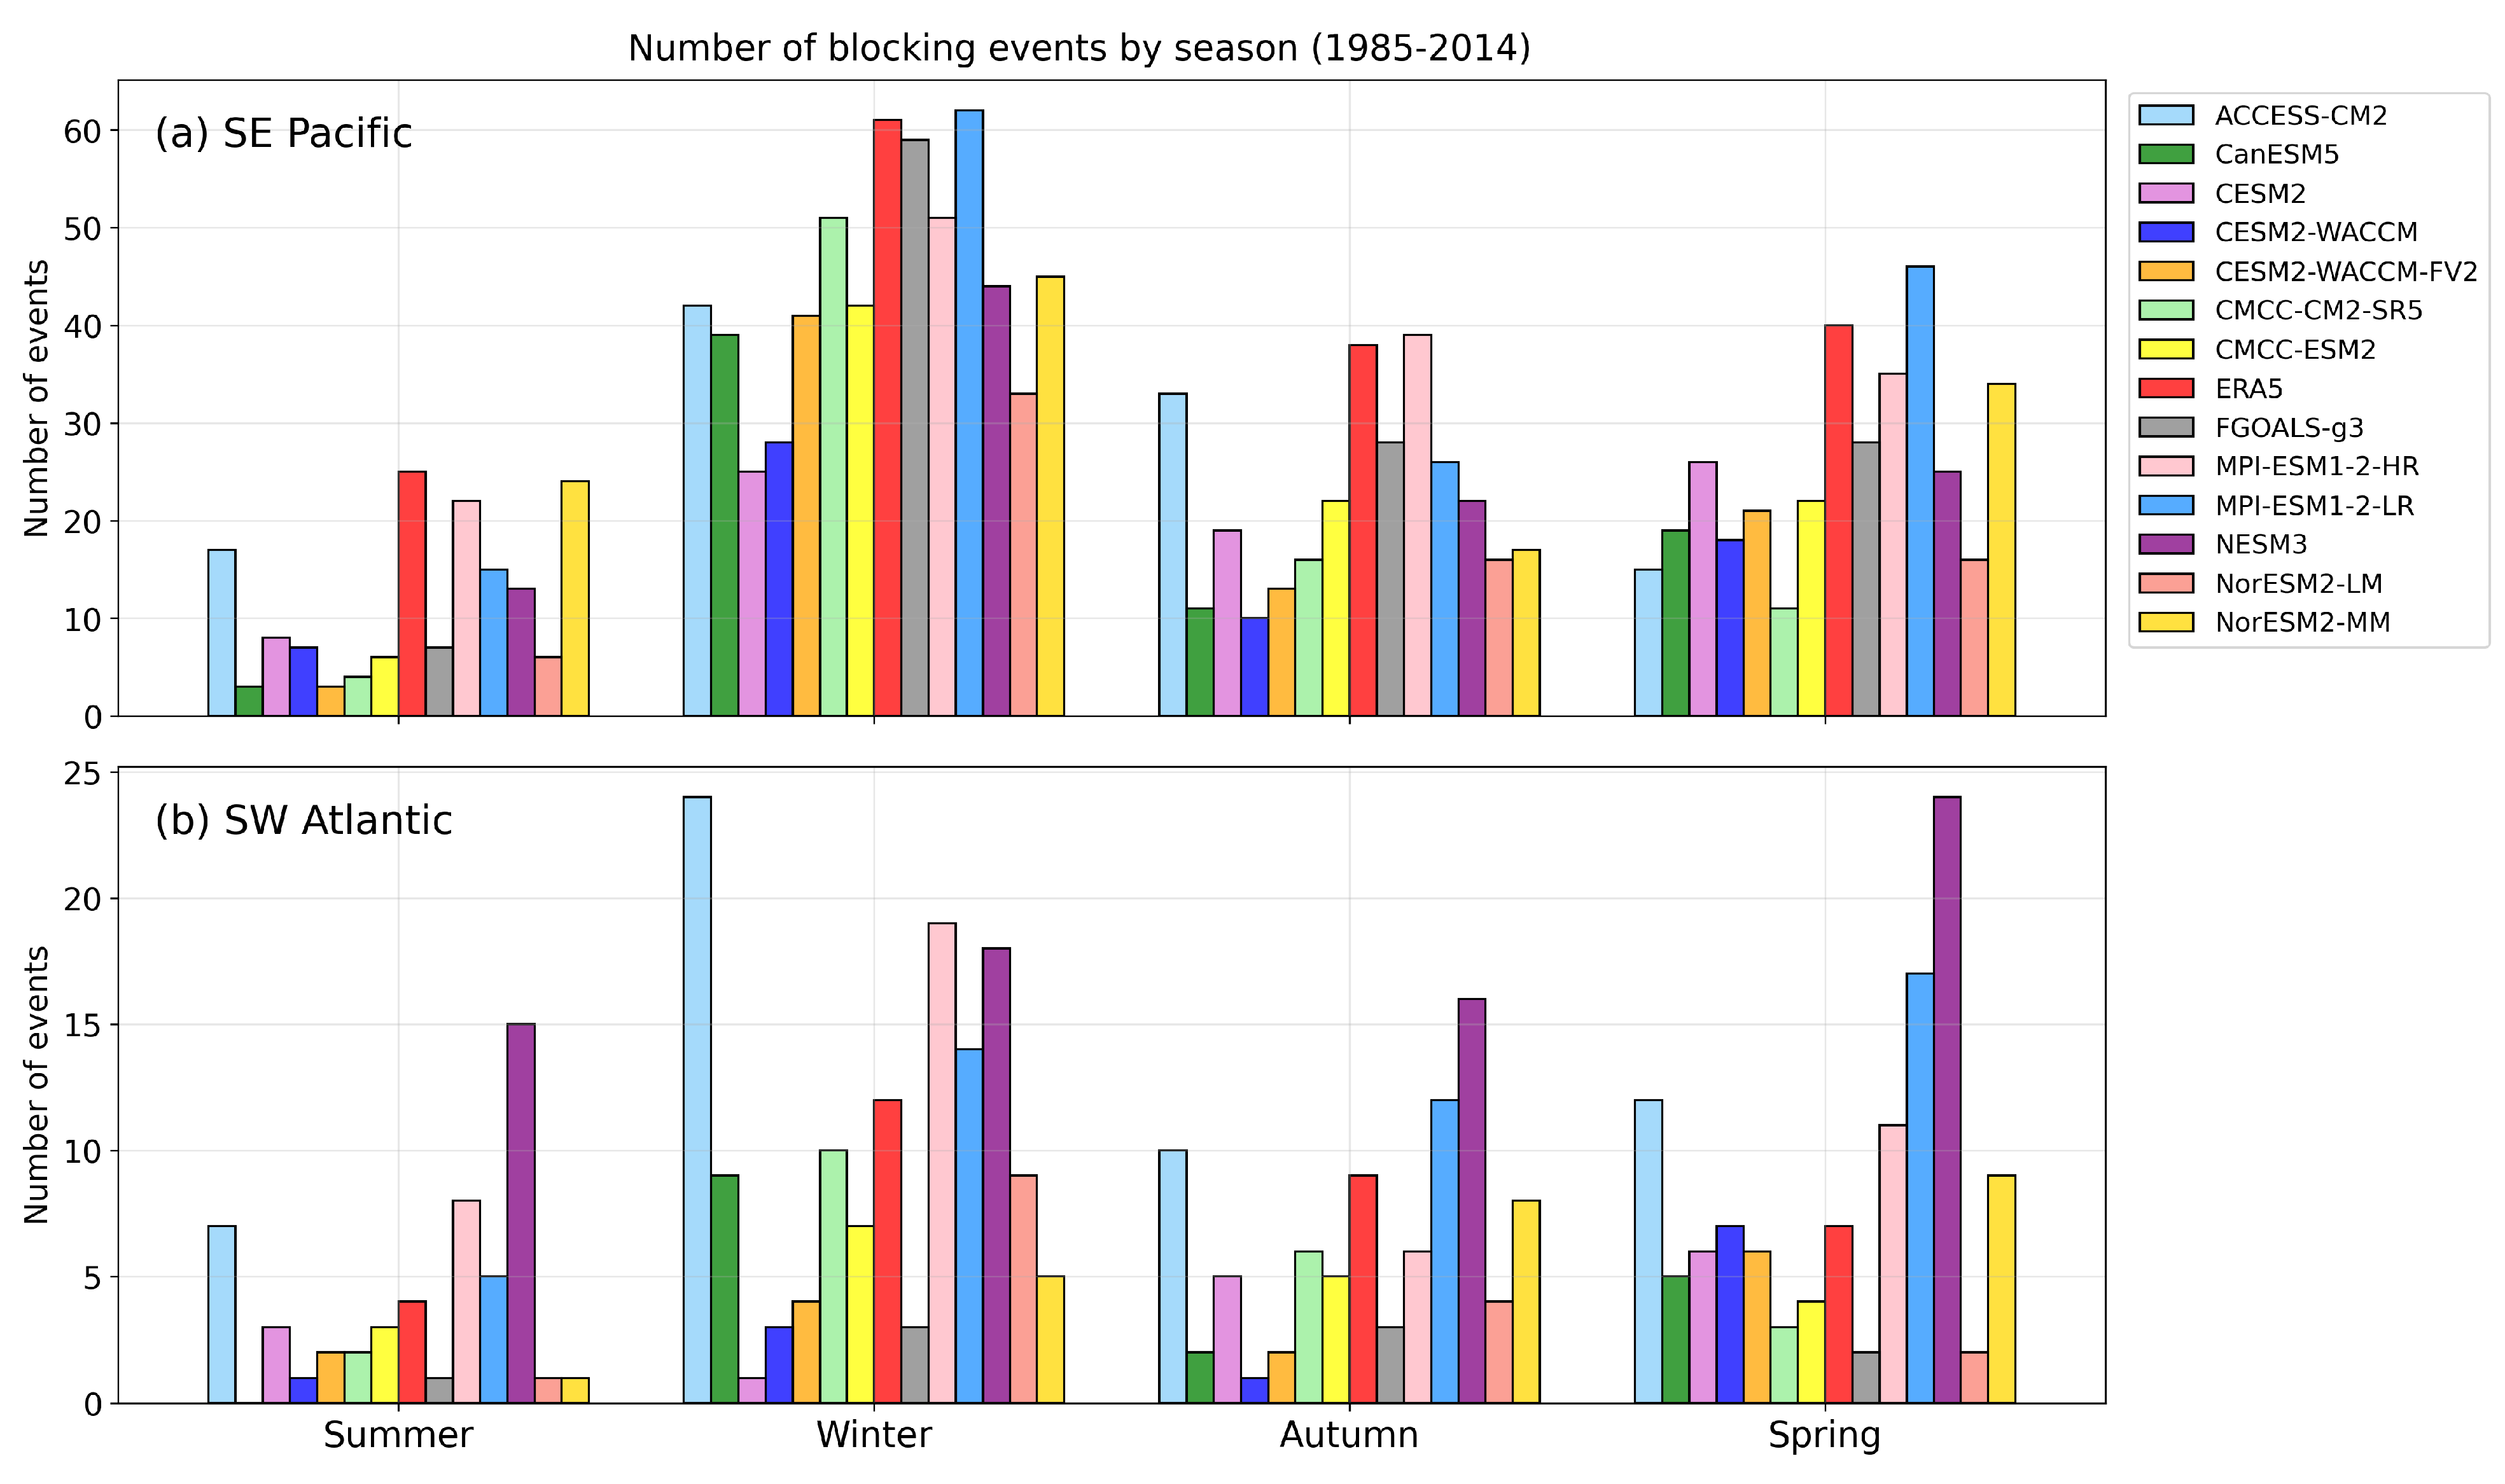
The seasonal distribution of the blocking events is depicted in Figure 3. For both the SE Pacific and SW Atlantic regions, ERA5 shows that these events are more frequent in winter and less common in summer, while autumn and spring show no significant difference between the number of events. This behavior is in agreement with previous studies addressing the blocking climatology in this region, as demonstrated in [8].
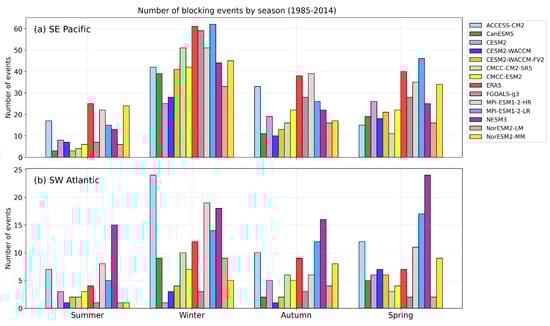
Figure 3.
Number of atmospheric blocking events by season from 1985 to 2014 for each CMIP6 model and ERA5 reanalysis. Seasons are defined as follows: summer (DJF), autumn (MAM), winter (JJA), and spring (SON).
When analyzing the SE Pacific (Figure 3a), it is observed that, overall, although the CMIP6 models underestimate the total number of blockings, they adequately capture the seasonal distribution of blocking events, with the highest number of events occurring in winter and the lowest in summer. Among the models that best represented the total number of blocking episodes, MPI–ESM1–2–LR performed well in winter, slightly overestimating events in spring and showing a subtle underestimation in summer and autumn. MPI–ESM1–2–HR effectively identified blockings in both summer and autumn, with a slight underestimation in winter and spring. FGOALS–g3 captured the events well during winter but showed fewer blockings than ERA5 in all other seasons. Meanwhile, NorESM2–MM was able to represent the summer blockings but underestimated them for all other seasons. All remaining CMIP6 models underestimated the number of events during all seasons.
For the SW Atlantic, the overestimation of the MPI–ESM1–2–HR model is more pronounced in winter, while for MPI–ESM1–2–LR, it is in spring. ACCES–CM2 and NESM3 show overestimation during all seasons. As for the remaining models, it can be seen that the underestimation of blockings occurs throughout all seasons except for NorESM2–MM, which has a slight overestimation in spring.
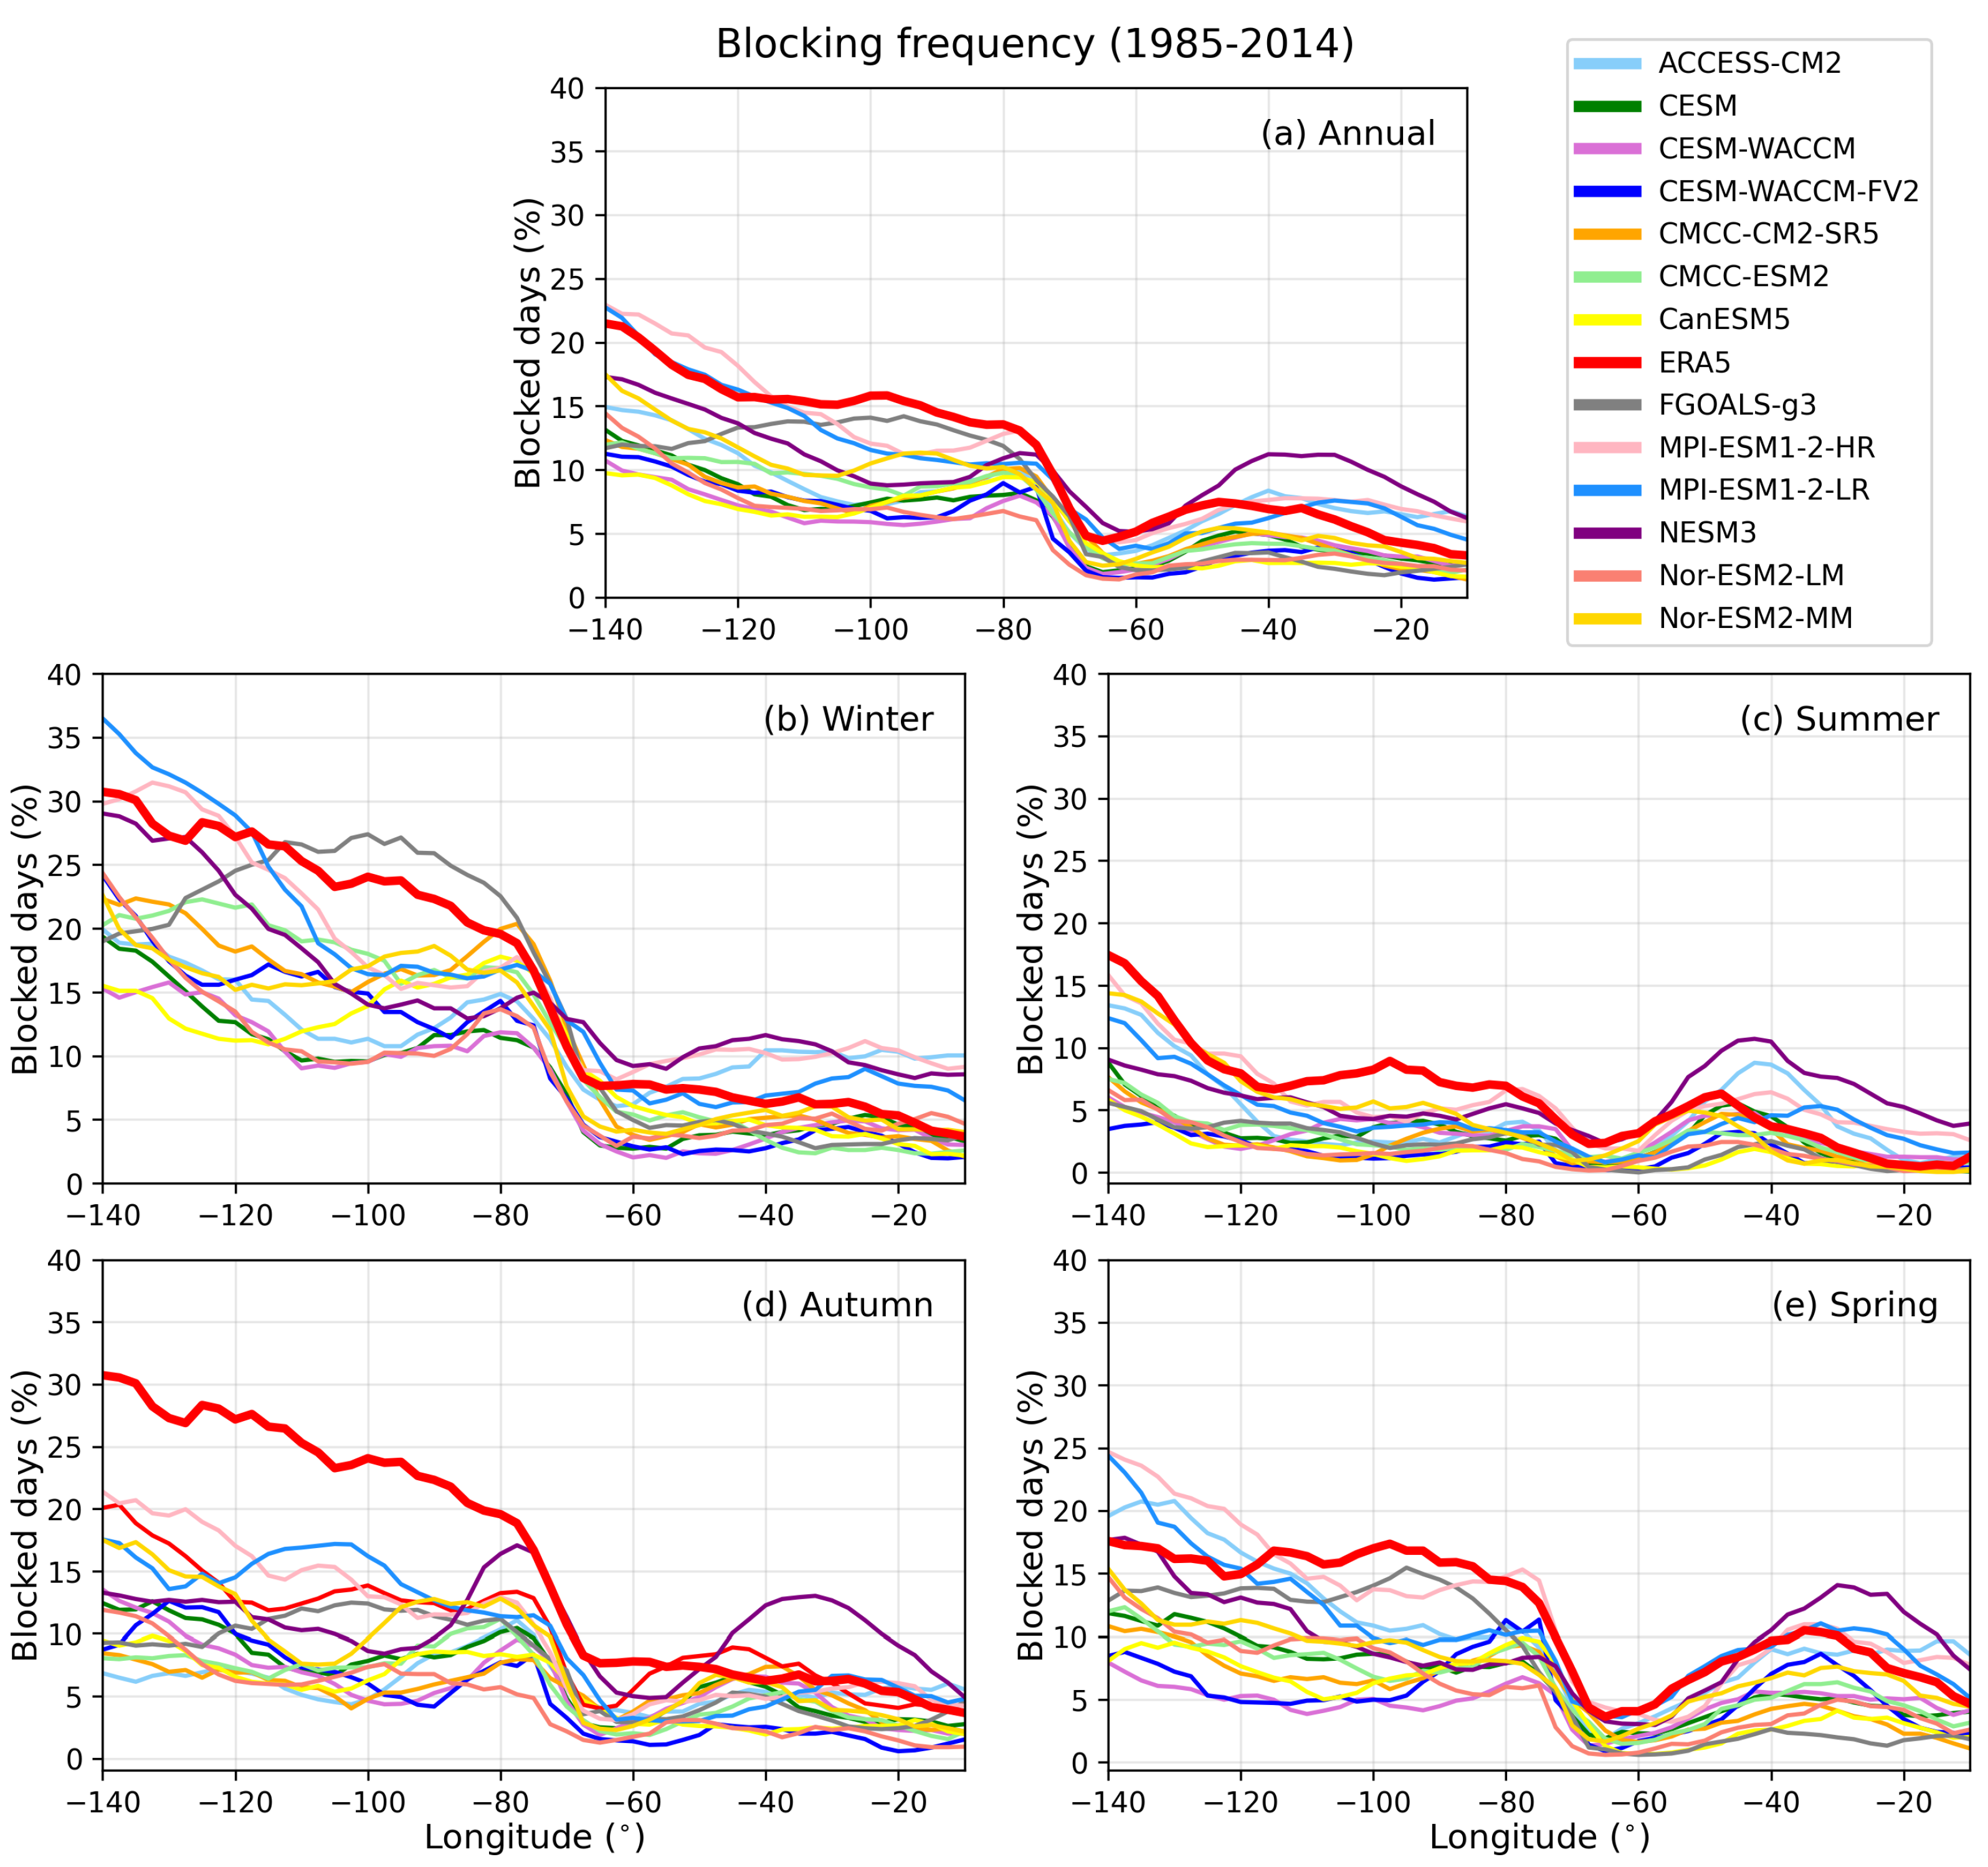
The instantaneous blocking frequency for each longitude (from W to W), given by the percentage of blocked days considering the 30 year period from 1985 to 2014, is shown in Figure 4a. Consistent with the climatological longitudinal position of blockings in the region [18,20,23], there is a maximum over the Pacific sector around longitudes 140– W, which is more pronounced during winter. A second maximum is observed over the Atlantic sector, around longitudes 50– W. Corroborating with the results observed in Figure 2 and Figure 3, overall, the CMIP6 models tend to underestimate the blocking frequency.
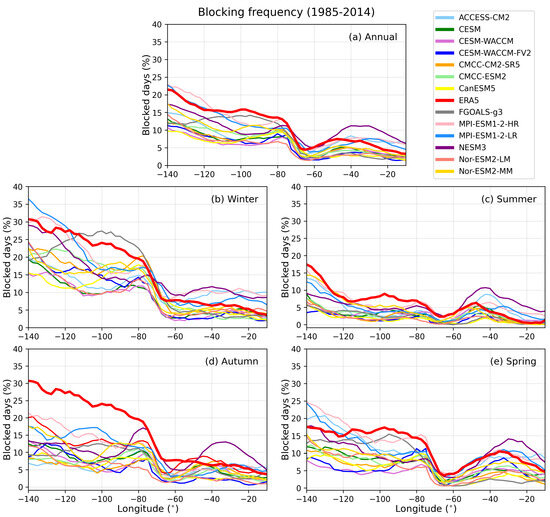
Figure 4.
Instantaneous blocking frequency (%) for the 13 GCMs from CMIP6 and ERA5 reanalysis (highlighted in bolder red color). (a) Instantaneous blocking frequency in each longitude grid point is given by the percentage of blocked days for all the 1985–2014 period and for austral winter (b), austral summer (c), austral autumn (d), and austral spring (e).
Both MPI–ESM1–2–HR and MPI–ESM1–2–LR models closely align with ERA5 behavior. However, NESM3 underestimates the blocking frequency over the SE Pacific region (longitudes W to W) and overestimates it over the SW Atlantic (longitudes S to S). ACCESS–CM2 also underestimates the frequency over the SE Pacific region. Interestingly, FGOALS–g3, despite underestimating the total number of blocking events by 34%, accurately captures the instantaneous blocking frequency over the sector spanning longitudes W and W while underestimating it over other regions, particularly over the SW Atlantic.
Figure 4b–e presents the instantaneous blocking frequency for each season. Again, it is evident that blocking situations are much more frequent over the SE Pacific Ocean than the SW Atlantic in all seasons. During winter (Figure 4b), when the blocking frequency is highest, the same behavior discussed in the previous paragraph when analyzing the entire 1985–2014 period can be observed (Figure 4a). In summer (Figure 4c), which has the lowest blocking frequency, all GCMs underestimate blocks over SE Pacific, while MPI–ESM1–2–HR, MPI–ESM1–2–LR, ACCESS–CM2, and especially NESM3 overestimate over SW Atlantic.
During autumn (Figure 4d), it is evident that all CMIP6 models underestimate the instantaneous blocking frequency over the SE Pacific Ocean. Over the SW Atlantic Ocean, the models still underestimate it, but they follow ERA5 more closely, except for NESM3, which again exhibits a higher frequency than observed. The overall underestimation of blocking frequency by the GCMs is also observed during spring (Figure 4e), with MPI–ESM1–2–HR and, to a lesser extent, MPI–ESM1–2–LR and ACCESS–CM2 closely following ERA5. Similar to winter, FGOALS–g3 captures the observed frequency over the SE Pacific but significantly underestimates it over the SW Atlantic.
3.2. Duration of the Blocking Events
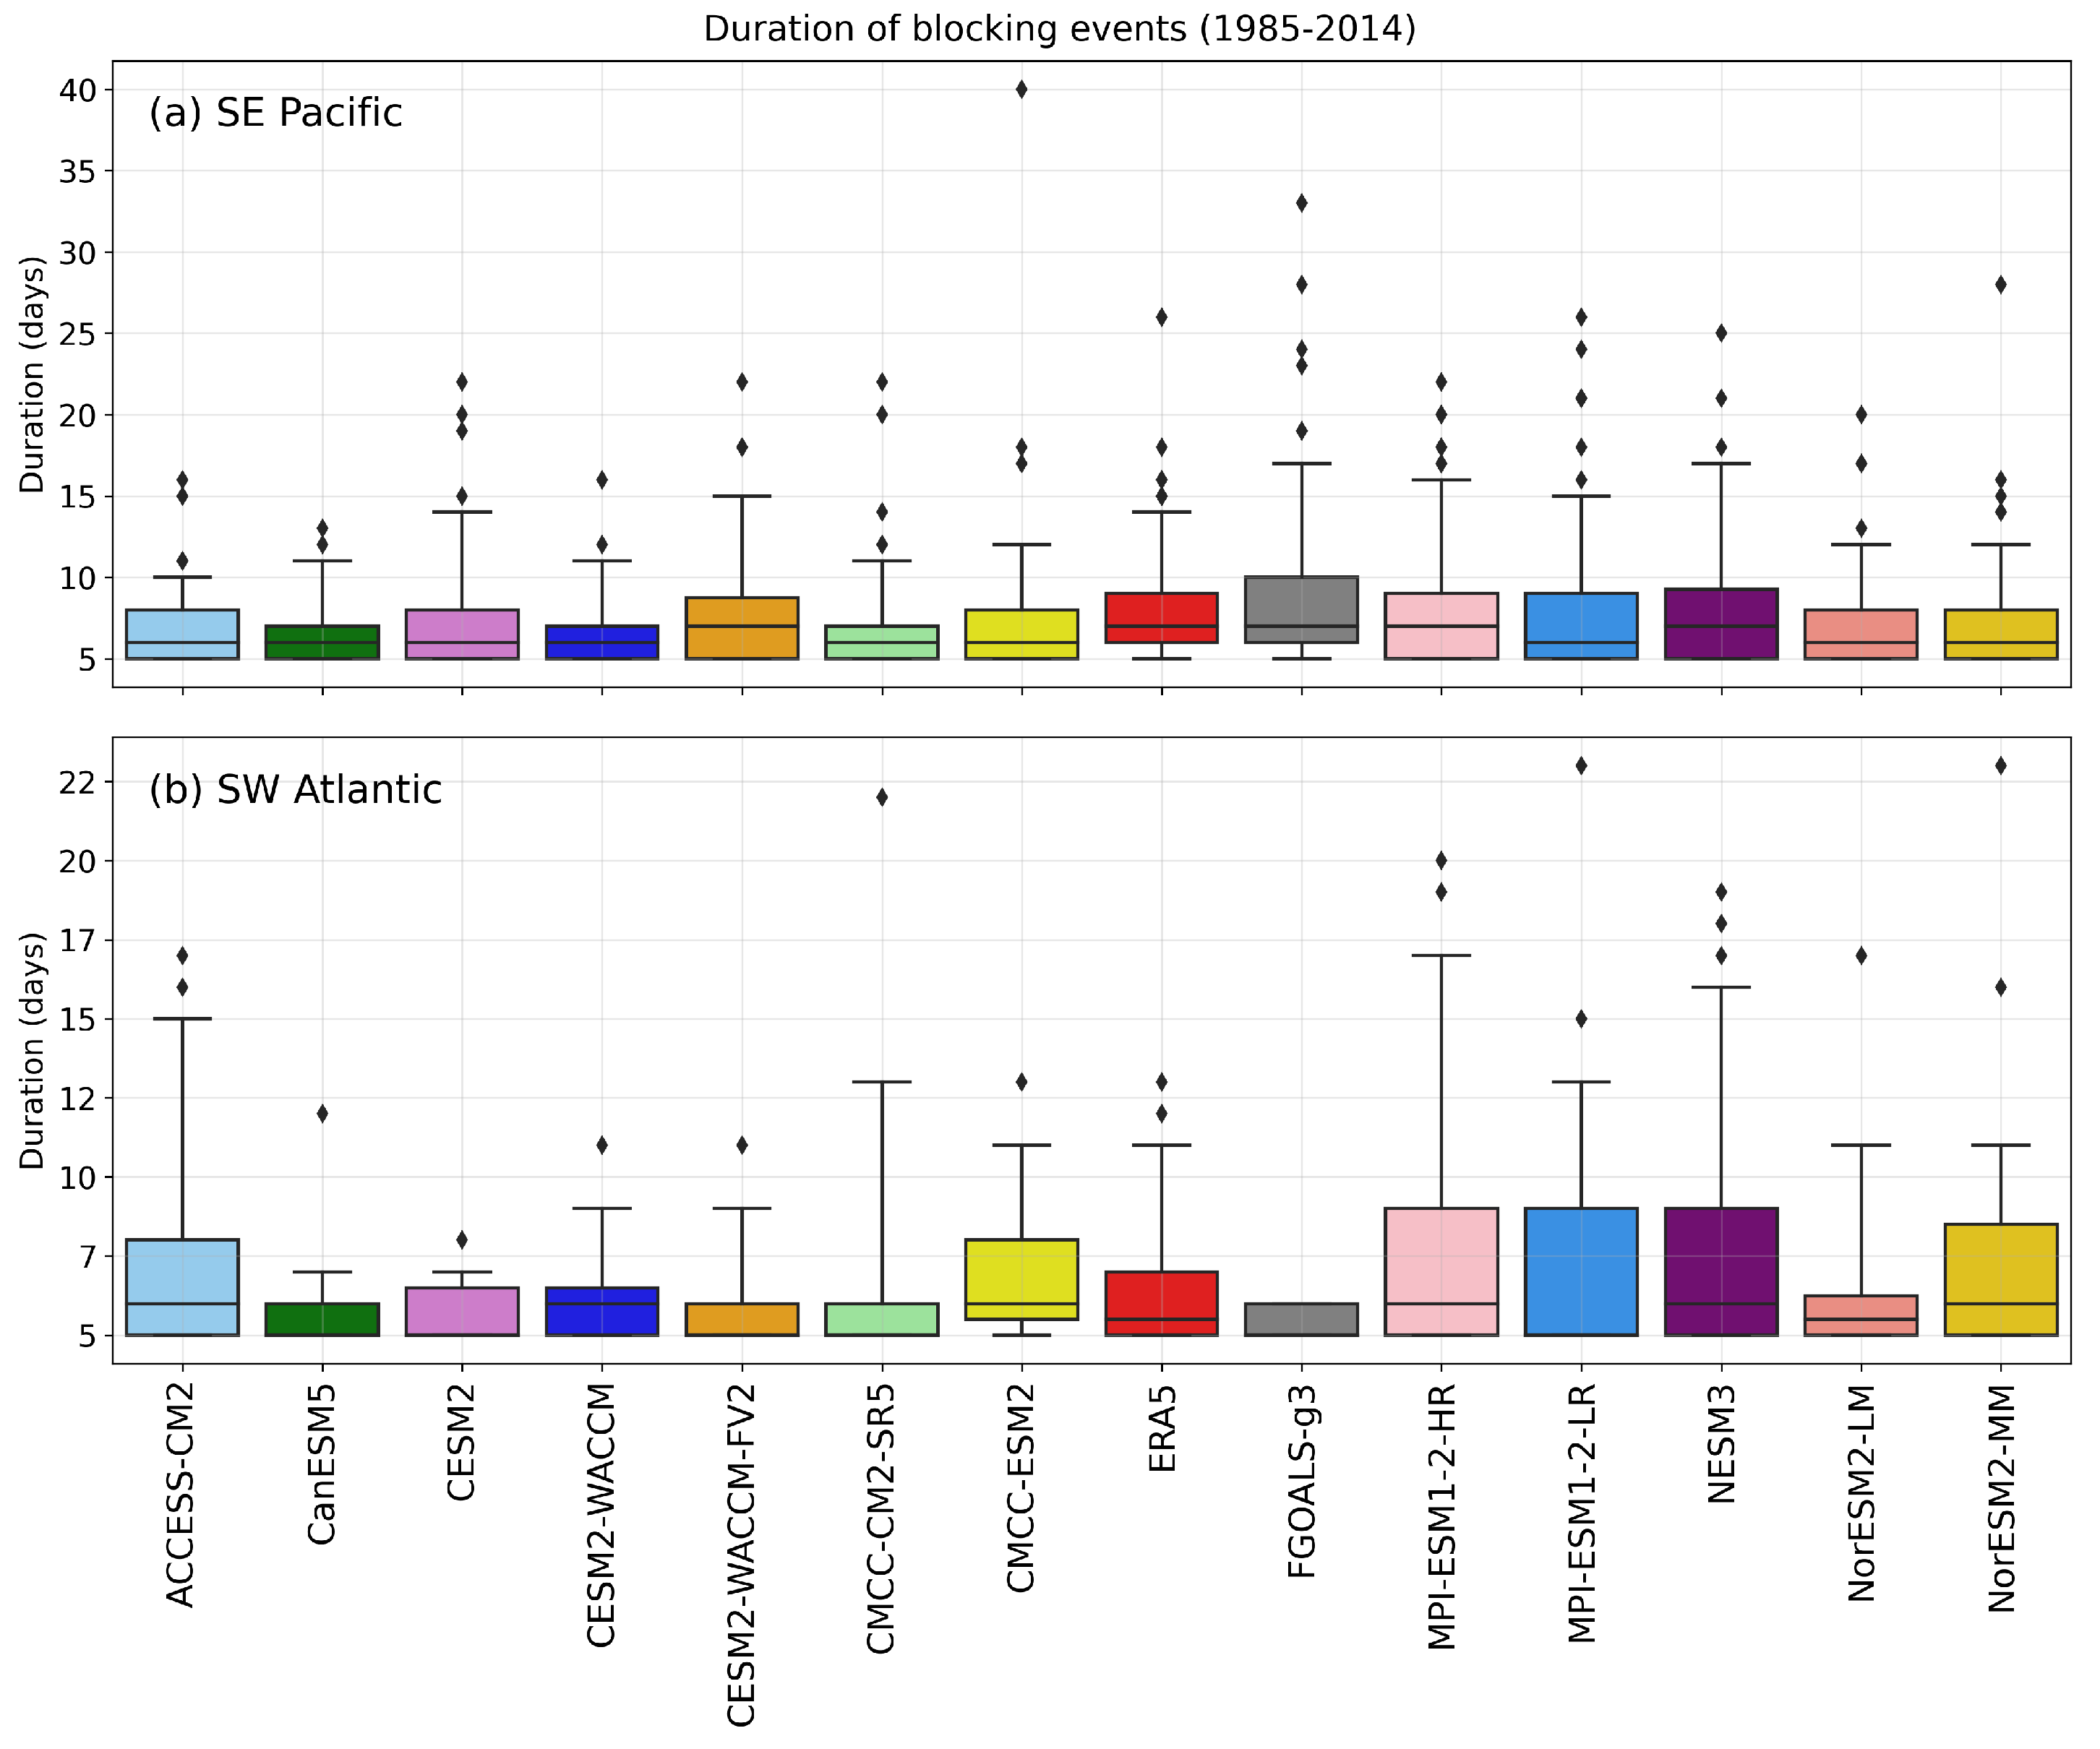
Figure 5 illustrates the overall duration of blocking episodes during the historical period for each CMIP6 GCM and ERA5. In the SE Pacific (Figure 5a), ERA5 reveals that the majority of blocking events have durations between 5 and 10 days, with events lasting more than 15 days being very rare. The longest–lasting blocking event observed persisted for 26 days. This duration pattern aligns with the blocking climatology of the region [6,8]. The GCMs align with ERA, wherein events exceeding 15–20 days are rare. Only FGOALS–g3 and CMCC–ESM2 exhibit outliers persisting for over 30 days.
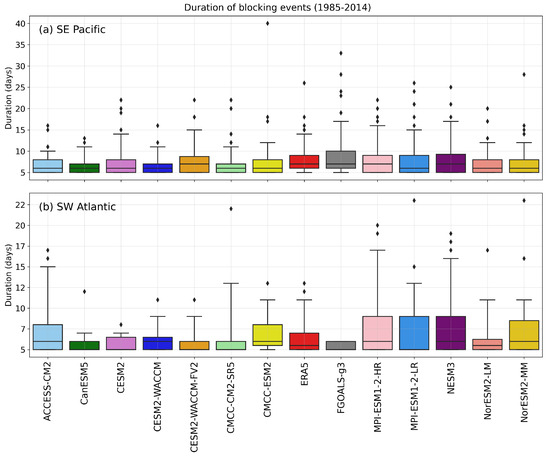
Figure 5.
Duration of atmospheric blocking events identified from 1985 to 2014 for each CMIP6 model and ERA5.
In the SW Atlantic (Figure 5b), blocking events have shorter durations compared to the SE Pacific. ERA5 data shows that the majority of blocking events in this region last from 5 to 7 days, with episodes lasting more than 7–10 days being very rare, and the longest event persisted for 13 days. The CMIP6 models struggle to represent the duration pattern observed in ERA5 accurately. Four models that overestimated the total number of blockings (MPI–ESM1–2–HR, MPI–ESM1–2–LR, NESM3, and ACCESS–CM2), as well as two that underestimated, (Nor–ESM2–MM and CMCC–ESM2), also overestimate the 75th and 95th percentiles of blocking persistence. On the other hand, blocking episodes identified by all the other GCMs have smaller durations, as indicated by the lower values for the 75th and 95th percentiles compared to ERA5.
3.3. Spatial Patterns of the Blocking Events
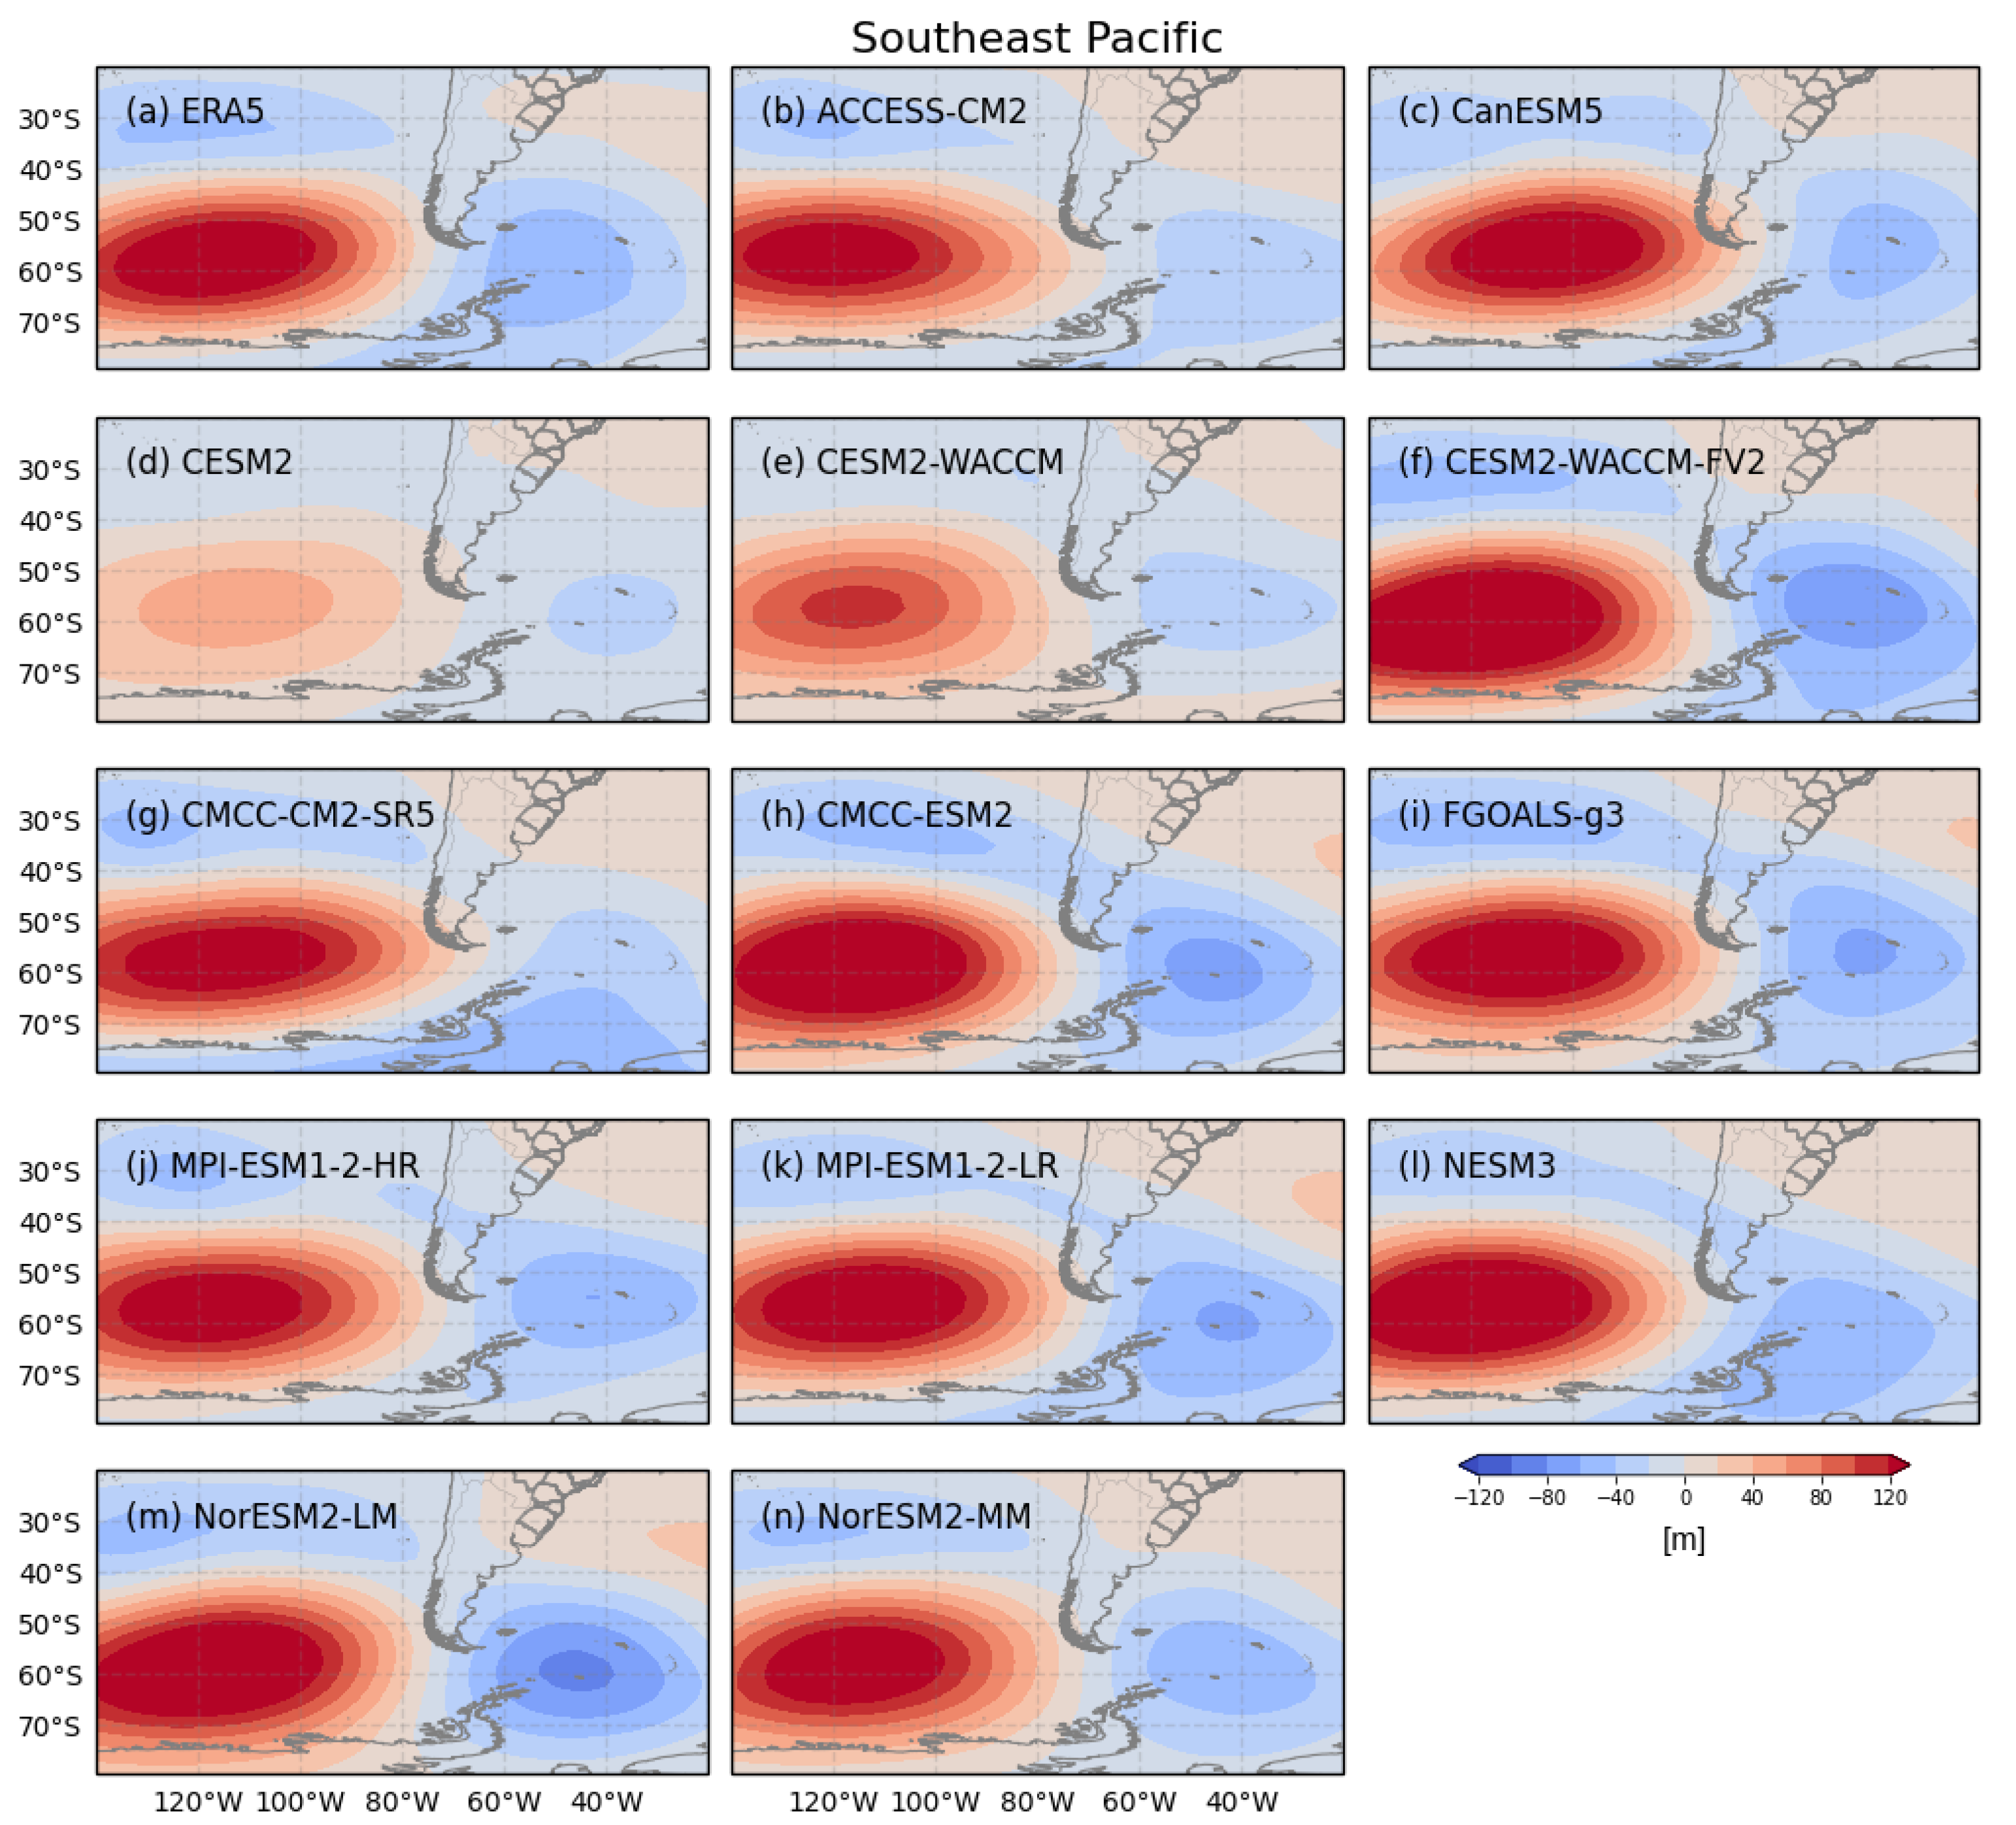
The spatial patterns of SE Pacific blocking events during the 1985–2014 period are presented in Figure 6. Looking at ERA5 (Figure 6a), an area of positive Z500 anomaly (blocking high) is observed in the Southeast Pacific, centered around latitude S and longitude W. Similar to ERA5, all CMIP6 models also center the blocking system over the SE Pacific Ocean, near latitude S and between longitudes W and W. A region with weak positive Z500 anomalies is observed east of the blocking system.
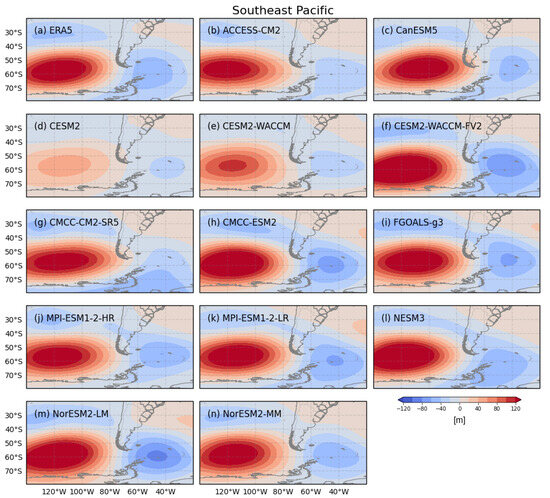
Figure 6.
Z500 anomalies for atmospheric blocking events in the Southeast Pacific sector from 1985 to 2014 for each CMIP6 model and ERA5.
The majority of the CMIP6 models closely resemble ERA5 blocking patterns, accurately reproducing the center position, overall area, and Z500 anomalies of the blocking. CanESM5 (Figure 6c) also reproduced the observed pattern well, but with the blocking slightly displaced to the east. Meanwhile, CESM2 (Figure 6d) and, to a lesser extent, CESM–WACCM (Figure 6e) have smaller Z500 anomaly values compared to the observations.
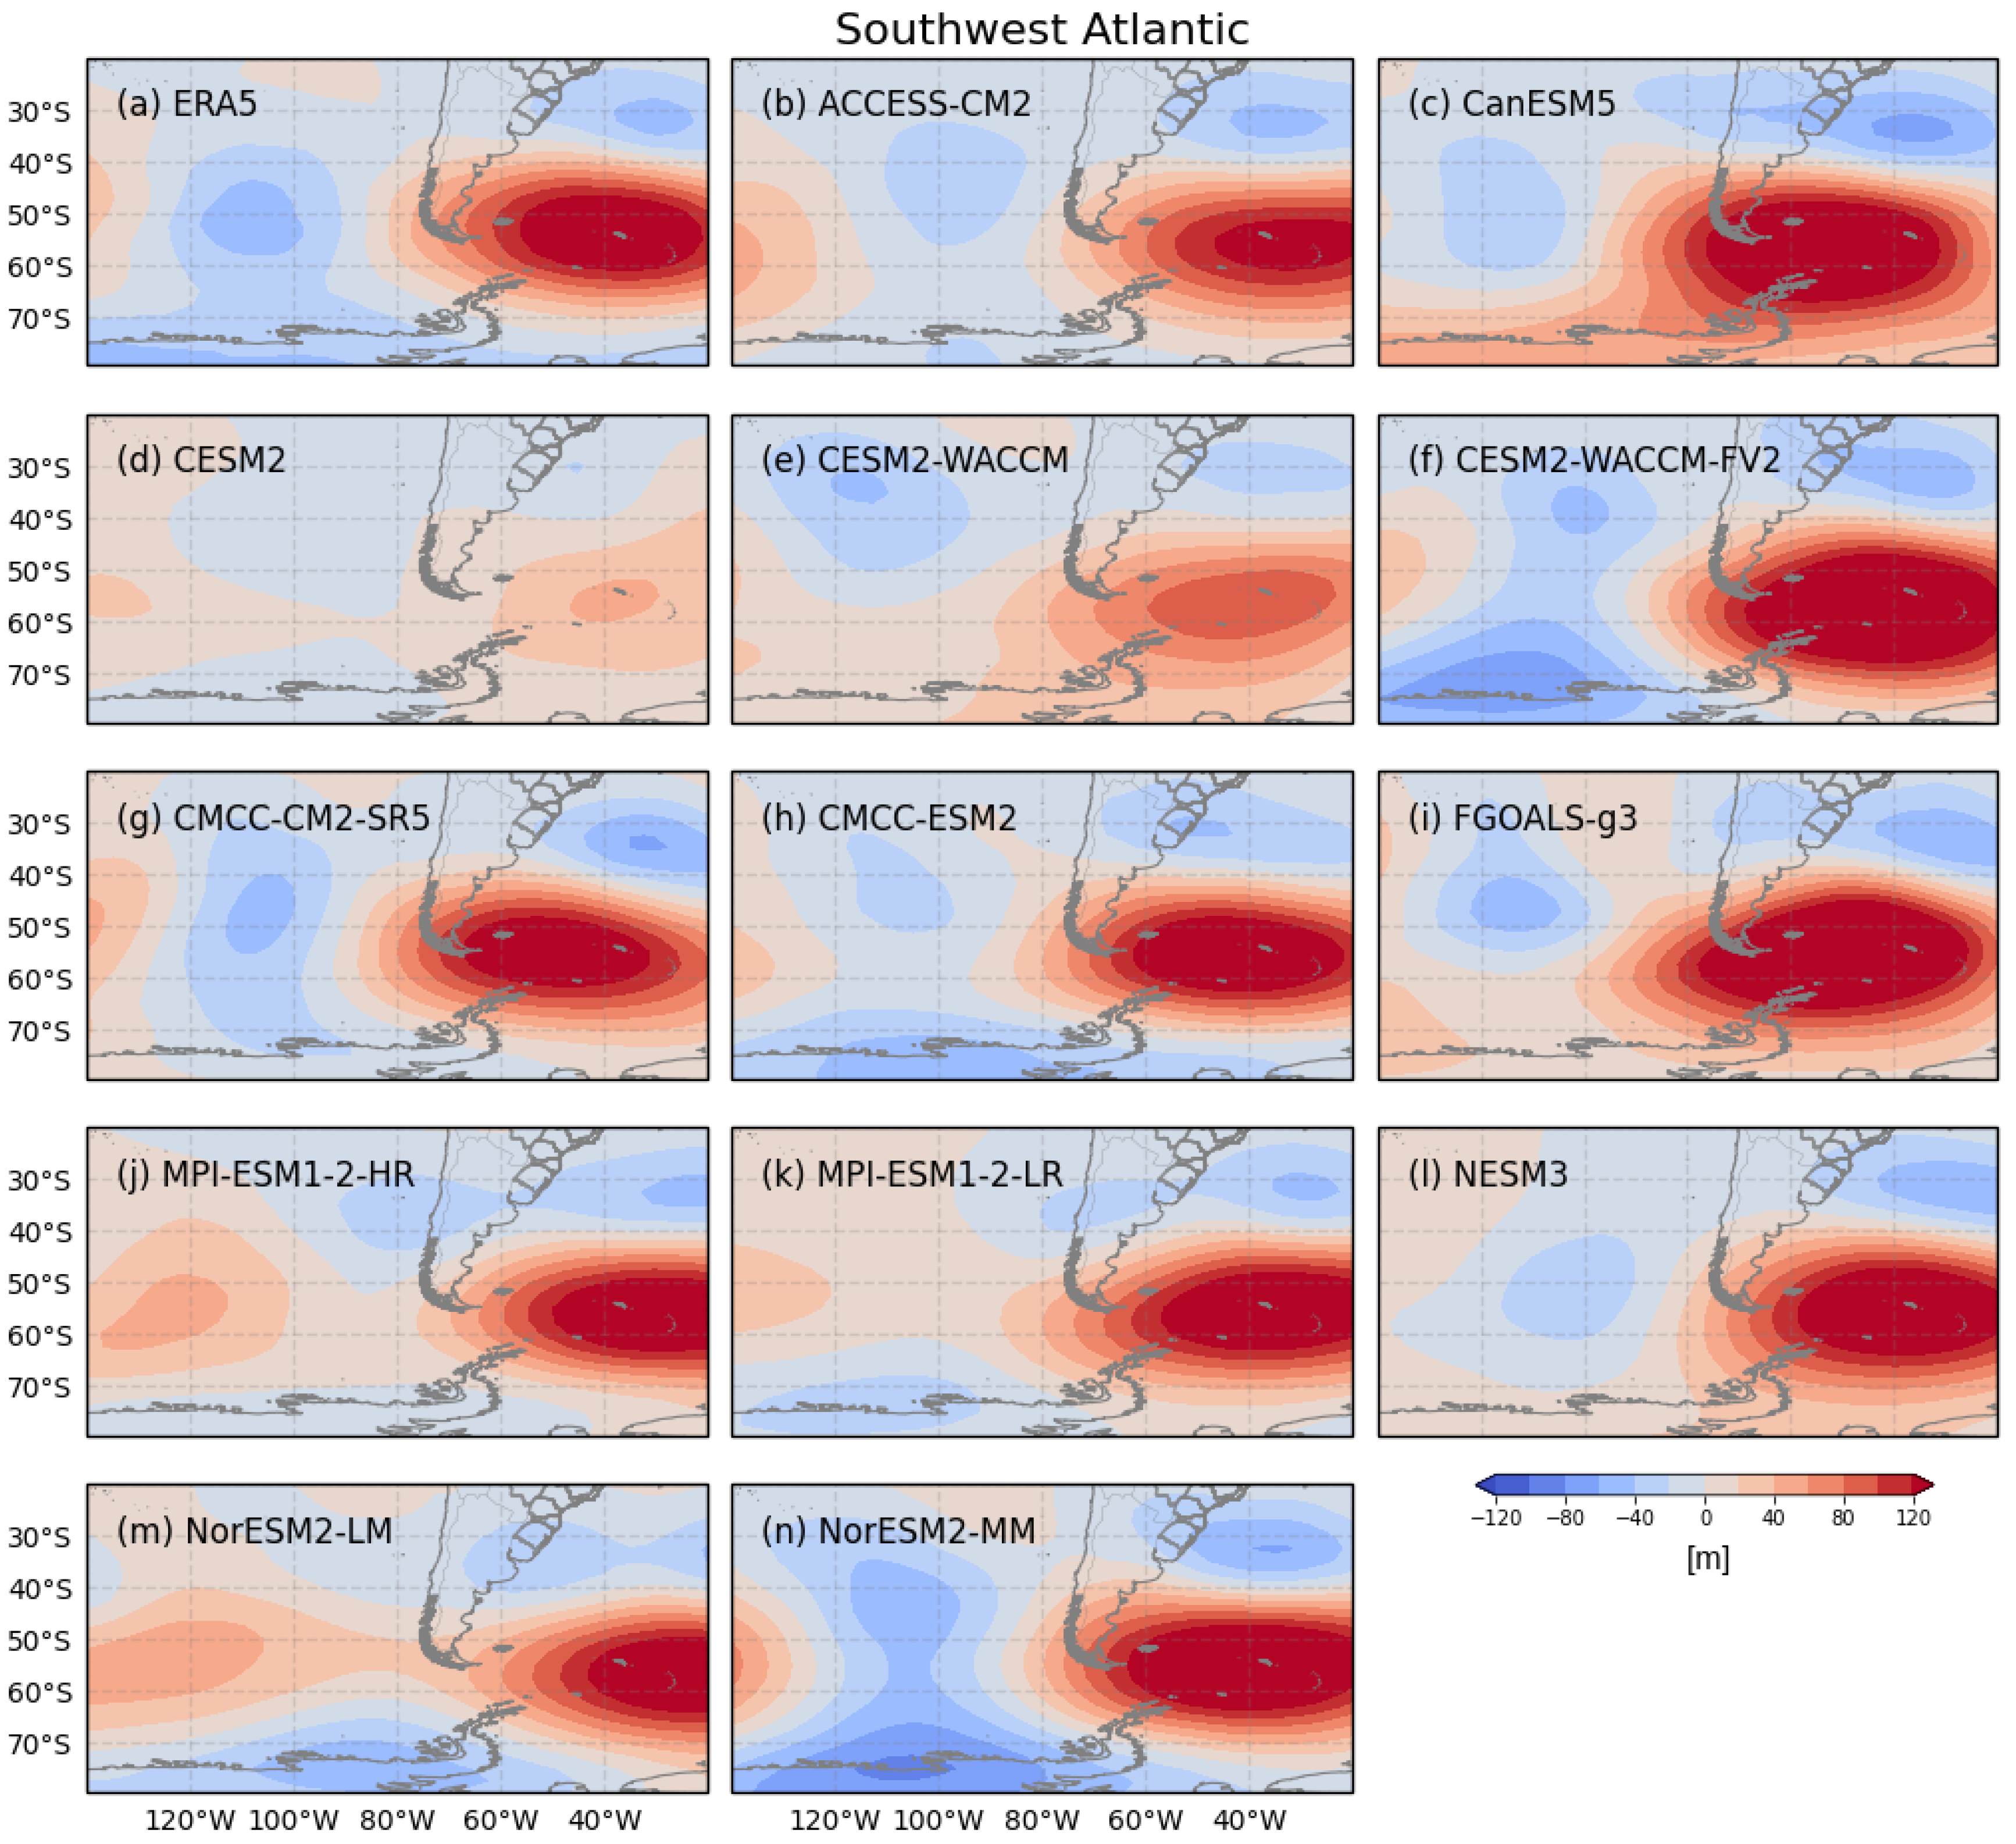
Figure 7 shows the spatial patterns of SW Atlantic blocking events during the 1985–2014 period. The blocking high is centered around longitude W and between latitudes S and S. Two small and weak regions of positive Z500 anomalies are observed to the north and west of the blocking system. Models CMCC–CM2, MPI–ESM1–2–LR, NESM3, and Nor–ESM2–MM displayed the ERA5 pattern, but with MPI–ESM1–2–LR not having a weak positive Z500 anomaly west of the blocking height. Similar to what happened for the SE Pacific, CESM2 (Figure 7d) and, to a lesser extent, CESM–WACCM (Figure 7e) have smaller Z500 anomaly values compared to the observations. ACCESS–CM2, MPI–ESM1–2–HR, and Nor–ESM2–LM also reproduced the observed pattern well, but with the blocking slightly displaced to the east. On the contrary, CMCC–CM2–SR5 displayed the blocking slightly displaced to the west. Meanwhile, for CanESM5, CESM2–WACCM–FV2, and FGOALS–g3, the blocking Z500 anomalies are slightly broader and stronger than in ERA5, with the center displaced to the west, around longitudes W and W.

Figure 7.
Z500 anomalies for atmospheric blocking events in the Southwest Atlantic sector from 1985 to 2014 for each CMIP6 model and ERA5.
Additionally, for MPI–ESM1–2–LR, Nor–ESM2–LM, and MPI–ESM1–2–LR, a secondary region with weak positive Z500 anomalies was identified over the SE Pacific Ocean, west of the main blocking system. This contrasts with ERA5 and other CMIP6 models, which exhibit negative Z500 anomaly values over the same region. These positive anomalies are likely a result of these models indicating a few instances of blocking conditions over the SW Pacific simultaneously with those over the SW Atlantic. Ref. [6] found a few instances of simultaneous blocking conditions over the SE Pacific and SW Atlantic; however, in this study, no simultaneous blocking was observed in the ERA5 dataset.
4. Conclusions
This study sheds light on the representation of blocking events in the Southeast Pacific and Southwest Atlantic regions by analyzing a set of 13 GCMs from CMIP6. Historical runs were used to analyze blocking conditions in the recent past climate, considering the period from 1985 to 2014, and ERA5 Z500 data were used to represent the observed blocking events.
Most of the CMIP6 models analyzed underestimate the total number of blocking events in the Southeast Pacific. The MPI–ESM1–2–HR and MPI–ESM1–2–LR models come closest to reproducing the number of blocking events observed in ERA5, with underestimations of around −10% and −9%, respectively. Despite this, the models were able to represent the seasonality and the overall duration of the blocking events. Additionally, the overall position of the blocking height over the Southeast Pacific was well represented by the models.
For the Southwest Atlantic, all CMIP6 GCMs analyzed did not represent the blocking climatology well. The models both overestimated and underestimated the total number of blocking events by more than 25% when compared to ERA5. Additionally, the models struggled to reproduce the seasonal distribution of blockings. Furthermore, they also had more difficulty in representing the duration of the blocking events observed in ERA5.
This study adds to the scarce body of research on atmospheric blocking events in the Southern Hemisphere. Additionally, these findings highlight the complexities of representing blocking phenomena in climate models, especially in the Southwest Atlantic sector. They also underscore the importance of continued research in this area for improving the representation of blocking in the preset–day climate and for future projections.
Author Contributions
Conceptualization, V.F.; methodology, V.F. and R.M.; software, R.M. and V.F.; formal analysis, V.F., O.T.B. and R.M.; resources, R.H.V.; writing–original draft preparation, V.F.; writing–review and editing, O.T.B., R.M. and F.D.C.; supervision, R.M., L.M. and R.H.V. All authors have read and agreed to the published version of the manuscript.
Funding
This research was funded by ENGIE Brasil Energia and Companhia Energética Estreito grant number P&D–00403–0054/2022.
Data Availability Statement
The CMIP6 datasets utilized in this study are accessible through public online databases. The blocking identification algorithm is available upon reasonable request.
Acknowledgments
This research results from the R&D Project from ENGIE Brasil Energia and Companhia Energética Estreito (R&D–00403–0054/2022), and was regulated by National Electric Energy Agency (ANEEL).
Conflicts of Interest
The funders had no role in the design of the study; in the collection, analyses, or interpretation of data; in the writing of the manuscript; or in the decision to publish the results.
References
- Rex, D.F. Blocking action in the middle troposphere and its effect upon regional climate. Tellus 1950, 2, 275–301. [Google Scholar]
- Marengo, J.A.; Ambrizzi, T.; Barreto, N.; Cunha, A.P.; Ramos, A.M.; Skansi, M.; Molina Carpio, J.; Salinas, R. The heat wave of October 2020 in central South America. Int. J. Climatol. 2021, 42, 2281–2298. [Google Scholar] [CrossRef]
- Marengo, J.A.; Cunha, A.P.; Cuartas, L.A.; Deusdará Leal, K.R.; Broedel, E.; Seluchi, M.E.; Michelin, C.M.; De Praga Baião, C.F.; Chuchón Angulo, E.; Almeida, E.K.; et al. Extreme drought in the Brazilian Pantanal in 2019–2020: Characterization, causes, and impacts. Front. Water 2021, 3, 639204. [Google Scholar] [CrossRef]
- Coelho, C.A.; de Oliveira, C.P.; Ambrizzi, T.; Reboita, M.S.; Carpenedo, C.B.; Campos, J.L.P.S.; Tomaziello, A.C.N.; Pampuch, L.A.; Custódio, M.d.S.; Dutra, L.M.M.; et al. The 2014 southeast Brazil austral summer drought: Regional scale mechanisms and teleconnections. Clim. Dyn. 2016, 46, 3737–3752. [Google Scholar] [CrossRef]
- Rodrigues, R.R.; Woollings, T. Impact of atmospheric blocking on South America in austral summer. J. Clim. 2017, 30, 1821–1837. [Google Scholar] [CrossRef]
- Mendes, M.C.D.; Trigo, R.M.; Cavalcanti, I.F.; DaCamara, C.C. Blocking episodes in the Southern Hemisphere: Impact on the climate of adjacent continental areas. Pure Appl. Geophys. 2008, 165, 1941–1962. [Google Scholar] [CrossRef]
- Lupo, A.R. Atmospheric blocking events: A review. Ann. N. Y. Acad. Sci. 2021, 1504, 5–24. [Google Scholar] [CrossRef]
- Mendes, M.C.D.; da Silva Aragão, M.R.; Mendes, D.; Mesquita, M.D.; Correia, M.d.F.; Cavalcanti, E.P. Synoptic-dynamic indicators associated with blocking events over the Southeastern Pacific and South Atlantic oceans. Clim. Dyn. 2022, 60, 2285–2301. [Google Scholar] [CrossRef]
- Lejenäs, H. Characteristics of Southern Hemisphere blocking as determined from a time series of observational data. Q. J. R. Meteorol. Soc. 1984, 110, 967–979. [Google Scholar] [CrossRef]
- Tibaldi, S.; Tosi, E.; Navarra, A.; Pedulli, L. Northern and Southern Hemisphere seasonal variability of blocking frequency and predictability. Mon. Weather Rev. 1994, 122, 1971–2003. [Google Scholar] [CrossRef]
- Wiedenmann, J.M.; Lupo, A.R.; Mokhov, I.I.; Tikhonova, E.A. The climatology of blocking anticyclones for the Northern and Southern Hemispheres: Block intensity as a diagnostic. J. Clim. 2002, 15, 3459–3473. [Google Scholar] [CrossRef]
- Davini, P.; D’Andrea, F. Northern Hemisphere atmospheric blocking representation in global climate models: Twenty years of improvements? J. Clim. 2016, 29, 8823–8840. [Google Scholar] [CrossRef]
- Woollings, T.; Barriopedro, D.; Methven, J.; Son, S.W.; Martius, O.; Harvey, B.; Sillmann, J.; Lupo, A.R.; Seneviratne, S. Blocking and its response to climate change. Curr. Clim. Chang. Rep. 2018, 4, 287–300. [Google Scholar] [CrossRef]
- Davini, P.; d’Andrea, F. From CMIP3 to CMIP6: Northern Hemisphere atmospheric blocking simulation in present and future climate. J. Clim. 2020, 33, 10021–10038. [Google Scholar] [CrossRef]
- Liu, P.; Reed, K.A.; Garner, S.T.; Zhao, M.; Zhu, Y. Blocking Simulations in GFDL GCMs for CMIP5 and CMIP6. J. Clim. 2022, 35, 5053–5070. [Google Scholar] [CrossRef]
- Patterson, M.; Bracegirdle, T.; Woollings, T. Southern Hemisphere atmospheric blocking in CMIP5 and future changes in the Australia-New Zealand sector. Geophys. Res. Lett. 2019, 46, 9281–9290. [Google Scholar] [CrossRef]
- Hersbach, H.; Bell, B.; Berrisford, P.; Hirahara, S.; Horányi, A.; Muñoz-Sabater, J.; Nicolas, J.; Peubey, C.; Radu, R.; Schepers, D.; et al. The ERA5 global reanalysis. Q. J. R. Meteorol. Soc. 2020, 146, 1999–2049. [Google Scholar] [CrossRef]
- Oliveira, F.N.; Carvalho, L.M.; Ambrizzi, T. A new climatology for Southern Hemisphere blockings in the winter and the combined effect of ENSO and SAM phases. Int. J. Climatol. 2014, 34, 1676–1692. [Google Scholar] [CrossRef]
- Oliveira, F.N.; Ambrizzi, T. The effects of ENSO-types and SAM on the large-scale southern blockings. Int. J. Climatol. 2016, 37, 3067–3081. [Google Scholar] [CrossRef]
- Yuchechen, A.E.; Lakkis, S.G.; Canziani, P.O. The Southern Hemisphere blocking index revisited. Atmosphere 2022, 13, 1343. [Google Scholar] [CrossRef]
- Kalnay, E.; Kanamitsu, M.; Kistler, R.; Collins, W.; Deaven, D.; Gandin, L.; Iredell, M.; Saha, S.; White, G.; Woollen, J.; et al. The NCEP/NCAR 40-year reanalysis project. Bull. Am. Meteorol. Soc. 1996, 77, 437–471. [Google Scholar] [CrossRef]
- Saha, S.; Moorthi, S.; Pan, H.L.; Wu, X.; Wang, J.; Nadiga, S.; Tripp, P.; Kistler, R.; Woollen, J.; Behringer, D.; et al. NCEP climate forecast system reanalysis (CFSR) monthly products, January 1979 to December 2010. Bull. Am. Meteorol. Soc. 2010, 91, 1015–1057. [Google Scholar] [CrossRef]
- Sinclair, M.R. A climatology of anticyclones and blocking for the Southern Hemisphere. Mon. Weather Rev. 1996, 124, 245–264. [Google Scholar] [CrossRef]

Disclaimer/Publisher’s Note: The statements, opinions and data contained in all publications are solely those of the individual author(s) and contributor(s) and not of MDPI and/or the editor(s). MDPI and/or the editor(s) disclaim responsibility for any injury to people or property resulting from any ideas, methods, instructions or products referred to in the content. |
© 2024 by the authors. Licensee MDPI, Basel, Switzerland. This article is an open access article distributed under the terms and conditions of the Creative Commons Attribution (CC BY) license (https://creativecommons.org/licenses/by/4.0/).