Abstract
The Padua temperature series is one of the longest in the world, as daily observations started in 1725 and have continued almost unbroken to the present. Previous works recovered readings from the original logs, and digitalized and corrected observations from errors due to instruments, calibrations, sampling times and exposure. However, the series underwent some changes (location, elevation, observing protocols, and different averaging methods) that affected the homogeneity between sub-series. The aim of this work is to produce a homogenized temperature series for Padua, starting from the results of previous works, and connecting all the periods available. The homogenization of the observations has been carried out with respect to the modern era. A newly released paleo-reanalysis dataset, ModE-RA, is exploited to connect the most ancient data to the recent ones. In particular, the following has been carried out: the 1774–2023 daily mean temperature has been homogenized to the modern data; for the first time, the daily values of 1765–1773 have been merged and homogenized; and the daily observations of the 1725–1764 period have been connected and homogenized to the rest of the series. Snowfall observations, extracted from the same logs from which the temperatures were retrieved, help to verify the robustness of the homogenization procedure by looking at the temperature frequency distribution on snowy days, before and after the correction. The possibility of adding new measurements with no need to apply transformations or homogenization procedures makes it very easy to update the time series and make it immediately available for climate change analysis.
1. Introduction
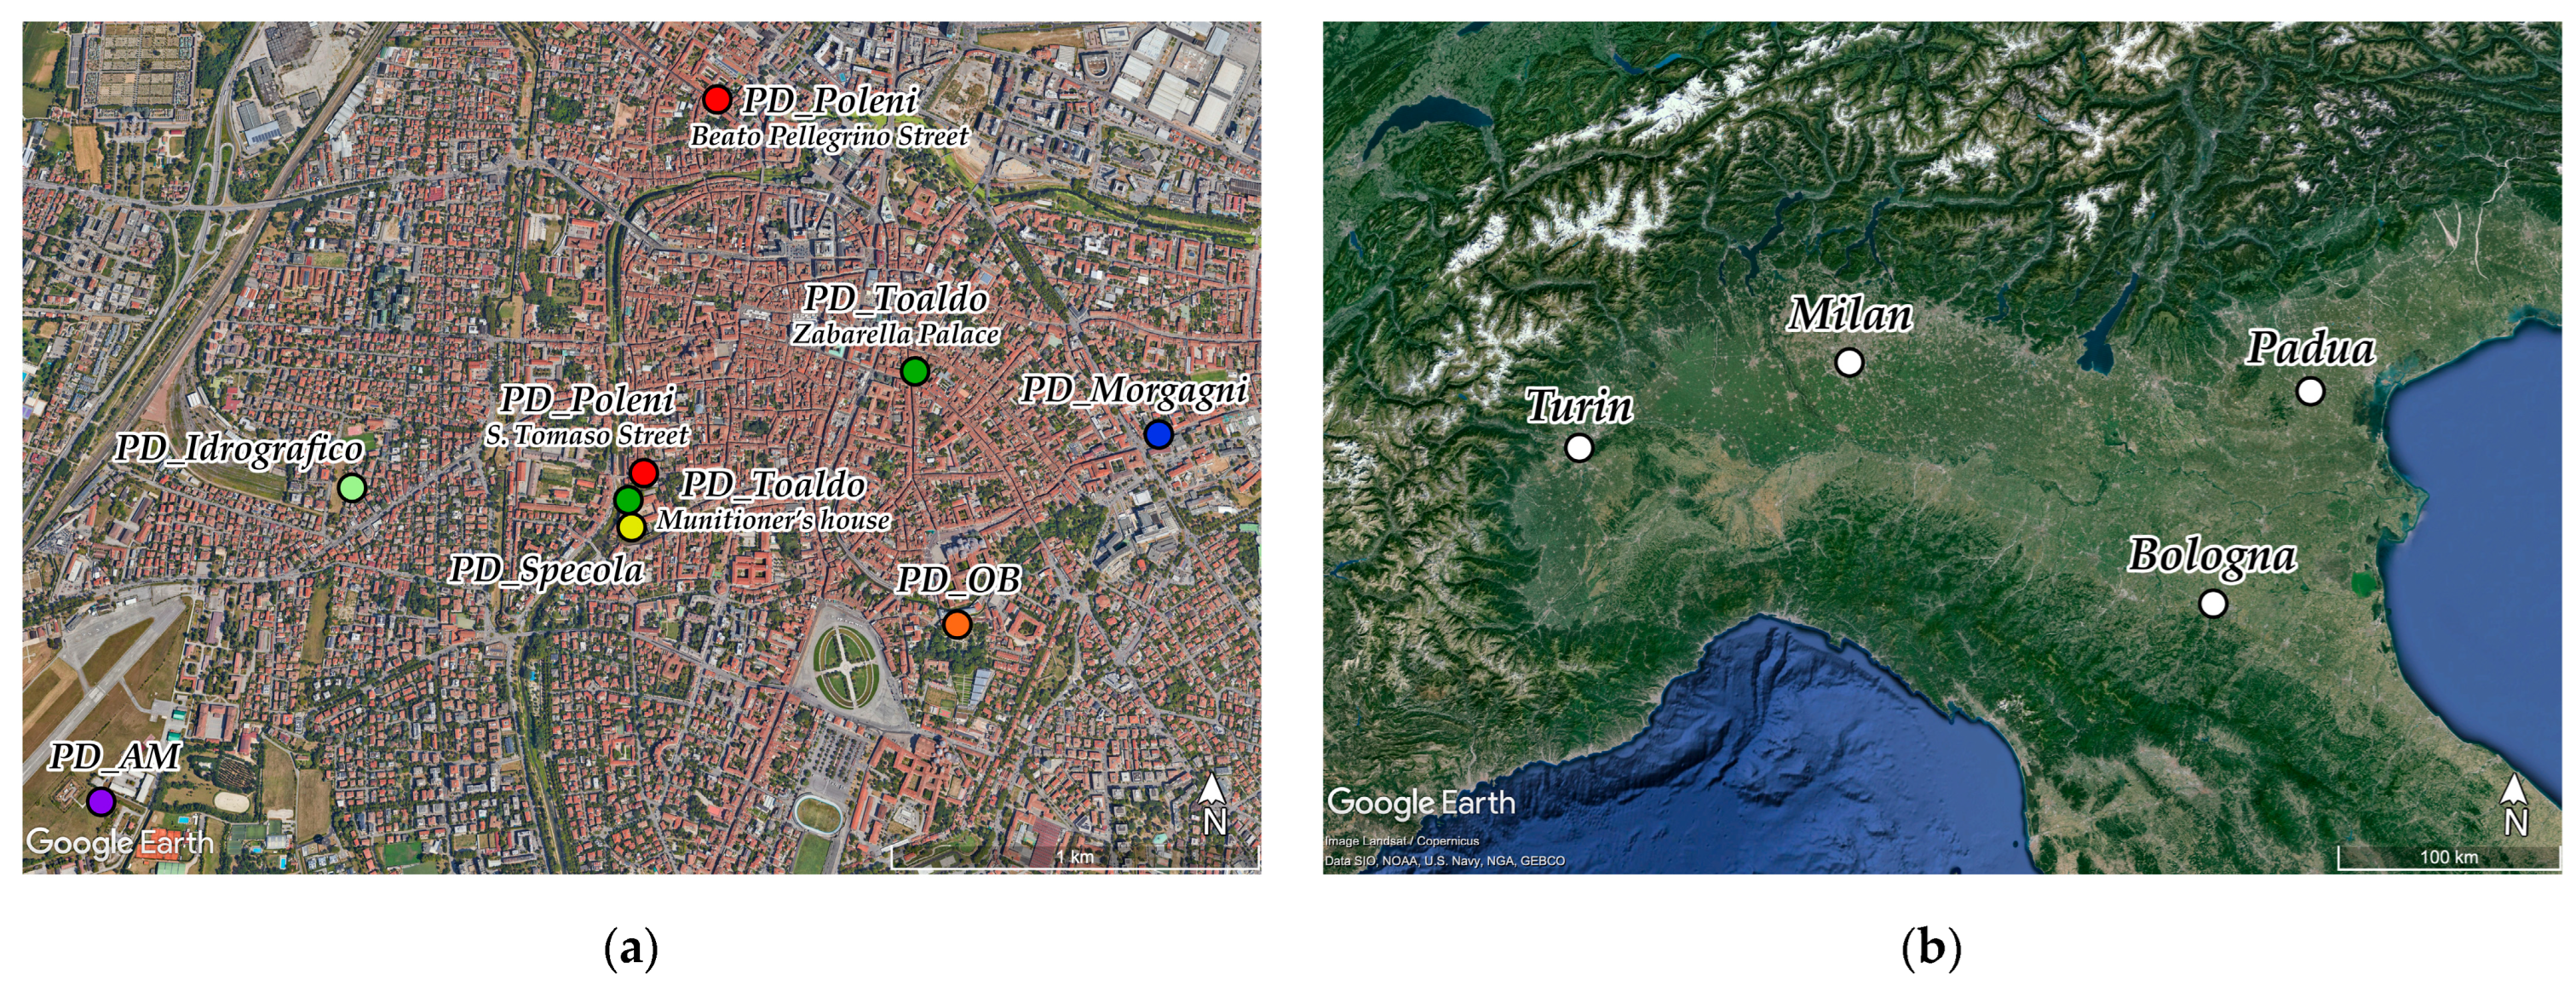
Very early instrumental temperature observations, dating back to the beginning of the 18th century are rare, but at the same time essential, for studying the climate of the past. Padua (45.402 N, 11.868 E, located in Northern Italy, see Figure 1) has one of the oldest continuous series in Italy [1,2] and in the world [3], as regular meteorological observations of temperatures and other meteorological variables started in 1725. Some occasional temperature observations date back to 1716 and some sparser measurements to even before this [1,4].
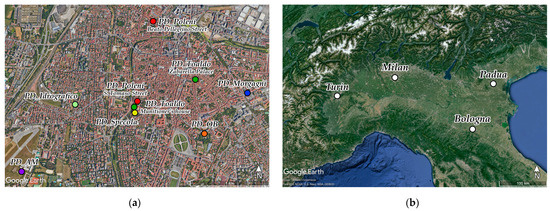
Figure 1.
Locations of the meteorological stations considered in this study: (a) Padua city center; (b) Po Valley in Northern Italy.
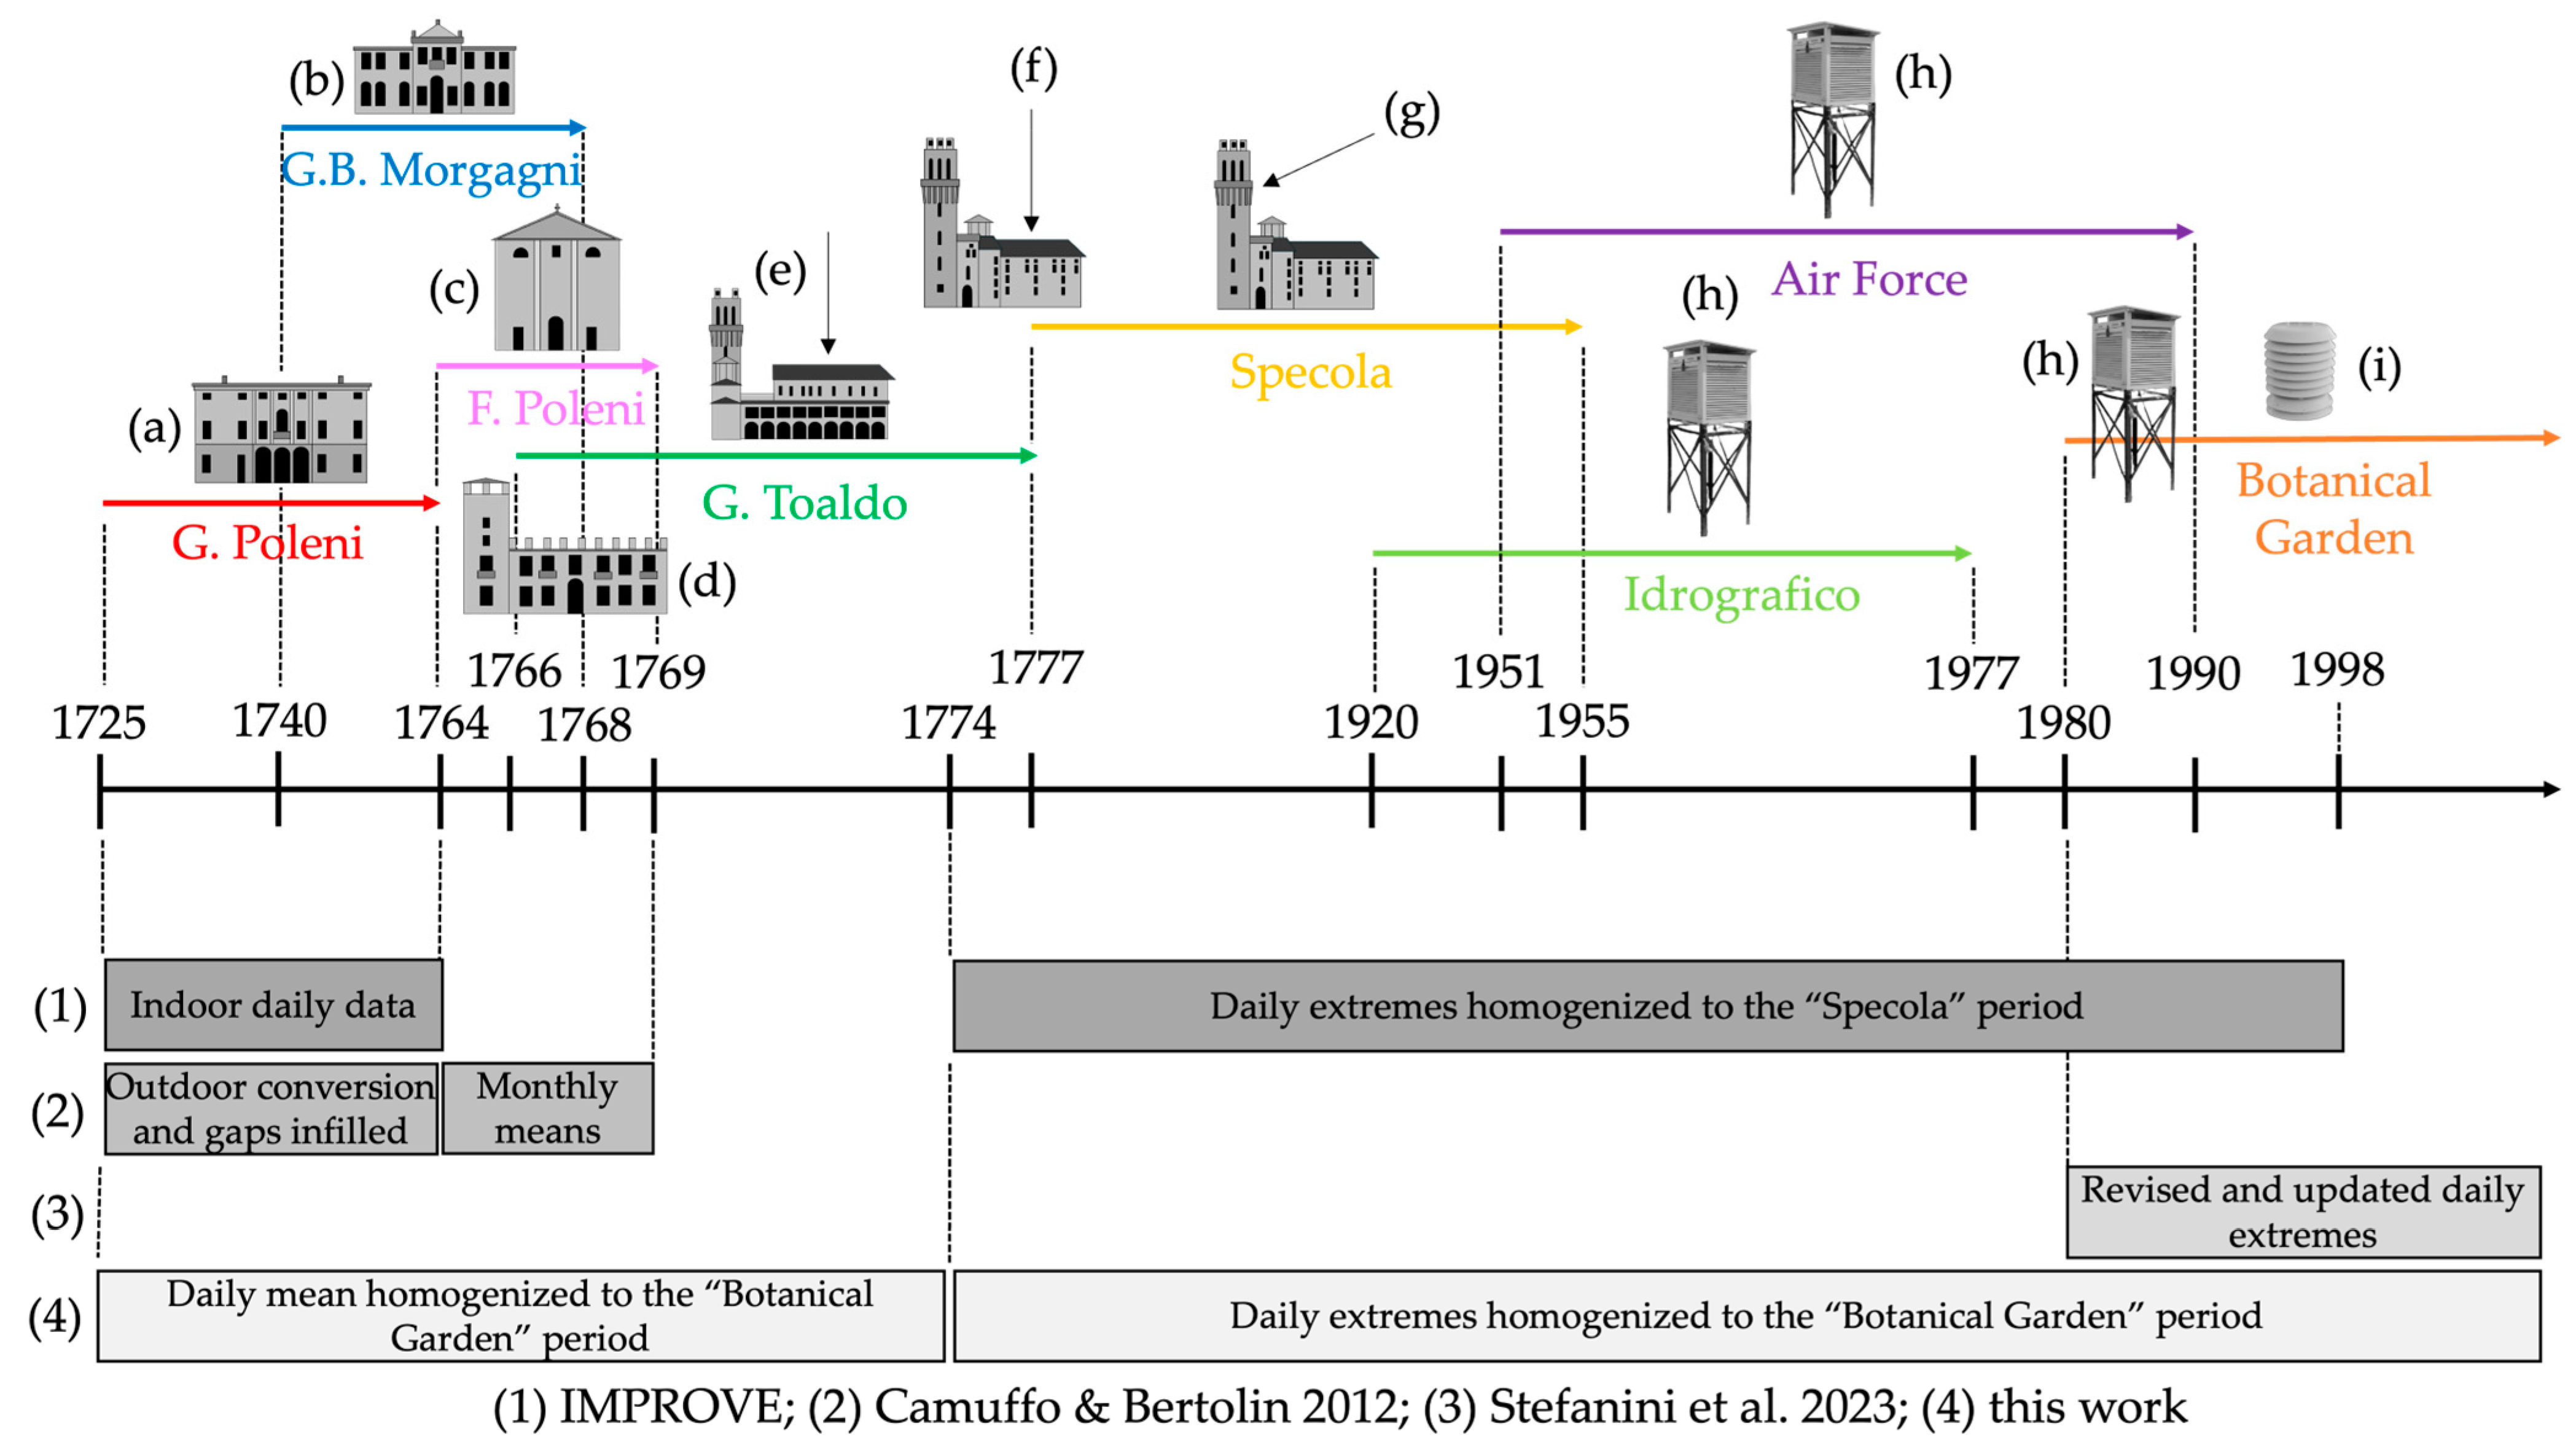
Over the last decades, the temperature series of Padua underwent different steps to recover and correct the data, and make them available in the original form, as well as transforming them into in standard units (°C) after correction. First, within the EU project IMPROVE [1,5,6,7], all the daily meteorological observations made in Padua from 1725 to 1998 were recovered from the original registers, digitalized, and corrected for instrumental errors, calibrations, sampling times and exposure. The first part of the series, from 1725 to 1764, was initially taken indoor [1], and then converted using an indoor–outdoor transfer function [4]. Outdoor readings from 1774 were more regular, taken at the Specola Astronomical Observatory, allowing for the obtaining of extreme daily values. The period after 1920 is composed of various sub-series from the Water Magistrate, the Italian Air Force, the University of Padua, and the Regional Agency for the Environmental Protection and Prevention (ARPAV) [1,7]. Afterwards, more data from the early period have been retrieved and corrected: sporadic measurements found for the years 1716–1718, monthly averages of the latest observations made by Francesco Poleni in 1765–1769, but also the few gaps in the 1725–1764 period, have been infilled by means of contemporary outdoor observations taken in Bologna (44.497 N, 11.352 E, 110 km south-west of Padua) [4]. The last period, from 1980 to the present, has been recently adjusted due to the multiple changes of location or instrument [8]. All these steps, with the addressed problems, the output produced and the related references, are summarized in chronological order in Table 1.

Table 1.
Timeline of the previous studies of the temperature series of Padua.
The aim of this study is to produce a complete time series of the daily temperatures in Padua, starting from 1725, which is homogenized to the present-day style; therefore, it can be directly continued with the present-day or future observations, without the need to apply homogenization methods. In this way, this information can be used for any kind of climatological analysis, as, for example, the study of the ongoing climate change. In fact, a series spanning nearly three centuries provides an extremely precious source to assess the significance of the present warming.
2. Materials and Methods
2.1. Datasets
In this study, the daily mean temperature from January 1725 to December 1764, and the daily minimum and maximum temperatures from January 1774 to December 2023 are considered. The 1951–2023 data have been collected from the stations located in Padua center and the small airport located inside the city. The irregular observations taken before 1725 have not been considered. The above-mentioned studies provide extensive details about the description of the thermometers and their calibration, location, exposure, and observational modalities [1,5,6,7]. Only the most relevant metadata are summarized here.
Seven main sub-series may be considered:
- 12 January 1725–31 December 1764: observations by Giovanni Poleni and his son Francesco in their house at Beato Pellegrino Street. Measurements were taken indoors, once a day at noon, with an Amontons’ thermometer and a barometer. From 26 April 1764 observations continued at the Convent of the Philipine Fathers in San Tomaso Street, 1260 m south of his former house [1]. Poleni’s indoor measurements were transformed to outdoor ones by comparison with the contemporary (1740–1764) outdoor measurements taken by Morgagni to obtain the daily mean temperature [4]. Short gaps in this series were infilled using contemporary observations in Bologna [4]. This sub-series is hereinafter referred to as PD_Poleni;
- 1 January 1740–31 December 1768: observations collected using two thermometers, one exposed indoors and one outdoors, by Giovanni Battista Morgagni in his house in San Massimo Street. The outdoor measurements were taken from a window probably facing north-northwest, on the upper floor. The observations were made twice a day, on average one hour after dawn (i.e., close to the daily minimum) and two hours after solar culmination (i.e., close to the daily maximum) [1] (hereinafter, PD_Morgagni);
- 1 May 1766–31 December 1773: observations collected by Giuseppe Toaldo in his home in San Lorenzo Street until 30 November 1767, probably at the tower of Zabarella Palace (17–18 m above ground) and then in the house of the Munitioner in the Specola complex (~10 m above ground) until 10 September 1775. Toaldo measured temperatures initially close to sunrise, and then occasionally also later in the morning, at noon, and, more rarely, in the evening [1] (hereinafter, PD_Toaldo);
- 1 January 1774–31 December 1955: observations collected by the astronomers of the Specola. During this long period, many sub-series exist, with different locations and exposures. Data and metadata were fully recovered and homogenized under the EU project IMPROVE [1]. The Specola series ended in 1955, with degraded quality in the last period, and most of the observations of the next 5–6 years are lost. Starting from 1774, both minimum and maximum values are available [1] (hereinafter, PD_Specola);
- 1 January 1920–31 December 1977: observations collected in Sorio Street, 900 m west of the Specola, by the Water Magistrate (“Osservatorio Magrini” as part of the “Ufficio Idrografico” network). Measurements were interrupted from May 1922 to the end of 1923 and then continued quite regularly until 1977. Some sparse records exist after this year, but are generally of low quality [1] (hereinafter, PD_Idrografico);
- 1 January 1951–29 December 1990: observations collected at Padua airport, 1300 m west of the Specola, by “Aeronautica Militare” (Italian Air Force). Measurements were taken according to international airport recommendations [1] (hereinafter, PD_AM);
- 1 January 1980–31 December 2023: observations collected at the Botanical Garden and, from 11 March 2019, at the University Sports Center, 2 km east of the Botanical Garden, 2 m above ground. During this period, different sub-series exist and have been homogenized to the May 2000–March 2019 period in a previous work [8] (hereinafter, PD_OB).
In Figure 1a the locations of the Padua stations are reported, in Table 2 the record availability for each station is also shown, and Figure 2 presents the overview of the temperature series, with all the sub-series and the periods covered by each study.
Table 2.
Daily temperature datasets for the center of Padua from 1725 to 2023. Height above ground level (HAGL) is reported; the city center of Padua is at ~12 m above sea level. The types of data are 1, 2 or 3 observations per day or minimum (Tn) and maximum (Tx) values. The number in brackets () represents the percent of completeness of the subseries.
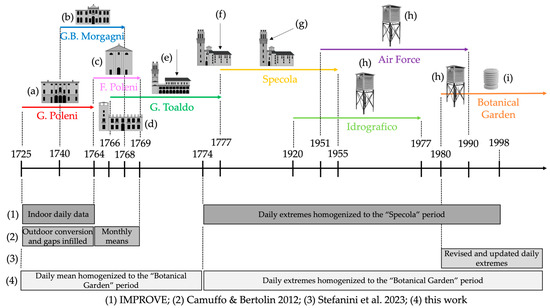
Figure 2.
Overview of the temperature series of Padua. (a) G. Poleni’s house in Beato Pellegrino Street (1725–1764); (b) G.B. Morgagni’s house in San Massimo Street (1740–1768); (c) Convent of Philipine Fathers (1764–1769); (d) Zabarella Palace (1766–1767); (e) Munitioner’s house, joined to the north side of the Specola tower (1767–1775); (f) House of the Astronomer, joined to the east side of the Specola tower (1775–1777); (g) Specola tower; (h) Stevenson screen used by Magrini Observatory, Air Force, and first part of Botanical Garden period; (i) modern radiation shield (from 1990); (1) IMPROVE [1,5,6,7]; (2) Camuffo & Bertolin, 2012 [4]; (3) Stefanini et al., 2013 [8]; (4) this work.
Further independent data are available during the most ancient part of the series. Francesco Poleni actually continued to record the temperatures after 1764, until 31 December 1769, in the Convent of the Philipine Fathers, but daily data from 1765 to 1769 are lost and only monthly values have been recovered from Toaldo’s registers [1,4]. Francesco Poleni’s monthly averages were not used in the reconstruction process of the main series but have been corrected anyway with the same procedure as that applied to the other ancient observers (see Section 3.2), as independent verification. Other stations active in the Po Valley from around the mid-18th century (see Figure 1b), whose series have been fully recovered, are Milan (45.472° N, 9.189° E, 121 m; from 1763 [1,9]), Turin (45.069° N, 7.685° E, 237 m; from 1760 [10]) and Bologna (44.497° N, 11.330° E, 63 m; from 1715 [11]). Monthly values of these stations have been used for comparison with Padua. Since these cities are 100–300 km away from Padua, and at slightly different elevations, anomalies have been considered.
Moreover, some paleo-reanalysis datasets, based on a combination of long instrumental station data and documentary proxies, are available:
- ModE-RA: the most recently released reanalysis product with worldwide coverage and monthly resolution, from 1421 to 2008. The spatial resolution is 2°, and only anomalies with respect to 1901–2000, are provided. Therefore, the 1901–2000 interval has been chosen as the reference climatological period to compute anomalies of all series. Its 20 ensemble members were generated with the ECHAM6 general circulation model [12];
- EKF400: worldwide reanalysis dataset with monthly resolution, from 1602 to 2003. The version 2, used in this study, has a spatial resolution of 2°. Its 30 ensemble members were generated with the ECHAM5.4 general circulation model [13];
- Casty2005: reconstructions covering the European Alps (43.25–48.25° N and 4.25–16.25° E) with spatial resolution of 0.5°. Monthly temperatures are available from 1659 to 2000, while seasonal averages extend back to the year 1500 [14].
To assess the reliability of the daily temperature homogenization, other meteorological observations have been considered: the description of the sky conditions derived from the original logs of Padua, in particular snowfall.
2.2. Methodology
Daily extreme temperatures from 1774 to 2023 have been homogenized by means of transfer functions with respect to the most recent series, PD_OB. These transfer functions have been evaluated as in [7,8], being “the least square interpolation polynomials obtained comparing, month by month, one time series with the other, excluding measurements exceeding 10th and 90th percentiles of the series of daily differences between the two series”. The comparison between overlapping series is carried out by means of scatter plots, once the outliers are removed, and the linear regression calculated is used to transform one series into the other. On the other hand, the methodology followed to correct daily mean temperatures from 1725 to 1773 is different, because there is no overlap with the subsequent period that allows for the building of transfer functions. The procedure in this case exploits the ModE-RA reanalysis, by comparing the monthly mean temperature differences between the observations and the reanalysis, before and after 1774.
Selected absolute homogeneity tests have been applied to the final mean temperature series, the same set of tests already presented in Stefanini et al., 2023 [8] and applied to the modern part of the temperature series. These tests are the following: the Standard normal homogeneity test (SNH) [15], the Buishand U and Range tests [16,17], the Pettitt test [18,19], the F-test [19,20,21], the STARS (Sequential t-test Analysis of Regime Shifts) [22], the cpt.mean [23,24], and the Von Neumann ratio test [25]. Further details are available in the literature and in Stefanini et al., 2023 [8], where the R packages (https://www.r-project.org/, accessed on 30 December 2023) which implement the algorithms are also presented.
3. Results and Discussion
The composition of the final series of temperature in Padua require three different procedures. First, daily extremes from 1774 to 2023 must be homogenized; then the daily mean from 1725 to 1764 must be homogenized; finally, the gap from 1765 to 1773 is filled and homogenized.
3.1. Daily Extreme Temperature Homogenization (1774–2023)
In Camuffo 2002a [1] all the sub-series from 1774 to 1998 were homogenized with respect to the Specola period, which is the longest one (1774–1955). Therefore, the records taken after 1955, when the observations at the Specola ended, had to be corrected. Recently, new corrections have been applied to the latest period, from 1980 to the present [8]. The aim of this work is to homogenize all the sub-series with respect to the newly released PD_OB, which is the latest available, to properly extend the series by adding new measurements, as recommended in Stefanini et al., 2023 [8].
Going backwards in time, PD_AM is the previous available series, which overlaps with PD_OB for 11 years, from 1980 to 1990. This window has been broadened by extrapolating PD_AM up to 2022 by means of the same algorithm, Climatol [26], and the data pool used in Stefanini et al., 2023 [8] (see the study for further details). In this way, a more robust comparison is possible for building the monthly transfer functions from one series to the other. The conversions from PD_AM to PD_OB (step (1) in Figure 3a) are reported in Tables S1 and S2 for minimum and maximum temperatures, respectively.
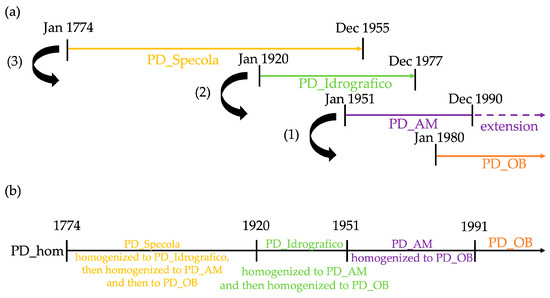
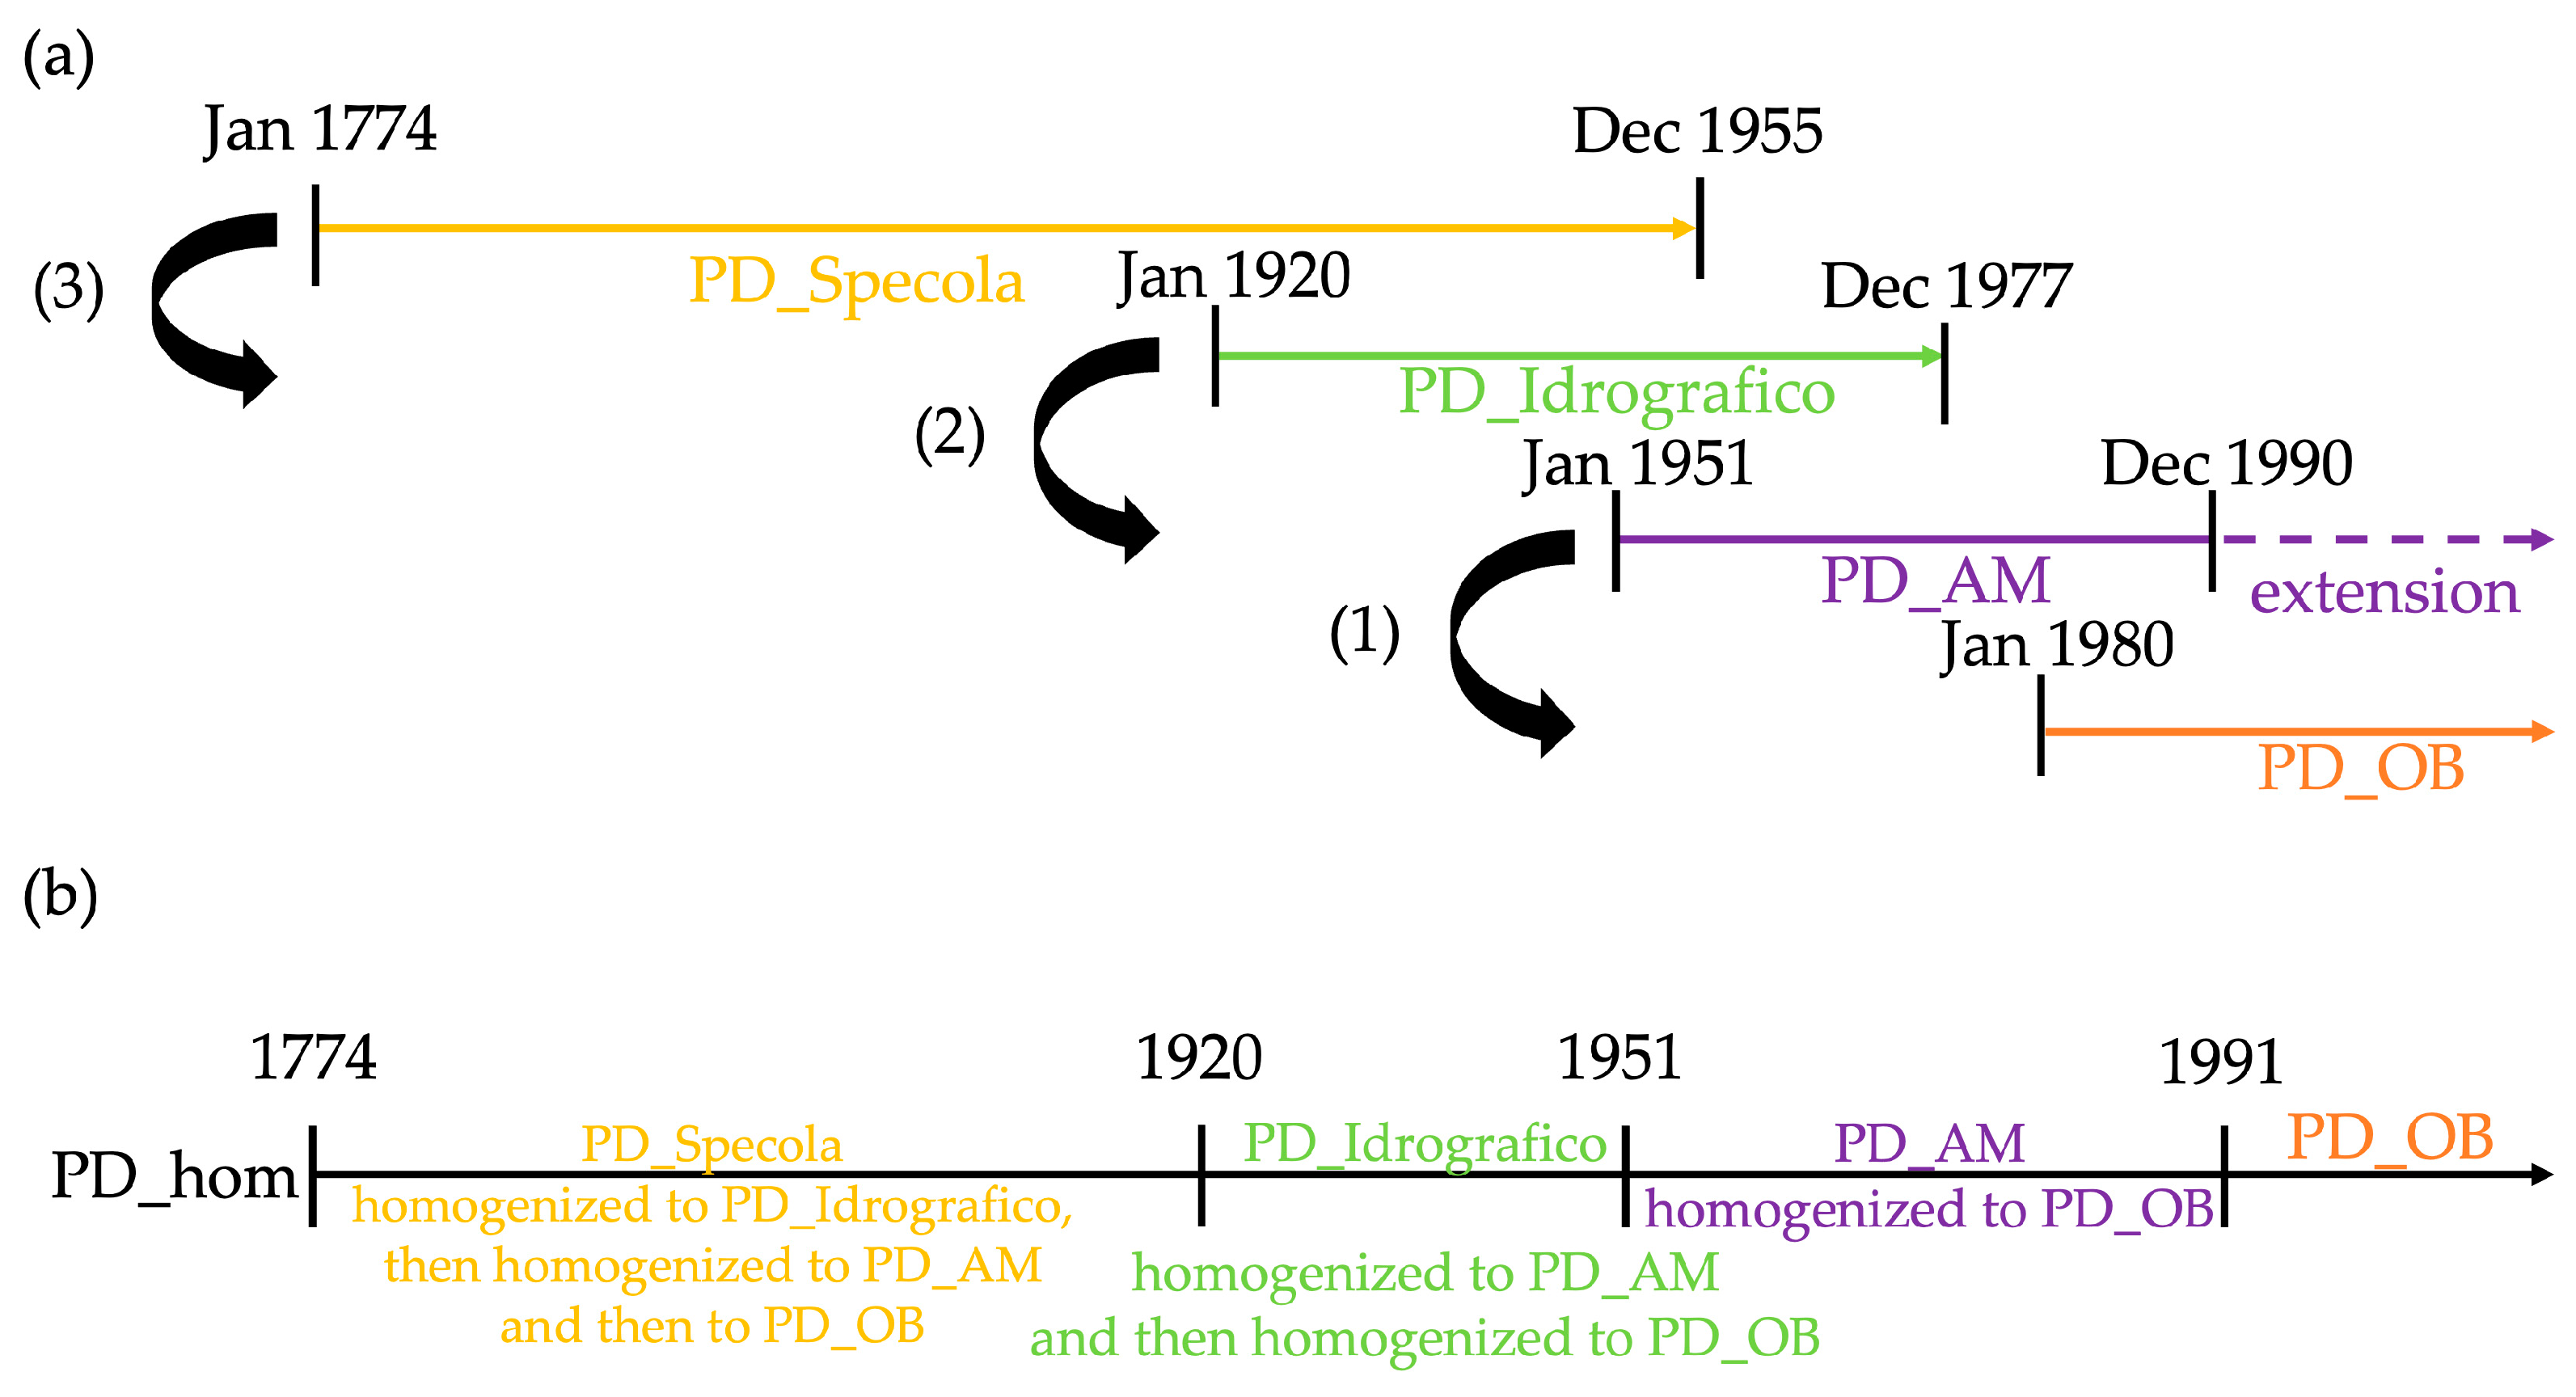
Figure 3.
Building procedure of the daily extreme-temperature series (1774–2023): (a) data availability of the main sub-series and calculation of the transfer functions, for each month separately; (1), (2) and (3) indicate the steps described in the text; (b) composition of the series PD_hom.
PD_AM starts in 1951 while PD_Specola ends in 1955; therefore, the overlapping period is too short (only 5 years) to be used to construct robust transfer functions. Luckily, from 1920 to 1977 PD_Idrografico is available, allowing a stronger connection between old and modern observations. By means of the overlapping period 1951–1977, it is possible to obtain the monthly transfer functions from PD_Idrografico to PD_AM, reported in Tables S3 and S4 (step (2) in Figure 3a). Similarly, using the overlapping period 1920–1955, the transfer functions from PD_Specola to PD_Idrografico are obtained, reported in Tables S5 and S6 (step (3) in Figure 3a). In this way, the complete minimum and maximum temperature series from 1774 to 2023 (hereafter referred to as PD_hom) has been reconstructed connecting all the converted sub-series, as shown in Figure 3b.It has been decided to keep all the available PD_AM observations until the end of the series in December 1990, rather than using PD_OB from its beginning in 1980. The reason lies in the fact that in the first years of the PD_OB series some original measurements have no decimal digit, and therefore have less precision with respect to the PD_AM series.
3.2. Daily Mean-Temperature Homogenization (1725–1764)
Once the daily minimum and maximum temperatures from 1774 to 2023 have been homogenized, it has been possible to convert the most ancient observations with respect to this basis. Before 1774, daily observations were often limited to one measurement a day, and hence it is very difficult to extrapolate daily extremes. Therefore, the comparison of the observations before and after 1774 has to be performed using mean daily values. In the absence of continuous hourly observations, the daily mean values of PD_hom are simply the arithmetic mean between minimum and maximum temperatures, while the values before 1774 consist only of the most continuous single observation available, depending on the series (at noon for PD_Poleni and PD_Morgagni and at sunrise for PD_Toaldo).
Since there is a discontinuity in the series and no overlapping periods, re-analysis data has been used to homogenize the early period. ModE-RA re-analysis provides monthly anomalies which can be used to correct the daily mean temperature from 1725 to 1764. One possibility is to transform the PD_Poleni observations by comparing the anomalies of ModE-RA with the mean monthly values of PD_Poleni from 1725 to 1764, separately for each month and, similarly, by comparing ModE-RA and the homogenized series of mean values of PD_hom. In this way, as a first step, PD_Poleni would be converted on the basis of ModE-RA, and then homogenized to PD_hom, using a procedure similar to that described in Section 3.1. Unfortunately, the coefficients of determination from 1725 to 1764, reported in Table 3 and aggregated by season, are not good enough to justify the use of this procedure in this context.
Table 3.
Coefficients of determination of the comparison between ModE-RA and Padua values, i.e., PD_Poleni (1725–1764) and PD_hom (1774–2008).
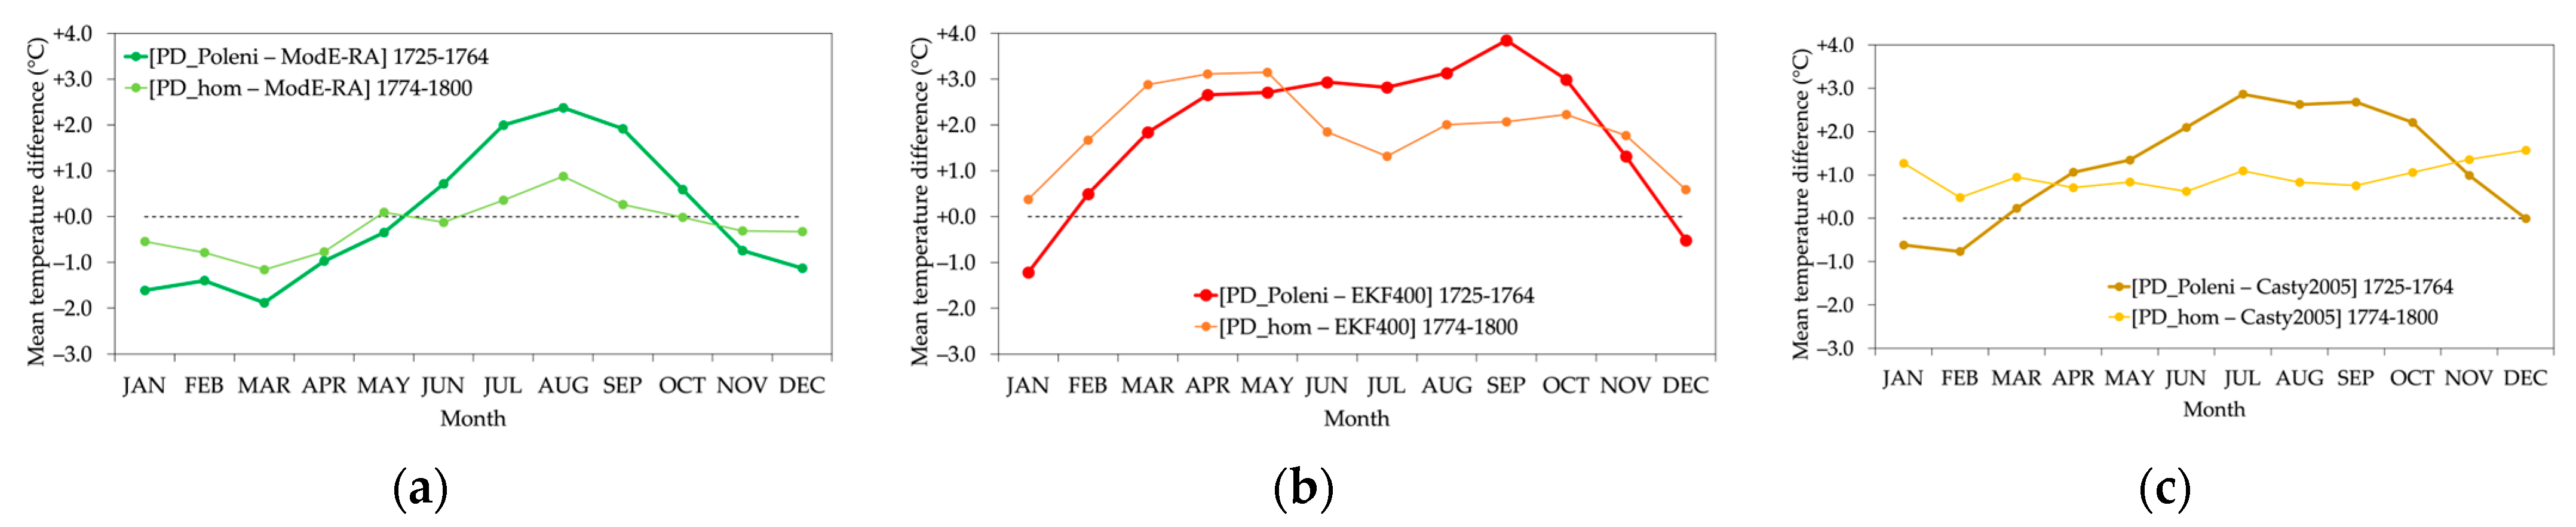
Therefore, the other possibility is to study the long-term mean differences between ModE-RA and Padua values, on a monthly basis. That is, comparing the reanalysis dataset with the Padua observations from 1725 to 1764 and after 1774, to assess the presence of offsets. The 1774–1800 period has been chosen as the reference, being the closest to the PD_Poleni period and belonging to the same century, as the reanalysis assimilated a comparable amount of input data and exhibits similar uncertainties [12]. In Figure 4a the monthly differences between PD_Poleni and ModE-RA, and also the differences between PD_hom and ModE-RA, are shown. In Figure 4b,c the same analysis is reported but using the EKF400 and Casty2005 as the reference reanalysis.
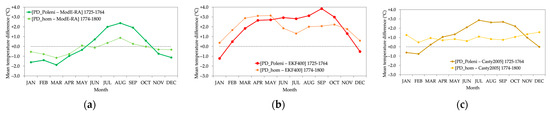
Figure 4.
Monthly differences between PD_Poleni 1725–1764 and reanalysis (thick lines) and between PD_hom for 1774–1800 and reanalysis (thin lines) (a) using ModE-RA reanalysis; (b) EKF400 reanalysis; and (c) Casty2005 reconstructions.
Although the shapes of the curves in Figure 4 are quite different, they all provide the same indication, summarized in Figure 5. That is, if the differences between each pair of curves in Figure 4a–c are computed, the common emerging pattern points out that the PD_Poleni values are colder than expected in winter (i.e., with respect to the behavior of PD_hom in 1774–1800) and warmer in summer. Note that this procedure does not assume a stability of the climate; instead, the hypothesis is the stability of the behavior of the model simulations with respect to the actual conditions in the Padua pixel. Since intervals spanning few decades or even years are considered, the effect of the assimilation of the observations in the reanalysis is probably not negligible, while at larger time scales the climate variability is driven by the model; thus, the assumption is that these observations do not introduce relevant inhomogeneities in the considered pixel. This seems plausible, as the three reconstructions, ModE-RA, EKF400 and Casty2005, exhibit the same behavior (Figure 5), but it will be also tested subsequently once the complete corrected-temperature series of Padua is obtained.
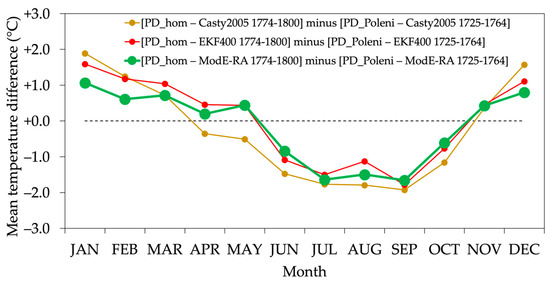
Figure 5.
Monthly differences between each pair of curves shown in Figure 4. The ModE-RA curve (thick green line) has been selected as reference.
Even though all the reconstructions, ModE-RA, EKF400, and Casty2005, agree quite well on the general behavior of the corrections to be applied to PD_Poleni, Figure 5 shows also that the differences between these reconstructions can be as large as nearly 1 °C, in some months. Hence, since ModE-RA represents the state of the art of historical climate reanalysis, and since it assimilated into the model the data available for Padua, as did the other reconstructions, but distinguishing the series before and after 1774, it has been chosen as the reference dataset. Therefore, to homogenize PD_Poleni to the rest of the series, the temperatures of the winter months from 1725 to 1764 should be warmer and the ones of the summer months should be cooler. The monthly differences of Figure 5 have been interpolated (fitting a smoothing spline) to obtain daily corrections without sharp steps between two consecutive months (step (1) in Figure 6a).
3.3. Filling and Homogenization of the Gap (1765–1773)
From 1765 to 1773, Morgagni and Toaldo’s daily temperatures are considered. In continuity with the Poleni’s period, when only observations at noon are available, the values extrapolated at the same hour have been used for Moragni’s period (PD_Morgagni). These temperatures at noon were derived in Camuffo and Bertolin 2012 [4] by means of the observations at 8 and 14, and the shape of the diurnal cycle according to the season. Toaldo’s observations are less consistent, as often only one reading per day was made; therefore, the PD_Toaldo series is only composed of the values taken near sunrise, this being the most continuous series. Of course, observations near sunrise cannot be representative of the mean value of the day, but the procedure of homogenization explained hereafter allows for the eluding of this problem, as the corrections are built from differences. Morgagni’s observations are used until the end of the series, in December 1768, while Toaldo’s ones cover the remaining years, 1769–1773. In this way, Toaldo’s measurements taken at the tower of Zabarella Palace are not considered, excluding a possible change-point at the end of 1767 (when he moved and the thermometer was positioned at a lower height above ground) and the need for further corrections.
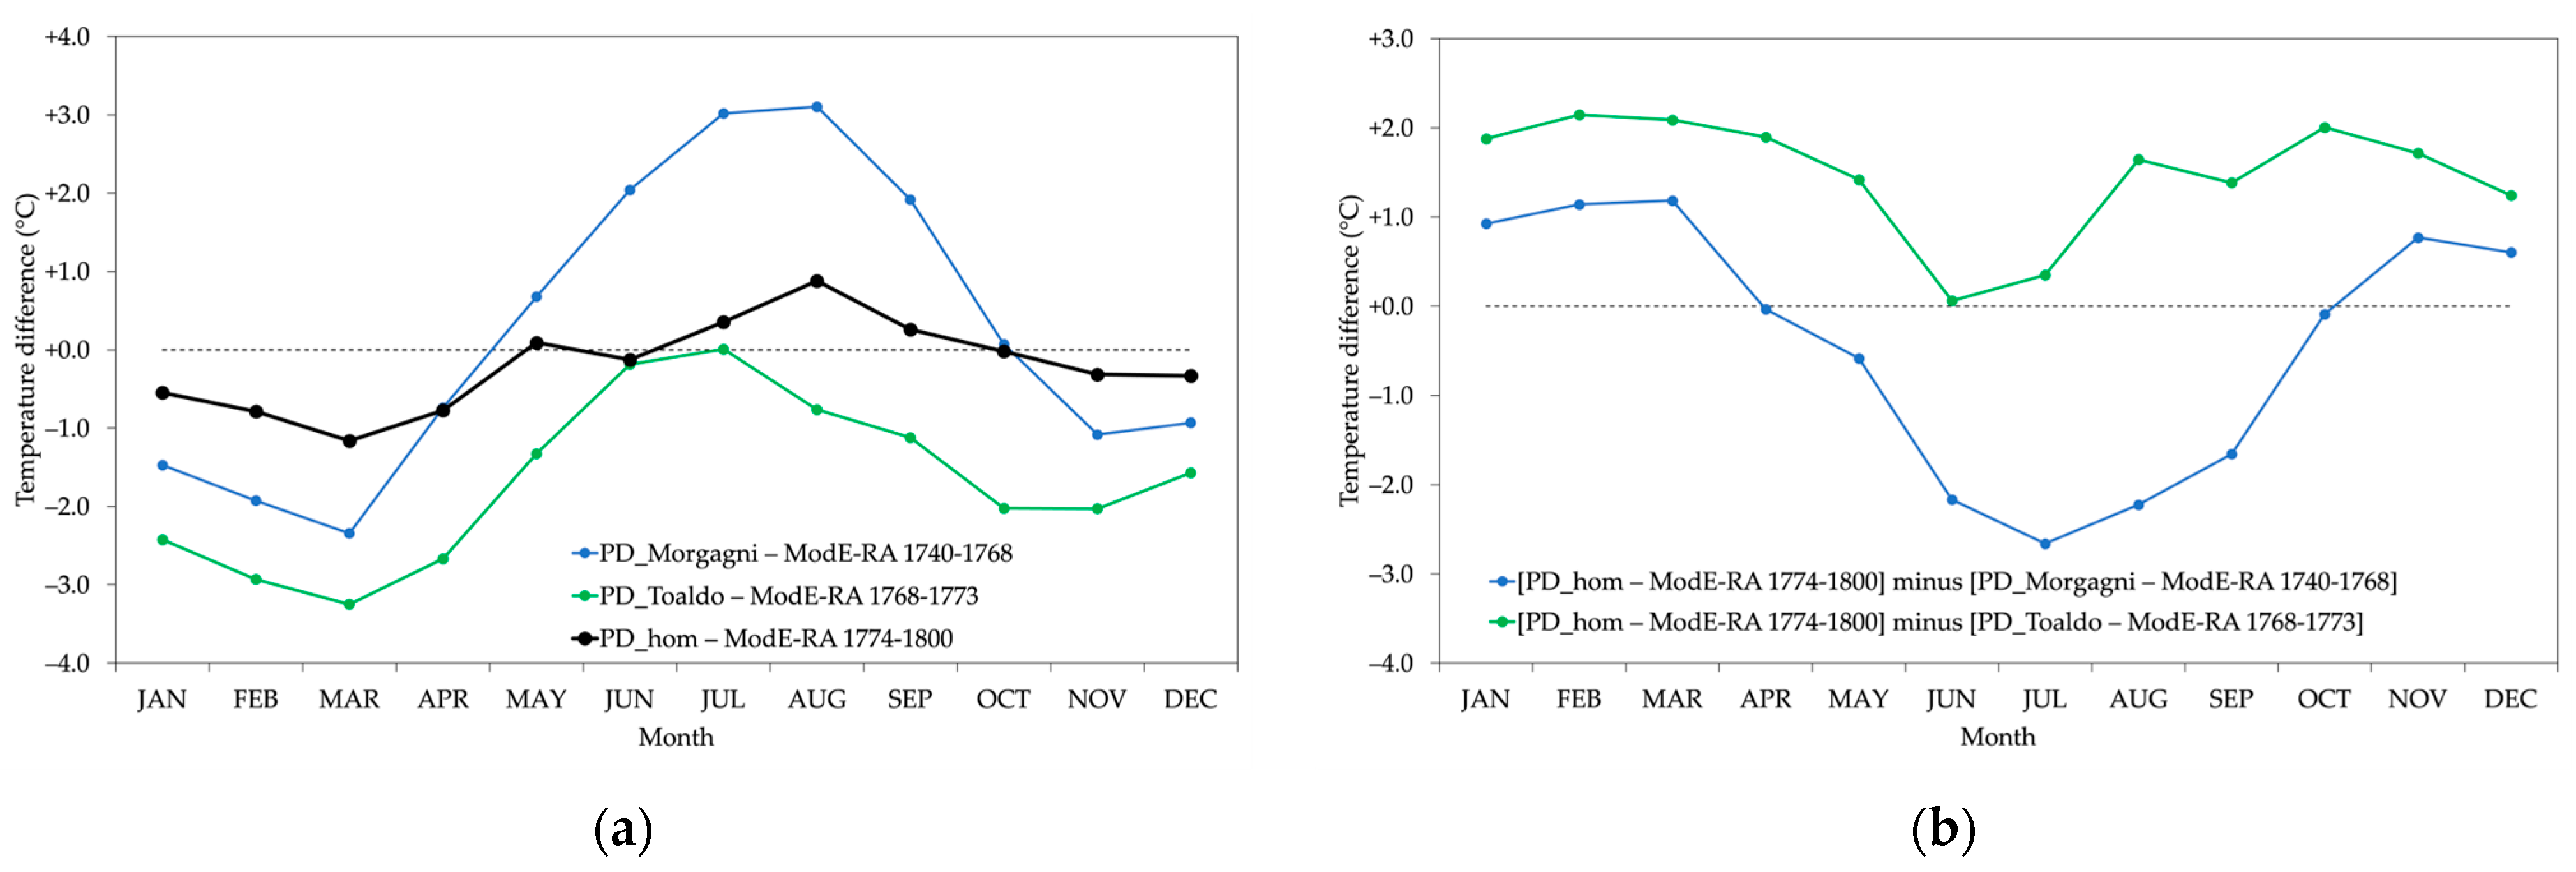
The procedure to correct PD_Morgagni and PD_Toaldo is the same as that used to correct PD_Poleni. The 1774–1800 interval has again been chosen as a reference. Figure 7a, similarly to Figure 4a, shows the monthly differences between the temperatures of each sub-series and ModE-RA reanalysis over the same periods (1740–1768 for PD_Morgagni and 1768–1773 for PD_Toaldo, for which we excluded the observations before 1768, as already stated). Figure 7b, similarly to Figure 5, shows the differences from the baseline (PD_hom minus ModE-RA 1774–1800), i.e., the corrections that should be applied to PD_Morgagni and PD_Toaldo to obtain the same behavior PD_hom has with respect to ModE-RA (step (2) and (3) in Figure 6a). Similarly to the PD_Poleni case, the values of Figure 7b have been interpolated in order to obtain smooth daily corrections. Once again, the indication is an increase in the temperatures of the winter months and a decrease in the ones of the summer months (except for the summer months of PD_Toaldo, as the series have positive or nearly-zero corrections throughout the whole year).
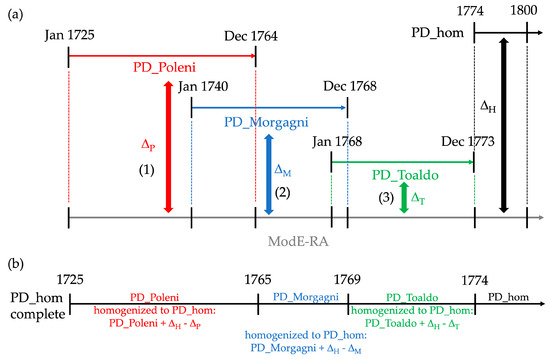
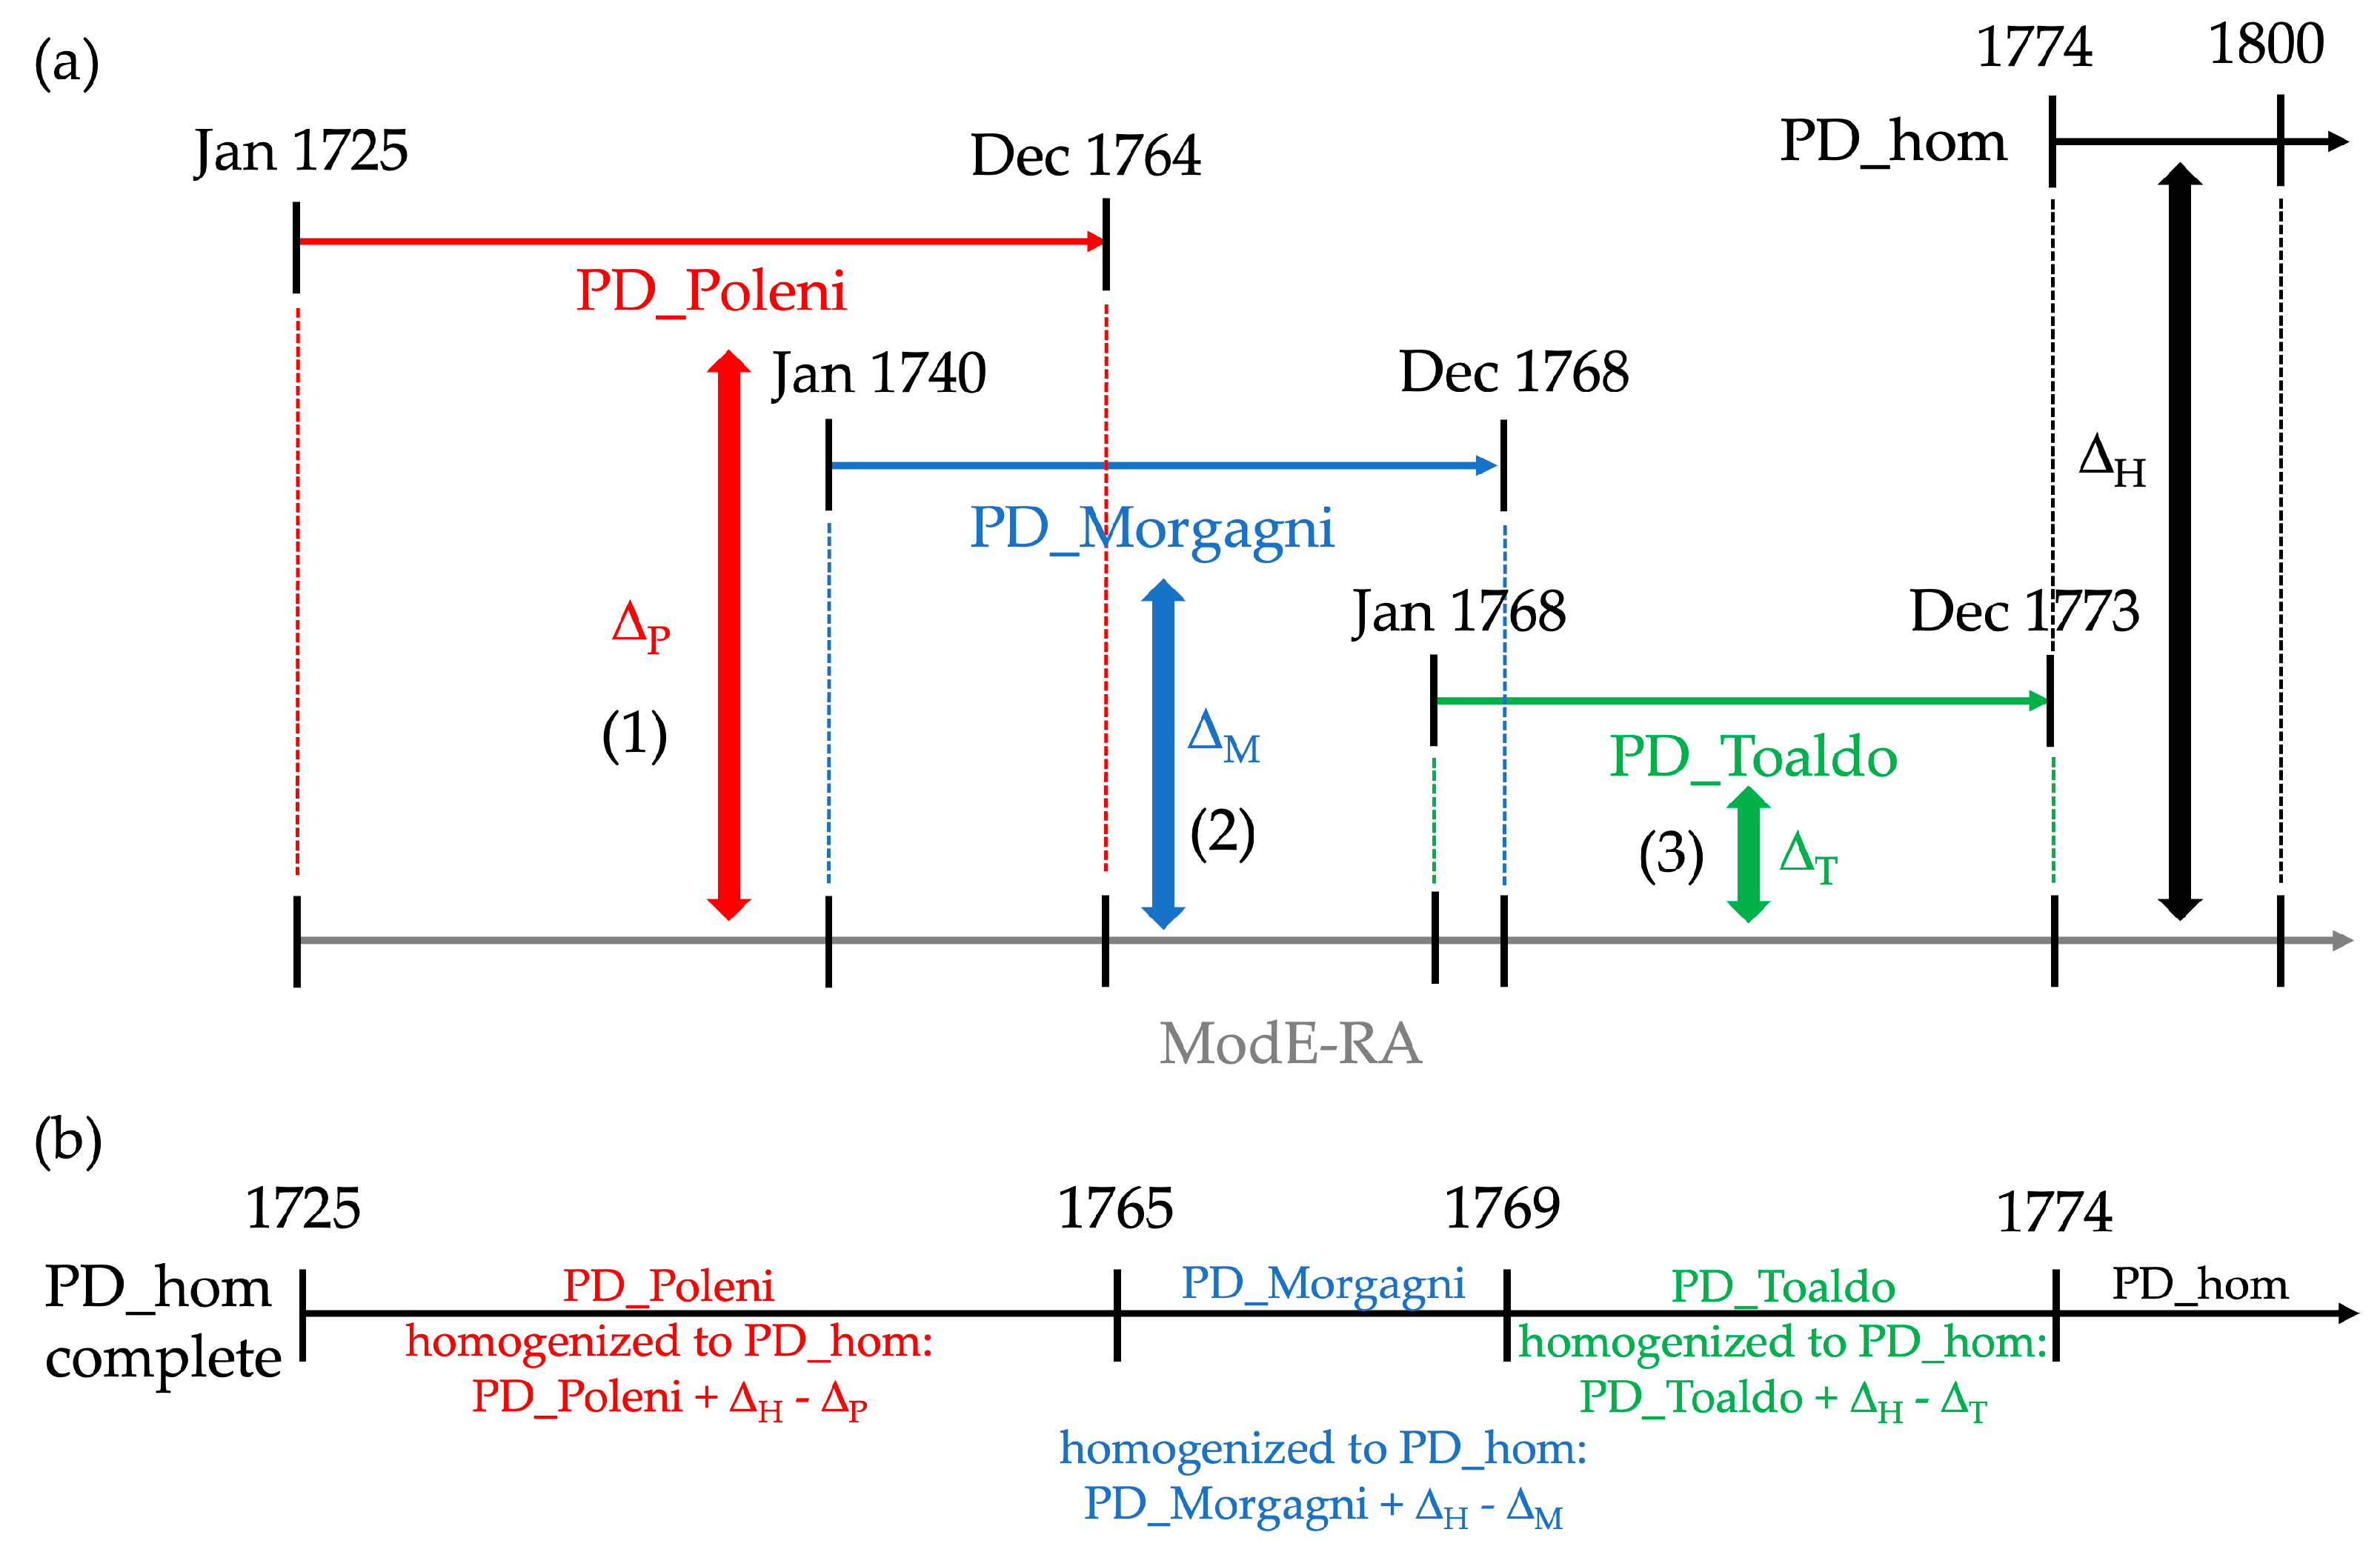
Figure 6.
Building procedure of the daily mean-temperature series (1725–1773): (a) data availability of the main sub-series and calculation of the differences with ModE-RA over the same periods, for each month separately; (1), (2) and (3) indicate the steps described in the text; (b) composition of the complete series PD_hom.
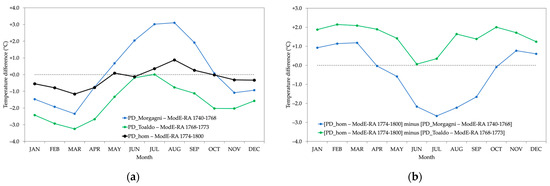
Figure 7.
(a) Monthly differences between PD_Morgagni 1740–1768 and ModE-RA reanalysis (blue), PD_Toaldo 1768–1773 and ModE-RA (green) and between PD_hom for 1774–1800 and ModE-RA (black, the baseline); (b) monthly differences of the curves shown in (a) with the PD_hom minus ModE-RA differences.
Missing observations from the 1765-to-1773 period have been infilled afterwards using the temperatures of the Milan series. The scatter plot of the Milan daily mean temperatures and the corrected PD_Morgagni values over their common period, 1763–1768, provides a coefficient of determination R2 = 0.948, while the comparison of Milan and the corrected PD_Toaldo values (over 1768–1773) provides R2 = 0.928. Having a slightly larger R2 in the first case, that regression has been chosen to obtain a transfer function to infill the gaps using Milan’s temperatures:
The standard error of this regression is 1.2 °C. Finally, combining the corrected series of PD_Poleni, PD_Morgagni and PD_Toaldo, a complete series of daily mean temperatures is obtained (Figure 6b), which can be continued with the daily means of PD_hom (hereafter, PD_hom refers to the complete series 1725–2023). An evaluation of the uncertainties involved in the 1725–1773 period is reported in Table S7.
3.4. Verification Using Snowfall Events
From the beginning of the meteorological observations in Padua, daily weather conditions were also carefully recorded in the logs, providing precious complementary information with respect to the temperature measurements. In particular, the occurrence of snowfall is a useful indicator to assess the calibration of thermometers [5,27]. The correspondence between snow and temperature is not absolute, as snowfall can occur when temperature is equal or greater than 0 °C, depending on the humidity, upper air conditions and precipitation intensity. Nonetheless, in the absence of other independent data, for a given location it is possible to study the frequency distribution of snowfall events at different temperatures and to draw conclusions about the homogenization procedure of temperatures, at least during winter.
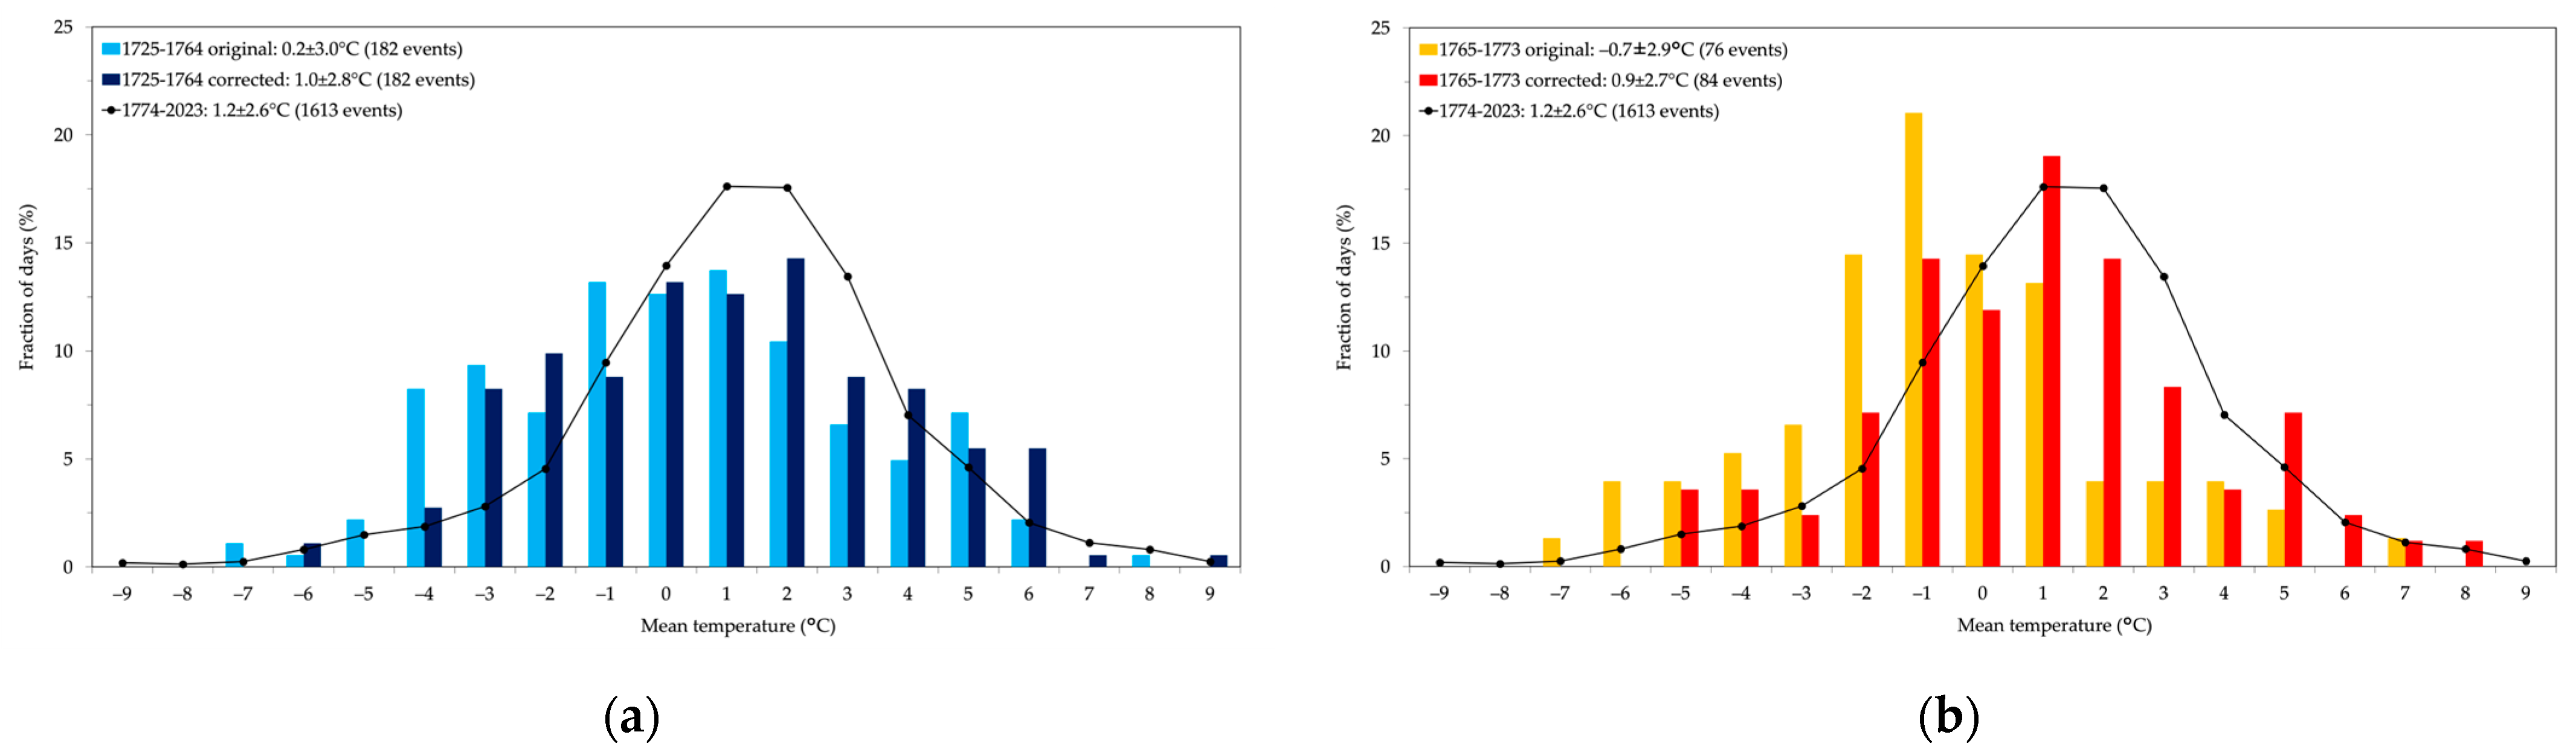
Figure 8 shows the Gaussian fits of the frequency distributions of snowfall in Padua, from 1774 to 2023, during the PD_Poleni period (1725–1764, both before and after the correction) and during the PD_Morgnagni and PD_Toaldo period (1765–1773, grouped together). Overall, 1613 snowy days have been observed during 1774–2023, with a mean daily temperature of 1.2 ± 2.6 °C over those days. On the other hand, 182 events are present in 1725–1764, with the mean temperature being corrected by the homogenization procedure from 0.2 ± 3.0 °C to 1.0 ± 2.8 °C. Lastly, 76 events are present during 1765–1773 and the mean temperature has been corrected from −0.7 ± 2.9 °C to 0.9 ± 2.7 °C (for the corrected series there are more events, 84, because of the infilling of the gaps in the temperatures using the Milan data). All these data are reported in Figure 8, from which it is clear that the homogenization of PD_Poleni, PD_Morgagni and PD_Toaldo provides nearly the same frequency distribution of the temperatures of PD_hom after 1774. Indeed, the application of the t-test to the 1725–1764 and 1765–1773 datasets, with respect to the 1774–2023 period, indicates that the mean values after the corrections are no more statistically different to those of the baseline (p-value < 0.01), whereas the variances are untouched and not statistically different from those of the baseline, as confirmed by the F-test.
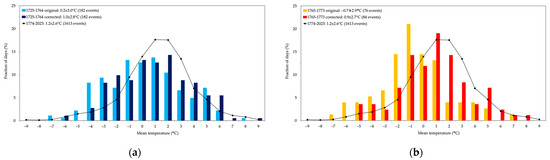
Figure 8.
Frequency distributions of snowfall events in Padua before and after the correction: (a) 1725–1764 and (b) 1765–1773; the reference baseline 1774–2023 is also shown (black line).
3.5. Verification of Temporal Continuity
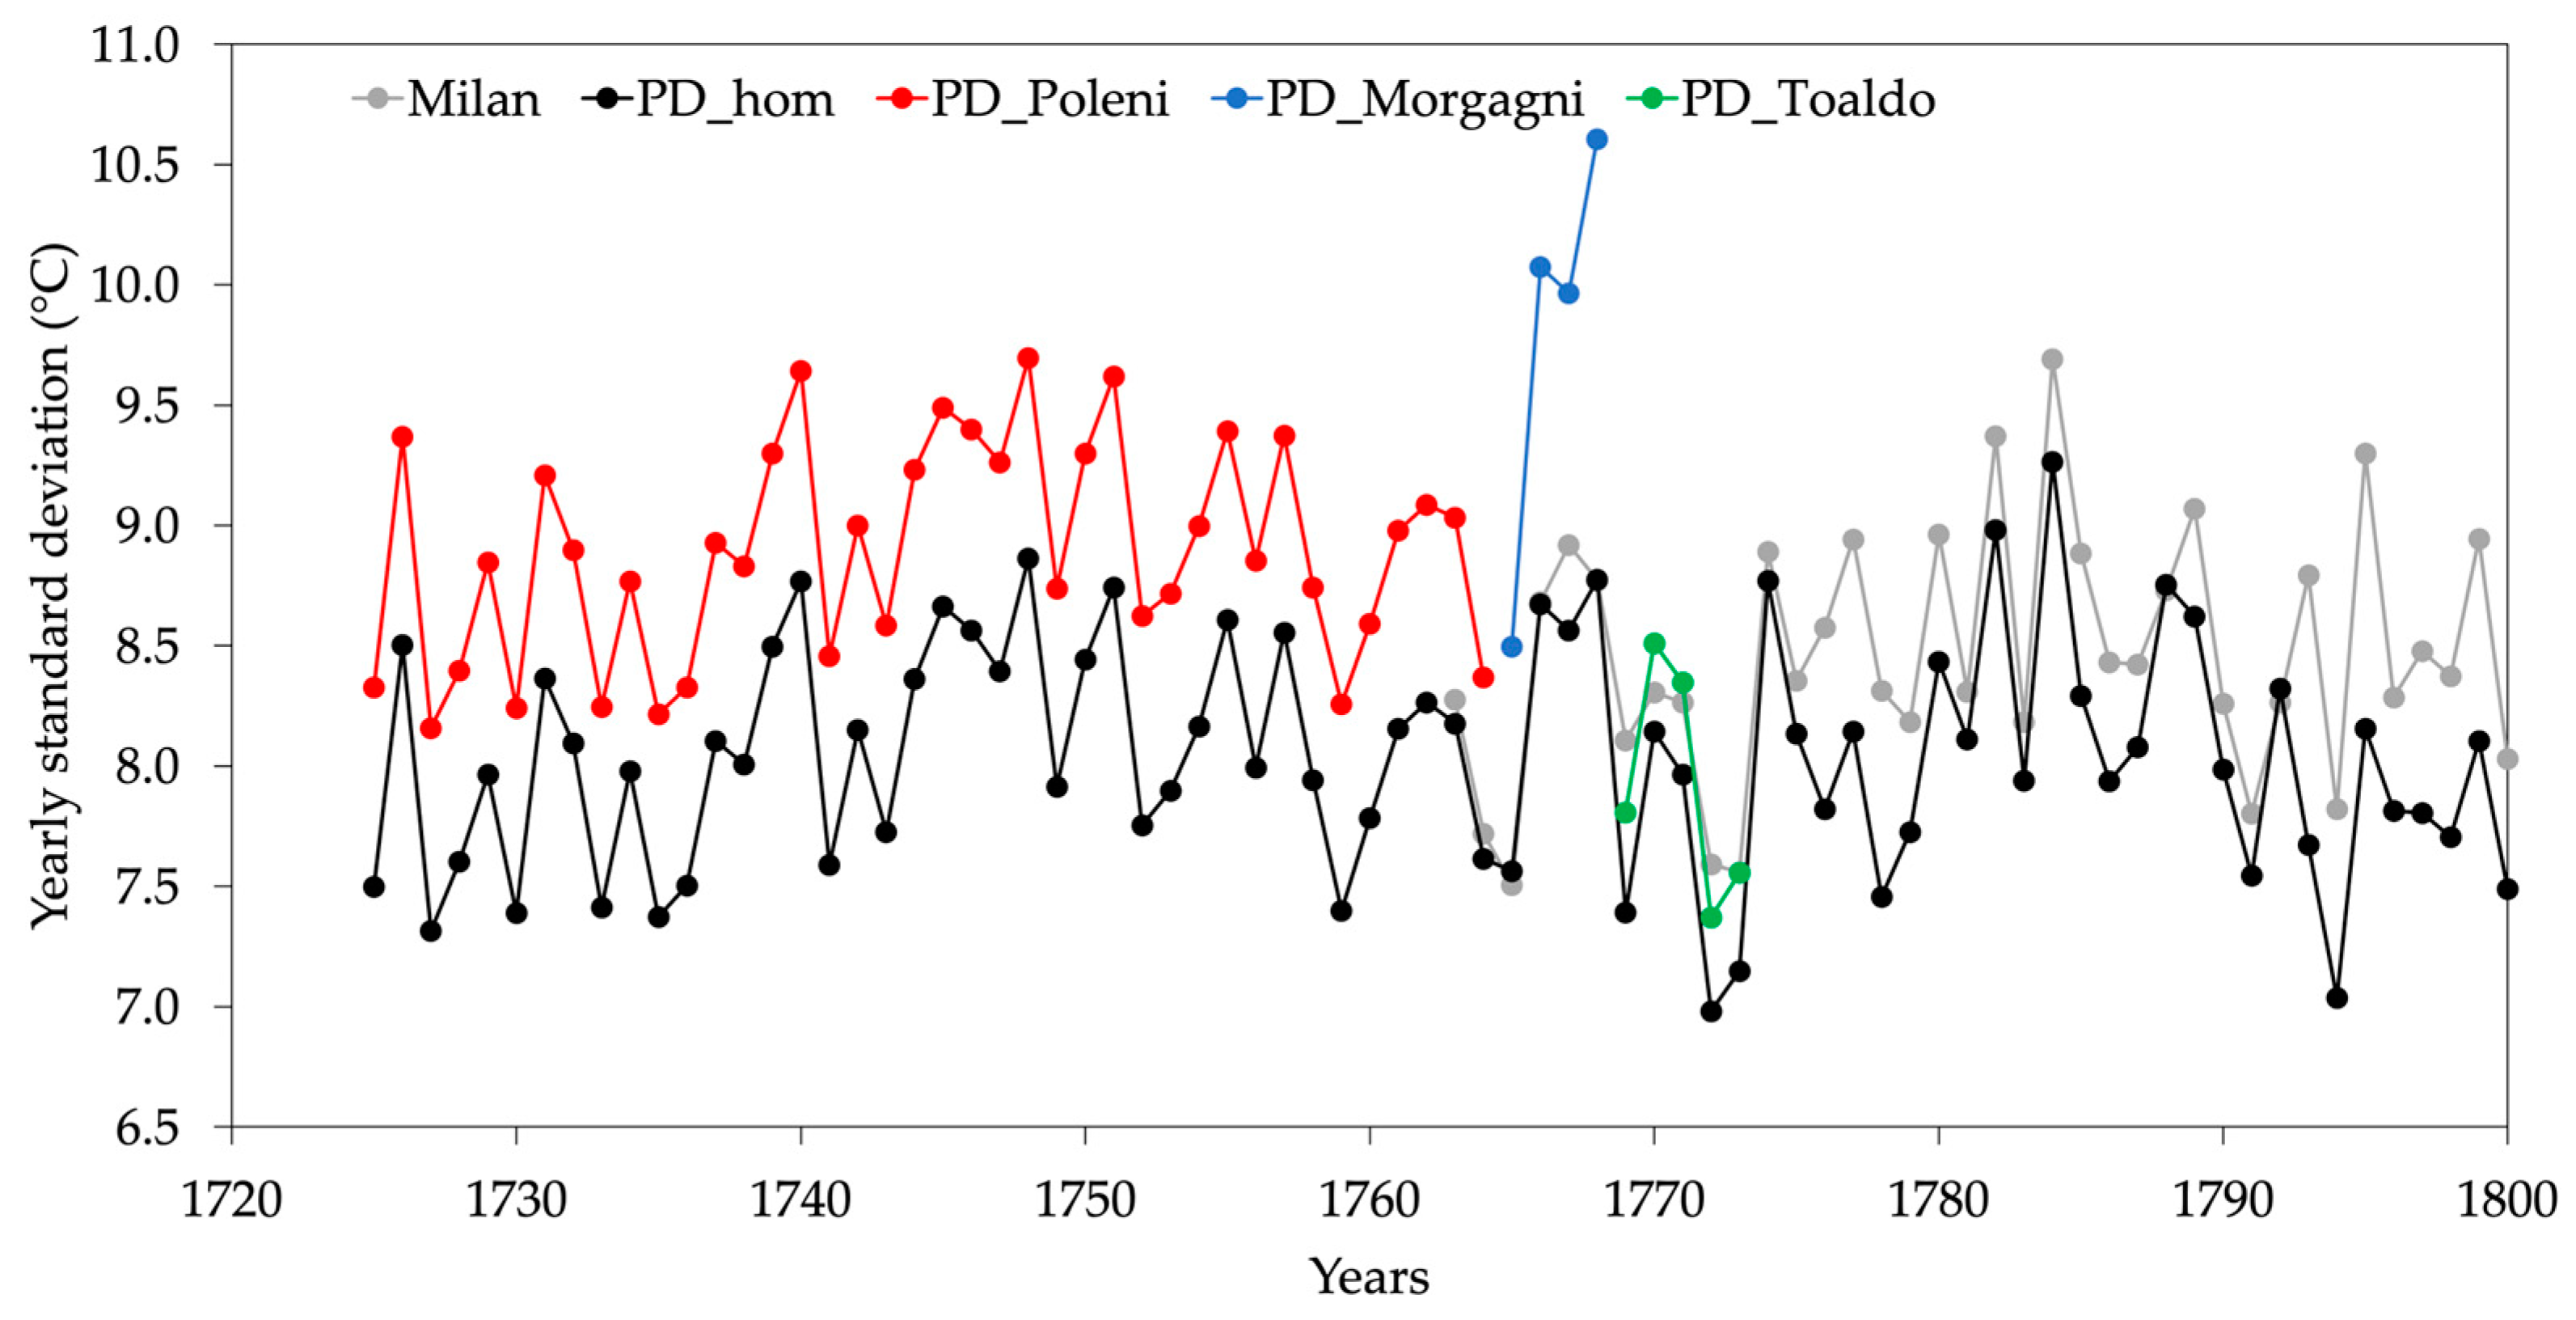
The study of the evolution of the standard deviation of both the original and corrected time series can provide further evaluation of the procedure applied. In Figure 9, the values of the standard deviation of the untouched PD_Poleni, PD_Morgagni and PD_Toaldo are shown, together with PD_hom and Milan series. The corrected series PD_hom exhibits more continuous oscillations and more consistent behavior with respect to the series of Milan. In fact, after 1774, the variability of temperature in Milan is always higher than the PD_hom’s one; therefore, a similar tendency also in the previous decades is expected [28]. Indeed, the variability of the PD_hom series before 1774 precisely shows this behavior, being below the Milan values most of the time. This analysis points out that not only the mean values, but also the variability of the daily data, have been improved in the final series. From 1774 to 1800, the mean difference between the standard deviation of PD_hom and Milan is −0.5 ± 0.1 °C, while during 1763–1773 it is −0.2 ± 0.1 °C, values which are not significantly different according to the t-test.

Figure 9.
Yearly standard deviation of the daily mean temperature of the series of Milan (1763–1800, gray), PD_hom (1725–1800, black), PD_Poleni (1725–1764, red), PD_Morgagni (1765–1768, blue), PD_Toaldo (1769–1773, green).
3.6. Change-Point Analysis
The analysis of the change-points is essential for separating climate signals from statistical artifacts. The same pool of absolute tests used to analyze the modern series of Padua in Stefanini et al., 2023 [8] has been applied in this case to the yearly series. The test provided by Climatol, used in Stefanini et al., 2023 [8], which takes as input the daily data, has not been considered because of the scarcity of other stations covering the whole period of PD_hom. The Mann–Kendall test [29,30,31] applied to the yearly mean-temperature series of PD_hom detects a significant trend (p-value < 0.01), which must be considered when discussing the results, which are shown in Table 4.
Table 4.
Results of absolute-homogeneity tests applied to yearly mean temperatures in Padua, Milan, Bologna, and Turin over the common period 1763–2023.
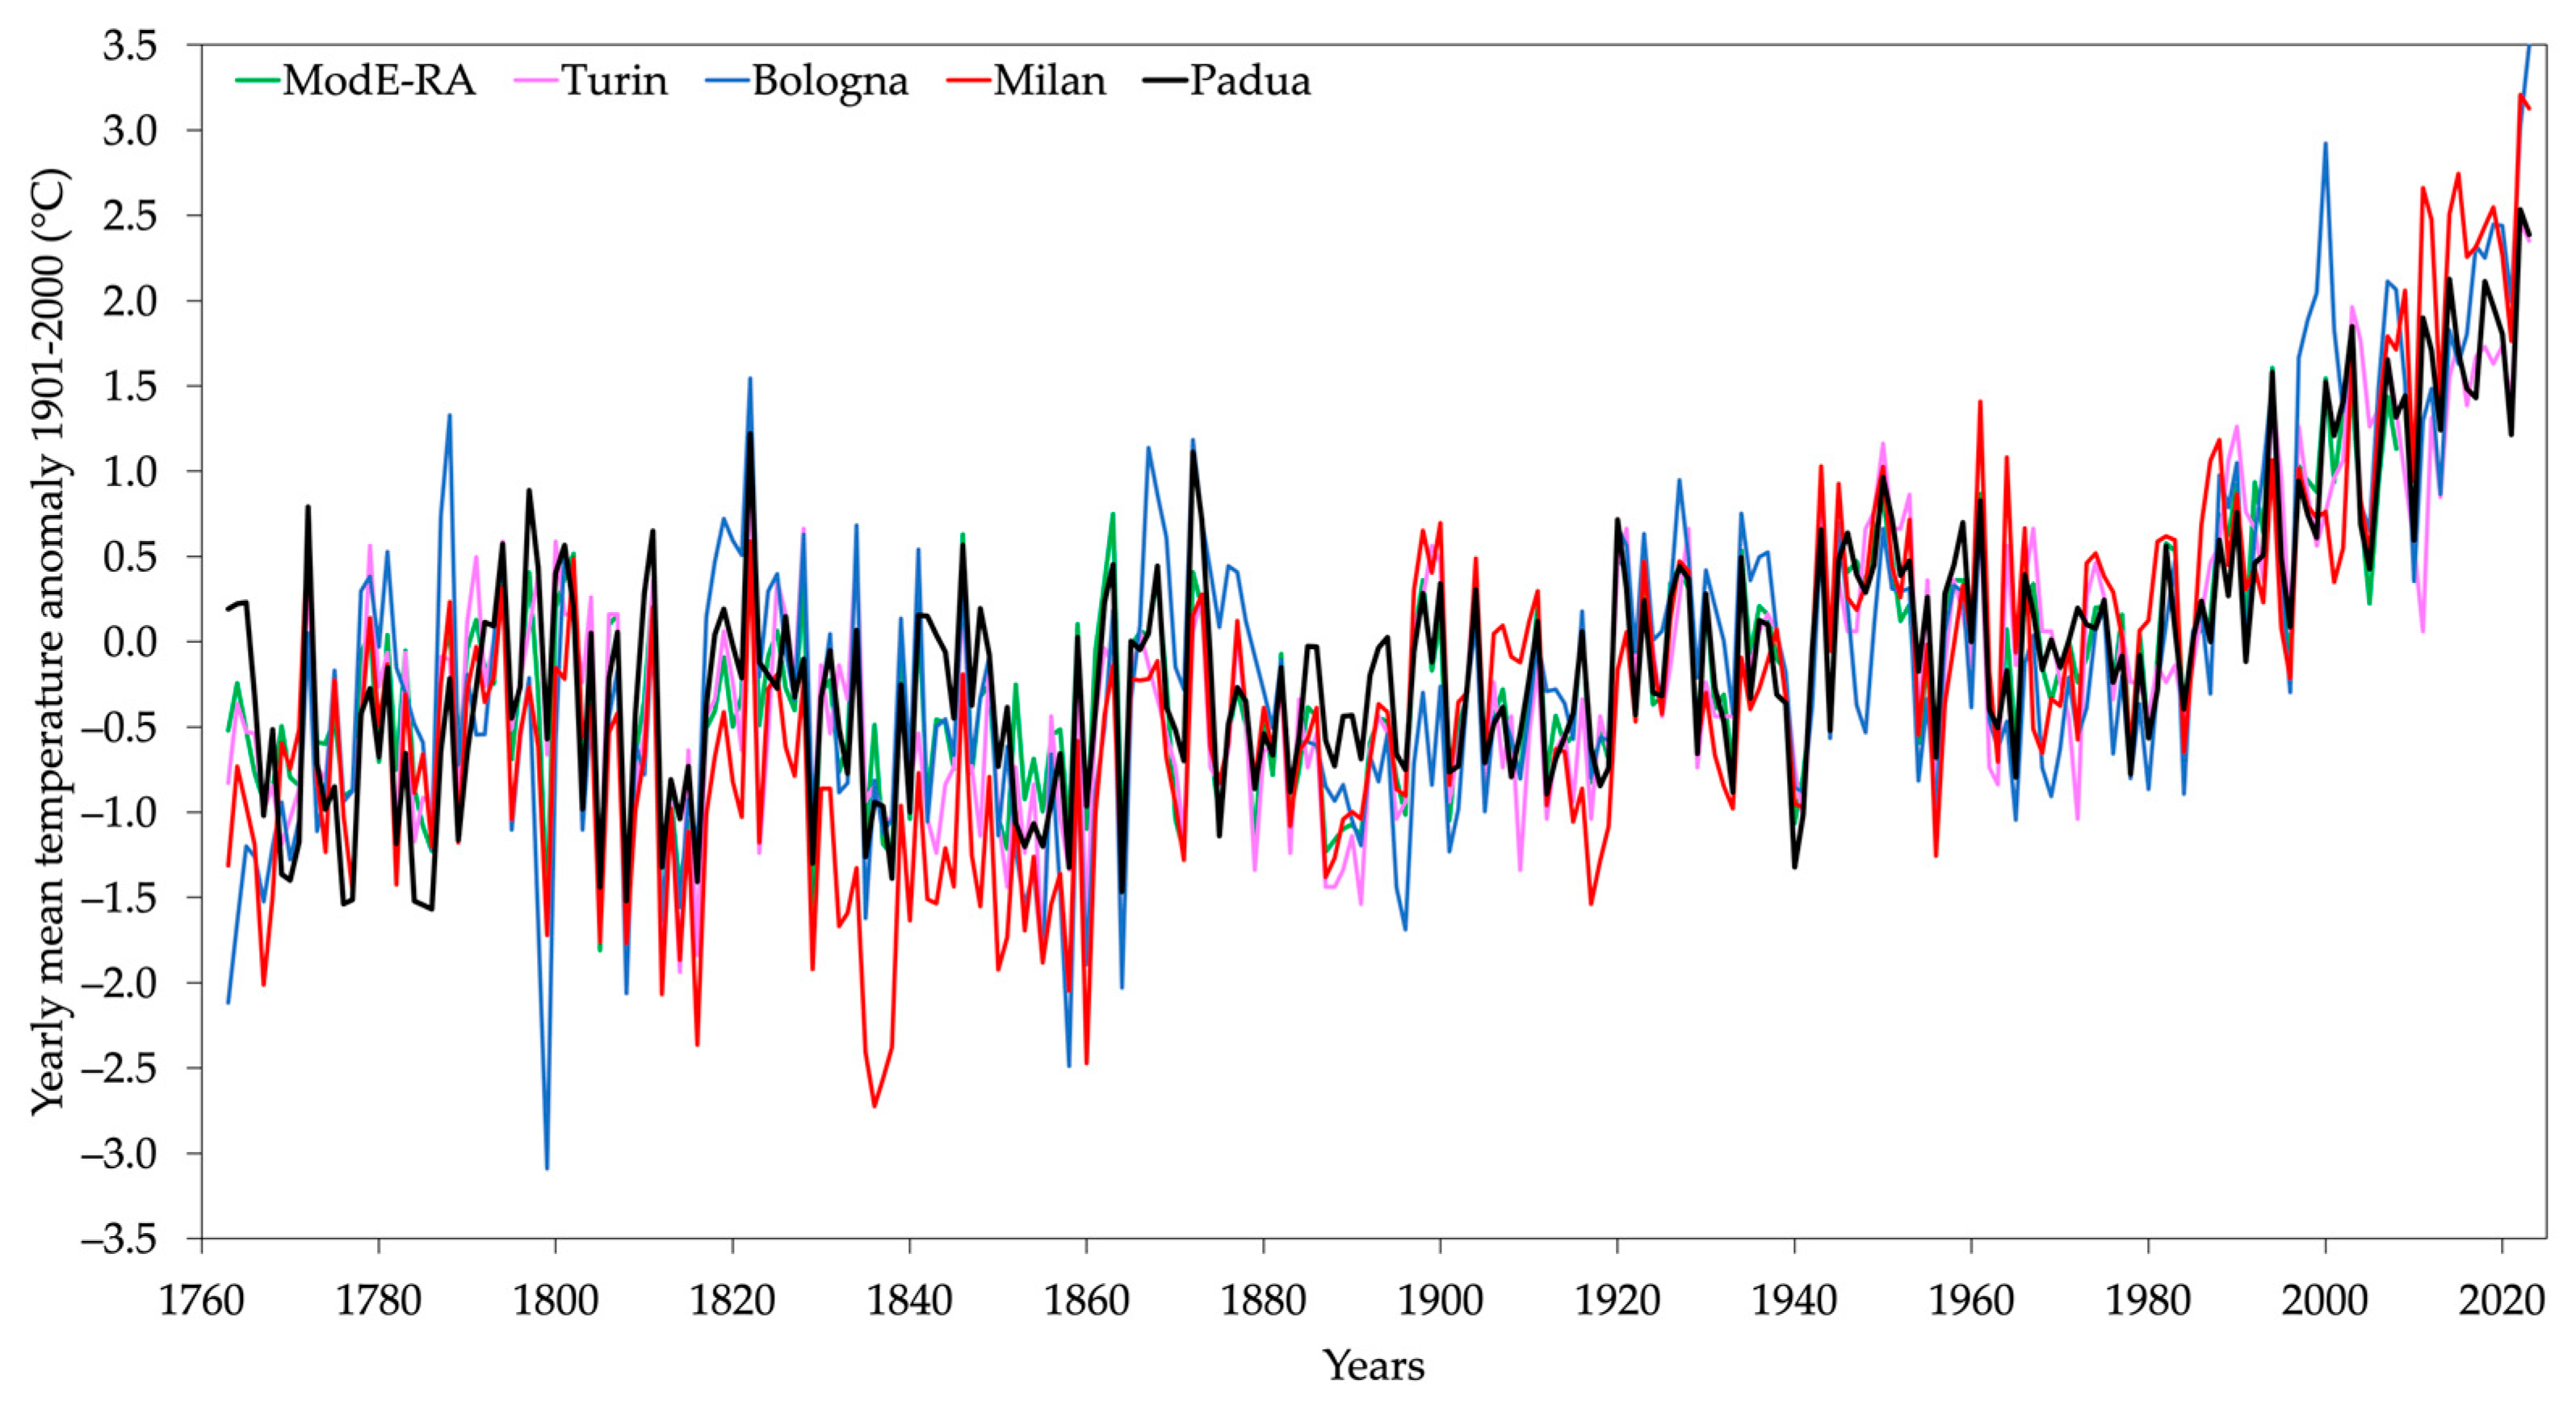
Three absolute tests detect a change-point for Padua in 1919, precisely the last year considered for the PD_Specola series (PD_Idrografico starts in 1920). Other tests applied to other contemporary Italian stations, i.e., Milan, Bologna and Turin, find that year too (Table 4), leading to the conclusion that it is more likely related to a climatic transition rather than a statistical artifact. Moreover, it can be related to the use of different measurement methodologies introduced by the institution of the “Servizio idrografico e mareografico italiano”, the national weather and marine service, founded at the end of the 1910s. The 1993 change-point is found by two absolute tests, which probably depends on the robust warming starting around that period, as the same tests applied to the other stations indicate quite similar change-points at the end of the 1980s or in the 1990s. Therefore, the PD_hom series can be considered homogeneous. Figure 10 shows the time series of the yearly temperature anomalies (with respect to 1901–2000 climatology) from 1763 to 2023, the period for which the datasets of the Italian stations considered are complete.

Figure 10.
Yearly mean-temperature anomalies of Padua (PD_hom, black), Milan (red), Bologna (blue), Turin (pink), and ModE-RA (green) for the 1763–2023 period (until 2008 for ModE-RA).
3.7. Climate Trends and Extremes
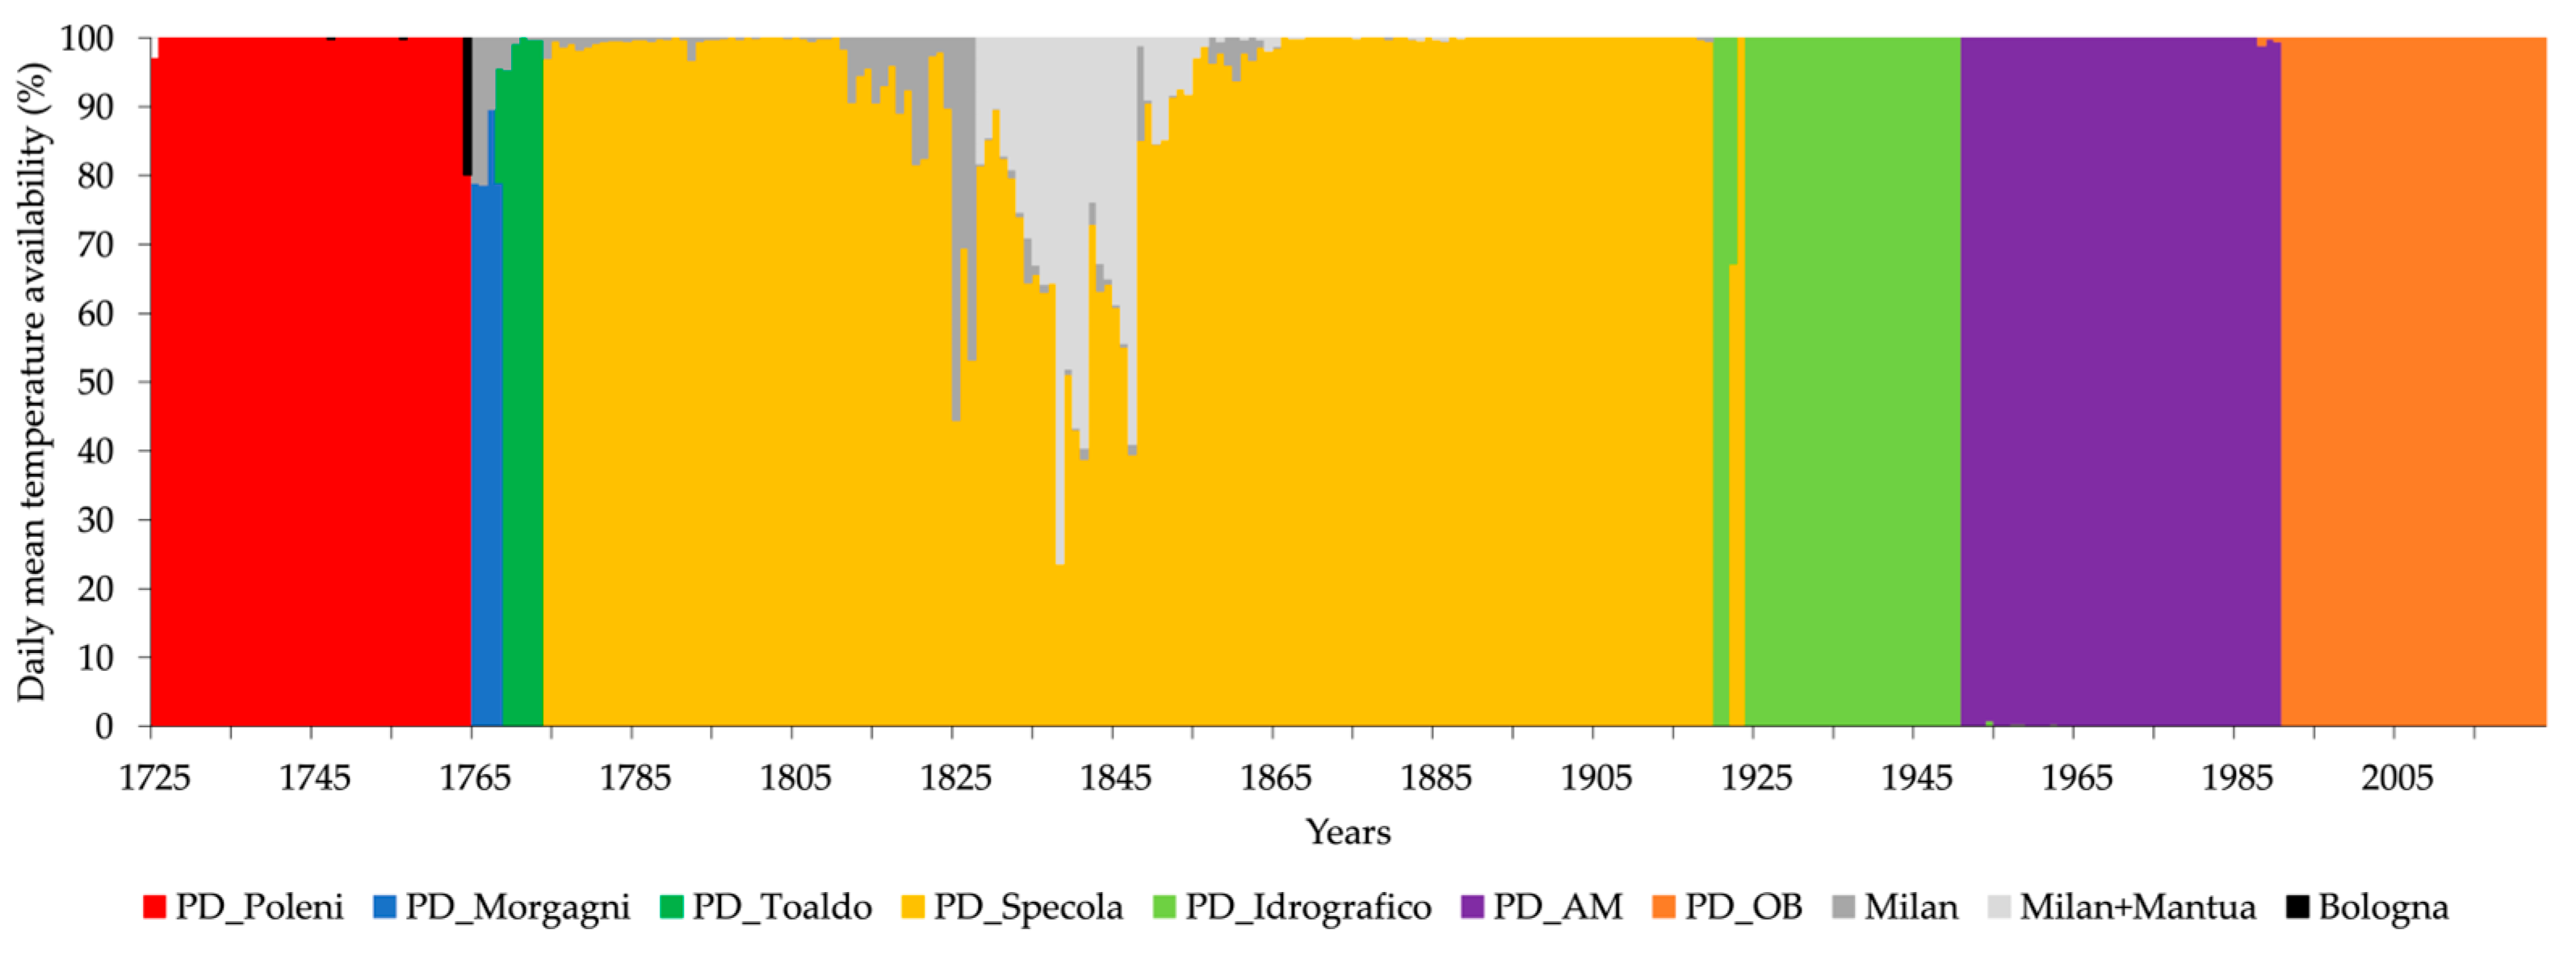
Padua temperature data availability is summarized in 11. Seven main periods can be distinguished: from 1725 to 1764, Giovanni and Francesco Poleni’s observations (gaps filled with Bologna converted observations [4]); from 1765 to 1768, Morgagni’s measurements, and Toaldo’s observations from January 1769, ending in 1773 (if absent, corrected values from Milan are considered). Starting from 1774, extreme daily values are available. Observations from 1774 to 1919 (and part of 1922 and 1923) are derived from the Specola observations, recovered within the IMPROVE project, with some gaps around the mid-19th century which were infilled with Milan and/or Mantua values [7]. From 1920 to 1950, observations coming from the Water Magistrate logs are used, while records from 1951 to 1990 come from the Italian Air Force and from 1991 to 2023 from the Botanical Garden. Therefore, as shown in Figure 11, all the gaps in the sub-series have been infilled by means of contemporary observations from other sub-series of Padua or other stations. Hence, all years are complete except for 1725, which has only a few days missing as the very first day of the series is 12 January.
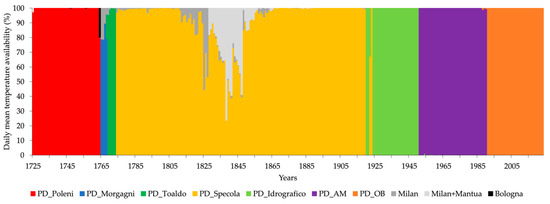
Figure 11.
Availability and source of each sub-series for the Padua daily temperature observations. From 1774, both minimum and maximum values are available, while before, only mean values are present.
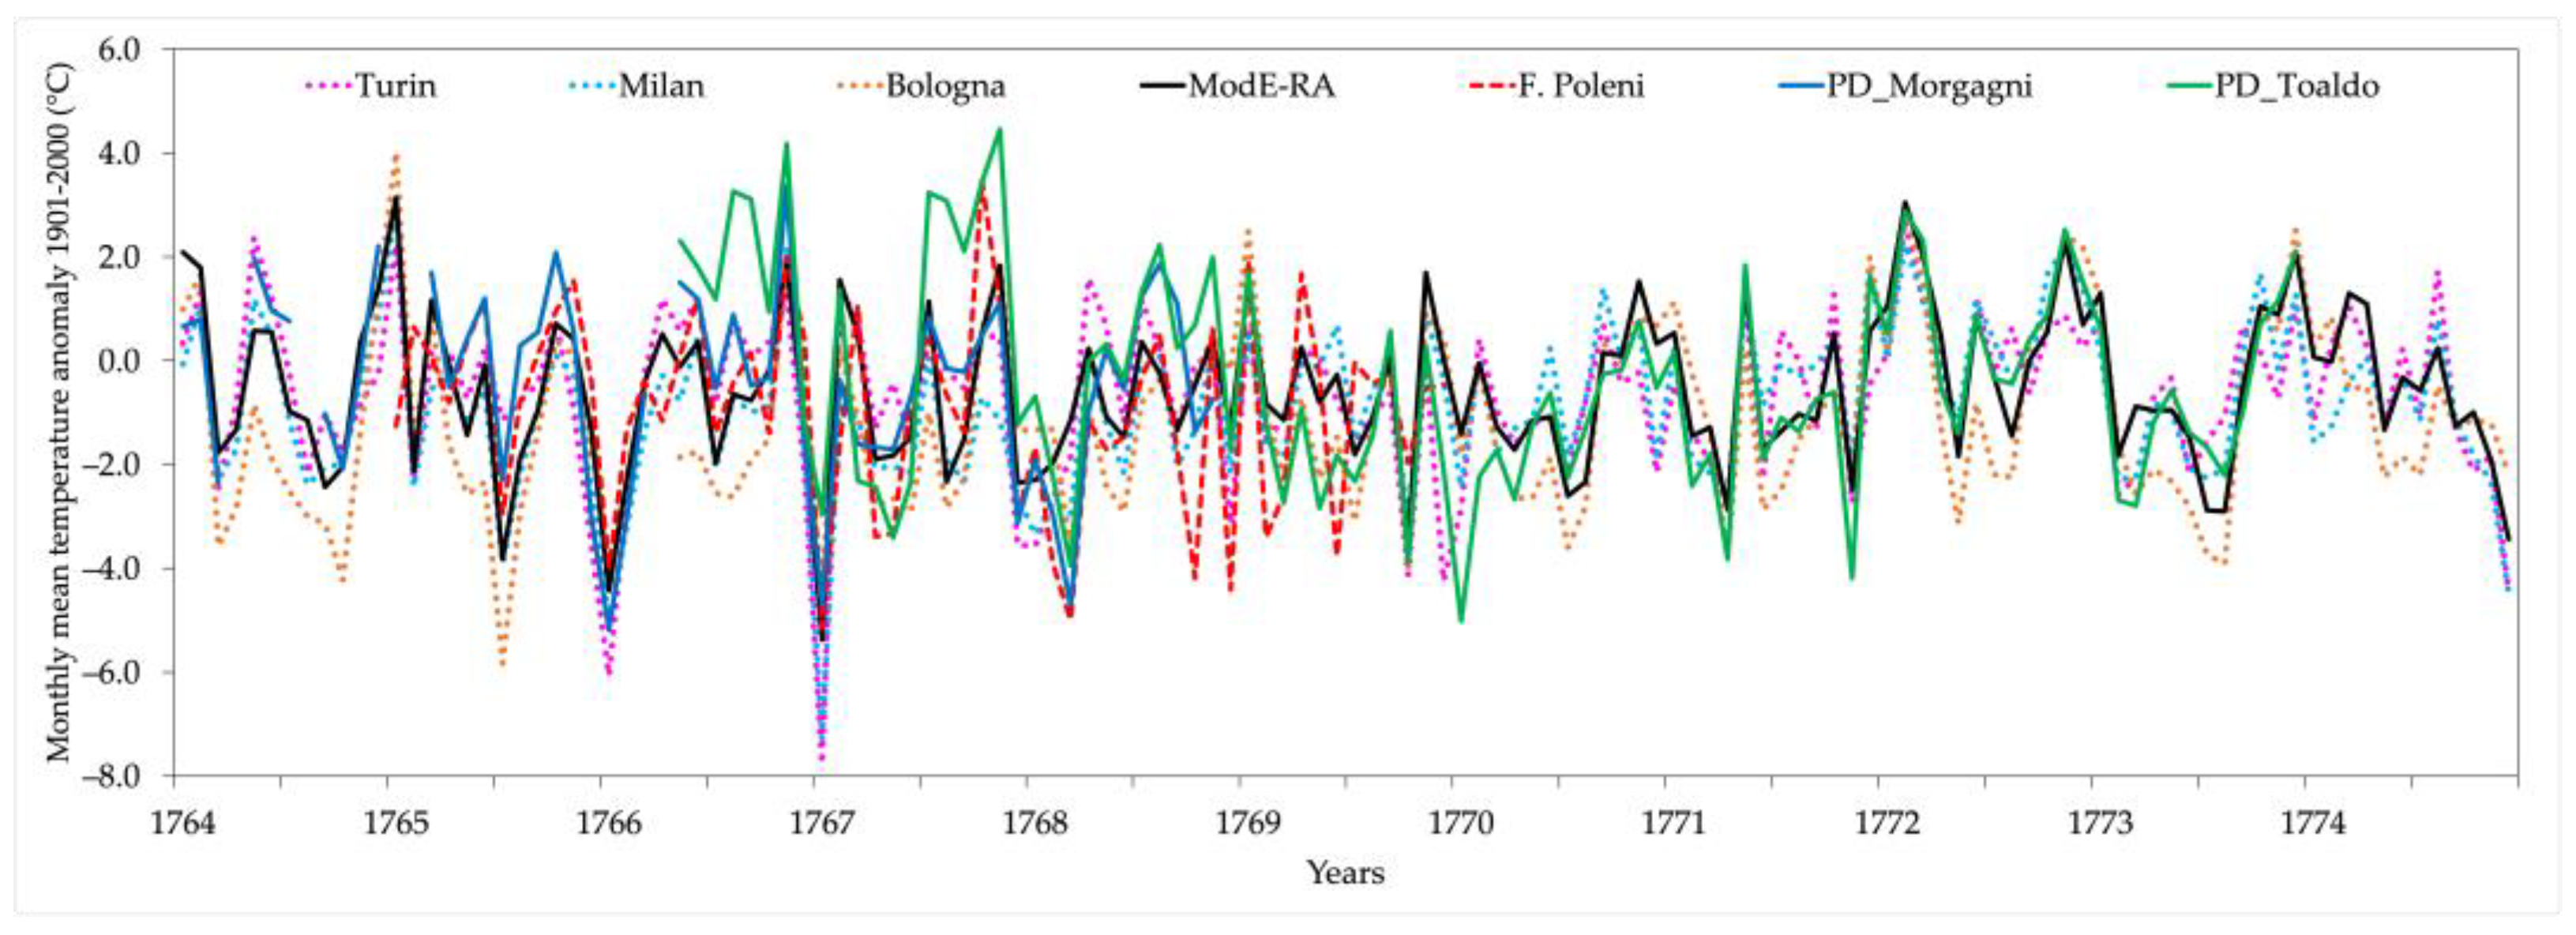
In this study, the daily observations recorded from 1765 to 1773 are for the first time fully corrected and homogenized to the rest of the Padua series. In Figure 12, a comprehensive chart of all the series available over those years is reported (as with monthly anomalies, for proper comparisons). Francesco Poleni’s monthly averages (yellow) are quite noisy with respect to the other series (possibly because of some missing days in computing the monthly averages calculated by Toaldo), but monthly temperatures higher or lower than the climatological averages are correctly detected. Moreover, Toaldo’s observations corrected from 1766 to 1767 are also represented, showing that many months until the end of 1767 are outliers with respect to the other series. This is probably due to the different location of the instruments before and after November 1767, and justifies the use of his measurements from January 1769 only, after the Morgagni’s series end, as explained in Section 3.3. Overall, the agreement between the other series is good, both in absolute values and variability.
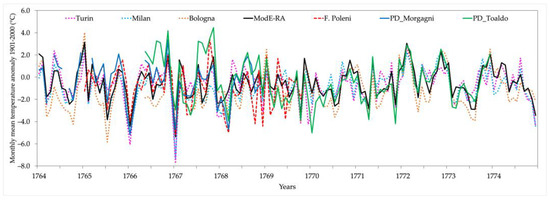
Figure 12.
Monthly mean anomalies (with respect to 1901–2000) for 1764–1774 of the ModE-RA reanalysis (black), Padua homogenized series (red: measurements started by Giovanni Poleni and continued by his son Francesco until 1764, red: surviving averages of Francesco Poleni’s observations 1765–1769, blue: Morgagni’s observations until 1768, green: Toaldo’s observations 1768–1773), and other stations (pink: Turin, cyan: Milan, orange: Bologna).
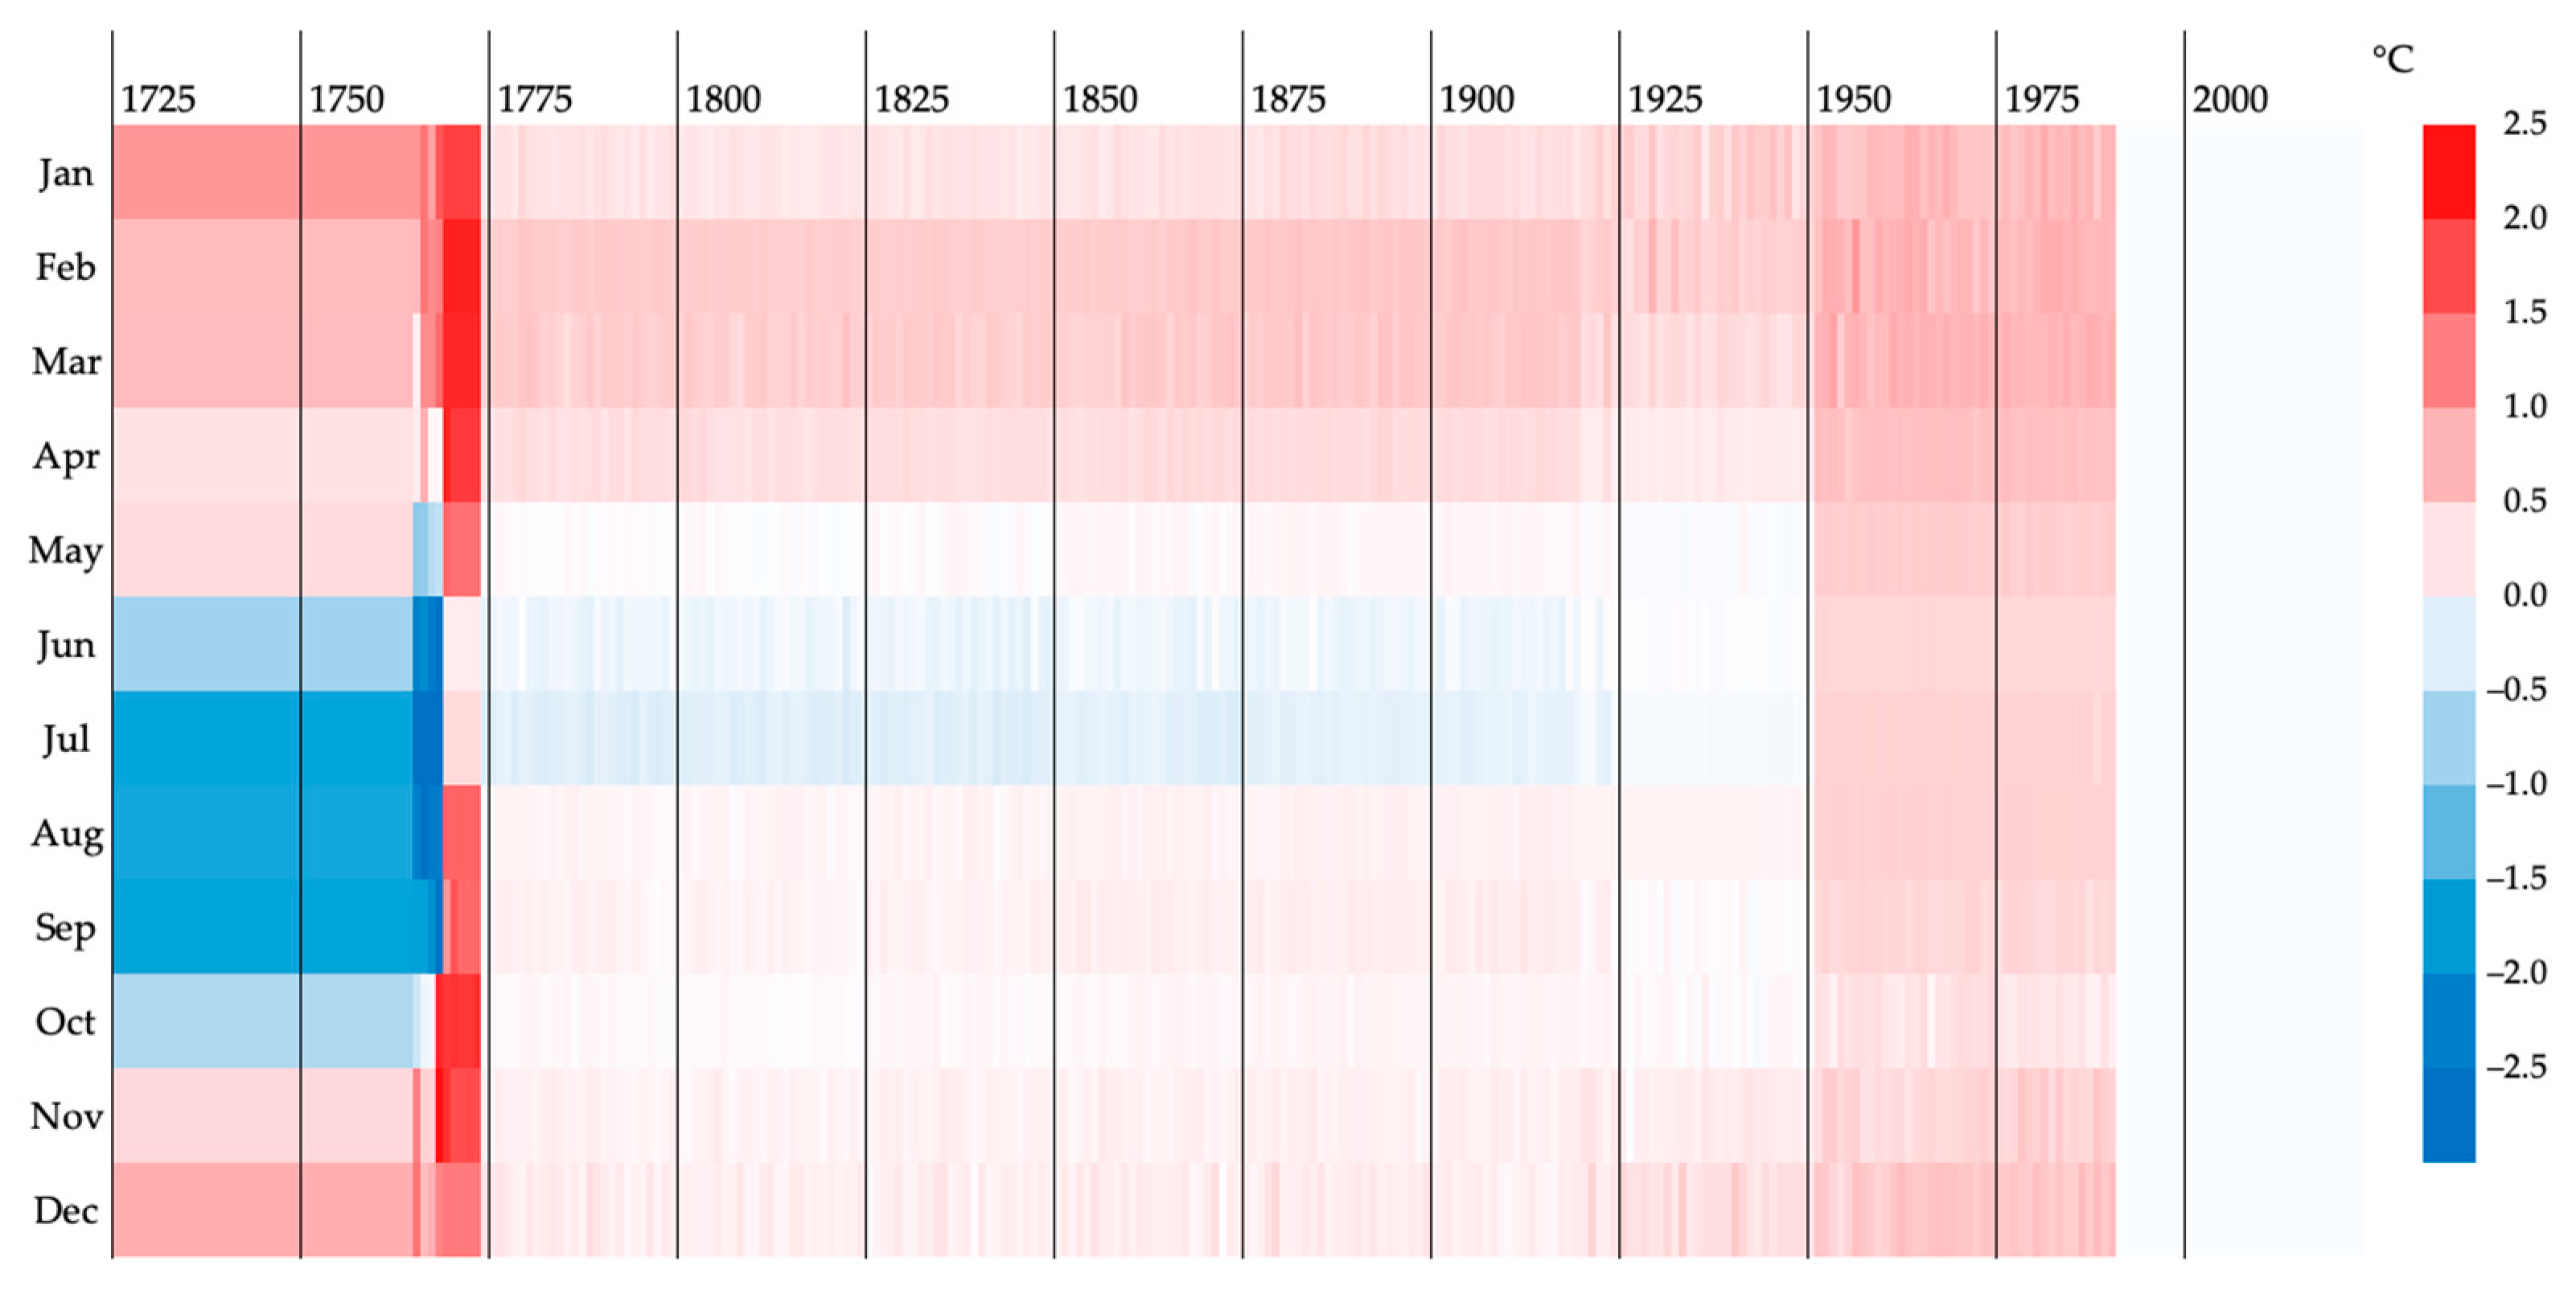
The homogenization procedures mainly affected the ancient observations of before 1774, as can be seen in Figure 13, which shows the monthly differences between the original and corrected series. In 1725–1773, monthly averages of the homogenized series have changed up to 2.5 °C (in absolute value) with respect to the original data. After 1774, minor corrections have been applied, most of the time less than 0.2–0.3 °C and rarely more than 0.5 °C. The largest corrections are from 1765 to 1773, in particular, large negative corrections for the summer during Morgagni’s period and large positive ones for several months (only June and July have minor adjustments) during Toaldo’s years.
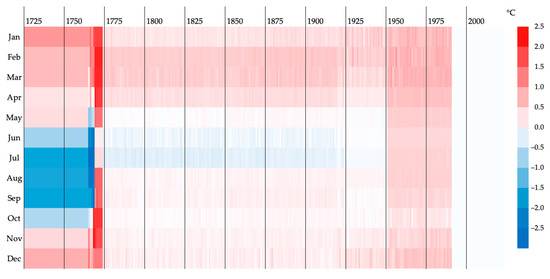
Figure 13.
Monthly differences between the original Padua mean-temperature observations and the homogenized series PD_hom.
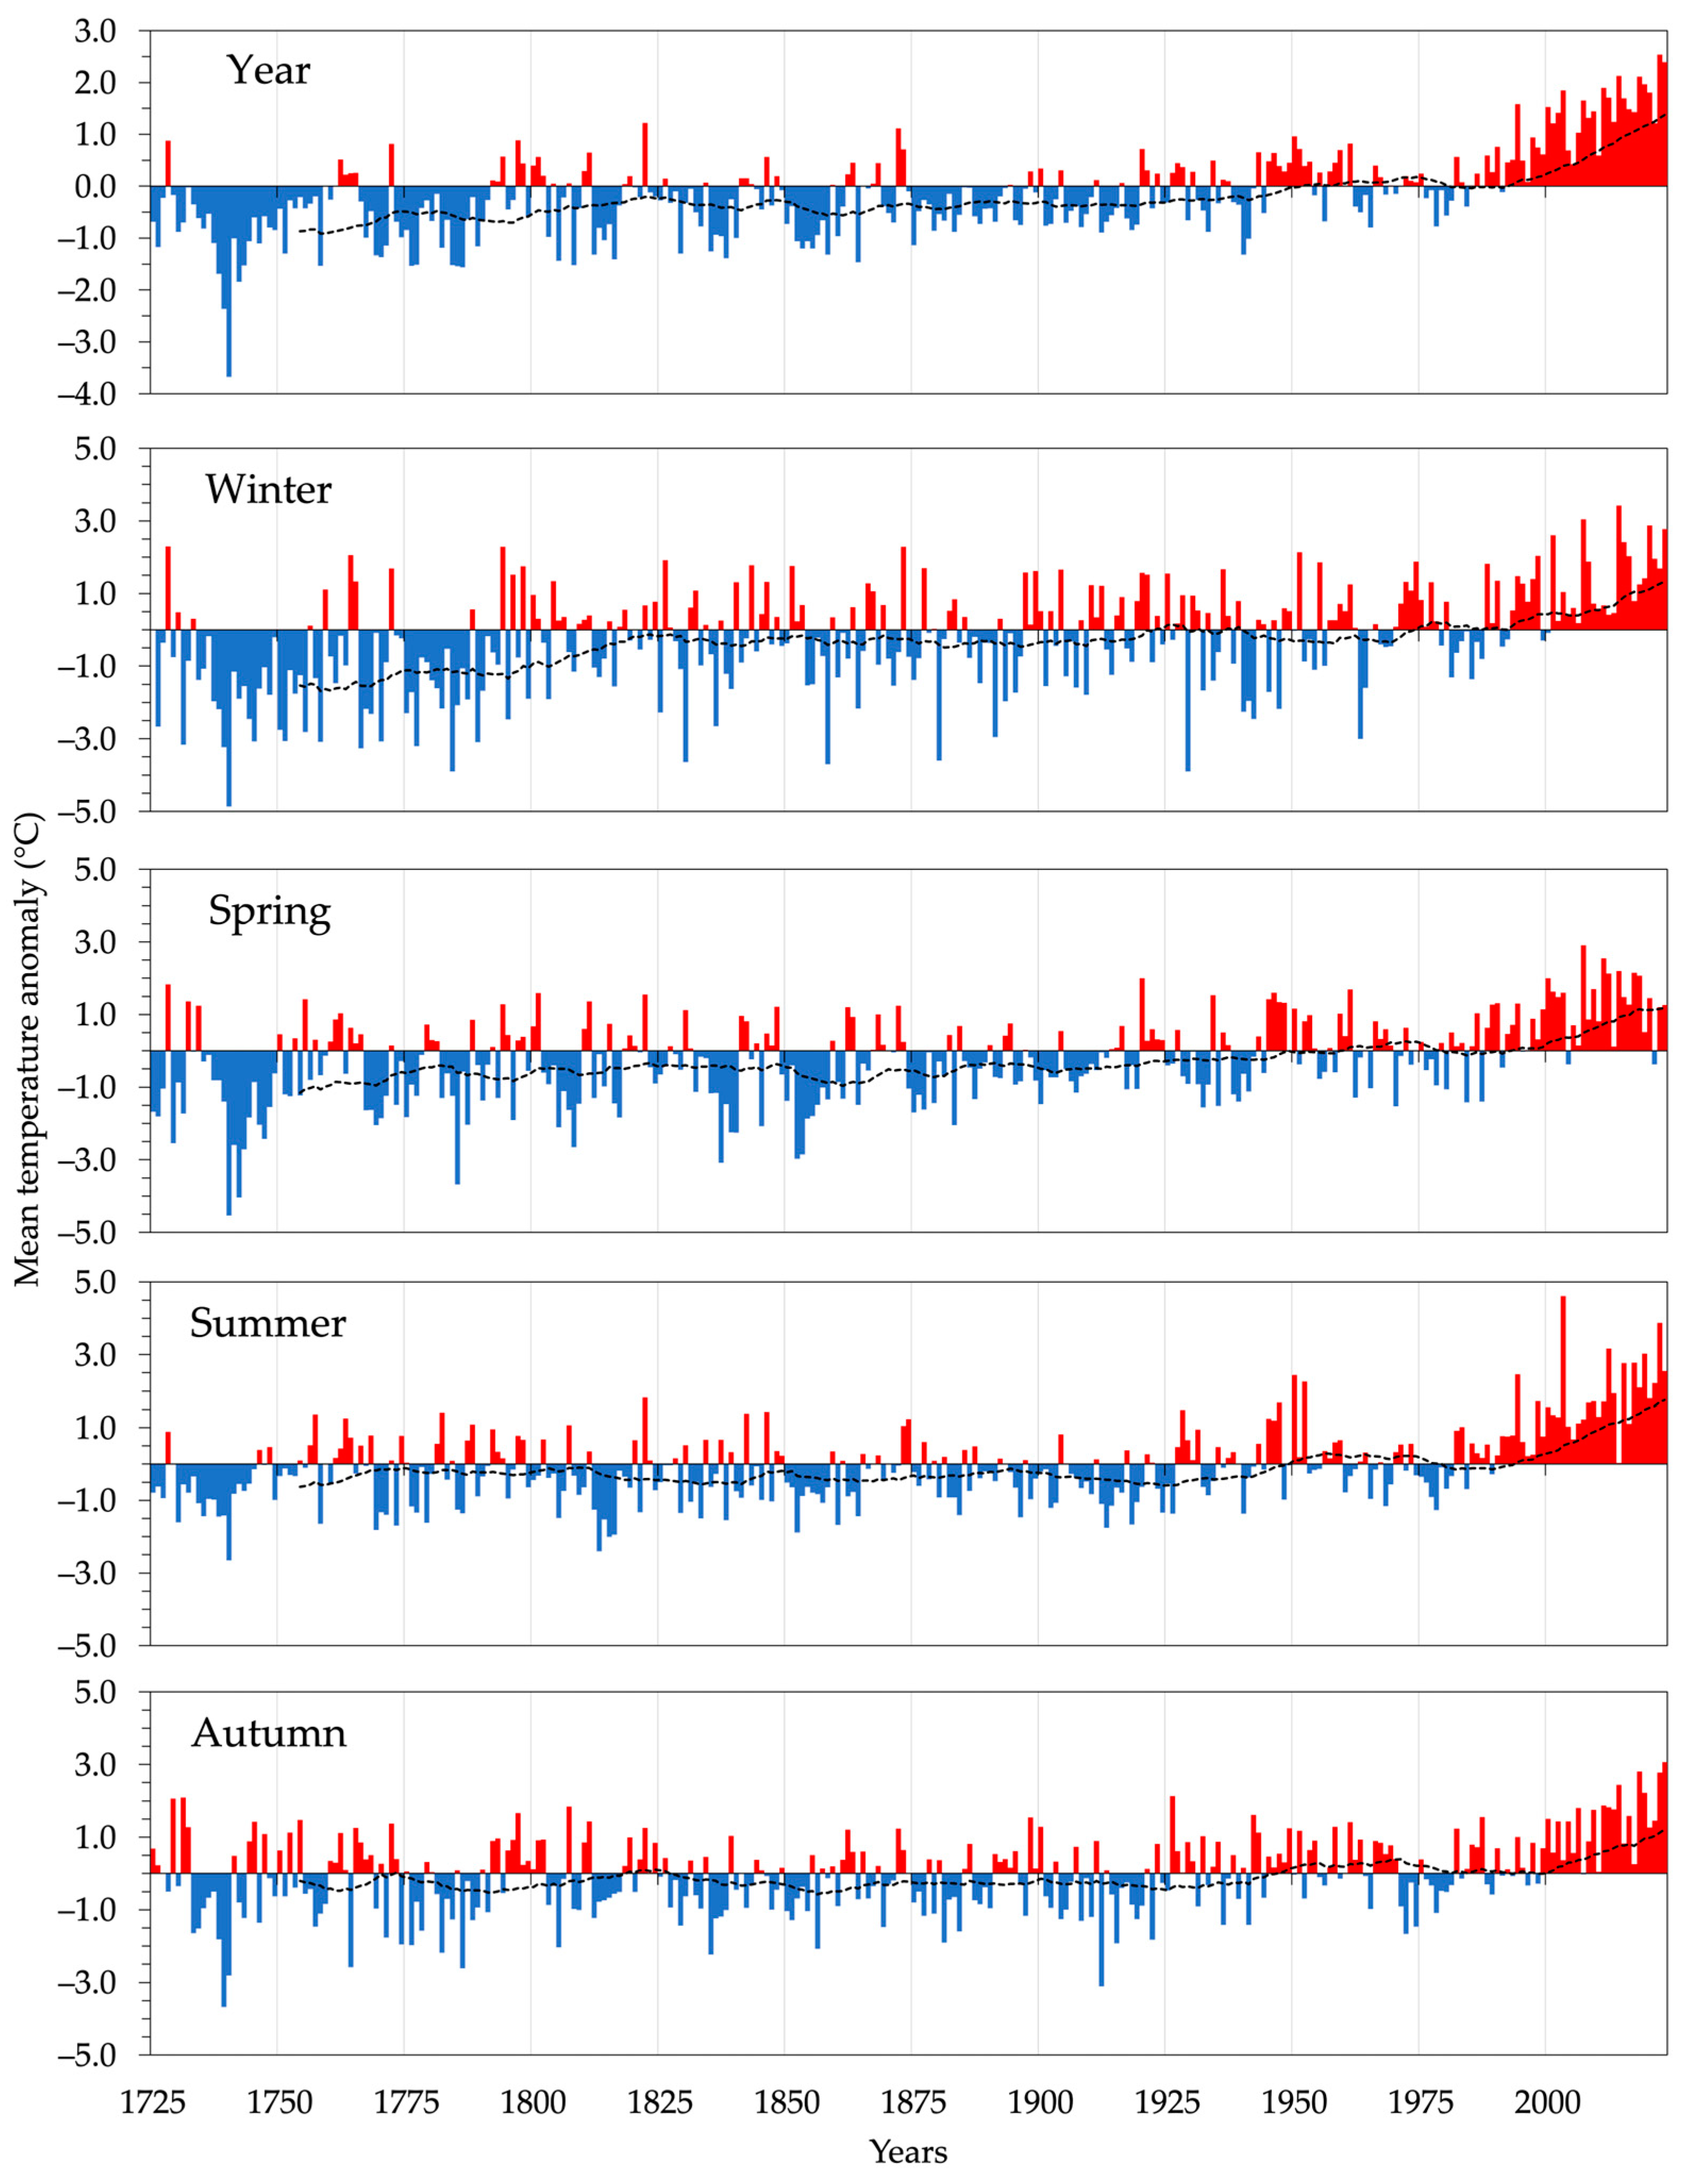
The final yearly and seasonal temperature anomalies of Padua for the whole 1725–2023 period are reported in Figure 14. It is noteworthy to see that the most recent years of the series, 2022 and 2023, are the warmest and the second warmest of the entire series, +2.5 °C and +2.4 °C above the 1901–2000 climatological mean, respectively, even though the warmest winter happened in 2014 and the hottest summer in 2003. 1740 was the coldest year, −3.7 °C, with respect to climatology, to which year also the coldest winter and coolest summer belong.
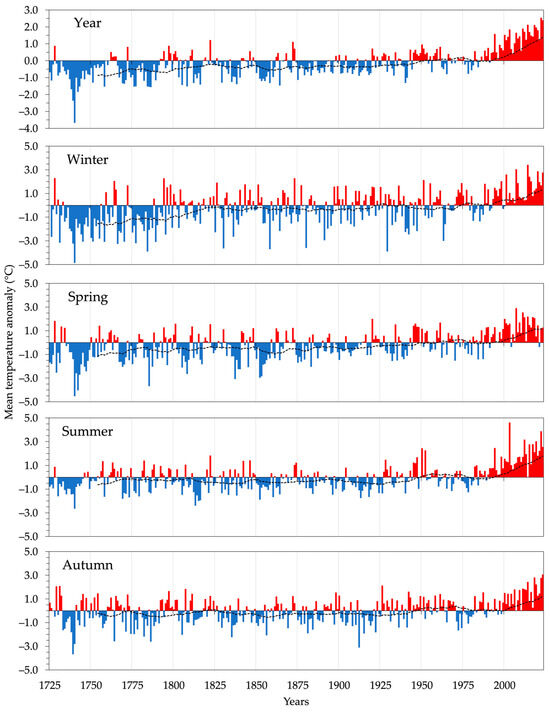
Figure 14.
Yearly, winter, spring, summer, and autumn anomalies (colors) (with respect to 1901–2000) of the homogenized mean temperature of Padua PD_hom (1725–2023) and 30-year moving averages (black dashed lines).
Moreover, from the 1970s, a significant warming started. A maximum increase of +1.8 °C, evaluated by means of a regression line, emerges in the 30-year annual average from 1978 to 2007, which decreased slightly in the most recent interval, 1994–2023, to +1.4 °C. The largest 30-year increase still belongs to the 1737–1766 period, which had a variation of +2.3 °C (similarly to Bologna, which had +2.0 °C, while ModE-RA had +0.7 °C). This was the result of recovering from the very cold years in the late 1730s and beginning of the 1740s, whose causes are not yet fully understood [32,33]. The last time the 30-year variation was negative was in the 1952–1981 period, with −0.5 °C (−0.4 °C Bologna, +0.1° Milan, −0.4° Turin, and −0.1 °C ModE-RA).
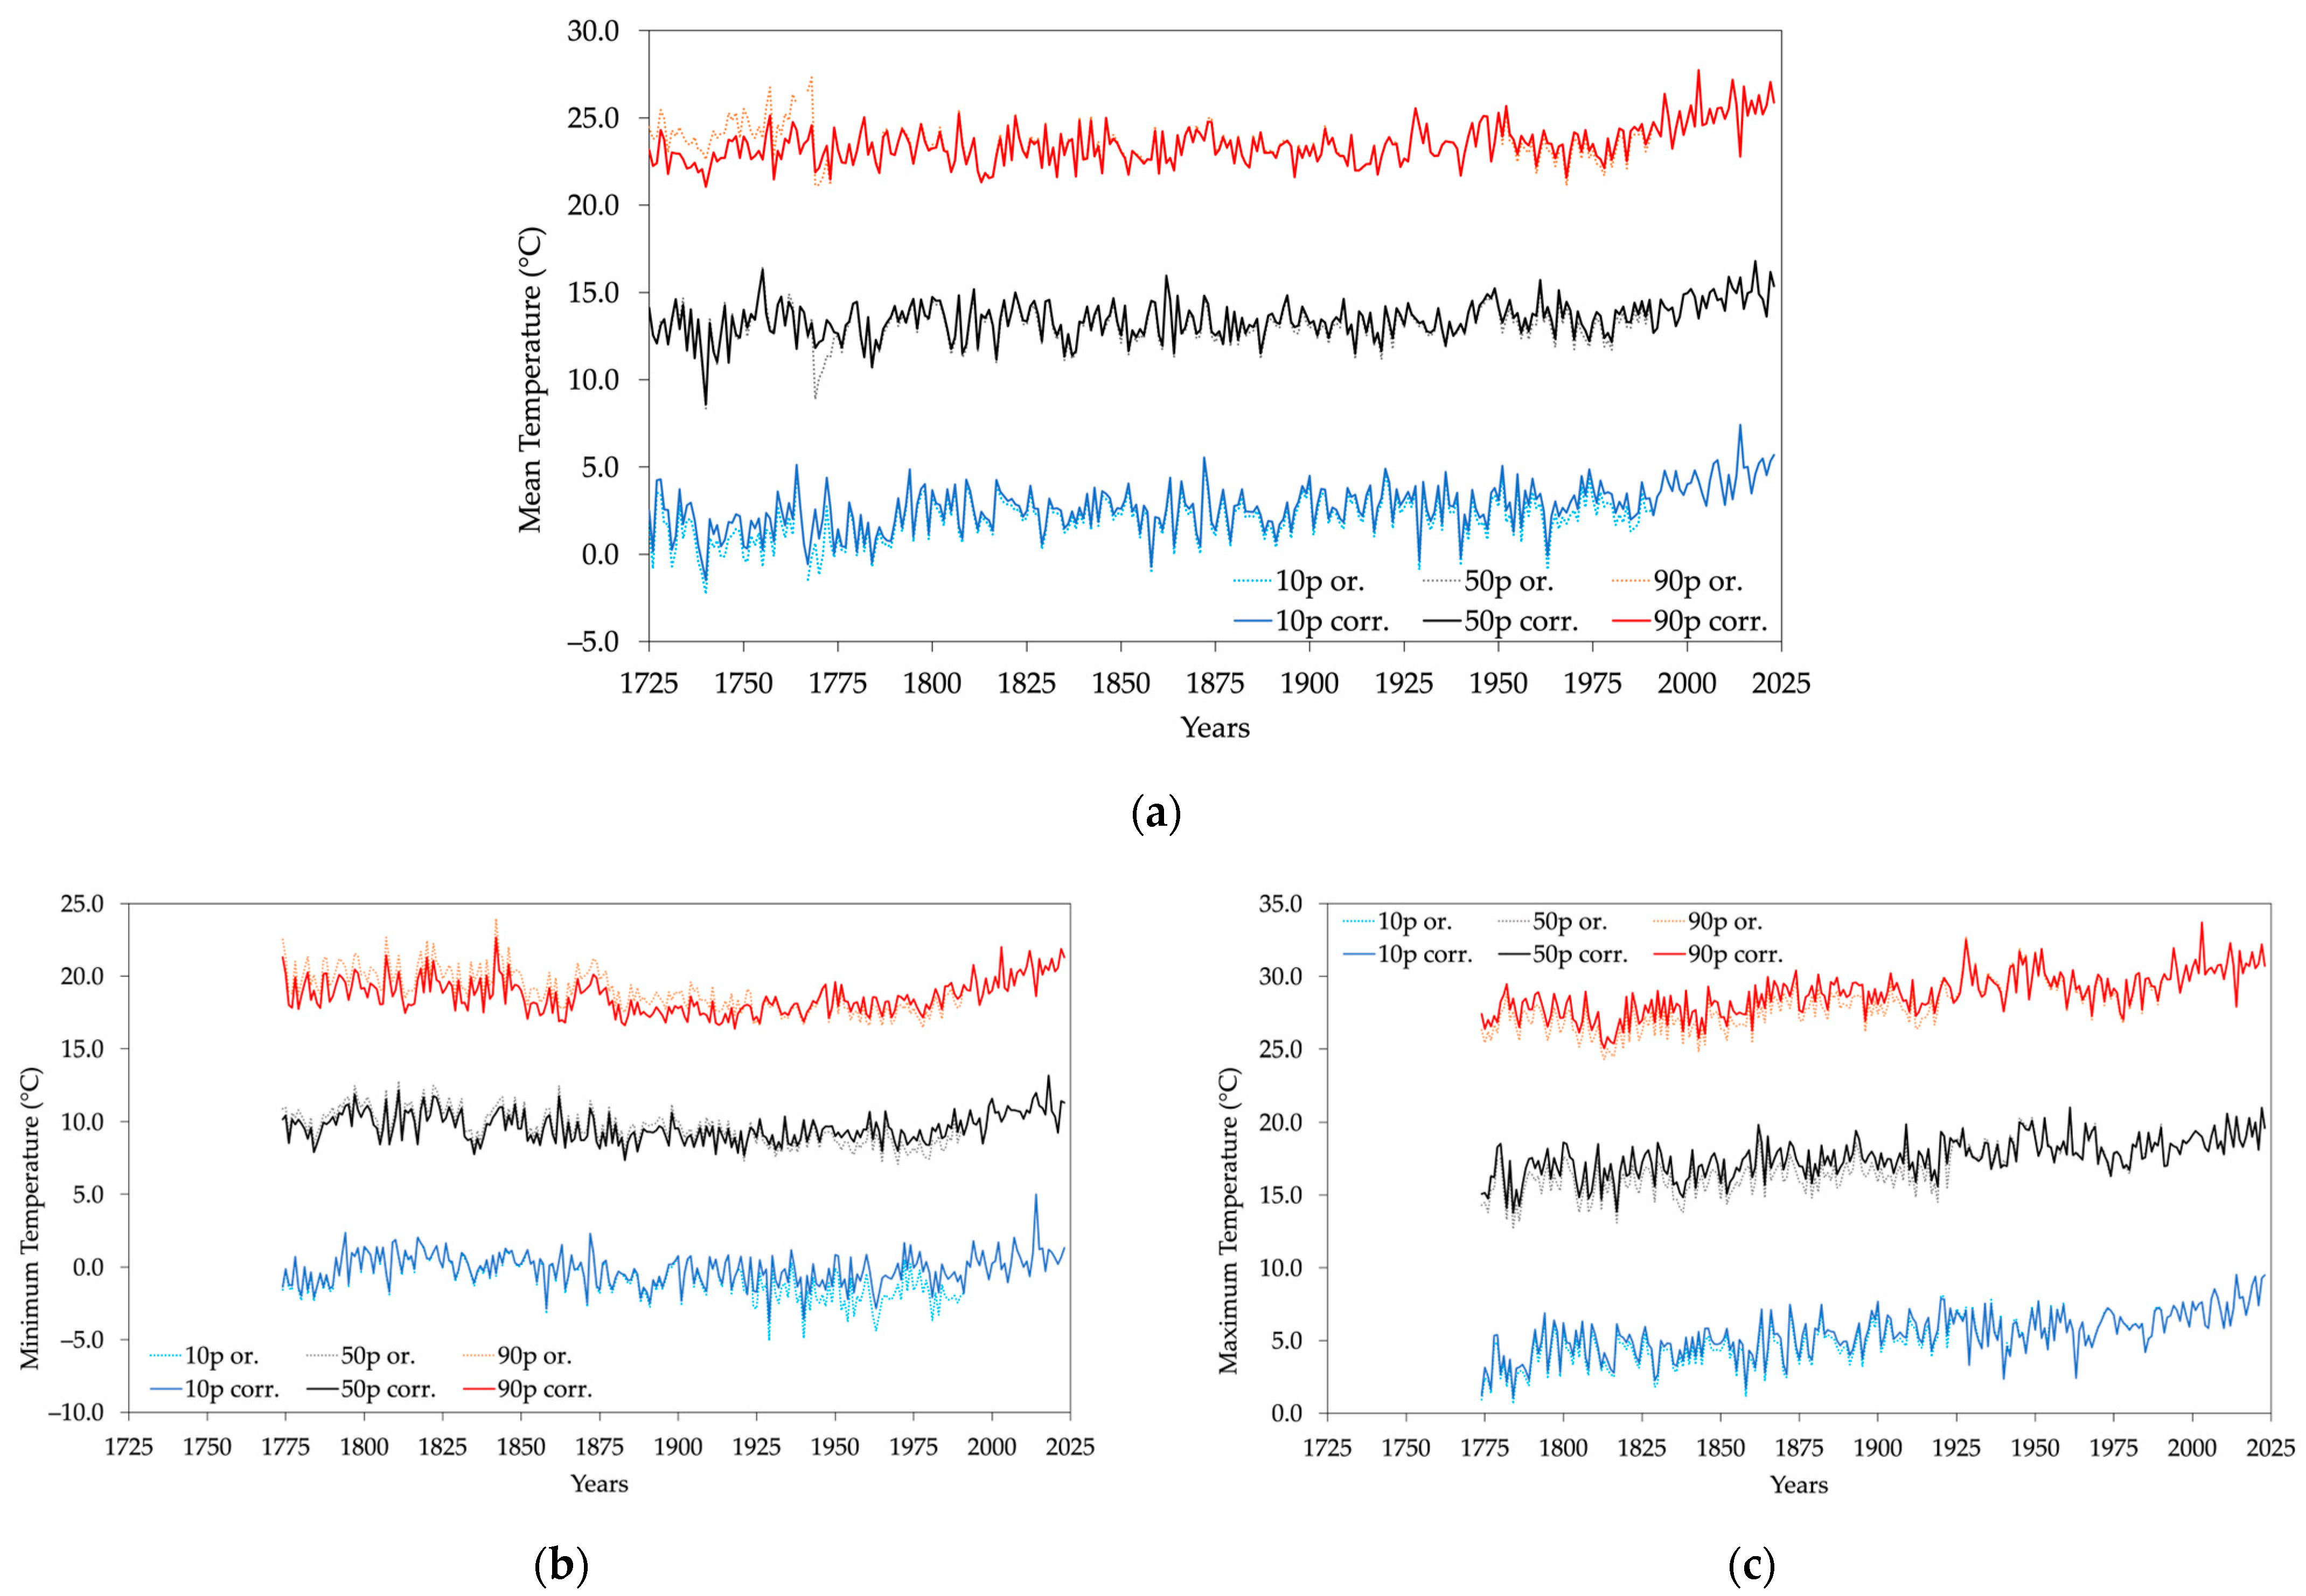
The resulting lowest minimum temperature from 1774 to 2023 is −16.4 °C on 11 January 1985, while the highest maximum temperature is 39.8 °C on 5 August 2003. However, very cold spells happened before, and the −16 °C threshold could have been reached also in February 1740, and even −18 °C in January 1709 [4]. The increased urbanization of the city and its surrounding had affected the minimum temperatures (see also [8,34]), as, for example, at the airport the minimum temperature recorded in January 1985 was −19.2 °C. The event of 11 January 1985 also represents the largest negative anomaly for the minimum temperature series, −16.2 °C below the 1901–2000 climatological average of the first ten days of January. On the other hand, the largest positive anomaly for the maximum temperature belongs instead to 9 April 2011, when 32.6 °C was reached, +16.5 °C above the climatological average. All the extremes of PD_hom for daily minimum, maximum and mean temperature for each month are reported in Table 5. Finally, Figure 15 shows the time series of the 10th, 50th, and 90th percentiles of the mean, minimum and maximum temperatures. Overall, after correction, the extremes exhibit a more homogeneous trend over the years with respect to the original values, with the major changes in the 10th and 90th percentiles of around 1–2 °C in the early period, and less than 0.5 °C afterwards. Minimum-temperature highest extremes have been reduced by 0.9–1.2 °C from 1774 to 1919, and increased by 0.4–0.7 °C from 1950 to 1990, while the lowest extremes had the main changes in the 1920–1990 period, with decreases of 0.9–1.6 °C. Regarding the lowest extremes of maximum temperatures, they have been increased by 0.2–0.9 °C until 1919, while over the same period the highest extremes have been reduced by 0.6–1.1 °C.
Table 5.
Extreme daily values for each month: 1774–2023 minimum and maximum temperature and 1725–2023 mean temperature (°C).
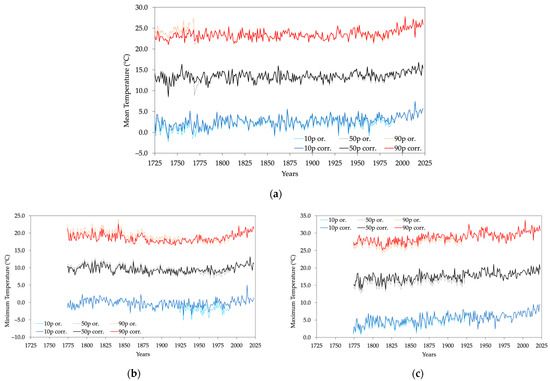
Figure 15.
Time series of yearly 10th, 50th, and 90th percentiles for (a) daily mean temperatures, (b) daily minimum temperatures, and (c) daily maximum temperatures. Both the original and corrected data are shown.
4. Conclusions
In this paper, a methodology to reconstruct a homogeneous series of daily extreme-temperature observations and to correct early daily mean values has been presented. This methodology has been applied to the Padua series, providing a continuous daily temperature series for the city center of Padua, Italy, composed of the minimum and maximum values from 1774 to 2023, and of the mean values back to 1725. Seven main different sub-periods are present in this long time frame, determined by changes of location or observer. Overlapping periods between the sub-series were long enough to evaluate transfer functions from one series to another, with the exception of the records taken at the airport, which have been prolonged by means of the Climatol algorithm, as described in Stefanini et al., 2023 [8], to make use of a larger window for the comparison with the subsequent series (i.e., the observations at the Botanical Garden). Moreover, the possibility of continuing the series according to the indications given in Stefanini et al., 2023 [8], allows for the blending of future observations.
The ModE-RA reanalysis dataset helped the correction of the early records from 1725 to 1773, by assuming a consistent behavior for the simulations, i.e., the absence of relevant inhomogeneities in the considered pixel caused by the assimilation process of the observations, in the 18th century. Thus, the ancient observations are now fully homogenized to the rest of the series, with the daily data from 1765 to 1773 added to the series for the first time. The robustness of this procedure has been tested by comparing the frequency distributions of the temperatures during snowfall events and analyzing the variability of the series.
The availability of this very long and homogeneous series, with the possibility of continuously adding new observations, allows for the exploration of the entire transition from the pre-industrial to the modern era, and a constant monitoring of extreme events in a context of nearly three centuries.
Supplementary Materials
The following supporting information can be downloaded at https://www.mdpi.com/article/10.3390/cli12060086/s1, Table S1: Transfer functions from PD_AM of the period 1 January 1980–31 December 2022 to PD_OB for minimum temperature; Table S2: Transfer functions from PD_AM of the period 1 January 1980–31 December 2022 to PD_OB for maximum temperature; Table S3: Transfer functions from PD_Idrografico of the period 1 January 1951–31 December 1977 to PD_AM for minimum temperature; Table S4: Transfer functions from PD_Idrografico of the period 1 January 1951–31 December 1977 to PD_AM for maximum temperature; Table S5: Transfer functions from PD_Specola of the period 1 January 1920–31 December 1955 to PD_Idrografico for minimum temperature; Table S6: Transfer functions from PD_Specola of the period 1 January 1920–31 December 1955 to PD_Idrografico for maximum temperature; Table S7: Daily mean temperature uncertainties.
Author Contributions
Conceptualization, C.S., F.B., A.d.V. and D.C.; methodology, C.S.; validation, C.S.; formal analysis, C.S.; investigation, C.S.; data curation, A.d.V. and D.C.; writing—original draft preparation, C.S.; writing—review and editing, C.S., F.B., D.C. and A.d.V.; supervision, D.C. All authors have read and agreed to the published version of the manuscript.
Funding
This research received no external funding.
Data Availability Statement
The original and corrected Padua temperature data presented in this study are openly available in FigShare at https://doi.org/10.6084/m9.figshare.25471507.v1 (accessed on 25 March 2024).
Acknowledgments
The authors are grateful to the Historical Archive of the Astronomical Observatory, Padua, for free consultation of the documents.
Conflicts of Interest
The authors declare no conflicts of interest.
References
- Camuffo, D. History of the Long Series of Daily Air Temperature in Padova (1725–1998). Clim. Chang. 2002, 53, 7–75. [Google Scholar] [CrossRef]
- Brunetti, M.; Maugeri, M.; Monti, F.; Nanni, T. Temperature and precipitation variability in Italy in the last two centuries from homogenised instrumental time series. Int. J. Climatol. 2006, 26, 345–381. [Google Scholar] [CrossRef]
- Brönnimann, S.; Allan, R.; Ashcroft, L.; Baer, S.; Barriendos, M.; Brázdil, R.; Brugnara, Y.; Brunet, M.; Brunetti, M.; Chimani, B.; et al. Unlocking Pre-1850 Instrumental Meteorological Records: A Global Inventory. Bull. Am. Meteorol. Soc. 2019, 100, ES389–ES413. [Google Scholar] [CrossRef]
- Camuffo, D.; Bertolin, C. Recovery of the early period of long instrumental time series of air temperature in Padua, Italy (1716–2007). Phys. Chem. Earth Parts A/B/C 2012, 40–41, 23–31. [Google Scholar] [CrossRef]
- Camuffo, D. Calibration and Instrumental Errors in Early Measurements of Air Temperature. Clim. Chang. 2002, 53, 297–329. [Google Scholar] [CrossRef] [PubMed]
- Camuffo, D. Errors in Early Temperature Series Arising from Changes in Style of Measuring Time, Sampling Schedule and Number of Observations. Clim. Chang. 2002, 53, 331–352. [Google Scholar] [CrossRef]
- Cocheo, C.; Camuffo, D. Corrections of Systematic Errors and Data Homogenisation in the Daily Temperature Padova Series (1725–1998). Clim. Chang. 2002, 53, 77–100. [Google Scholar] [CrossRef]
- Stefanini, C.; Becherini, F.; della Valle, A.; Rech, F.; Zecchini, F.; Camuffo, D. Homogeneity Assessment and Correction Methodology for the 1980–2022 Daily Temperature Series in Padua, Italy. Climate 2023, 11, 244. [Google Scholar] [CrossRef]
- La Stazione di Milano Brera. Available online: https://www.arpalombardia.it/temi-ambientali/meteo-e-clima/clima/la-stazione-di-milano-brera/ (accessed on 30 December 2023).
- HISTALP, Historical Instrumental Climatological Surface Time Series of the Greater Alpine Region. Available online: https://www.zamg.ac.at/histalp/dataset/station/csv.php (accessed on 30 December 2023).
- Camuffo, D.; della Valle, A.; Bertolin, C.; Santorelli, E. Temperature observations in Bologna, Italy, from 1715 to 1815: A comparison with other contemporary series and an overview of three centuries of changing climate. Clim. Chang. 2017, 142, 7–22. [Google Scholar] [CrossRef]
- Valler, V.; Franke, J.; Brugnara, Y.; Samakinwa, E.; Hand, R.; Lundstad, E.; Burgdorf, A.M.; Lipfert, L.; Friedman, A.R.; Brönnimann, S. ModE-RA: A global monthly paleo-reanalysis of the modern era 1421 to 2008. Sci Data 2024, 11, 36. [Google Scholar] [CrossRef]
- Valler, V.; Franke, J.; Brugnara, Y.; Brönnimann, S. An updated global atmospheric paleo-reanalysis covering the last 400 years. Geosci Data J. 2022, 9, 89–107. [Google Scholar] [CrossRef]
- Casty, C.; Wanner, H.; Luterbacher, J.; Esper, J.; Böhm, R. Temperature and precipitation variability in the European Alps since 1500. Int. J. Climatol. 2005, 25, 1855–1880. [Google Scholar] [CrossRef]
- Alexandersson, H. A homogeneity test applied to precipitation data. J. Climatol. 1986, 6, 661–675. [Google Scholar] [CrossRef]
- Buishand, T. Some methods for testing the homogeneity of rainfall records. J. Hydrol. 1982, 58, 11–27. [Google Scholar] [CrossRef]
- Hawkins, D.M. Testing a Sequence of Observations for a Shift in Location. J. Am. Stat. Assoc. 1977, 72, 180–186. [Google Scholar] [CrossRef]
- Pettitt, A.N. A Non-Parametric Approach to the Change-Point Problem. Appl. Stat. JSTOR 1979, 28, 126. [Google Scholar] [CrossRef]
- Chow, G.C. Tests of Equality Between Sets of Coefficients in Two Linear Regressions. Econom. JSTOR 1960, 28, 591. [Google Scholar] [CrossRef]
- Yozgatligil, C.; Yazici, C. Comparison of homogeneity tests for temperature using a simulation study. Int. J. Climatol. 2015, 36, 62–81. [Google Scholar] [CrossRef]
- Militino, A.; Moradi, M.; Ugarte, M.D. On the Performances of Trend and Change-Point Detection Methods for Remote Sensing Data. Remote Sens. 2020, 12, 1008. [Google Scholar] [CrossRef]
- Rodionov, S.N. A sequential algorithm for testing climate regime shifts. Geophys. Res. Lett. Am. Geophys. Union (AGU) 2004, 31, L09204. [Google Scholar] [CrossRef]
- Changepoint. Available online: https://github.com/rkillick/changepoint/ (accessed on 30 September 2023).
- Wambui, G.D.; Waititu, G.A.; Wanjoya, A. The Power of the Pruned Exact Linear Time(PELT) Test in Multiple Changepoint Detection. Am. J. Theor. Appl. Stat. 2015, 4, 581–586. [Google Scholar] [CrossRef]
- von Neumann, J. Distribution of the Ratio of the Mean Square Successive Difference to the Variance. Ann. Math. Stat. Inst. Math. Stat. 1941, 12, 367–395. [Google Scholar] [CrossRef]
- The Climatol R Package. Available online: https://www.climatol.eu/ (accessed on 30 December 2023).
- Camuffo, D.; della Valle, A.; and Becherini, F. Instrumental and Observational Problems of the Earliest Temperature Records in Italy: A Methodology for Data Recovery and Correction. Climate 2023, 11, 178. [Google Scholar] [CrossRef]
- Wanner, H.; Pfister, C.; Neukom, R. The variable European Little Ice Age. Quat. Sci. Rev. 2022, 287, 107531. [Google Scholar] [CrossRef]
- Mann, H.B. Nonparametric Tests against Trend. Econom. JSTOR 1945, 13, 245. [Google Scholar] [CrossRef]
- Kendall, M.G. Rank Correlation Methods, 4th ed.; Charles Griffin: London, UK, 1975. [Google Scholar]
- Gilbert, R.O. Statistical Methods for Environmental Pollution Monitoring; Wiley: New York, NY, USA, 1987. [Google Scholar]
- Zorita, E.; Hünicke, B.; Wagner, S. Extreme cold years in Europe generated by internal climate variability in Earth System Model simulations over the past millennium. In Proceedings of the 20th EGU General Assembly, EGU2018, Vienna, Austria, 4–13 April 2018; p. 2636. [Google Scholar]
- Jones, P.D.; Briffa, K.R. Unusual Climate in Northwest Europe during the Period 1730 to 1745 Based on Instrumental and Documentary Data. Clim. Chang. 2006, 79, 361–379. [Google Scholar] [CrossRef]
- Todeschi, V.; Pappalardo, S.E.; Zanetti, C.; Peroni, F.; De Marchi, M. Climate Justice in the City: Mapping Heat-Related Risk for Climate Change Mitigation of the Urban and Peri-Urban Area of Padua (Italy). ISPRS Int. J. Geo-Inf. 2022, 11, 490. [Google Scholar] [CrossRef]

Disclaimer/Publisher’s Note: The statements, opinions and data contained in all publications are solely those of the individual author(s) and contributor(s) and not of MDPI and/or the editor(s). MDPI and/or the editor(s) disclaim responsibility for any injury to people or property resulting from any ideas, methods, instructions or products referred to in the content. |
© 2024 by the authors. Licensee MDPI, Basel, Switzerland. This article is an open access article distributed under the terms and conditions of the Creative Commons Attribution (CC BY) license (https://creativecommons.org/licenses/by/4.0/).