Abstract
This study analyzes temperature trends and thermal comfort during the key hours (i.e., from noon to 3:00 p.m.) of human tower (castells) performances in four significant festivities involving this outdoor exhibition (diada castellera) in Catalonia. Human towers were recognized by UNESCO in 2010 as an Intangible Cultural Heritage. The selected exhibitions were Sant Joan in Valls on 24 June; Festa Major de La Bisbal del Penedès on 15 August; Sant Magí in Tarragona on 19 August; and Sant Fèlix in Vilafranca del Penedès on 30 August. Temperature and relative humidity data were downloaded from the Copernicus Climate Change Service’s ERA5-Land and ERA5 pressure level datasets, respectively, with reanalysis from 1951 to 2023. The results revealed a clear upward trend in temperatures over the last several decades in these four places and for the respective dates, from +0.3 °C per decade in La Bisbal del Penedès to +0.42 °C per decade in Valls. Most of the positive temperature anomalies were concentrated in the last 25 years. The calculation of the Heat Index revealed a higher occurrence of years with possible fatigue due to prolonged exposure and/or physical activity in the three inland locations (i.e., Valls, La Bisbal del Penedès, and Vilafranca del Penedès) and a greater frequency of years with possible heat stroke, heat cramps, and/or heat exhaustion in Tarragona, which is near the Mediterranean Sea. This warming trend and increased discomfort pose potential health risks for participants and suggests a need for adaptive measures. These findings emphasize the importance of incorporating climate considerations into human tower planning.
1. Introduction
Outdoor activities, such as Human Tower exhibitions (castells), a traditional Catalan practice of building human towers [1] that was recognized by UNESCO in 2010 [2] as an Intangible Cultural Heritage of Humanity (ICH), are influenced by weather conditions. Extreme heat and cold events, along with other meteorological variables (i.e., relative humidity, wind speed, and sky view factor) can lead to a decrease in outdoor physical activities [3,4,5,6,7,8], and adverse outdoor thermal environments can have a negative impact on public health, overall well-being, and outdoor thermal comfort [9,10,11].
Thermal comfort is a complex issue influenced by direct factors (i.e., physical, physiological, and psychological) and indirect factors (i.e., cultural, individual, and social) [12]. Similarly, after conducting a comprehensive literature review on outdoor thermal comfort in urban areas, Aghamolaei et al. [13] identified two primary domains in outdoor thermal conditions: human and environment-based factors. Human-based factors include individual (i.e., physiological and psychological) and social (i.e., economic, cultural, and social) factors, while environment-based factors include physical (i.e., material, landscape, and geometry) and basic (i.e., meteorological and climate) factors.
The academic literature has also analyzed the relationships between weather and thermal comfort in a wide variety of sports [14,15,16,17,18]. Safety requirements must be defined and applied to protect the health of participants in leisure and sport activities, as well as the public attending these events [19,20]. According to Oyama et al. [18], several thermal safety guidelines with upper thresholds have been developed by various organizations such as international sports federations.
Climate change is responsible for the decline in the quality of outdoor thermal environments, particularly in the summer. According to Lim [21], global warming poses a challenge for body temperature regulation, which results in more frequent adverse weather conditions for outdoor activities, especially high-intensity efforts that are at risk of being hindered [22] or impeded [21] by global warming; adaptative measures, such as dealing with intense heat waves [23,24,25,26], are therefore required. The United Nations published the United Nations Framework Convention on Climate Change (UNFCCC) Sports for Climate Action Framework, which proposes a specific strategy for mitigating climate change in sports [27], but as noted by Schneider [26], there is still no adaptation strategy framework for sports.
Human towers are an outdoor physical activity, as well as a cultural event declared a UNESCO Intangible Cultural Heritage of Humanity (ICH). The impact of climate change on cultural heritage is underexplored compared to other activities, and even more so in cases of an ICH. Traditions, rituals, and community practices can be significantly affected in the event of environmental alterations and changing conditions for tradition-bearers. Nevertheless, the number of publications addressing the impact of climate change on cultural heritage has grown in recent years.
Fatoric and Seekamp [28], Orr et al. [29], Sesana et al. [30], and Nguyen and Baker [31] all reviewed the existing scientific literature on the physical impact of climate change on cultural heritage, as well as mitigation and adaptation strategies. ICHs only accounted for 20 of the 165 publications reviewed by Orr et al. [29], and ICHs were the sole focus of this research in only six cases, while 80 of the studies focused on sites, including cultural landscapes and archeological sites. The literature review undertaken by Sesana et al. [30] was only focused on tangible cultural heritage. Notably, a review regarding ICHs as they relate to food was undertaken by Dembedza et al. [32]. More recently, Bhattacharya [33] addressed the lack of research on ICHs in climate-change discourse and underscored the need for heritage professionals to bridge the gap between climate change and heritage conservation. Fatoric and Daly [34] proposed an approach to examine whether climate adaptation can be developed and implemented within the heritage sector to simultaneously reduce the impact of climate change and variability on tangible and intangible cultural heritage.
Climate change is responsible for a rise in unfavorable weather conditions for outdoor activities; as a result, the likelihood of encountering bad weather on a day when human tower exhibitions are scheduled will increase. The warm temperatures experienced during recent summer exhibitions, coupled with high humidity levels, have shown that global warming can have a negative impact on human tower performances [35]. A roundtable discussion was held in October 2023 to address this issue as part of the XI Human Tower Symposium [36], with another taking place during the XXVIII Meeting for Injury Prevention in Human Tower Activities [37] in March 2024. Climate change—specifically rising temperatures—poses a threat to the successful execution of human towers, particularly those scheduled during summer afternoons.
These human tower exhibitions occur in semi-enclosed locations, primarily in squares. Thermal comfort in city squares has been widely studied [38,39,40,41,42]. The built environment modifies weather conditions [12,42], and during Human Tower exhibitions, the square becomes crowded with human tower builders (castellers) and spectators (Figure 1). Human towers adopt different structures, all of which include a central column (the trunk) that is at least one human-tower builder wide (a pillar). The tallest human tower on record is seven tiers (one casteller on top of another), plus the dome (pom de dalt). The dome is the topmost part of the human tower comprising the twos (pis de dosos), the lifter (aixecador), and the crowner (enxaneta). A dense group of castellers follows the instructions of the team head (cap de colla) and surrounds the base of the trunk to stabilize it; this part of the human tower is known as the core (pinya). Figure 1 depicts a human tower with six tiers—each of which consists of four members—and the dome, referred to as 4de9. For more information about human towers see the web page of the Coordinadora de Colles Castelleres de Catalunya [43] and the Diccionari Casteller [44].
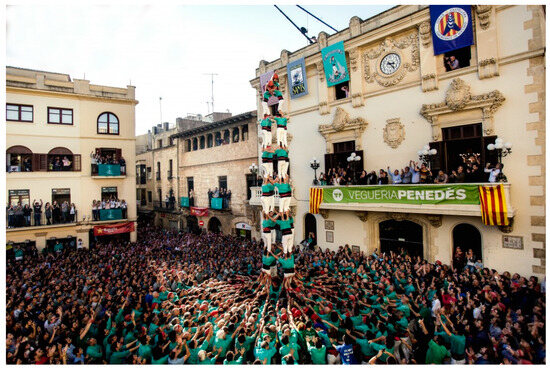
Figure 1.
Human Tower exhibition in Vilafranca del Penedès, Catalonia. Source: Coordinadora de Colles Castelleres de Catalunya/Mireia Comas.
High temperatures can pose a threat to the health and safety of the castellers participating in the performance and lead to heatstroke and dehydration; high temperatures can also negatively impact participants’ cognitive focus and physical endurance. Moreover, these risks extend to the people attending the event in the square. The exhibition must be carried out under optimal training, health, and cognitive conditions in order to achieve the set objectives and prevent the collapse of the human tower structure. It is therefore important to consider climate change and the increasing number of adverse meteorological conditions when performing human towers.
After conducting a literature review on Scopus and Web of Science, the results show that only 15 documents have analyzed human towers from different points of view. The main topics identified include physical injuries due to the collapse of the tower [45,46,47,48,49] and human towers as a symbol of Catalan identity [1,50,51,52]. Among the literature on weather, climate change, and thermal comfort, no other study has analyzed human towers in the academic literature.
Hambrecht and Rockman [53] proposed a framework to address climate change and cultural heritage that focused on four elements: research, adaptation, mitigation, and communication. The present study addresses the first element. The main objectives of this research are (i) to determine temperature trends from 1951 to 2023 during crucial exhibition hours (i.e., from noon to 3 p.m.) over four significant human tower days (diades castelleres) in Catalonia, all of which occur in the summer; and (ii) to analyze to what extent thermal comfort has worsened due to temperature increases. The selected events were Diada de Sant Joan, which is held on 24 June in Valls; Diada de la Festa Major La Bisbal del Penedès, which occurs in La Bisbal del Penedès on 15 August; Diada de Sant Magí, which is carried out in Tarragona on 19 August; and Diada de Sant Fèlix, which happens in Vilafranca del Penedès on 30 August (Figure 2).
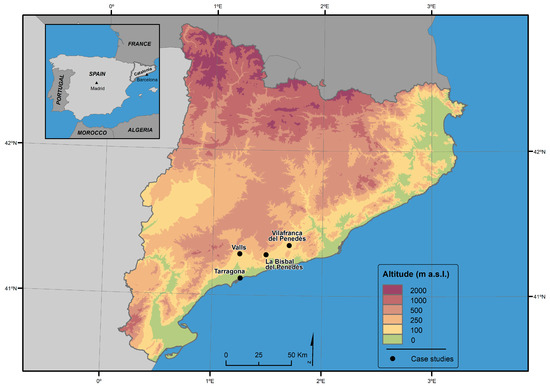
Figure 2.
Localization of Valls, La Bisbal del Penedès, Tarragona, and Vilafranca del Penedès, showing their altitude above sea level and distance from the Mediterranean Sea.
2. Methods
There is no meteorological data recorded in the squares during the day and hours when human tower exhibitions occur. Automatic weather stations (AWS) from the Catalan Meteorological Network, including those located near Valls, La Bisbal del Penedès, Tarragona, and Vilafranca del Penedès, have short temporal records of meteorological data [54].
Figure 3 shows the methodology workflow. This research used temperature data from the ERA5 LAND reanalysis from the Copernicus Climate Change Service, which provides temperature information at an hourly temporal resolution and a spatial resolution of a 0.1° latitude and 0.1° longitude regular grid [55]. The dataset was downloaded for the day of each exhibition from 1951 to 2023—Valls on 24 June; La Bisbal del Penedès on 15 August; Tarragona on 19 August; and Vilafranca del Penedès on 30 August—and for the peak performance hours of the human-tower events (i.e., noon, 1:00 p.m., 2:00 p.m., and 3:00 p.m.) of the grid boxes in which the four human tower places are located.
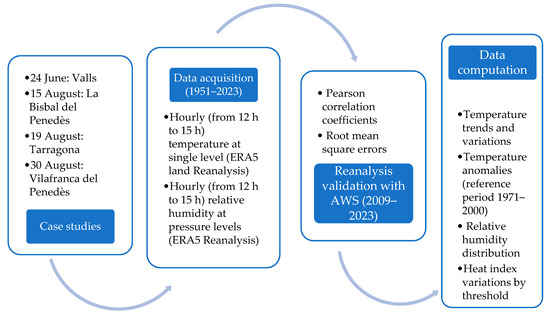
Figure 3.
Methodology workflow: Case studies, data acquisition, reanalysis validation, and data computation.
The relative humidity data from the ERA5 pressure level dataset, at the same hourly temporal resolution as the temperature, but a spatial resolution of a 0.25° latitude and 0.25° longitude regular grid, were also downloaded [56]. There is no available relative humidity at a 0.1° latitude and 0.1° longitude spatial resolution.
The mean temperature and the mean relative humidity of the aforementioned four hours were calculated for each of the 73 days in the Valls grid box (i.e., 24 June); the La Bisbal del Penedès grid box (i.e., 15 August); the Tarragona grid box (i.e., 19 August); and the Vilafranca del Penedès grid box (i.e., 30 August). These data provided a long temporal series to detect temperature trends and variations.
Table 1 outlines the Pearson correlation coefficients and the root mean square errors (RMSE) between the ERA5 LAND temperature and the temperature recorded at the nearest AWS to each case study from 2009 to 2023. The AWS are located within the respective 0.1° latitude and 0.1° longitude grid box. Open data accessibility from the Catalan Meteorological Service AWS network, at an hourly temporal resolution, is limited to records up to 2009. RMSE provides information about how the modeled data are scattered around the corresponding station measurement.

Table 1.
Pearson correlation coefficients (ρ) and root mean square errors (RMSE) between the ERA5 LAND temperature and the temperature recorded at the nearest automatic weather station (AWS) to Valls, La Bisbal del Penedès, Tarragona, and Vilafranca del Penedès over 2009–2023.
The R statistical programming language [57] was used to analyze the data and identify temperature trends to quantify long-term changes over 1951–2023. The ordinary least squares (OLS) regression model was applied to fit a trend line to the average annual data and assess the temperature increases over the years. The code utilized for this analysis included functions for data reading, and average calculations. Temperature anomalies were calculated for the 1971–2000 reference period.
The Heat Index (HI), also known as the apparent temperature, was calculated, where T is the temperature and RH the relative humidity.
HI = −8.78469476 + (1.61139411 × T) + (2.338548839 × RH) − (0.14611605 × T × RH) − (0.012308094 × T2) − (0.016424828 × RH2) + (0.002211732 × T2 × RH) + (0.00072546 × T × RH2) − (0.000003582 × T2 × RH2)
The HI is what the temperature feels like to the human body when relative humidity is combined with air temperature [58]. The apparent temperature is classified in four thresholds [58,59]:
- (a)
- Caution (26.1–32 °C): Fatigue possible with prolonged exposure and/or physical activity.
- (b)
- Extreme caution (32.1–40 °C): Heat stroke, heat cramps, and/or heat exhaustion possible with prolonged exposure and/or physical activity.
- (c)
- Danger (40.1–52 °C): Heat cramps or heat exhaustion likely, and heat stroke possible with prolonged exposure and/or physical activity.
- (d)
- Extreme danger (>52 °C): Heat stroke highly likely.
3. Results
Figure 4 shows the mean temperature from noon to 3 p.m. as well as temperature anomalies on 24 June in the Valls grid box, 15 August in the La Bisbal del Penedès grid box, 19 August in the Tarragona grid box, and 30 August in the Vilafranca del Penedès grid box for the 73-year range of 1951–2023. The temperature changes are significant at the 0.05 level (see Table 2).
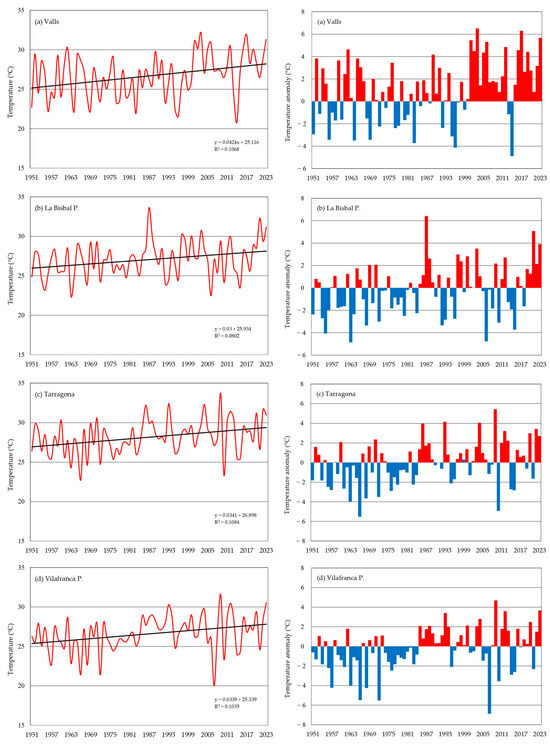
Figure 4.
Mean temperature from noon to 3 p.m. (left) and temperature anomalies (right) on 24 June in the Valls grid box (a); 15 August in the La Bisbal del Penedès grid box (b); 19 August in the Tarragona grid box (c); and 30 August in the Vilafranca del Penedès grid box (d) from 1951 to 2023.
Table 2.
Temperature trends with its confidence intervals from 1951 to 2023.
Regarding the earliest human tower exhibition included in the case studies, the mean temperature on 24 June in the Valls grid box for the entire period was 26.7 °C (σ = 2.754) and ranged from 20.8 °C in 2014 to 32.2 °C in 2003; the temperature ranged between 25.0 and 29.9 °C for most years (56.2%). The temperature achieved or overcame 30 °C eleven times (15.1%), 90.9% of which occurred in the twentieth century. Alternately, the temperature was below 25 °C twenty times, but only twice during the present century; in 2014 (i.e., the lowest anomaly), it was raining. The positive anomalies are concentrated in the final third of the study period. The temperature increase was +0.42 °C per decade.
The mean temperature on 15 August in the La Bisbal del Penedès grid box was 27 °C (σ = 2.251) and ranged from 22.4 °C in 1963 to 33.6 °C in 1987; the temperature ranged between 25.0 and 29.9 °C for most of the years (71.2%). The temperature achieved or overcame 30 °C seven times (9.6%), 71.4% of these occasions being in the twentieth century. Alternately, the temperature was below 25 °C fourteen times, but only three times during the present century; in 2006 (i.e., the second lowest anomaly), it was raining. The highest temperature anomalies after that of 1987 were in 2021 and 2023. Since 2019, all of these were positive. The temperature increase was +0.3 °C per decade.
The mean temperature on 19 August in the Tarragona grid box was 28.2 °C (σ = 2.196) and ranged from 22.7 °C in 1966 to 33.7 °C in 2009; the temperature ranged from 25.0 to 29.9 °C for most years (74%). The temperature achieved or overcame 30 °C fourteen times (19.2%), 57.1% of which occurred in the twentieth century. Alternately, the temperature was only below 25 °C five times, one of which was in the twenty-first century (i.e., 2010), when it was raining. There is a clear predominance of positive temperature anomalies in the second half of the period, and six of the ten highest were in the present century. The temperature increase was +0.34 °C per decade.
Finally, the mean temperature in the Vilafranca del Penedès grid box on 30 August (i.e., the end of the meteorological summer) was 26.6 °C (σ = 2.236) and ranged from 20 °C in 2007 to 31.6 °C in 2009. The temperature ranged between 25.0 and 29.9 °C for most years (75.3%). The temperature achieved or overcame 30 °C four times (5.5%), and 75% of these were in the twenty-first century. Alternately, the temperature was below 25 °C fourteen times, only five of which were in the twenty-first century. While it was not raining in Vilafranca del Penedès on 30 August 2010, that month was considered to be cold throughout most of Catalonia. As in the case of the Tarragona grid box, there was a clear predominance of positive temperature anomalies in the second half of the period, and four of the five highest occurred in the present century. The temperature increase was +0.34 °C per decade.
Table 3 shows the relative humidity between noon and 3:00 p.m. from 1951 to 2023 in the four locations for the respective dates, distributed according to four thresholds: ≤40%, 40.1–60%, 60.1–80%, and >80%. Nearly three-quarters of the years in Valls had a relative humidity between 40.1% and 60% ( = 50.7%). Half of the years in La Bisbal del Penedès ( = 55.6%) and Vilafranca del Penedès ( = 50.4%) were in the 40.1–60% relative humidity threshold. In Tarragona, two-thirds of the years had a relative humidity between 60.1% and 80% ( = 60.9%). Years exceeding 80% relative humidity were below 3% in all cases. No significant trend was detected.
Table 3.
Year distribution according to relative humidity in Valls (24 June), La Bisbal del Penedès (15 August), Tarragona (19 August), and Vilafranca del Penedès (30 August) between noon and 3:00 p.m. from 1951 to 2023.
Figure 5 shows the Heat Index (HI) values from 1951 to 2023 in Valls (i.e., above left), La Bisbal del Penedès (i.e., below left), Tarragona (i.e., above right), and Vilafranca del Penedès (i.e., below right), following the thresholds mentioned in the Methodology section. No year had an HI value exceeding 40 °C (i.e., danger or extreme danger).
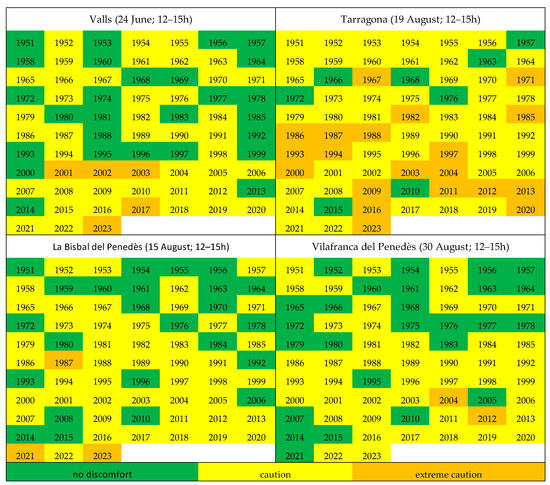
Figure 5.
Heat Index values for Valls (above left), La Bisbal del Penedès (below left), Tarragona (above right), and Vilafranca del Penedès (below right) on 24 June, 15 August, 19 August, and 30 August, respectively, from 1951 to 2023.
The HI in Valls did not exceed 26 °C (no caution required) 27 times (37%). More than half of the years (41) fell within the caution threshold (fatigue possible with prolonged exposure and/or physical activity), and five years were in the extreme caution threshold (heat stroke, heat cramps, or heat exhaustion possible with prolonged exposure and/or physical activity). The highest HI value was 36.5 °C in 2017. Despite more than one-third of the human tower exhibitions theoretically being performed with no discomfort, it should be noted that only three of them occurred in the 21st Century. There is a noticeable increase in the frequency of HI values between 26.1 and 32 °C during the second half of the entire period. The first year with a HI value exceeding 32 °C was 2001.
The HI in La Bisbal del Penedès did not exceed 26 °C in 24 years (32.9%). Almost two-thirds of the years (46) fell within the caution threshold, distributed across the seven decades of the analyzed period. The extreme caution threshold was reached only three times, with two of them occurring in the last three years. The highest HI value was 35.9 °C in 2021.
The HI in Tarragona did not exceed 26 °C only eight times (11%). Almost two-thirds of the years (45) fell within the caution threshold. More than one-fourth of the years (27.4%) reached the extreme caution threshold, with half of them in the 21st Century. The last year with a HI value below 26 °C was 2015, and the highest HI value was 39.6 °C in 2023.
Finally, the HI in Vilafranca del Penedès did not exceed 26 °C 26 times (35.6%). Almost two-thirds of the years (45) fell within the caution threshold, with an increase in the frequency since 1980s. The extreme caution threshold was only reached twice, both during the 21st Century (i.e., 2004 and 2012), and the highest HI value was 36.7 °C in 2012.
4. Discussion
Our analysis detected an upward temperature trend in all four case studies. The magnitude of the increase was consistent with the increase observed in Catalonia in June and August (i.e., +0.39 °C per decade in both months) [60]. Without aiming to make comparisons, because the analyzed dates are not the same, this research can state that the greatest temperature increase occurred in the second half of June and the smallest increase occurred in mid-August. The mean temperature was the same in the three non-coastal areas (i.e., Valls, La Bisbal del Penedès, and Vilafranca del Penedès), and the highest mean temperature occurred in the last half of August in the Tarragona area, which is close to the coast.
It is possible to assume that people participating in the structures and those watching the events in the square would have perceived the temperature increase (more days above 30 °C for the last twenty years) in a negative manner during the key hours of the human-tower performances. At the same time, temperature conditions in the squares where the exhibitions take place can significantly differ from the general ambient temperature.
The squares are semi-enclosed urban places constructed with man-made materials; an urban heat island was detected in the villages [61]. Even though people in the square do not run or jump, there is a high density of people, especially in the core. The castellers forming the central column (trunk) must bear the weight of their colleagues, and some of them must climb carefully to the top of the tower (Figure 6).
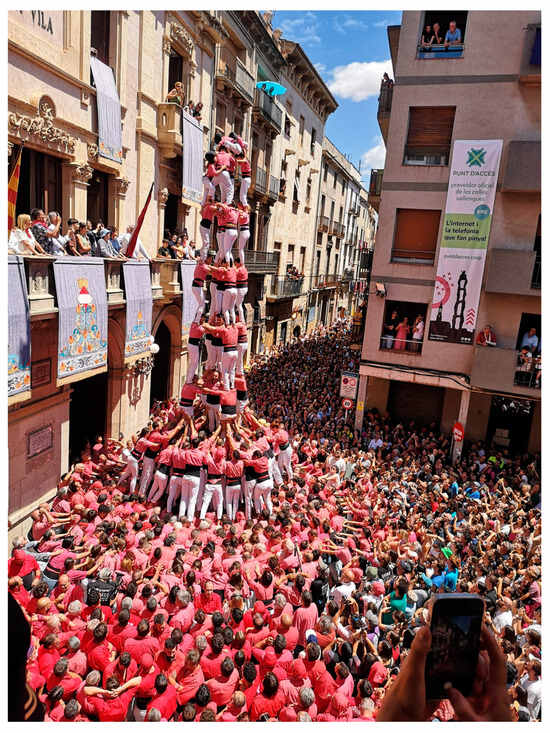
Figure 6.
Human Tower exhibition in Valls, Catalonia. Source: Òscar Saladié.
The temperature in the square during the human tower performance may have exceeded 30 °C more times than shown in Figure 1, likely achieving 35 °C on 24 June in Valls, 15 August in La Bisbal del Penedès, and 19 August in Tarragona. It should be mentioned that in terms of weather comfort, as in other summer outdoor activities, it is necessary to consider the relative humidity and whether the human tower exhibition is on a sunny, cloudy, or windy day.
This research combined relative humidity and temperature to calculate the Heat Index. Despite the differences in the data depending on when Human Tower exhibitions are performed (i.e., the end of June in Valls; mid-August in La Bisbal del Penedès and Tarragona, and the end of August in Vilafranca del Penedès), they show a similar pattern: a reduction in years with ‘no discomfort’, a predominance of years classified as requiring caution, and the introduction of years classified as requiring extreme caution. There are small differences in latitude (i.e., 41°17′ in La Bisbal del Penedès and 41°20′ in Vilafranca del Penedès) and distance to the Mediterranean Sea (i.e., 18 km from Valls and 11 km from La Bisbal del Penedès). On the other hand, Tarragona, the southernmost (41°7′) location that is close to the sea, with a higher relative humidity, revealed a higher frequency of years requiring extreme caution since the mid-80s, and few years with an HI below 26 °C. The Diada Castellera in Tarragona is only four days after the La Bisbal del Penedès exhibition and 11 days before the Vilafranca del Penedès exhibition.
Our results indicate a potential increase in heat stroke, heat cramps, and/or heat exhaustion, particularly among human tower builders, as well as individuals enjoying the exhibition. Nevertheless, no temperature or relative humidity data were recorded in the four squares where the human tower exhibitions were carried out. Existing conventional or automatic official weather stations, which record daily temporal resolution or short-time series, are usually located at the periphery of towns. To date, no research has determined the most favorable or the worst weather conditions to practice this activity—optimal, good, fair, or adverse conditions—and which conditions make the exhibitions impossible due to health or safety concerns. Additionally, no research has monitored parameters related to human health and physiology in conjunction with weather conditions during Human Tower exhibitions.
Our research therefore creates a vast scope for further exploration and innovation in this field—first, by determining real weather conditions before, during, and after human tower exhibitions in the squares. Directly gathering data from event locations using sensors will provide insights into the microclimate created by crowd gatherings in urban structures. This will also allow us to model the past weather conditions in the squares and make projections.
Furthermore, we could establish the temperature ranges linked to good or adverse conditions for the human tower exhibitions by means of participatory processes with the castellers. Engaging directly with the human tower teams (colla castellera) in participatory processes will provide invaluable first-hand insights into the perception of the effect of weather conditions on building human towers and the negative impact of climate change leading to increases in the frequency of adverse meteorological events on human-tower exhibitions. Understanding their experiences and observations will offer a nuanced perspective on how meteorological variables affect cultural practices. These participatory processes can also be useful to highlight the other elements that determine the success of human tower exhibitions, such as the number of participants, training, physical and psychological conditions, nutrition, and hydration before and during the exhibitions.
Finally, we should design, prioritize, and execute a co-creation process [62] detailing the required strategies needed to adapt exhibitions to new climate conditions. This could include developing health-and-safety guidelines, instituting emergency-response protocols, generating shadows in the square, and modifying the exhibition duration and schedule (i.e., exhibitions starting in the early evening) in order to safeguard cultural traditions in the face of climate variability and change. Higher temperatures exacerbate the risk of heat-related illnesses among participants that range from mild dehydration to more severe conditions such as heatstroke; this is particularly concerning given the inclusive nature of these events, which involve men and women across a wide age range, including children, who may be more susceptible to adverse health effects. Nevertheless, changing the beginning of some human tower exhibitions can dilute their cultural essence and heritage value because they are associated with a series of activities within a rigid temporal sequence.
5. Conclusions
The increasing temperatures observed during the four analyzed human-tower exhibitions presents a tangible challenge to traditional conduct during these events. This local evidence concretely manifests the manner in which climate change transcends environmental effects and permeates cultural and social spheres. The need to alter traditional practices due to climate-induced temperature increases exemplifies the far-reaching consequences of global warming and illustrates the capacity, thereof, to transform long-standing cultural norms and social practices. Two recommendations emerge from this study: (i) The exhibition should adequately consider environmental conditions, trying to choose the most appropriate time of the day to minimize health risks, and (ii) the health conditions of castellers should be monitored before, during, and after the exhibition. The main goal should be to prioritize participant safety, while striving to preserve the rich cultural heritage and identity that these festivals embody; this goal will only be achieved with the co-operation of castellers, the organizers of human tower exhibitions, and policymakers by emphasizing the importance of anticipating the impact of climate change.
The public dissemination of the results of the present study plays a vital role in fostering greater awareness and engagement regarding the tangible impacts of climate change, and may catalyze public discourse on preserving cultural heritage in the face of environmental change. This heightened awareness can lead to more informed and engaged communities that are better equipped to participate in and support efforts to adapt cultural practices to climate change.
Author Contributions
Conceptualization, Ò.S. and J.X.O.P.; methodology, J.X.O.P. and Ò.S.; formal analysis, Ò.S., J.X.O.P. and A.B.-C.; data curation, J.X.O.P. and Ò.S.; writing—original draft preparation, Ò.S. and J.X.O.P.; writing—review and editing, Ò.S., J.X.O.P. and A.B.-C.; supervision, Ò.S. All authors have read and agreed to the published version of the manuscript.
Funding
This research was funded by the ADAPTOUR project: The adaptability of complex tourist destinations in the present era of social, economic, and environmental transformations: innovative paths towards destination resilience (contract number PID2020-112525RB-I00), funded by MCIN/AEI/10.13039/501100011033 (Spain).
Data Availability Statement
The data created will be available upon request from the corresponding author.
Acknowledgments
The authors want to acknowledge the Càtedra URV per a l’Estudi del Fet Casteller and the Coordinadora de Colles Castelleres de Catalunya.
Conflicts of Interest
The authors declare no conflicts of interest.
References
- Vaczi, M. From subalternity to intangible heritage and national symbol: Catalonia’s castells. In Indigenous, Traditional, and Folk Sports: Contesting Modernities; Vazci, M., Bairner, A., Eds.; Routledge: New York, NY, USA, 2023; pp. 70–85. [Google Scholar]
- UNESCO. Human Towers. Intangible Cultural Heritage UNESCO. 2024. Available online: https://ich.unesco.org/es/RL/los-castells-00364 (accessed on 2 January 2024).
- Wolff, D.; Fitzhugh, E.C. The relationships between weather-related factors and daily outdoor physical activity counts on an urban greenway. Int. J. Environ. Res. Public Health 2011, 8, 579–589. [Google Scholar] [CrossRef] [PubMed]
- Bean, R.; Pojani, D.; Corcoran, J. How does weather affect bikeshare use? A comparative analysis of forty cities across climate zones. J. Transp. Geogr. 2021, 95, 103155. [Google Scholar] [CrossRef]
- Turrisi, T.B.; Bittel, K.M.; West, A.B.; Hojjatinia, S.; Mama, S.K.; Lago, C.M.; Convoy, D.E. Seasons, weather, and device-measured movement behaviors: A scoping review from 2006 to 2020. Int. J. Behav. Nutr. Phys. Act. 2021, 18, 24. [Google Scholar] [CrossRef] [PubMed]
- Ho, J.Y.; Googins, W.B.; Mo, P.K.H.; Chan, E.Y.Y. The effect of temperature on physical activity: An aggregated timeseries analysis of smartphone users in five major Chinese cities. Int. J. Behav. Nutr. Phys. Act. 2022, 68, 19. [Google Scholar] [CrossRef] [PubMed]
- Fan, Y.; Wang, J.; Obradovich, N.; Zheng, S. Intraday adaptation to extreme temperatures in outdoor activity. Sci. Rep. 2023, 13, 473. [Google Scholar] [CrossRef] [PubMed]
- Janice, Y.H.; Lam, H.Y.C.; Huang, Z.; Liu, S.; Goggins, W.B.; Mo, P.K.H.; Chan, E.Y.Y. Factors affecting outdoor physical activity in extreme temperatures in a sub-tropical Chinese urban population: An exploratory telephone survey. BMC Public Health 2023, 101, 23. [Google Scholar] [CrossRef]
- Krüger, E.L.; Rossi, F.A. Effect of personal and microclimatic variables on observed thermal sensation from a field study in southern Brazil. Build. Environ. 2011, 46, 690–697. [Google Scholar] [CrossRef]
- Huang, Z.; Cheng, B.; Gou, Z.; Zhang, F. Outdoor thermal comfort and adaptive behaviors in a university campus in China’s hot summer-cold winter climate region. Build. Environ. 2019, 165, 106414. [Google Scholar] [CrossRef]
- Ji, Y.; Song, J.; Shen, P. A review of studies modelling of solar radiation on human thermal comfort in outdoor environment. Build. Environ. 2022, 214, 108891. [Google Scholar] [CrossRef]
- He, X.; Gao, W.; Wang, R.; Yan, D. Study on outdoor thermal comfort of factory areas during winter in hot summer and cold winter zone of China. Build. Environ. 2023, 228, 109883. [Google Scholar] [CrossRef]
- Aghamolaei, R.; Mehdi Azizi, M.; Aminzadeh, B.; O’Donnell, J. A comprehensive review of outdoor thermal comfort in urban areas: Effective parameters and approaches. Energy Environ. 2023, 34, 2204–2227. [Google Scholar] [CrossRef]
- Mountjoy, M.; Alonso, J.M.; Bergeron, M.F.; Dvorak, J.; Miller, S.; Migliorini, S.; Singh, D.G. Hyperthermic-related challenges in aquatics, athletics, football, tennis and triathlon. Br. J. Sports Med. 2012, 46, 800–804. [Google Scholar] [CrossRef]
- Özgünen, K.T.; Kurdak, S.S.; Maughan, R.J.; Zeren, Ç.; Korkmaz, S.; Yazici, Z.; Ersöz, G.; Shirreffs, M.; Binnet, M.S.; Dvorak, J. Effects of hot environmental conditions on physical activity patterns and temperature response of football players. Scand. J. Med. Sci. Sports 2019, 22, 912–917. [Google Scholar] [CrossRef] [PubMed]
- Del Coso, J.; Fernández, D.; Abián-Vicen, J.; Salinero, J.J.; González-Millán, C.; Areces, F.; Ruiz, D.; Gallo, C.; Calleja-González, J.; Pérez-González, B. Running pace decrease during a marathon is positively related to blood markers of muscle damage. PLoS ONE 2013, 8, e57602. [Google Scholar] [CrossRef]
- Fenemor, S.P.; Gill, N.D.; Driller, M.W.; Mills, B.; Casadio, J.R.; Beaven, C.M. The relationship between physiological and performance variables during a hot/humid international rugby sevens tournament. Eur. J. Sport Sci. 2022, 22, 1499–1507. [Google Scholar] [CrossRef] [PubMed]
- Oyama, T.; Fuji, M.; Nakajima, K.; Takakura, J.; Hijioka, Y. Validation of upper thermal thresholds for outdoor sports using thermal physiology modelling. Temperature 2023, 11, 92–106. [Google Scholar] [CrossRef]
- Roberts, W.O. Determining a “do not start” temperature for a marathon on the basis of adverse outcomes. Med. Sci. Sports Exerc. 2010, 42, 226–232. [Google Scholar] [CrossRef] [PubMed]
- Hosokawa, Y.; Adams, W.M. Heat risks in athletics. In Human Health and Physical Activity during Heat Exposure; Springer Briefs in Medical Earth Sciences; Hosokawa, Y., Ed.; Springer: Cham, Switzerland, 2018; pp. 73–83. [Google Scholar] [CrossRef]
- Lim, C.L. Fundamental concepts of human thermoregulation and adaptation to heat: A review in the context of global warming. Int. J. Environ. Res. Public Health 2020, 17, 7795. [Google Scholar] [CrossRef]
- Bernard, P.; Chevance, G.; Kingsbury, C.; Baillot, A.; Romain, A.J.; Molinier, V.; Gadais, T.; Dancause, K.N. Climate change, physical activity and sport: A systematic review. Sports Med. 2021, 51, 1041–1059. [Google Scholar] [CrossRef]
- Orr, M.; Inoue, Y. Sport versus climate: Introducing the climate vulnerability of sport organizations framework. Sport Manag. Rev. 2019, 22, 452–463. [Google Scholar] [CrossRef]
- Goldblatt, D. Playing against the Clock: Global Sport, the Climate Emergency and the Case for Rapid Change; Rapid Transition Alliance: Sussex, UK, 2020; Available online: https://rapidtransition.org/wp-conent/uploads/2020/06/Playing_Against_The_Clock_FINAL.pdf (accessed on 11 March 2024).
- Matzarakis, A.; Fröhlich, D. Sport events and climate for visitors—The case of FIFA World Cup in Qatar 2022. Int. J. Biometeorol. 2015, 59, 481–486. [Google Scholar] [CrossRef] [PubMed]
- Schneider, S.; Niederberger, M.; Kurowski, L.; Bade, L. How can outdoor sports protect themselves against climate change-related health risks?—A prevention model based on an expert Delphi study. J. Sci. Med. Sport 2024, 27, 37–44. [Google Scholar] [CrossRef] [PubMed]
- United Nations Climate Change Global Climate Action. Sports for Climate Action Framework; United Nations: New York, NY, USA; Available online: https://unfccc.int/sites/default/files/resource/Sports_for_Climate_Action_Declaration_and_Framework.pdf (accessed on 13 March 2024).
- Fatoric, S.; Seekamp, E. Are cultural heritage and resources threatened by climate change? A systematic literature review. Clim. Change 2017, 142, 227–254. [Google Scholar] [CrossRef]
- Orr, S.A.; Richards, J.; Fatoric, S. Climate change and cultural heritage: A systematic literature review (2016–2020). Hist. Environ. Policy Cult. Herit. 2021, 12, 434–477. [Google Scholar] [CrossRef]
- Sesana, E.; Gagno, A.S.; Ciantelli, C.; Cassar, J.; Hughes, J.J. Climate change impacts on cultural heritage: A literature review. WIREs Clim. Chang. 2021, 12, e710. [Google Scholar] [CrossRef]
- Nguyen, K.N.; Baker, S. Climate Change and UNESCO World Heritage-Listed Cultural Properties: A Systematic Review, 2008–2021. Heritage 2023, 6, 2394–2420. [Google Scholar] [CrossRef]
- Dembedza, V.P.; Chopera, P.; Mapara, J.; Macheka, L. Impact of climate change-induced natural disasters on intangible cultural heritage related to food: A review. J. Ethn. Foods 2022, 9, 32. [Google Scholar] [CrossRef]
- Bhattacharya, A. Living heritage and climate change: Interconnections and possibilities. In Proceedings of the ICOMOS Scientific Symposium 2021—Living Heritage and Climate Change, Online, 9–10 November 2021; Available online: http://openarchive.icomos.org/id/eprint/3052/ (accessed on 30 October 2023).
- Fatoric, S.; Daly, C. Towards a climate-smart cultural heritage management. WIREs Clim. Chang. 2023, 14, e855. [Google Scholar] [CrossRef]
- Capdevila, X.; Revista Castells. Canvi Climàtic i Castells. Available online: https://revistacastells.cat/2023/10/opinio-canvi-climatic-i-castells/ (accessed on 18 December 2023).
- Ajuntament de Valls. XI Simposi Casteller de Catalunya, Fira de Santa Úrsula, Museu Casteller de Catalunya, Valls. 21 October 2023. Available online: https://www.valls.cat/simposi-casteller (accessed on 14 November 2023).
- Coordinadora de Colles Castelleres de Catalunya. XXVIII Jornada de Prevenció de Lesions en el Mon Casteller. 9 March 2024. Available online: https://castellscat.cat/ca/noticia/325-la-28a-jornada-de-prevencio-de-lesions-en-el-mon-casteller-se-centrara-en-la-sostenibilitat-i-els-riscos-del-canvi-climatic (accessed on 23 March 2023).
- Sayad, B.; Alkama, D.; Ahmad, H.; Baili, J.; Aljahdaly, N.H.; Menni, Y. Nature-based solutions to improve the summer thermal comfort outdoors. Case Stud. Therm. Eng. 2021, 28, 101399. [Google Scholar] [CrossRef]
- Louafi, S.; Abdou, S.; Reiter, S. Effect of vegetation cover on thermal and visual comfort of pedestrians in urban spaces in hot and dry climate. Nat. Technol. 2017, 17, 30–42. [Google Scholar]
- Santos Nouri, A.; Costa, J.P. Addressing thermophysiological thresholds and psychological aspects during hot and dry Mediterranean summers through public space design. The case of Rossio. Build. Environ. 2017, 118, 67–90. [Google Scholar] [CrossRef]
- Aljawabra, F.; Nikolopoulou, M. Thermal comfort in urban spaces: A cross-cultural study in the hot arid climate. Int. J. Biometeorol. 2018, 62, 1901–1909. [Google Scholar] [CrossRef] [PubMed]
- Su, Y.; Wang, C.; Li, Z.; Meng, Q.; Gong, A.; Wu, Z.; Zhao, Q. Summer outdoor comfort assessment in city squares-A case study of cold dry winter, hot summer climate zone. Sustain. Cities Soc. 2024, 101, 105062. [Google Scholar] [CrossRef]
- Coordinadora de Colles Castellers de Catalunya. Els Castells. 2024. Available online: https://castellscat.cat/en/els-castells (accessed on 10 June 2024).
- Generalitat de Catalunya. Diccionari Casteller. Termcat, Departament de Cultura. 2024. Available online: https://www.termcat.cat/ca/diccionaris-en-linia/2 (accessed on 10 June 2024).
- Roset-Llobet, J.; Saló-Orfila, J.M. Sports-related stress fracture of the clavicle: A case report. Int. Orthop. 1998, 22, 266–268. [Google Scholar] [CrossRef] [PubMed][Green Version]
- Roset, J.; Abos, R.; Canela, J.; Saló, J.M. Accident risk for children participating in human towers. Pediatr. Catalana 1998, 58, 216–225. [Google Scholar]
- García-Algar, O.; Felipe, A.; Berrueco, R.; Casano, P.; Vall, O. Human towers and multiple trauma in children. Pediatr. Catalana 2005, 65, 47–48. [Google Scholar]
- Godoy, P.; Rosset-Llobet, J.; Rossell-Urtxuletegui, R. Incidence of injuries among children members of human tower associations. Pediatr. Catalana 2010, 70, 146–150. [Google Scholar]
- Witt, A.; Kumru, H.; Oisso, E.; Vidal, J. Traumatic spinal cord injury due to human tower accident in Catalonia. Spinal Cord Ser. Cases 2018, 4. [Google Scholar] [CrossRef] [PubMed]
- Weig, D. Sardana and castellers: Moving bodies and cultural politics in Catalonia. Soc. Anthropol. 2015, 23, 435–449. [Google Scholar] [CrossRef]
- Vazci, M. Catalonia’s human towers: Nationalism, associational culture, and the politics of performance. Am. Ethnol. 2015, 43, 353–368. [Google Scholar] [CrossRef]
- Vargas, M.A. Constructing Catalan Identity: Memory, Imagination, and the Medieval; Palgrave Macmillan: Cham, Switzerland, 2018; p. 197. [Google Scholar]
- Hambrecht, G.; Rockman, M. International approaches to climate change and cultural heritage. Am. Antiq. 2017, 82, 627–641. [Google Scholar] [CrossRef]
- Catalan Meteorological Service. Xarxa d’Estacions Meteorològiques Automàtiques. Generalitat de Catalunya. Available online: https://www.meteo.cat/observacions/llistat-xema (accessed on 17 July 2024).
- Muñoz Sabater, J. ERA5-Land Hourly Data from 1950 to Present. Copernicus Climate Change Service (C3S) Climate Data Store (CDS). 2019. Available online: https://cds.climate.copernicus.eu/cdsapp#!/dataset/10.24381/cds.e2161bac?tab=overview (accessed on 17 July 2024). [CrossRef]
- Hersbach, H.; Bell, B.; Berrsiford, P.; Biavati, G.; Horányi, A.; Muñoz Sabater, J.; Nicoals, J.; Peubey, C.; Radu, R.; Rozum, I.; et al. Coperniculs Climate Change Service (C3S) Climate Data Store (CDS). ERA5 Hourly Data on Single Levels from 1940 to Present. Available online: https://cds.climate.copernicus.eu/cdsapp#!/dataset/10.24381/cds.adbb2d47?tab=overview (accessed on 17 July 2024). [CrossRef]
- RStudio Team. RStudio: Integrated Development for R. RStudio; PBC: Boston, MA, USA, 2020; Available online: http://www.rstudio.com/ (accessed on 25 October 2023).
- National Weather Service. Heat Forecast Tools. National Oceanic and Atmospheric Administration. Available online: https://www.weather.gov/safety/heat-index (accessed on 18 April 2024).
- Agencia Estatal de Meteorología. Tabla de Valores de Sensación Térmica Por Calor (Heat Index). Available online: https://www.aemet.es/documentos/es/conocermas/montana/sensacion_termica/SensacionTermicaPorFrio-Calor.pdf (accessed on 18 April 2024).
- Meteocat. Butlletí Anual d’Indicadors Climàtics 2022. Temperatura de l’Aire; Servei Meteorològic de Catalunya—Generalitat de Catalunya: Barcelona, Spain, 2023; p. 23. Available online: https://static-m.meteo.cat/wordpressweb/wp-content/uploads/2023/05/30095931/baic-2022-02-temperatura.pdf (accessed on 10 November 2023).
- Dienst, M.; Lindén, J.; Saladié, O.; Esper, J. Detection and elimination of UHI effects in long temperature records from villages—A case study from Tivissa, Spain. Urban Clim. 2019, 27, 372–383. [Google Scholar] [CrossRef]
- Font, A.; Boqué, A.; Olano, J.X.; Russo, A.; Coscarelli, R.; Antronico, L.; De Pascale, F.; Saladié, O.; Anton-Clavé, S.; Aguilar, E. Climate services for tourism: An applied methodology for user engagement and co-creation in European destinations. Clim. Serv. 2021, 23, 100249. [Google Scholar] [CrossRef]


Disclaimer/Publisher’s Note: The statements, opinions and data contained in all publications are solely those of the individual author(s) and contributor(s) and not of MDPI and/or the editor(s). MDPI and/or the editor(s) disclaim responsibility for any injury to people or property resulting from any ideas, methods, instructions or products referred to in the content. |
© 2024 by the authors. Licensee MDPI, Basel, Switzerland. This article is an open access article distributed under the terms and conditions of the Creative Commons Attribution (CC BY) license (https://creativecommons.org/licenses/by/4.0/).