Article

Modelling Climate Effects on Site Productivity and Developing Site Index Conversion Equations for Jack Pine and Trembling Aspen Mixed Stands

Ontario Forest Research Institute, Ontario Ministry of Natural Resources, 1235 Queen St. East, Sault Ste. Marie, ON P6A 2E5, Canada
Climate 2024, 12(8), 114; https://doi.org/10.3390/cli12080114 (registering DOI)
Submission received: 5 July 2024 / Revised: 30 July 2024 / Accepted: 31 July 2024 / Published: 4 August 2024
(This article belongs to the Special Issue Forest Ecosystems under Climate Change)

Abstract

:
Forest site productivity estimates are crucial for making informed forest resource management decisions. These estimates are valuable both for the tree species currently growing in the stands and for those being considered for future stands. Current models are generally designed for pure stands and do not account for the influence of climate on tree growth. Consequently, site index (SI) conversion equations were developed specifically for jack pine (Pinus banksiana Lamb.) and trembling aspen (Populus tremuloides Michx.) trees grown in naturally originated mixed stands. This work involved sampling 186 trees (93 of each species) from 31 even-aged mixed stands (3 trees per species per site) across Ontario, Canada. Stem analysis data from these trees were utilized to develop stand height growth models by incorporating climate variables for each species. The models were developed using a mixed effects modelling approach. The SI of one species was correlated with that of the other species and climate variables to establish SI conversion equations. The effect of climate on site productivity was evaluated by projecting stand heights at four geographic locations (east, center, west, and far west) in Ontario from 2022 to 2100 using the derived stand height growth models. Height projections were made under three emissions scenarios reflecting varying levels of radiative forcing by the end of the century (2.6, 4.5, and 8.5 watts m−2). Climate effects were observed to vary across different regions, with the least and most pronounced effects noted in the central and far western areas, respectively, for jack pine, while effects were relatively similar across all locations for trembling aspen. Stand heights and SIs of jack pine and trembling aspen trees grown in naturally originated mixed stands can be estimated using the height growth models developed here. Similarly, SI conversion equations enable the estimation of the SI for one species based on the SI of another species and environmental variables.

1. Introduction

Site productivity is the composite expression of a variety of physical and chemical attributes of a forested area, including its soil, topography, and climate. It affects tree growth, recruitment, and mortality in a stand [1]. Therefore, forest site productivity estimates are very important in making informed forest management decisions. These estimates are not only important for the tree species currently growing in the stands but also for the ones considered to be growing in the future. The site index (SI) defined as the stand height (mean height of codominant and dominant trees with their crowns extending at or above the general level of canopy) at a specified stand age is a commonly used measure of site productivity [2]. It is the main driver of most growth and yield models that are used to estimate wood supply and prepare forest management plans. As a result, an accurate estimate of the SI is the key in developing dependable forest management plans.
The site index depends on climate, geographic location, and tree species growing on the site [3]. Therefore, species-specific SI models are usually developed for even-aged pure stands. Morin et al. [4] simulated climate change impacts on the site productivity of European temperate forests across a large climatic gradient. They found that the impact varied across the gradient of current site conditions, irrespective of their composition. The forests on the warmest sites showed a decrease in productivity, while forest on sites with the coldest conditions experienced some productivity increases.
In mixed stands, however, two or more species growing at the same time, interspecies competition, and other factors may affect tree growth [5]. Consequently, SI models derived using the data collected from pure stands may not be suitable for mixed stands. Likewise, it may not be possible to develop SI models for each tree species growing in a mixed stand if the trees of targeted species are not appropriate (too small) to sample to develop a SI model for that tree species [6].
Where two species are growing in a stand and the SI of one species is known, it may be possible to determine the SI the other species in terms of the SI of the first species by developing a SI conversion equation. This equation represents a functional relationship between SIs of two species growing together in mixed stands. The relationship is usually linear and can be expressed using a linear equation. Stand dynamics of mixed species can also be modelled using this equation in a growth and yield application [7,8].
If there are two tree species growing together in mixed stands and both species have a few trees in the main canopy in each stand, the SI conversion equation between these species is developed by sampling dominant and codominant trees from both species [5,6,7,8]. If site indices of tree species A and B are represented by SIA and SIB, then their relationship can be expressed as follows:
SIA = a + b SIB + ε
where a and b are regression coefficients to be estimated, and ε is the error term.
Carmean et al. [9] synthesized findings from six studies that examined site index relationships across 24 hardwood and conifer species in the United States and Canada. They also derived site index conversion equations for trees grown in naturally regenerated mixed stands. Similarly, Nigh [5] utilized estimated site index values to formulate conversion equations for four conifer species in British Columbia, Canada.
There are mainly 3 types of naturally originated mixed stands in Ontario, Canada: (1) jack pine (Pinus banksiana Lamb.) and black spruce (Picea mariana Mill. B.S.P.), (2) black spruce and trembling aspen (Populus tremuloides Michx.), and (3) jack pine and trembling aspen. Climate effects on site productivity were analyzed, and climate sensitive stand height/site index models were developed for the first two types of these stands [10,11]. Site index conversion equations were also developed for the jack pine and black spruce mixed stands [10].
Climate-sensitive stand height/SI models and SI conversion equations are not available for naturally regenerated jack pine and trembling aspen mixed stands. Therefore, this study is focused on several objectives: (1) investigating the effects of climate on the site productivity of jack pine and trembling aspen trees in naturally regenerated mixed stands in Ontario, Canada; (2) developing models for stand height/SI for these species by integrating climate variables; (3) assessing the potential impact of future climate change scenarios on the stand height growth of both species; (4) comparing stand height growth between mixed and pure stands; and (5) establishing SI conversion equations for trembling aspen and jack pine grown in naturally originated mixed stands. These conversion equations are crucial for climate change adaptation and mitigation strategies as well as for wood supply modeling to estimate the SI of a new species in relation to the SI of currently growing species.

2. Materials and Methods

2.1. Height and Age Data

Stem analysis is a technique of examining the growth rings of sections from a tree trunk. It enables the past growth history of a tree stem to be reconstructed. Therefore, stem analysis was used to collect the height–age pair data used in this study. Thirty-one even-aged naturally regenerated mixed stands were sampled from across the study species’ ranges in Ontario (Figure 1). The longitude and latitude of these stands ranged from –79.7154° to –95.0769° and 47.5780° to 50.1767°, respectively. Similarly, the elevation covered from 212 to 483 m. These stands were dominated by trembling aspen (27.65%) and jack pine (23.37%). There was also a presence of other species in these stands. The proportions of other species were 16.46% black spruce, 14.35% white birch (Betula papyrifera), 13.5% balsam fir (Abies balsamea (L.) Mill.), and the remainder (4.67%) was a combination of white spruce (Picea glauca), white pine (Pinus strobus), red pine (Pinus resinosa), and red maple (Acer rubrum).
Jack pine and trembling aspen trees were sampled by establishing three 100 m2 circular temporary sample plots at each site. One non-veteran largest diameter tree was sampled from each species from each plot for stem analysis. A veteran tree generally consists of a large trunk with one or more defects including large cavities, decay, and fungi on the trunk. Only trees without visible abnormalities, such as forks, broken or dead tops, and major stem injuries were selected for sampling. Stem analysis data were obtained by following the procedure described by Sharma [10]. The procedure described by Sharma [10] includes sampling trees, cutting disks from sampled trees, and conducting ring analysis. Therefore, readers are referred to those studies for further information on the procedure of collecting the height–age pair data used in this study.
The annual height growth for each tree of each species was estimated to gather height–age data (growth series). To ensure that the sampled trees had not experienced early height growth suppression, dieback, or breakage, the height of each tree was plotted against its age for each species. No defects were detected in any of the sampled trees. Consequently, data from all 186 trees (93 jack pine and 93 trembling aspen) were used to analyze and model the impact of climate on site productivity.
Generally, the height growth of trees before reaching breast height is inconsistent (erratic) in naturally originated mixed stands. Therefore, measured tree height from breast height and age from breast height (referred to as breast height age, BHA) were used in this study. Due to the erratic growth before breast height, site scale observations could not be made by combining growth series from the three plots at each site. Combining the series would average the height growth across years because the three trees from different plots at a site would reach BHA in different calendar years. Since climate variables are tied to specific calendar years, the climatic effects on height growth could not be analyzed if the series from the three trees across the plots were combined.
Summary statistics of the sampled trees for this study are presented in Table 1. The SI values in Table 1 indicate the average heights of three trees sampled from three plots at each site, measured at BHA 50 years for each species. The SI values are 27 for jack pine and 29 for trembling aspen. These values account for the fact that trees on four jack pine sites and two trembling aspen sites were younger than 50 years BHA.

2.2. Climate Data

The sample plots in this study were not near established weather stations, so Canadian climate models were used to estimate climate variables for each site [12]. These models were generated from continuous climate grids using ANUSPLINE based on corrected Canadian weather station data [13,14] provided by many stations in Ontario. Estimates of average yearly and seasonal values of these variables at each plot location were calculated for each year starting when the sampled tree reached breast height to 2015.
A total of 68 variables were calculated, including mean, minimum, and maximum air temperatures and total precipitation, estimated for each month of the year, for each quarter (consecutive three-month periods), and annually. In addition, climate data included estimates for start, end, and length of the growing season and the sum of growing degree days using a base temperature of 5 °C. The growing season was defined as the length of time between the day after 1 March when the mean daily temperature was ≥5 °C for five consecutive days and the day after 1 August when the minimum daily temperature was ≤−2 °C. The 68 variables also included three site-related variables (longitude, latitude, and elevation). In addition to the climate variables, climatic moisture index (CMI), obtained by subtracting monthly potential evapotranspiration (PET) from mean monthly precipitation (MMP) (see [15]), was estimated for each month for each year.
Estimates for all climate variables were provided by Dan McKenney (Canadian Forest Service, Personal Communication, 2023). Seasonal and (or) annual values of climate variables for a calendar year were used to examine and model the climate effects on the annual height growth of each tree for that calendar year. All these climate related variables are listed in Table 2. Summary statistics of the climate variables that were significant in explaining the variability in stand height growth of trembling aspen and jack pine trees are displayed in Table 1.

2.3. Stand Height/Site Index Models

Tree height and age have a nonlinear relationship, so nonlinear mathematical expressions are typically used to describe it. These expressions are based on fractional and exponential functions. The Hossfeld IV and Chapman–Richards functions are the most commonly used functions for modeling the height–age relationship, representing fractional and exponential functions, respectively (see [16,17,18,19]). Various versions of these functions can be developed by applying different assumptions and initial conditions.
Sharma et al. [20] and Sharma and Parton [3,21,22] explored various forms (variants) of the Hossfeld IV and Chapman–Richards functions for four major commercial tree species in Ontario, Canada. They discovered that a particular variant of the Hossfeld IV function (Equation (2)) offered the best fit (lowest AIC [23]) and provided biologically plausible height estimates across productivity classes for these species. Consequently, this variant was used as the base function to analyze and model the climate effects on stand height growth in this study. The specific variant (model form) they used is provided below:
H 2 = α 0 1 1 α 0 H 1 A 1 A 2 α 1 + ε
where H1 and H2 are stand heights (above breast height) at BHAs A1 and A2, respectively, α0 and α1 are parameters and ε is the error term. This model form is also known as McDill–Amateis growth function (see [24]). In general, α0 represents the asymptote of the growth curve, and α1 determines the shape. Here, α1 is also known as the rate parameter. As described in previous studies, climate effects on stand height growth can be analyzed and modelled by expressing the parameters (α0 and α1) in terms of climate variables. Climate variables can also be incorporated in Equation (1) to develop SI conversion equations.

2.4. Model Fitting and Evaluation

Height–age measurements used in this study are organized hierarchically, with measurements nested within individual trees and trees nested within specific site. As a result, observations among sites are independent but measurements within a tree are dependent and correlated. The autocorrelation resulted by this data structure was addressed by using a mixed-effects modeling approach. Similarly, heteroscedasticity (if present) was addressed by specifying a variance function [25]. Two variance functions (power and exponential) were taken into consideration, and the function resulting in the best fit (smallest AIC value) was used in the model.
Initially, no climate variables were used to fit Equation (2) to the data from both jack pine and trembling aspen trees in SAS [26]. Climate variables were then incorporated into the model by categorizing them into two groups (temperature and precipitation) and adding one variable from each group at a time. From each group, the variable that was significant in the model (α = 0.05) and resulted in the lowest fit statistics (Akaike’s information criterion (AIC [23]) and MSE) was selected. Next, a climate variable from the second group was introduced into the model, one at a time, in the presence of the variable selected from the first group. The variable that resulted in the best fit statistics and was significant in the model was then selected from the second group. This process continued until no additional variable from either group was significant in the model for both species.
Site-specific variables were then incorporated into the model if they were significant and improved fit statistics in the presence of climate variables. Random effects were incrementally added to fixed-effects parameters if significant. To assess heteroscedasticity in the data, residuals (observed–predicted) were calculated for all one-year growth periods of each tree species and plotted against predicted heights.
Climate effects on future stand height growth were assessed by predicting stand heights for both species across four regions (represented by triangles) in northern Ontario, including eastern (near New Liskeard), central (near Geraldton), western (near Thunder Bay), and far western (near Manitoba border), as illustrated in Figure 1. These predictions were generated using a model incorporating climate variables under three representative concentration pathways (RCPs), which simulate different levels of warming (2.6, 4.5, and 8.5 Watts/m2) by the end of the century according to the Canadian model [12]. The projected climate variables deemed significant for defining parameters in the height growth model were used to evaluate climate impacts. Growth curves for the 79-year period from 2022 to 2100 were then generated for assessments.
Two separate SI conversion equations were necessary to estimate the site index (SI) of jack pine based on trembling aspen, and vice versa, because the climate variables influencing the SI varied between species. Therefore, distinct SI conversion equations were formulated for mixed stands of jack pine and trembling aspen. These equations incorporated climate variables that significantly affected the SI of each species. For this, the SI of trembling aspen was regressed against the jack pine SI and relevant climate variables, and vice versa. The SI values used in deriving SI conversion equations were determined using stand height at a breast height age (BHA) of 50 years. Climate variables used in these equations represented the average values over the 50-year growth period.

3. Results

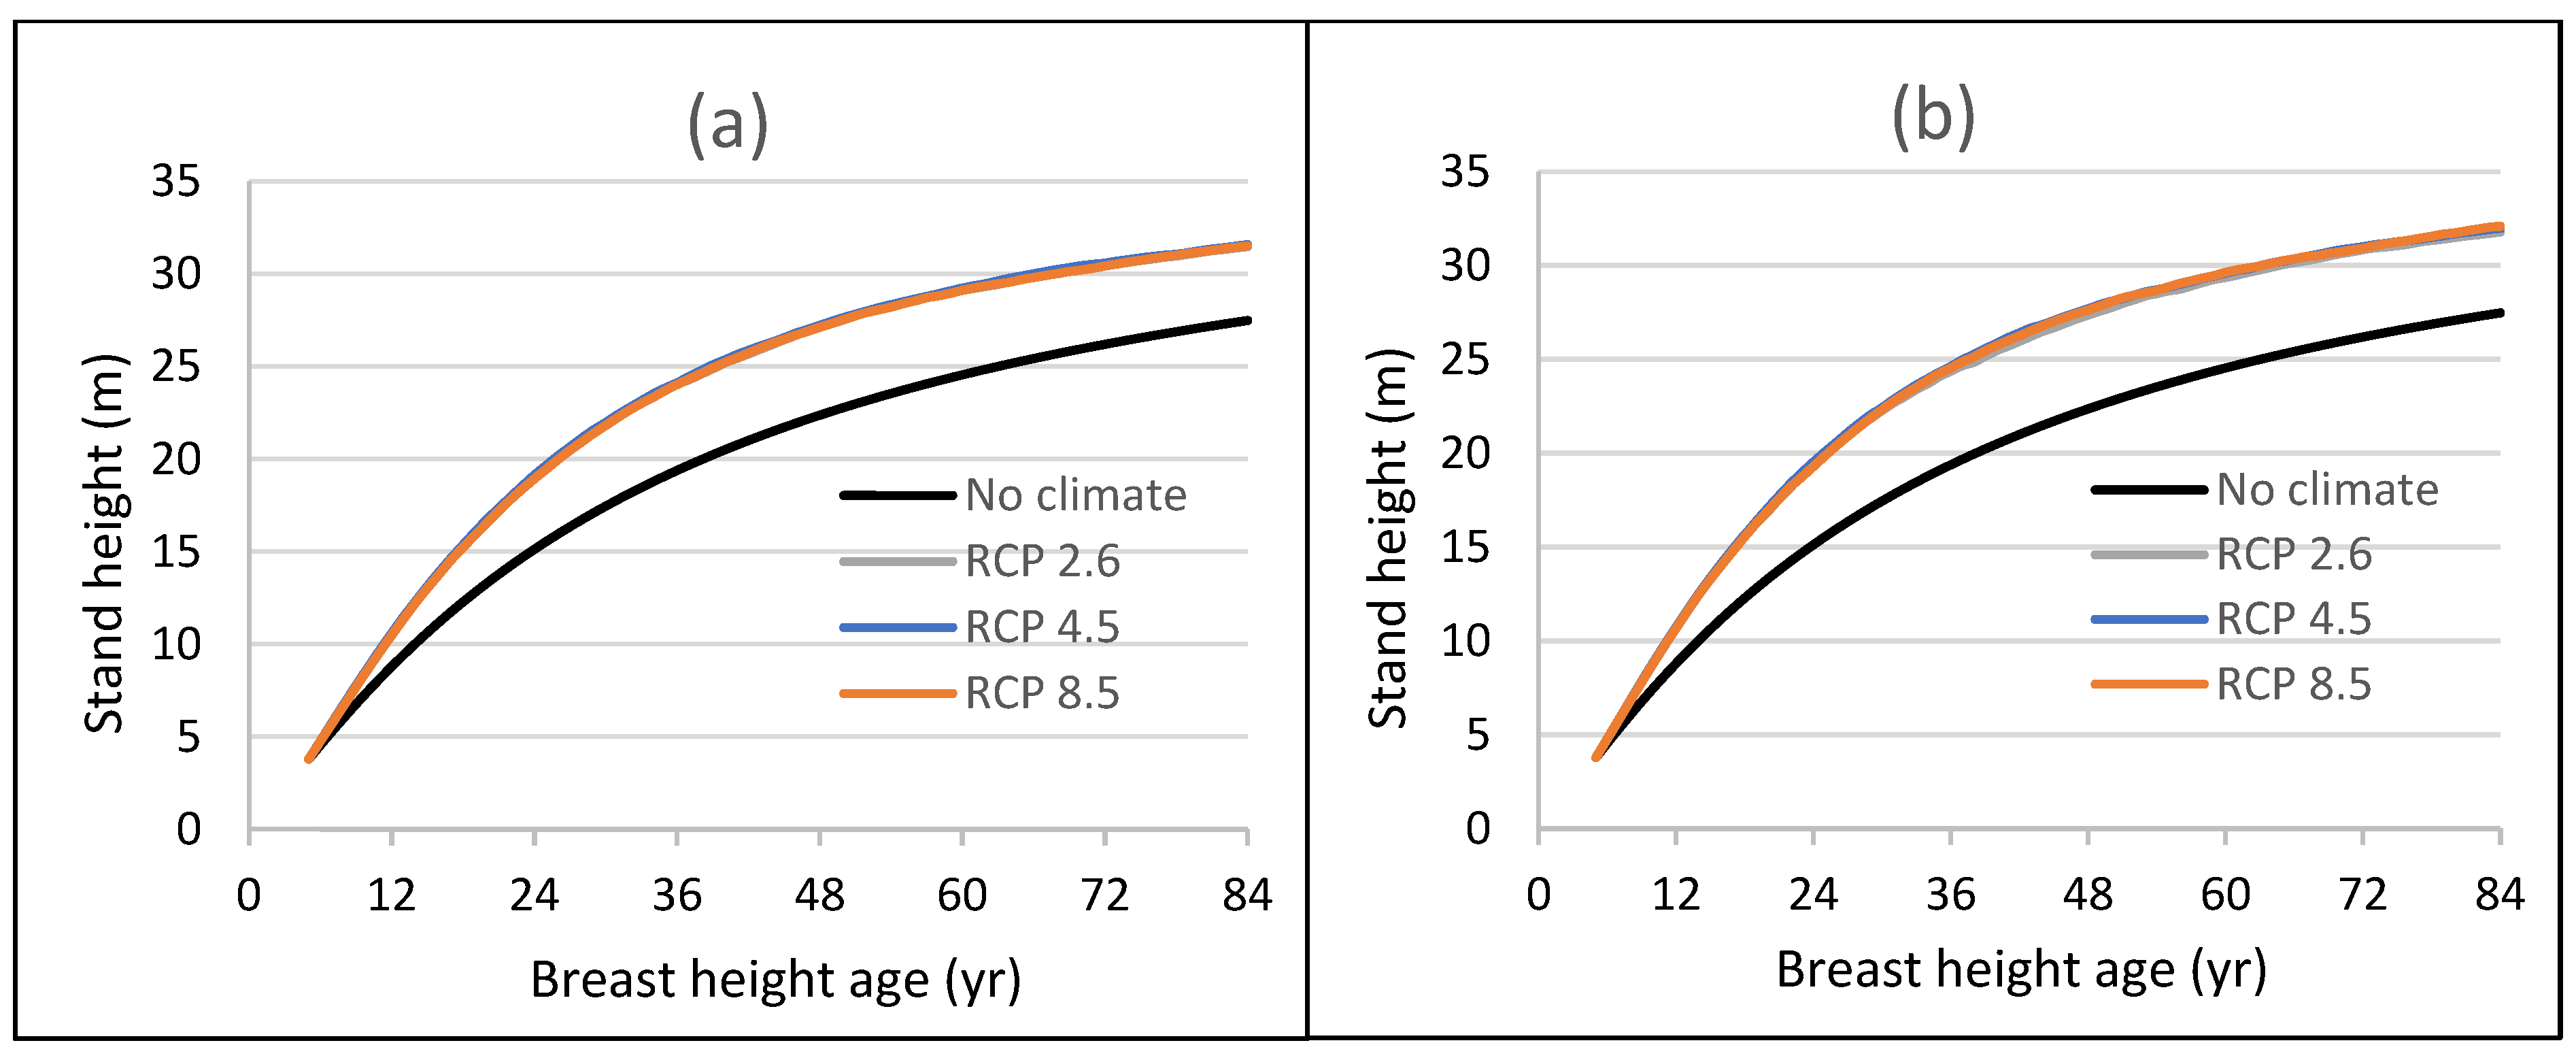
3.1. Climate Effects on Stand Height Growth

Equation (2) was initially analyzed using height–age data from jack pine and trembling aspen trees. Random effects related to the rate parameter and asymptote, along with a variance function, were included in the model fitting process. Both random effects were found to be significant at the stand scale for both species. Both variance functions (power and exponential) showed high significance in the regression analysis. However, the power function applied to height resulted in a smaller AIC for both species. Therefore, the height growth model incorporating random effects and the power variance function is formulated as follows:
H i j k = ( α 0 + b 0 i ) 1 1 α 0 + b 0 i H i j l ( k l ) A i j l ( k l ) A i j k α 2 + b 1 i + ε i j k
where Hijk is the stand height at age Aijk (kth observations of tree j at stand (site) i), Hijl is the stand height of the same tree at age Aijl at the same site (lth observations of tree j at site i and k ≠ l), and b0i and b1i are stand-scale random effects. These random effects are connected to α0 and α1, respectively, and are normally distributed with mean zero and variances σ02 and σ12, respectively (i.e., b0i ~ N(0, σ02) and b1i ~ N(0, σ12)). In addition, these are independent of εijk ~ N(0, σ2Hijkδ). Delta (δ) is the power to the height (Hijk) of the variance function. Other variables have been defined previously.
Introducing random effects in Equation (2) improved fit statistics (AIC and MSE) for both species. However, the estimated fixed effects parameters were not biologically consistent for jack pine; specifically, both the asymptote and rate parameters were overestimated when random effects were included. In contrast, for trembling aspen, the estimated values of both fixed effects parameters in the presence of random effects were reasonable and biologically consistent. Therefore, Equation (3) without random effects was employed to analyze and incorporate climate effects on stand height growth for jack pine trees. The estimated parameters for both species are presented in Table 3.
Equation (3) initially lacks climate variables. To explore the influence of climate on stand height growth, the parameters (α0 and α1) in Equation (3) were reformulated in terms of climate variables. As outlined earlier, climate variables were categorized into two groups: temperature and precipitation. Site-specific variables such as elevation, longitude, and latitude constituted a third group (site). Each fixed effects parameter (α0 and α1) in Equation (3) was subsequently modeled as a function of all 69 variables from each group individually.
When analyzed individually, many temperature- and precipitation-related variables showed significance in explaining variations in both parameters. However, the asymptote (α0), when expressed in terms of warmest quarter total precipitation (WQTP), yielded the best fit (lowest AIC and MSE values) for both species. In the presence of WQTP (related to precipitation), the rate parameter, expressed as a function of warmest quarter mean temperature (WQMT), provided the best fit for both species. With both WQTP and WQMT included, however, none of the other climate or site-related variables were significant in the model for either species. Random effects associated with the asymptote were not significant in the presence of climate variables for trembling aspen. Therefore, the final height growth models incorporating climate variables are formulated as follows:
Jack pine
H i j k = α 0 + α 2 W Q T P i 1 1 α 0 H i j l ( k l ) A i j l ( k l ) A i j k α 1 + α 3   W Q M T i + ε i j k
Trembling aspen
H i j k = α 0 + α 2 W Q T P i 1 1 α 0 H i j l ( k l ) A i j l ( k l ) A i j k α 1 + b 1 i + α 3   W Q M T i + ε i j k
where WQTPi and WQMTi are the warmest quarter total precipitation and mean temperature, respectively, at site i; α2 and α3 are coefficients of these climate variables; and all other variables are as previously defined. Estimated values of parameters for Equations (4) and (5) are listed in Table 4. Since introducing climate variables significantly improved fit statistics for both tree species, Equations (4) and (5) can be used to describe climate effects on the stand height growth of jack pine and trembling aspen, respectively, grown in naturally originated mixed stands.
Coefficients of WQTP and WQMT were both negative for both species. As a result, increasing WQTP will decrease the asymptote for both species. Similarly, increasing WQMT will negatively affect the rate of height growth of both jack pine and trembling aspen. Once the model was fit with the variance function, no further heteroscedasticity was detected for both species. This was confirmed by plotting residuals against the predicted values of stand heights. Estimates for the power of height (weight) were negative. The AIC values were decreased significantly by incorporating weight into the model for both tree species.
Climate effects on future stand height growth was assessed by predicting stand heights using Equations (4) and (5) for jack pine and trembling aspen, respectively. These predictions were made across four sites in Ontario under three emissions scenarios (RCPs) for the growth period from 2022 to 2100. Initial values of heights used here were derived from average heights of species-specific sampled trees across all 31 sites at a breast height age (BHA) of 5 years. Additionally, yearly projections of climate variables (warmest quarter total precipitation, WQTP, and warmest quarter mean temperature, WQMT) under three climate change scenarios were utilized in estimating these heights. The height-age pairs were then used to generate height–age curves (Figure 2 and Figure 3).
Climate effects were apparent on stand height growth from the beginning of the growth period for both species under all emission scenarios at all locations. The effects were negative for jack pine but positive for trembling aspen. For jack pine, the negative effects under RCP 2.6 were almost identical to those under RCP 4.5 at all locations. Height growth curves under RCPs 8.5 and 2.6 separated from each other approximately after age 50 years in the western, central, and far western locations. In the east, however, these curves separated much earlier (around 25 years), and the separation at this site was more pronounced than those at other locations. The most and least pronounced climate effects on height growth for jack pine were in the far west and central locations, respectively. Stand heights at BHA 81 years under RCP 8.5 scenario at central, western, eastern, and far western areas were shorter by 11.15, 16.66, 19.66 and 23.33%, respectively, than those estimated using Equation (3) that does not include any climate variables (Figure 2).
In the case of trembling aspen stand height growth, the overall effects of climate were positive under all emission scenarios at all locations (Figure 3). At a particular location, height growth curves under all three scenarios were almost indistinguishable from one another. The variation in climate effects on the height growth was not pronounced across locations. Stand heights at a BHA of 81 years under RCP 8.5 at western, far western, eastern, and central areas were taller by 12.22, 12.44, 12.78 and 14.37%, respectively, than those estimated using Equation (3) without climate variables.
Finally, the growth of stand heights in jack pine and trembling aspen trees, cultivated in both natural mixed and pure species stands, was compared. This involved estimating stand heights across different stand ages using the model without climate variables (Equation (3)) and models from previous studies with the same form. For jack pine, heights were estimated using Equation (3) for trees grown alongside trembling aspen (this study), Equation (3) as published by Sharma and Reid [27] for naturally occurring pure stands, and Equation (8) as published by Sharma [10] for mixed stands alongside black spruce trees.
For trembling aspen, these heights were estimated using Equation (3) for mixed stands grown with jack pine (this study) and Equation (2) published by Sharma [11] for mixed stands grown with black spruce trees. A stand height growth model for trembling aspen grown in pure natural stands was not available. Estimated heights were plotted against stand age for both tree species for all stand types (Figure 4). Average heights at a BHA of 5 years were used as initial heights in generating height growth curves for both species.
For jack pine, there was no difference in heights between pure and black spruce mixed stands until around BHA 30 years. The difference in height of jack pine mixed with trembling aspen, however, was obvious after an approximate BHA of 10 years. Thereafter, height in trembling aspen mixed stands outpaced that in pure and mixed with black spruce stands, with the difference increasing over time. For trembling aspen, height in stands mixed with black spruce was consistently lower than that in stands mixed with jack pine trees from the beginning. This indicates that interspecies competition is different for different tree species as found in [4].

3.2. Site Index Conversion Equations

The site index (height measured at an index age of 50 BHA) of trembling aspen trees was regressed linearly against the SI of jack pine trees grown in the same plot, and vice versa. The regression model is expressed as follows:
yij = β0 + β1 xij + εij
where yij is the SI of trembling aspen (jack pine) at site i and plot j, β0 and β1 are the parameters to be estimated, and xij is the SI of jack pine (trembling aspen) tree at site i and plot j. In this case, individual plot SI values were used to develop SI conversion equations so that climate variables could be included in the model. As mentioned earlier, trees from three plots at a site did not reach breast height during the same calendar year.
Equation (6) was fit without climate variables first for both species. Estimated parameters are displayed in Table 4. In this case, the coefficient of determination (R2) for both species was 32.85% (Table 4). Climate variables were then included to the right-hand side of Equation (6) and fit to SI data from both species. The following models were selected based on R2, AIC, and VIF (variance inflation factor).
Jack pine
PJSIij = β0 + β1 PTSIij + β2 (CMIMay)ij + β3 (CMIDec)ij + εij
Trembling aspen
PTSIij = β0 + β1PJSIij + β2 MinTCPij + β3 DQMTij + β4 (CMIDec)ij + εij
where PJSIij and PTSIij are the SIs of jack pine and trembling aspen, respectively; (CMIMay)ij is the May climatic moisture index; (CMIDec)ij is the December climatic moisture index; MinTCPij is the coldest period minimum temperature; DQMTij is the driest quarter mean temperature at site i and plot j; and β1β4 are regression coefficients. Other variables are as previously defined.
Equations (7) and (8) were fitted using PROC REG in SAS. The introduction of climate variables significantly improved both fit statistics (R2 and MSE) (Table 5). All climate variables were highly significant (p < 0.01) in both equations. The coefficient of determination (R2) increased from 0.3285 to 0.5644 for jack pine and from 0.3285 to 0.5928 for trembling aspen trees by including climate variables.
The introduction of climate variables into the model also improved the distribution of residuals (observed—predicted) (Figure 5). The residual plot for jack pine was very similar to that for trembling aspen. The correlation between climate variables used here was negligible as the maximum value of VIF was less than 3.33 for CMIDec in Equation (7) and 3.47 for MinTCP in Equation (8), and the rest were less than 3.0 for both models.

4. Discussion

The productivity of a site for growing trees is affected by environmental conditions including climate [28]. Changes in temperature and precipitation patterns have notably impacted the site productivity of various tree species, such as red pine, jack pine, white pine, black spruce, and white spruce, whether grown in plantations or naturally occurring pure and mixed stands across Ontario [3,10,11,20,21,22]. The direction (positive/negative) of these effects varied depending on the tree species and geographical location. Furthermore, the extent of climate influence differed among tree species and exhibited variations from east to west and north to south, even within the same stand type (plantations versus natural stands) and between pure and mixed stands. Additionally, climate variables affecting productivity also showed variability across different species and stand types [3,10,11,20,21,22,27].
In monospecific plantations, variables associated with precipitation and temperature—specifically, total precipitation of growing season (TPGS) and mean temperature of the growing season (MTGS)—played a significant role in influencing stand height growth for jack pine and black spruce trees [20]. Conversely, for planted red pine, only a temperature-related variable (MTGS) was found to be significant in the stand height growth model [22]. Similarly, the mean temperature of warmest quarters (MTWQ) and total precipitation of warmest quarters (TPWQ) were influential in explaining stand height growth variability for planted white spruce [21]. In contrast, average diurnal temperature range (ADTR) was more significant in describing the variation in stand height growth for white pine than other climate variables [3].
In naturally regenerated mixed stands, only one temperature-related variable (MTGS) was sufficient to explain the variability in stand height growth for both black spruce and jack pine trees [10]. Similarly, the average diurnal temperature range (ADTR) was the predominant climate variable influencing height growth models over others for both trembling aspen and black spruce trees [11]. However, in this study, both temperature-related variables (MTWQ) and precipitation-related variables (TPWQ) explained the most significant portion of variation in stand height growth for both jack pine and trembling aspen trees compared to other climate factors. These findings highlighted that climate effects on site productivity varied with stand type.
The results in this study showed that the interaction between jack pine and black spruce was negative (competition) but was positive (facilitation) between jack pine and trembling aspen as previously described in [29,30]. As far as climate effects are concerned, increasing the temperature of the warmest quarter could decrease the productivity of both species. Morin et al. [4] also reported that the site productivity of temperate European forests was strongly impacted by climate change, and the impact varied in the direction as well as in magnitude. The forests on the warmest sites showed a decrease in productivity, while forest on sites with the coldest conditions resulted in some increase in productivity. Their study also showed that indirect effects related to species composition on site productivity was also important in addition to direct and indirect effects of climate change. This corroborates the results found in this study.
Sharma [10] utilized observed site index (SI) values to establish SI conversion equations for jack pine and black spruce in naturally regenerated mixed stands. This was achieved by regressing the SI of one species against the SI of the other species while incorporating climate variables. The significant climate variables differed between species, except for the mean monthly minimum temperature of December, which remained consistent. Additionally, Sharma [11] analyzed SI data from measured values of trembling aspen and black spruce trees in naturally occurring mixed stands. He found no clear relationship between the SIs of trembling aspen and black spruce trees; hence, no SI conversion equations were reported.
In this study, the correlations between SIs of jack pine and trembling aspen in naturally regenerated mixed stands was examined using SI values derived from stem analysis. The SI of jack pine was found to be linearly associated with the SI of trembling aspen, and vice versa. Incorporating climate variables into the SI conversion equations strengthened this linear relationship between the two species. The climatic moisture index for December (CMIDec) was the only climate variable significant in both conversion equations. Additionally, CMIDec and the climatic moisture index for May were significant in the SI equation for jack pine. In contrast, for trembling aspen SI, in addition to CMIDec, the minimum temperature during the coldest period and the mean temperature of the driest quarter were significant.
The SI conversion equations that Nigh [5] developed for mixed stands were obtained by fitting these equations to SI data estimated using models fit to data gathered from naturally originated pure stands. However, findings from the aforementioned studies indicated that the growth patterns in mixed stands often diverge from those observed in pure stands. This contrast was particularly noticeable for black spruce and jack pine cultivated in both mixed and pure stands [10,11]. Consequently, SI models formulated for mixed stands using data derived from pure stands might lead to inaccurate conclusions.
In this study, stand heights were projected using the initial values at a breast height age (BHA) of 5 years to assess climate impacts for both species (see Figure 2 and Figure 3). Stand heights estimated from initial values at BHAs less than 5 years did not align with measured heights (significantly taller than observed heights in those stands). Hence, for future projections, it is recommended to base height estimations on initial heights measured at least at 5 years from BHA for both jack pine and trembling aspen trees cultivated in naturally occurring mixed stands.

5. Conclusions

Conversion equations for site index (SI) were established for jack pine and trembling aspen trees grown in naturally regenerated mixed stands in Ontario, Canada. Initially, the influence of climate on stand height growth for both species was examined, subsequently developing stand height growth models that integrated climate variables. The McDill–Amateis growth function served as the analytical tool to evaluate climate impacts and construct climate-sensitive models for the stand height growth of these tree species in naturally regenerated mixed stands.
Without climate variables, the correlation between SI values of jack pine and trembling aspen was modest (R2 = 0.3285). However, incorporating climate variables into the models substantially enhanced this relationship between the SI values of these tree species (R2 = 0.5644 for jack pine and 0.5928 for trembling aspen).
The height growth models developed in this study allow for the estimation of stand heights and site indices (SIs) for jack pine and trembling aspen trees grown in naturally regenerated mixed stands. Additionally, SI conversion equations enable the estimation of one species’ SI based on the SI of another species and environmental factors. If data on climate variables are unavailable, models that do not incorporate these variables can still be applied to estimate the stand height and site index of both species. Since site productivity is affected by climate and SI is the main driver of most of forest growth and yield models, climate-sensitive SI models should be developed for all major commercial tree species.

Funding

This research received no external funding.

Data Availability Statement

The data used in this study have been presented in Table 1.

Acknowledgments

This study was supported by the Ontario Ministry of Natural Resources (OMNR). The author is grateful to Daniel McKenney, Canadian Forest Service, for providing estimates of climate variables for study sites; Chris Stratton and Todd Little OMNR, for coordinating field work and producing sample location map; and Lisa Buse, Ontario Forest Research Institute, for editing an earlier version of the manuscript.

Conflicts of Interest

The authors declare no conflict of interest.

References

  1. Vanclay, J.K. Assessing site productivity in tropical moist forests: A review. For. Ecol. Manag. 1992, 54, 257–287. [Google Scholar] [CrossRef]
  2. Sharma, M.; Amateis, R.L.; Burkhart, H.E. Top height definition and its effect on site index determination in thinned and unthinned loblolly pine plantations. For. Ecol. Manag. 2002, 168, 163–175. [Google Scholar] [CrossRef]
  3. Sharma, M.; Parton, J. Modelling effects of climate on site productivity of white pine plantations. Can. J. For. Res. 2019, 49, 1289–1297. [Google Scholar] [CrossRef]
  4. Morin, X.; Fahse, L.; Jactel, H.; Scherer-Lorenzen, M.; Garcia-Valdes, R.; Bugmann, H. Long-term response of forest productivity to climate change is mostly driven by change in tree species composition. Nature 2018, 8, 5627. [Google Scholar] [CrossRef]
  5. Nigh, G. The geometric mean regression line: A method for developing site index conversion equations for species in mixed stands. For. Sci. 1995, 41, 84–98. [Google Scholar] [CrossRef]
  6. Carmean, W.H.; Hahn, J.T. Site comparisons for upland oaks and yellow popular in the central States. J. For. 1983, 81, 7361–7739. [Google Scholar]
  7. Carmean, W.H. Site Index Comparisons among Northern Hardwoods in Northern Wisconsin and Upper Michigan; USDA Forest Service, North Central Forest Experiment Station, St. Paul, MN, Research Paper NC-169; Northern Research Station: Newtown Square, PA, USA, 1979. [Google Scholar]
  8. Wang, G.G. An ecologically based model for site index conversion among species. Can. J. For. Res. 1998, 28, 234–238. [Google Scholar] [CrossRef]
  9. Carmean, W.H.; Hahn, J.T.; McRoberts, R.E.; Kaisershot, D. Site Index Comparisons for Forest Species in the Upper Great Lakes Area of the United States and Canada; General Technical Reports. NRS-113; US Department of Agriculture, Forest Service, Northern Research Station: Newtown Square, PA, USA, 2013; 39p. [Google Scholar]
  10. Sharma, M. Climate Effects on jack pine and black spruce productivity in natural origin mixed stands and site index conversion equations. Tree For. People 2021, 5, 100089. [Google Scholar] [CrossRef]
  11. Sharma, M. Climate Effects on Black Spruce and Trembling Aspen Productivity in Natural Origin Mixed Stands. Forests 2022, 13, 430. [Google Scholar] [CrossRef]
  12. McKenney, D.W.; Hutchinson, M.F.; Papadopol, P. Customized spatial climate models for North America. Bull. Am. Meteorol. Soc. 2011, 92, 1161–1622. [Google Scholar] [CrossRef]
  13. Mekis, E.; Vincent, L.A. An overview of the second generation adjusted daily precipitation dataset for trend analysis in Canada. Atmos. Ocean 2011, 49, 163–177. [Google Scholar] [CrossRef]
  14. Vincent, L.A.; Wang, X.L.; Milewska, E.J.; Wan, H.; Yang, F.; Swail, V. A second generation of homogenized Canadian monthly surface air temperature for climate trend analysis. J. Geophys. Res. Atmosph. 2012, 117, D18110. [Google Scholar] [CrossRef]
  15. Hogg, E.H. Climate and the southern limit of the western Canadian boreal forest. Can. J. For. Res. 1994, 24, 1835–1845. [Google Scholar] [CrossRef]
  16. Carmean, W.H.; Lenthall, D.J. Height growth and site index curve for jack pine in north central Ontario. Can. J. For. Res. 1989, 19, 2151–2224. [Google Scholar] [CrossRef]
  17. Cieszewski, C.J. Developing a well-behaved dynamic site equation using a modified Hossfeld IV function Y3 = (axm)/(c + xm−1), A simplified mixed-model and scant subalpine fir data. For. Sci. 2003, 49, 5391–5554. [Google Scholar]
  18. Garcia, O. Comparing and combining stem analysis data and permanent sample plot data in site index models. For. Sci. 2005, 51, 277–283. [Google Scholar] [CrossRef]
  19. Burkhart, H.E.; Tennent, R.B. Site index equations of Radiata pine in New Zealand. N. Z. J. For. Sci. 1977, 7, 408–416. [Google Scholar]
  20. Sharma, M.; Subedi, N.; TerMikaelian, M.; Parton, J. Modeling climatic effects on stand height/site index of plantation-grown jack pine and black spruce trees. For. Sci. 2015, 61, 25–34. [Google Scholar] [CrossRef]
  21. Sharma, M.; Parton, J. Analyzing and modelling effects of climate on site productivity of white spruce plantations. For. Chron. 2018, 93, 173–182. [Google Scholar] [CrossRef]
  22. Sharma, M.; Parton, J. Climatic effects on site productivity of red pine plantations. For. Sci. 2018, 64, 544–554. [Google Scholar] [CrossRef]
  23. Akaike, H. A Bayesian analysis of the minimum AIC procedure. Ann. Inst. Stat. Math. 1978, 30, 9–14. [Google Scholar] [CrossRef]
  24. Burkhart, H.E.; Tome, M. Modeling Forest Trees and Stands; Springer: New York, NY, USA, 2012; 457p. [Google Scholar]
  25. Pinheiro, J.C.; Bates, D.M. Mixed-Effects Models in S and S-PLUS; Springer: New York, NY, USA, 2000; 528p. [Google Scholar]
  26. SAS Institute. SAS Institute Inc.: Cary, NC, USA. 2008. Available online: https://www.sas.com/en_us/home.html (accessed on 20 May 2024).
  27. Sharma, M.; Reid, D. Stand height/site index equations for jack pine and black spruce trees grown in natural stands. For. Sci. 2018, 64, 33–40. [Google Scholar] [CrossRef]
  28. Clutter, J.L.; Fortson, J.C.; Pienaar, L.V.; Brister, G.H.; Bailey, R.L. Timber Management: A Quantitative Approach; Krieger Publishing Company: Malabar, FL, USA, 1983; 333p. [Google Scholar]
  29. Larocque, G.R.; Lucki, N.; Adhikary, S.N.; Groot, A.; Bell, F.W.; Sharma, M. Competition theory—Science and application in mixed forest stands: Review of experimental and modelling methods and suggestions for future research. Environ. Rev. 2013, 21, 71–84. [Google Scholar] [CrossRef]
  30. Groot, A.; Adhikary, S.; Sharma, M.; Luckai, N.; Bell, F.W.; Larocque, G.R. Effect of species composition on the production rate and efficiency of young Picea glauca–Populus tremuloides forests. For. Ecol. Manag. 2014, 315, 1–11. [Google Scholar] [CrossRef]
Figure 1. Sample and evaluation site distribution of jack pine and trembling aspen natural origin mixed stands used in this study. Data from all sites were used for analyzing climate effects on site productivity and developing climate-sensitive stand height growth models, but only evaluation sites were used to evaluate climate effects on site productivity using different future climate change scenarios.
Climate 12 00114 g001
Figure 2. Stand height profiles for naturally originated jack pine trees produced using projected values of climate variables for the growth period 2022–2100, by assuming the climate remains the same (no climate) or warms (RCPs 2.6, 4.5, and 8.5), in Equation (4) for (a) eastern (near New Liskeard), (b) central (near Geraldton), (c) western (near Thunder Bay), and (d) far western (near Manitoba border), Ontario, Canada. Projections of climate variables were made for locations close to sample sites using three emissions scenarios known as representative concentration pathways (RCPs).
Climate 12 00114 g002
Figure 3. Stand height profiles for naturally originated trembling aspen trees produced using projected values of climate variables for the growth period 2022–2100, assuming the climate remains the same (no climate) or warms (RCPs 2.6, 4.5, and 8.5), in Equation (5) for (a) eastern (near New Liskeard), (b) central (near Geraldton), (c) western (near Thunder Bay), and (d) far western (near Manitoba border), Ontario, Canada. Projections of climate variables were made for locations close to sample sites using three emissions scenarios known as representative concentration pathways (RCPs).
Climate 12 00114 g003aClimate 12 00114 g003b
Figure 4. Height growth curves produced using Equation (3) for (a) jack pine grown in naturally originated mixed stands with trembling aspen in northern Ontario, Canada, using the observed height at a breast height age of 5 years (3.78 m) as starting values, (b) trembling aspen grown with jack pine using the initial value of observed height as 3.76 m. For comparison, height growth curves of jack pine in pure stands and mixed with black spruce were produced using the same equation with the parameters listed in Table 4 of Sharma and Reid [27] and Table 3 of Sharma [10], respectively. Similarly, a height growth curve of trembling aspen mixed with black spruce was produced using the same equation with estimated parameters included in Table 2 of Sharma [11].
Climate 12 00114 g004
Figure 5. Residuals of the trembling aspen site index (SI) estimated using (a) Equation (6) and (b) Equation (8) plotted against predicted values of site indices.
Climate 12 00114 g005
Table 1. Summary statistics for site index (SI), total height, DBH, total age, breast height age (BHA), and climate variables for jack pine and trembling aspen trees used in this study. WQMT and WQTP represent the warmest quarter mean temperature and precipitation, respectively; MinTCP is the minimum temperature of coldest period; DQMT is the driest quarter mean temperature; and CMIMay and CMIDec are the climatic moisture indices of May and December, respectively. (N = number of samples and SD = standard deviation).
VariableNMeanSDMinMax
Jack pine
Total age (year)9380.0621.8439.00127.00
BHA (year)9376.5321.6336.00124.00
Total height (m)9321.662.7115.8028.50
DBH (cm)9328.985.5417.4045.80
SI (m)2718.202.0715.3122.32
Trembling aspen
Total age (year)9377.8419.7741.00129.00
BHA (year)9374.5819.8339.00126.00
Total height (m)9322.032.7116.6431.50
DBH (cm)9329.885.4619.0043.50
SI (m)2918.531.8314.9621.97
Climate variables
WQMT (°C)233516.171.3312.4019.90
WQTP (mm)2335247.3346.67115.00415.00
MinTCP (°C)2335−24.813.18−34.50−16.60
DQMT (°C)2335−10.525.02−20.5014.90
CMIMay23350.523.17−7.0110.24
CMIDec23354.451.870.6818.11
Table 2. Climate variables evaluated in analyzing climate effects in this study.
1. Longitude
2. Latitude
3. Elevation
4. Mean diurnal temperature range (MDTR) (mean (period max-min))
5. Isothermality (MDTR/annual temperature range)
6. Temperature coefficient of variation
7. Max temperature of the warmest period
8. Min temperature of the coldest period
9. Temperature annual range
10. Mean temperature of the wettest quarter
11. Mean temperature of the driest quarter
12. Mean temperature of the warmest quarter
13. Mean temperature of the coldest quarter
14. Annual precipitation
15. Precipitation of the wettest period
16. Precipitation of the driest period
17. Precipitation coefficient of variation
18. Precipitation of the wettest quarter
19. Precipitation of the driest quarter
20. Precipitation of the warmest quarter
21. Precipitation of the coldest quarter
22. Julian day number at the start of the growing season
23. Julian day number at the end of the growing season
24. Number of days of the growing season
25. Total precipitation for period 1
26. Total precipitation for period 3
27. GDD above base temperature for period 3
28. Annual mean temperature
29. Annual minimum temperature
30. Annual maximum temperature
31. Mean temperature for period 3
32. Temperature range for period 3
33. January mean monthly minimum temperature
34. February mean monthly minimum temperature
35. March mean monthly minimum temperature
36. April mean monthly minimum temperature
37. May mean monthly minimum temperature
38. June mean monthly minimum temperature
39. July mean monthly minimum temperature
40. August mean monthly minimum temperature
41. September mean monthly minimum temperature
42. October mean monthly minimum temperature
43. November mean monthly minimum temperature
44. December mean monthly minimum temperature
45. January mean monthly maximum temperature
46. February mean monthly maximum temperature
47. March mean monthly maximum temperature
48. April mean monthly maximum temperature
49. May mean monthly maximum temperature
50. June mean monthly maximum temperature
51. July mean monthly maximum temperature
52. August mean monthly maximum temperature
53. September mean monthly maximum temperature
54. October mean monthly maximum temperature
55. November mean monthly maximum temperature
56. December mean monthly maximum temperature
57. January mean monthly precipitation
58. February mean monthly precipitation
59. March mean monthly precipitation
60. April mean monthly precipitation
61. May mean monthly precipitation
62. June mean monthly precipitation
63. July mean monthly precipitation
64. August mean monthly precipitation
65. September mean monthly precipitation
66. October mean monthly precipitation
67. November mean monthly precipitation
68. December mean monthly precipitation
69. Climatic moisture index
Table 3. Parameter estimates, standard error (SE), MSE (σe2), variance of b0 (σ02), variance of b1 (σ12), covariance of b0 and b1 (σ0 σ1), power variance (δ) to the height, and Akaike’s information criterion (AIC) for Equation (3) for jack pine and trembling aspen trees grown in natural mixed stands in Ontario, Canada.
ParametersJack PineTrembling Aspen
EstimatesSEEstimatesSE
α034.81510.300636.74820.8591
α11.16050.00831.15260.0308
σe20.2751--0.0727--
σ02----120.0100--
σ12----0.0251--
σ0σ1----−1.0689--
δ−1.40940.0351−0.68400.0330
AIC−13,249--−9437--
Table 4. Parameter estimates, standard error (SE), MSE (σe2), variance of b1 (σ12), power variance (δ), and Akaike’s information criterion (AIC) for Equation (4) for jack pine and (5) for trembling aspen trees grown in naturally originated mixed stands in Ontario, Canada.
ParametersJack PineTrembling Aspen
EstimatesSEEstimatesSE
α039.68550.740641.62941.3594
α11.93440.05631.741400.0964
α2−0.021350.0026−0.022020.0050
α3−0.049030.0035−0.015800.0057
σe20.2605--0.08811--
σ12----0.1661--
δ−1.40570.0310−0.73560.0318
AIC−13,553--−9090--
Table 5. Estimated parameters (standard errors in parentheses) and fit statistics (MSE (σe2), Akaike’s information criterion (AIC), and R2) for Equations (6)–(8) for jack pine and trembling aspen trees from Ontario, Canada.
ParametersJack PineTrembling Aspen
Equation (6)Equation (7)Equation (6)Equation (8)
β06.1024 (2.0068)4.14456 (1.8105)9.3209 (1.523)35.9208 (5.3729)
β10.6529 (0.1078)0.35609 (0.0172)0.5031 (0.083)0.2062 (0.0912)
β2--−1.67383 (0.3781)--1.4858 (0.2649)
β3--1.88047 (0.2996)--−1.0911 (0.2102)
β4------1.1423 (0.2054)
σe23.94342.62833.03841.9191
R20.32850.56440.32850.5928
Disclaimer/Publisher’s Note: The statements, opinions and data contained in all publications are solely those of the individual author(s) and contributor(s) and not of MDPI and/or the editor(s). MDPI and/or the editor(s) disclaim responsibility for any injury to people or property resulting from any ideas, methods, instructions or products referred to in the content.

