Article

Development of a Spatial Synoptic Classification Scheme for East Africa with a Focus on Kenya

by
Daniella C. Alaso
1,
Jason C. Senkbeil
1,* and
Scott C. Sheridan
2
1
Department of Geography and the Environment, The University of Alabama, Tuscaloosa, AL 35401, USA
2
Department of Geography, Kent State University, Kent, OH 44242, USA
*
Author to whom correspondence should be addressed.
Climate 2024, 12(9), 133; https://doi.org/10.3390/cli12090133
Submission received: 22 July 2024 / Revised: 21 August 2024 / Accepted: 30 August 2024 / Published: 2 September 2024

Abstract

:
Despite the wide range of applications of the Spatial Synoptic Classification (SSC), its expansion and utility in the tropics remains limited. This research utilized the fifth generation of European ReAnalysis (ERA5) data to develop an SSC scheme tailored for East Africa with a focus on Kenya. The SSC method classifies weather into seven types: Dry Polar (DP), Dry Moderate (DM), Dry Tropical (DT), Moist Polar (MP), Moist Moderate (MM), Moist Tropical (MT), and Transitional (TR). Frequency and trend analysis between 1959 and 2022 show that the MT and DM weather types are the dominant types in Kenya. The DM type is dominant in the December–February (DJF) dry season while the MT type is common from April to September. We find statistically significant decreasing trends in the DM, MP, and MM weather types and increasing trends in the DT and MT weather types. The results suggest that, generally, the number of days with cool and moderate conditions in Kenya is decreasing, while the number of days with warmer conditions is increasing. This research indicates the potential for the SSC to be utilized in different applications in East Africa including investigating heat vulnerability, as increasing temperatures could be a significant risk factor to human health.

1. Introduction

Synoptic weather typing is a common approach in many climate impact studies. The goal of synoptic climatology is to understand the relationship between the surface environment and the overlying atmospheric circulation [1], which has become increasingly important for global climate change studies and societal implications. Synoptic climatologists employ two main methods to characterize weather: map pattern-based classifications and air mass-based classifications. The former focuses on characterizing the atmosphere surrounding a specific location commonly using pressure or wind fields, while the latter involves classifying days based on air masses with similar thermal and moisture characteristics [2]. Despite the differences, both map pattern-based techniques and air mass classifications are greatly utilized in studying environmental phenomena and global environmental change. The choice of which method to use is primarily dependent upon the type of environmental phenomena being evaluated and the researcher’s goals. In bioclimatology research, for instance, classifications based on air masses may have some practical advantages over those based on pressure and wind fields [2]. This is because organisms generally respond to the thermal and moisture characteristics of the atmosphere [3] rather than to the pressure or wind fields indirectly.
One of the most comprehensive air-mass classifications is the SSC [4]. The SSC was initially developed for the Eastern and Central USA and subsequently modified and expanded geographically [2,4]. This classification scheme, based on a numerical characterization of weather types using surface weather data, has proven to be a valuable analytical tool in various climatological investigations worldwide. It utilizes a combination of weather variables, such as temperature, dew point, air pressure, wind speed, wind direction, and cloud cover, to categorize the state of the atmosphere into seven weather types specified a priori [4]. It has been used in over 100 published articles from topics such as urban heat islands [5] to past and future climatic variability [6,7,8]. The SSC has gained the most traction in climate and health applications. Studies have found that certain oppressive SSC types of the MT/MT+ and DT/DT+ are associated with increased risks to human health [9]. For instance, Lee et al. [10] observed that the DT weather type was associated with an increase in mortality during early summer months in select cities of Republic of Korea. Despite its wide range of applications, there is limited use of the SSC outside the midlatitudes, especially in developing nations with restricted access to reliable climate data [11]. It is believed that the SSC or similar research has not been developed for East Africa or utilized in research within the region.
The purpose of this paper is to develop a Spatial Synoptic Classification Scheme for East Africa with a focus on Kenya, and to analyze climatological trends based on the SSC weather types. Kenya is one of the largest and most populated countries in the region, and its latitude on the equator provides a central location for the study domain and the processes that influence climate in the region. Given its potential for the spatial and temporal analysis of climatic variability, the development of the SSC for Kenya and other tropical countries may prove to be valuable for climate research. Like most African countries, Kenya is vulnerable to the impacts of climate variability and change [12]. For example, in recent years, it has witnessed an increase in frequent and extreme droughts exacerbated by the decline in March–May (MAM) rains [13], leading to loss of lives and contributing to socioeconomic instability [14].
In studies analyzing climate change, the temporal evolution of individual weather variables such as air temperature has been given more attention [15], compared to the time series of groups of weather variables. The knowledge and prediction of the evolution of groups of weather variables with respect to climate change impacts is of greater concern, as organisms typically respond to the synergistic behavior of a range of atmospheric variables that affect it, rather than to a single weather variable such as air temperature [16]. Therefore, this study aims to improve the understanding of the climate in Kenya, paying more attention to temporal changes in groups of weather variables.
In this research, the SSC for Kenya was developed using the fifth generation of the European ReAnalysis (ERA5) data [17] for the years 1959–2022. The specific objectives were as follows: (1) to examine the dominant SSC weather types over Kenya and their thermal and moisture characteristics; (2) to determine the frequency of each weather type on both an annual and seasonal basis; and (3) to determine whether there is coherence between the different SSC weather types and climate variability and seasonality in Kenya. It is hoped that the results from this research will open more avenues for SSC applications in the tropics and, in particular, in African countries, where its application remains very limited.

2. Background

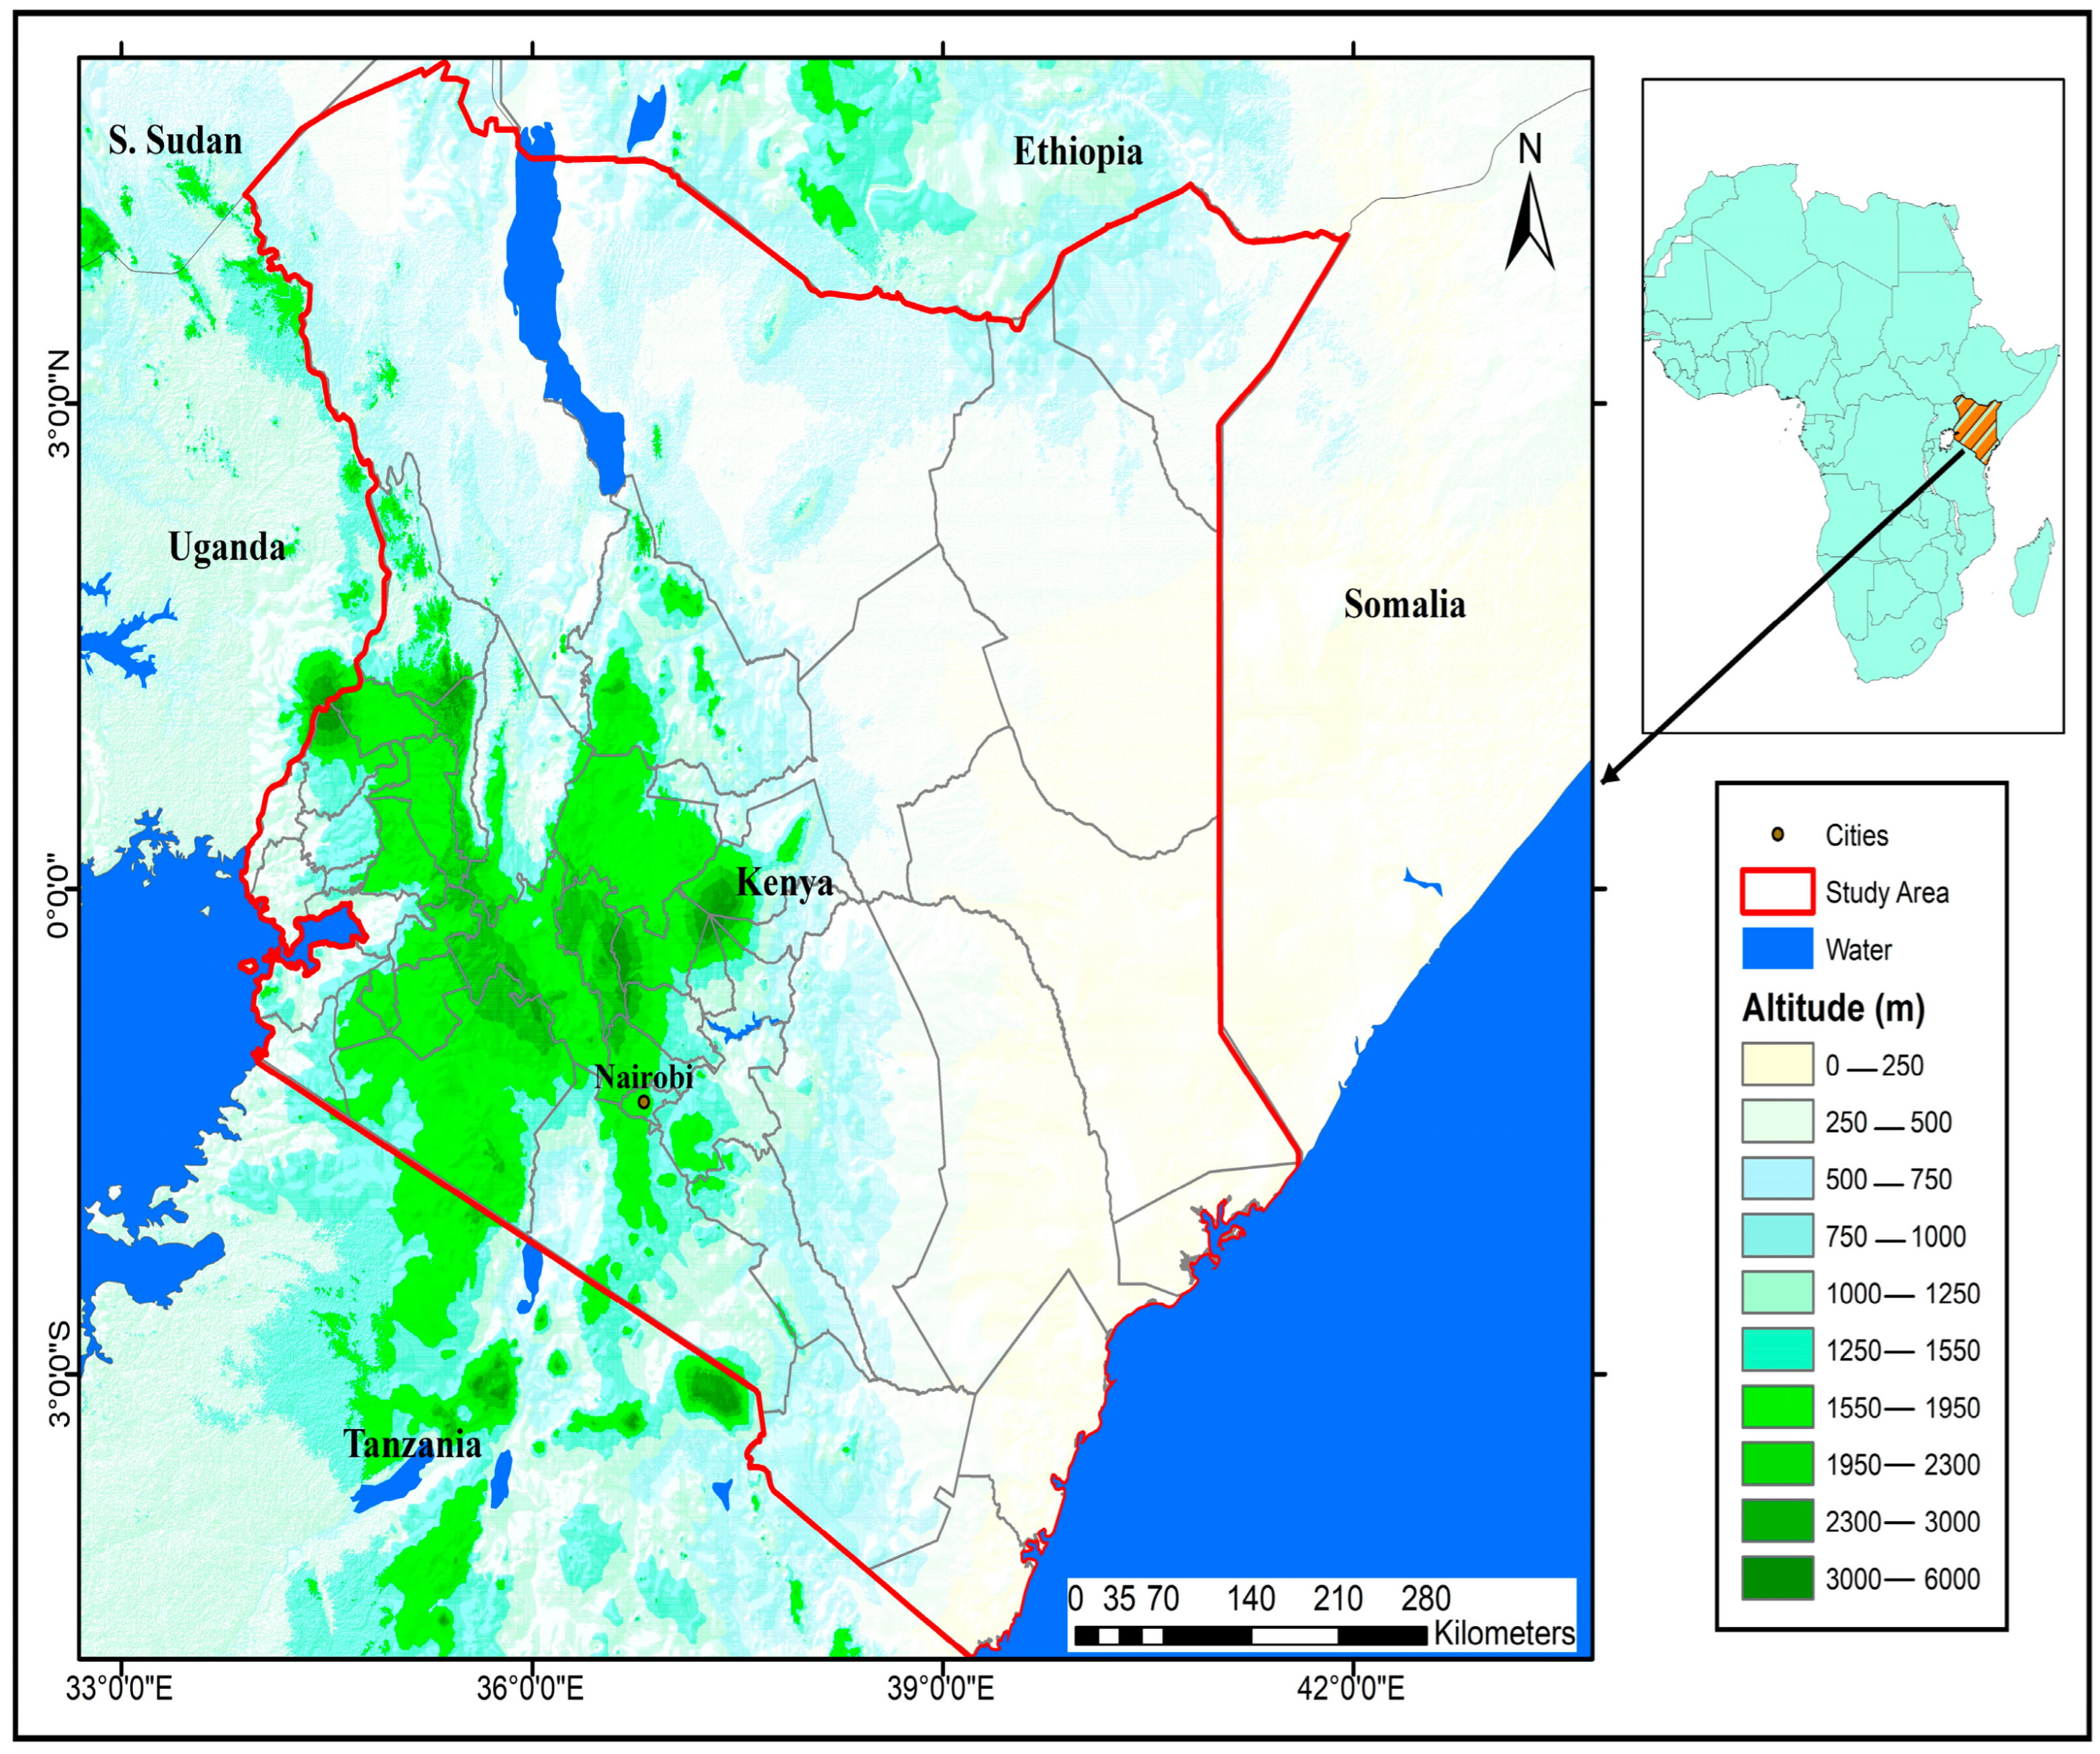
2.1. Climate of Kenya

Under the updated Köppen-Geiger classification [18], Kenya is dominated by an arid climate—arid steppe hot (BSh) and arid desert hot (BWh)—with over 80% of the country classified as arid or semi-arid lands (ASALs). In general, the lower elevation coastal region is characterized by hot and humid conditions due to its proximity to the Indian Ocean (Figure 1). The Eastern and Northeastern regions are mostly ASALs characterized by high temperatures and low rainfall totals, while the Central and Rift Valley highlands are characterized by lower temperatures and high precipitation totals. The mean annual temperature and precipitation of select towns in Kenya for the years 1991–2020 is found in Table 1.
The rainfall pattern is bimodal with two rainy seasons, March–May (long rains) and October–November (short rains), and two dry seasons, with high inter-annual and spatial variability [20,21]. The main explanation for the two rainy seasons is the North–South movement of the Inter Tropical Convergence Zone (ITCZ) [22]. Other precipitation controls include local topographical features such as Mount Kenya and Lake Victoria, large-scale controls such as the Madden Julian Oscillation [23], El Niño Southern Oscillation [20], and the Indian Ocean Dipole (IOD) [24,25]. For instance, warming (cooling) in the western Indian Ocean is associated with a positive (negative) phase of the IOD. The positive phase of the IOD is associated with enhanced precipitation over Kenya [26].

2.2. Spatial Synoptic Classification

The SSC is based on the classification of daily surface weather conditions at a particular location into one of the seven weather types. In the SSC approach, weather types are based on the identification of homogeneous groups of weather variables, rather than distinct source regions [4]. Therefore, the weather type present in a particular region can vary between different locations on the same day, depending on the prevailing synoptic weather patterns and the local terrain characteristics. The following are generic descriptions of the SSC weather types, although for Kenya, these descriptions could be modified with an emphasis on tropical meteorology and more detailed analysis and understanding:
Dry polar (DP)—associated with the lowest temperatures in a region for a particular time of year, as well as with clear skies and dry conditions.
Dry moderate (DM)—associated with dry, mild conditions. It arises when a traditional air mass such as Moist Tropical (MT) has been advected far from its source region and, thus, modified considerably.
Dry tropical (DT)—created through either advection from arid regions, rapidly descending air either via orography, or subsidence of air. It is associated with the hottest and driest conditions in a particular region.
Moist polar (MP)—cloudy, humid, and cool conditions. Primarily created through inland transport of cool maritime air.
Moist moderate (MM)—markedly warmer and more humid than MP. It can arise within an MT air mass on days when high cloud cover suppresses the temperature.
Moist tropical (MT)—warm to hot and humid.
Transitional (TR)—represents days that characterize a shift from one weather type to another based on large changes in pressure, dew point, and wind over the course of the day.
In response to the limited applicability of the SSC weather types in the warm tropics and sub-tropics where one weather type dominates most of the year, MT+ (moist tropical plus) and MT++ (moist tropical double plus) were developed to represent excessively hot and humid environments. Other subsets include DP+, DP++, DT+, DT++, MP+, MP++, TR+ and TR++. The subsets are based on being one standard deviation or more from the mean for the type based on thermal characteristics. For DP and MP, this would be one standard deviation below the mean apparent temperature, and for DT and MT, one above. All SSC descriptions are acquired from http://sheridan.geog.kent.edu/ssc.html (accessed on 10 May 2024).

3. Materials and Methods

For SSC development, ERA5 hourly reanalysis data [17] with a horizontal resolution of 0.25° × 0.25° degrees latitude and longitude were utilized. ERA5 is the latest reanalysis of the European Centre for Medium-Range Weather Forecasts (ECMWF) and provides an upgrade to the previously used ERA-Interim [27]. In general, atmospheric reanalysis has generated increasing interest in the recent decade, due to its ability to provide long, complete, and consistent time series of multiple meteorological parameters [28]. In this research, the ERA5 data provided meteorological variables in areas with historically little coverage of synoptic stations. The ERA5 data were obtained for the years 1959–2022 for the geographical coordinates surrounding Kenya at latitude 5° N–5° S and longitude 34° E–42° E (Figure 1). Six meteorological variables (air temperature, dew point temperature, mean sea level pressure (MSLP), wind direction, wind speed, and cloud cover) at six-hour intervals (0300, 0900, 1500, and 2100 GMT) were utilized in the analysis.
Based on the SSC version 3 (SSC3) approach [4] (https://sheridan.geog.kent.edu/ssc3.html, accessed on 20 August 2024), seed days are automatically selected based on the latitude, month of the year, mean and standard deviation of the weather variable for the month, and annual temperature range. Seed days are those that represent the typical surface meteorological characteristics of each weather type at a particular location [4]. Algorithms are used to produce theoretical seed days for each weather type for each day of the year [4,29]. Actual meteorological conditions are then compared to the seed days, and each day is classified as the weather type it most closely resembles (lowest error score based on equal-weighted z-scoring). Once this process is complete, a weather-type calendar becomes available whereby each day in a particular location for the study period is classified into one of the SSC weather types. The weather calendar created for Kenya can be found at http://sheridan.geog.kent.edu/ssc3.html (accessed on 20 August 2024) with the station code “KEN”.
The SSC3 approach developed in 2019 represents a methodological advance over the SSC2 (https://sheridan.geog.kent.edu/ssc3.html, accessed on 20 August 2024). The SSC2 approach originally developed for North America was a hybrid method and required a time-consuming manual identification of seed days for each of the weather types for each station in a region. The SSC2 approach needed stations with long records of data to ensure that there were enough seed days for each SSC type for each year. The concept of the SSC3 is similar to SSC2 and SSC1; however, the automation of the seed day criteria makes the SSC3 easily reproducible. Furthermore, the SSC3 approach (based on pre-defined regression models) has made it possible for the utility of gridded data in SSC development. Previous SSC versions (SSC1 and SSC2) utilized weather station data. More information on the methodology of SSC 1 (developed for select stations within the United States) and SSC 2 (originally developed for North America and expanded to Europe) can be found in Kalkstein et al. [2], Sheridan [4], and Bower et al. [30], respectively.
Once the SSC calendar was developed, the frequency of occurrence of each weather type was computed as a percentage of the total number of days in the study period. Similar to Senkbeil et al. [7], Ordinary Least Squares (OLS) regression was used to explore trends in annual and seasonal weather type frequency throughout the 1959–2022 period. A Kolmogorov–Smirnov (K–S) test was used to test for normality of the weather type frequencies. For the interannual frequencies, only the DM and MT weather types had a normal distribution. For the seasonal frequencies, the DJF (DT, MP, MM, TR, DT+, and MT+), MAM (DT, MP, MM, TR, DT+, and MT+), JJA (DM, DT, MP, MM, TR, DT+, and MT+), and SON (DM, DT, MP, MM, TR, DT+, and MT+) weather types were found to be non-normally distributed. Non-parametric Mann-Kendall trend tests were used in conjunction with OLS regression for the weather types with non-normally distributed data.

4. Results and Discussion

4.1. SSC Weather Type Characteristics in Kenya

The meteorological conditions of the SSC weather types for Kenya are found in Table 2. Each weather type represents distinct thermal and moisture characteristics. The coolest weather type is the MP type with temperatures ranging from 23–26 °C annually. Its cloud cover range has the highest values, suggesting cool and cloudy conditions.
The warmest weather type is the DT+, with temperatures ranging from 27 to 32 °C throughout the year. Notably, the DT type has the lowest cloud cover fraction, suggesting clear skies, dry, and hot conditions. It is interesting to note that other than the MP, MM, and MT weather types, all other weather types in Kenya have lower mean apparent temperature values compared to the air temperature values. This is most likely due to the low dew point temperatures and low cloud cover associated with many of these weather types in Kenya.
Despite similarities in the generic nature of the SSC weather types globally, there are differences in their absolute physical characteristics, reflecting regional climatological differences. For instance, as expected, the MP type in Kenya is milder compared to the North American [4] and European [30] counterparts. In addition, the SSC weather types in Kenya have a low annual temperature range, characteristic of regions closer to the equator. In contrast, the SSC types in the subtropics have larger annual temperature variability reflecting seasonal changes.

4.2. Seasonality of the SSC Weather Types

Seasonality in Kenya is displayed in the SSC patterns. Table 3 shows the mean frequencies of occurrence of each SSC weather type over Kenya. Annually, the MT and DM weather types occur most often at frequencies of 40.3% and 28.2%, respectively. The DM weather type dominates the months of January (39.7%) and February (39.6%). January and February are linked to the DJF dry season in Kenya. Similarly, the DT and DT+ types occur most frequently in the DJF dry season with peak frequencies of 14.6% and 4.9% in January, respectively. The MT weather type dominates the months of April (44.7%), May (44.9%), June (49.9%), July (56.1%), and August (51.9%). May is linked to the peak of the MAM rain seasons, which are associated with cloudy and wet conditions. July is linked to the JJA dry season associated with cooler and dry conditions over most of Kenya with some precipitation over the Western Highlands and Coastal area [20]. Low precipitation amounts in this season are associated with enhanced wind divergence and wind shear due to the strengthening of the Somali Jet [31]. This monsoonal flow lasts from June to September bringing relatively dry and cool air from the Southern Hemisphere, resulting in atmospheric stability in Eastern Kenya [32]. The presence of the East African highlands plays an integral role in the confinement of the meridional flow of this jet along the coast with southerly flow in the boreal summer and northerly flow in the boreal winter [33]. The TR weather types in Kenya have a bimodal peak in April (10.2%) as the ITCZ transitions north of the equator, and in November (13.3%) as it retreats southwards.
Annually, the DP and MP weather types rarely occur. The MP type occurs at a frequency of 3.6% and the DP type at a frequency close to 0% (Table 3). The DP weather type only penetrates the region in June (0.1%).

4.3. Trends in SSC Weather Types

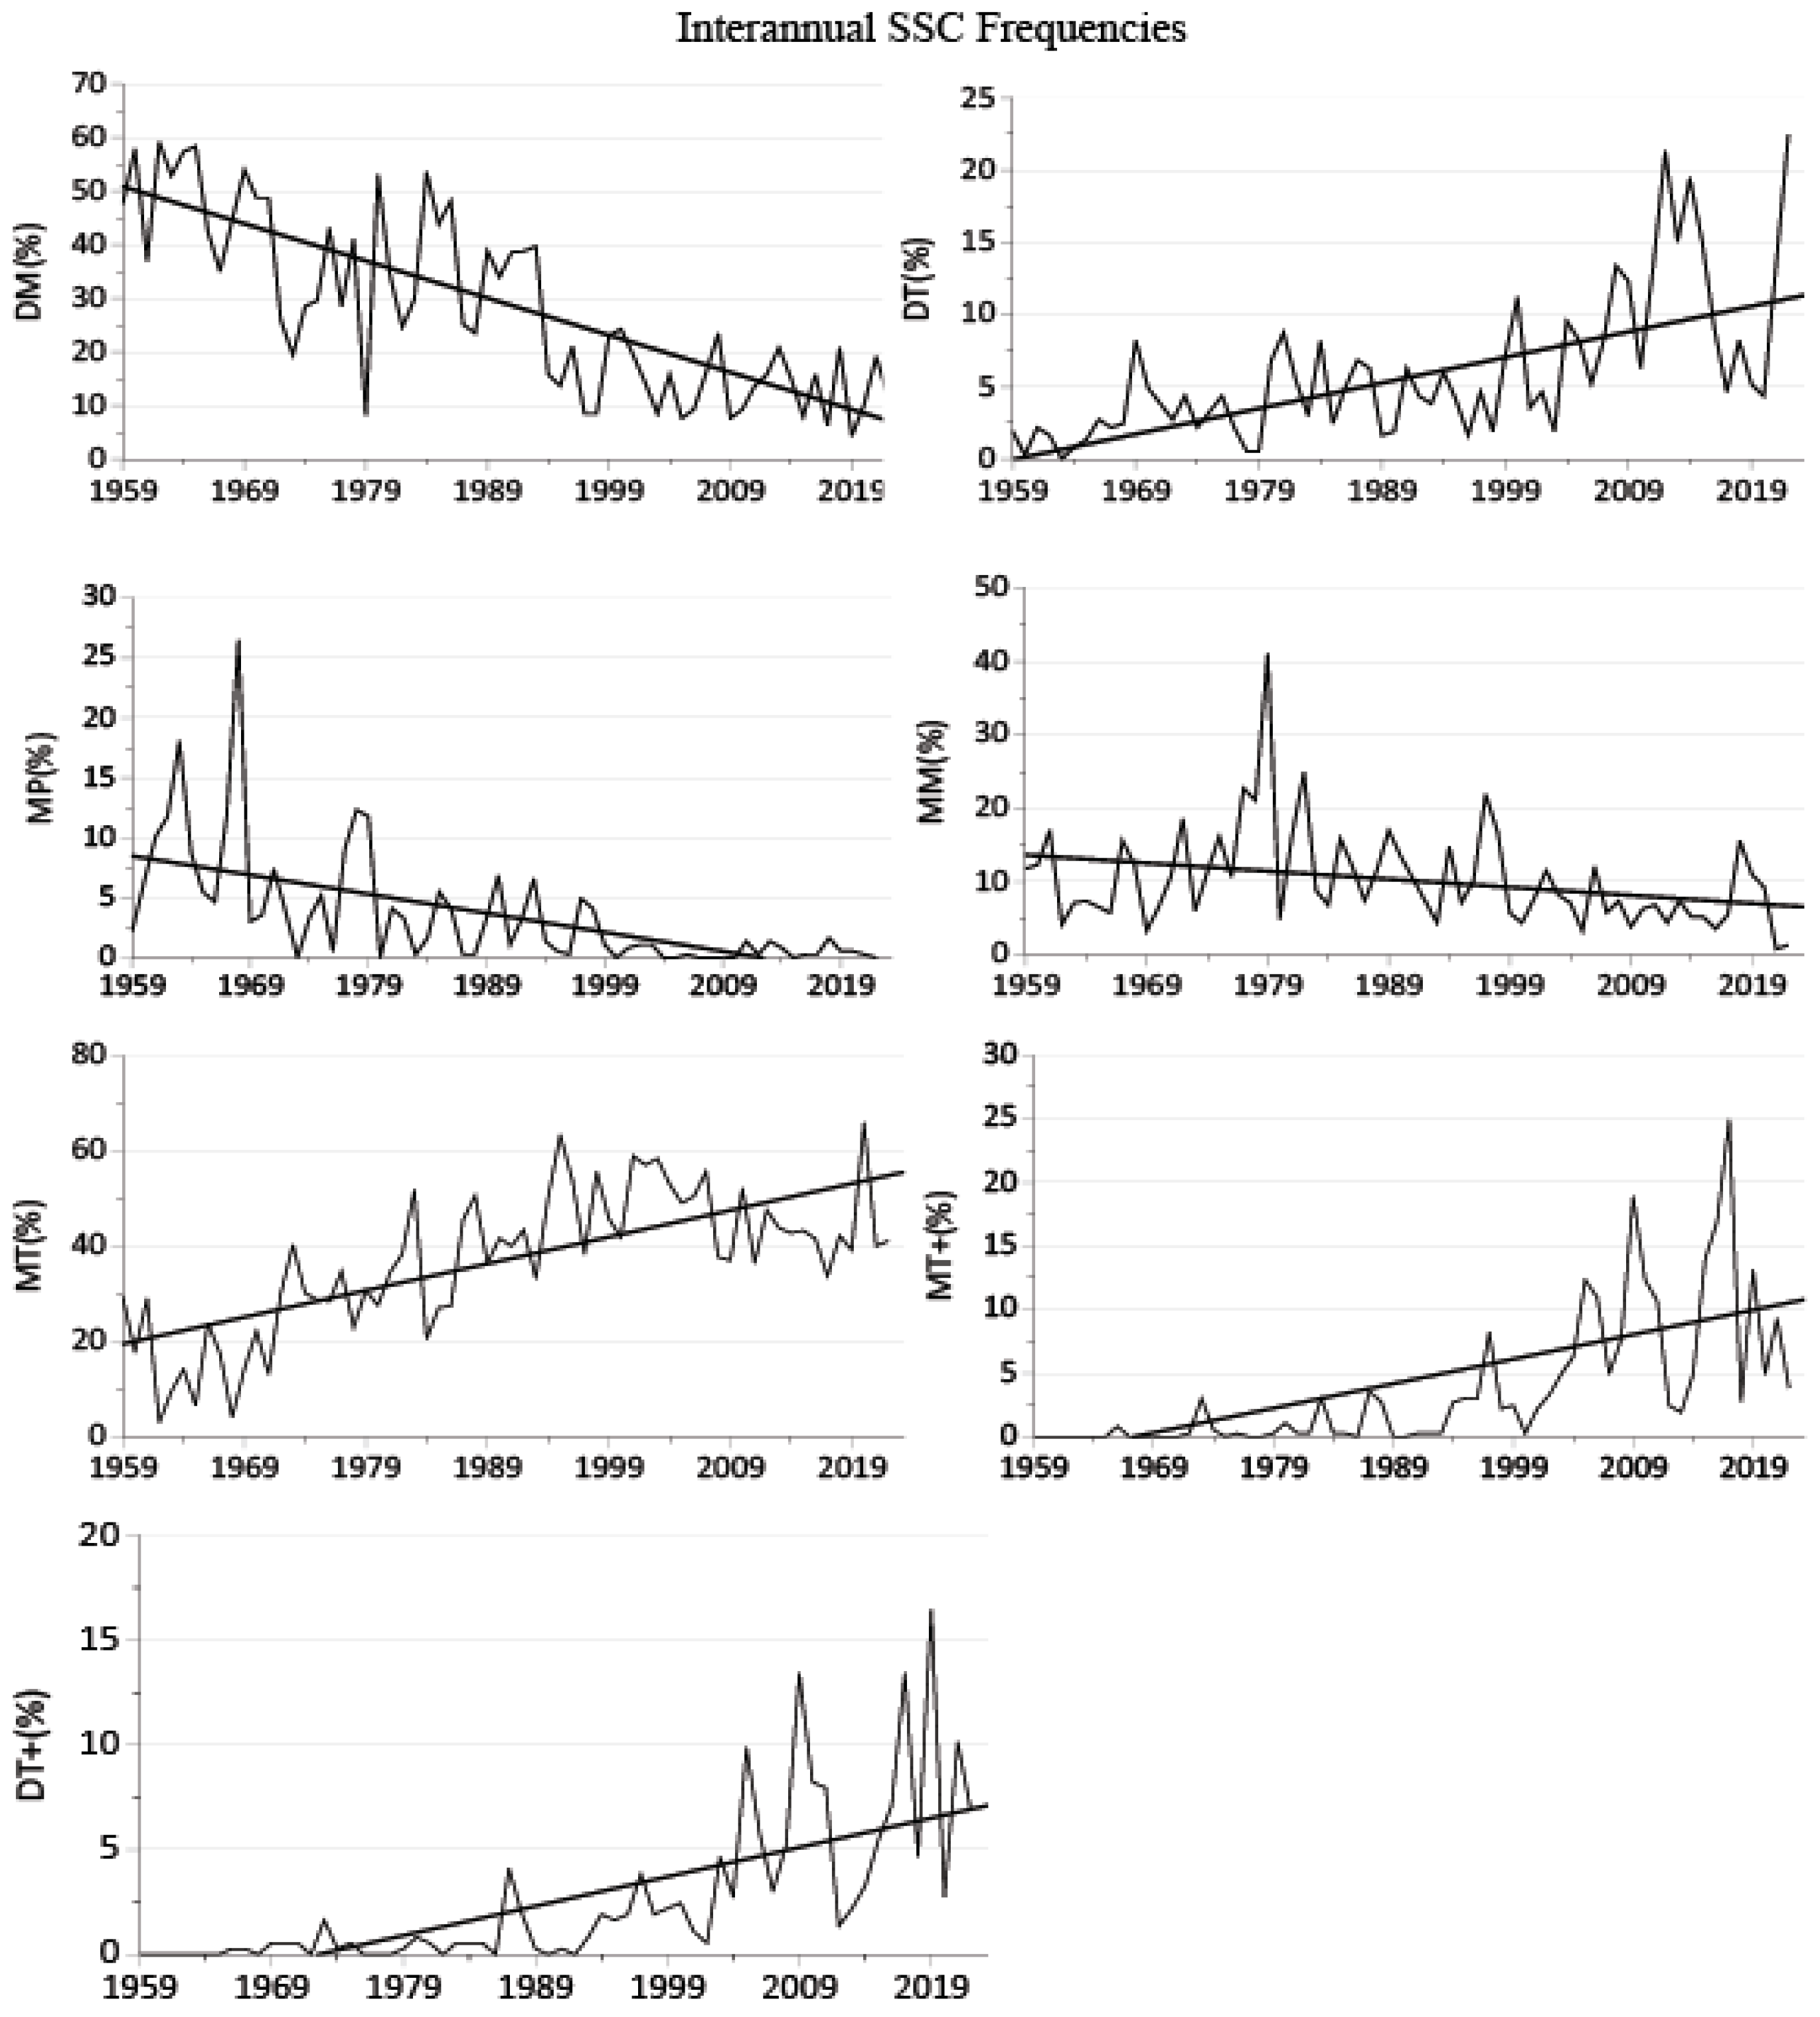
4.3.1. Interannual Variability

The long-term annual trends in the occurrence of the different SSC weather types in Kenya were analyzed from 1959 to 2022. Statistically significant trends show a decrease in the frequency of occurrence of the DM, MP, and MM weather types, and an increase in the occurrence of the DT and MT weather types (Figure 2). The DM weather type occurred at an average frequency of approximately 50% in the 1960s and has declined to 13% in the past decade (p < 0.001, r2 = 0.626) (Table 4). The DT (p < 0.001) and MT (p < 0.001, r2 = 0.502) weather types have increased in occurrence from a mean frequency of approximately 2% and 14% in the 1960s to 12% and 43% in the past decade. The frequency of occurrence of the oppressive weather types of DT+ (p < 0.001) and MT+ (p < 0.001) has also increased from 0.1% to 7% and 10%, respectively, over the same timeframe. This suggests that there is a general decline in the frequency of occurrence of cool and moderate conditions in Kenya, and an increase in the occurrence of days with warmer temperatures, indicating that the region has been affected by long-term changes in climate.
The increase in warmer weather types in Kenya is in agreement with previous studies of an increasing trend in temperature over the region. Ayugi and Tan [34] found that the mean maximum (minimum) temperature in Kenya had increased by 1.2 °C (0.3 °C) between 1971 and 2010. Ongoma et al. [35] found a decrease in the diurnal temperature range over Kenya, with a likelihood of warm days increasing and a reduction of cooler nights in the future. Gebrechorkos et al. [36] found an increasing trend in temperature over East Africa between 1979 and 2010 with an increasing trend in T-max (up to 1.9 °C) and T-min (up to 1.3 °C) in Kenya. In addition, local studies found an increasing trend in temperature in the Northern Arid and Semi-Arid Lands (ASALs) of Kenya (Turkana, Marsabit, Samburu, and Isiolo) between 1961 and 2013, with an increase in mean seasonal maximum and minimum temperature by 0.74 °C and 0.60 °C, respectively [37].
To further investigate these long-term changes in climate, this research also used 2 m temperature anomalies over East Africa as well as Indian Ocean Sea Surface Temperature (SST) anomalies from different reanalysis datasets. The results from the reanalysis datasets (Figure 3) show consistently positive air temperature anomalies in the region from the early 2000s. This warming trend is consistent with the increasing trend of the DT weather type in Kenya and decreasing trend of the DM, MP, and MM weather types. SST anomalies over the Indian Ocean are also consistently positive from the late 1990s. SSTs are a critical ocean parameter known to influence weather and climate over adjacent land areas. Studies have found that sea surface temperatures in the tropical Indian Ocean have been increasing [38,39] and the rate of warming is fastest among tropical oceans [40]. The increased temperatures and expansion of the Indian Ocean warm pool could be associated with the increase of the MT/MT+ weather types over Kenya; however, more research is needed to examine the relationship between the SSC weather types and atmospheric flow regimes over the region.

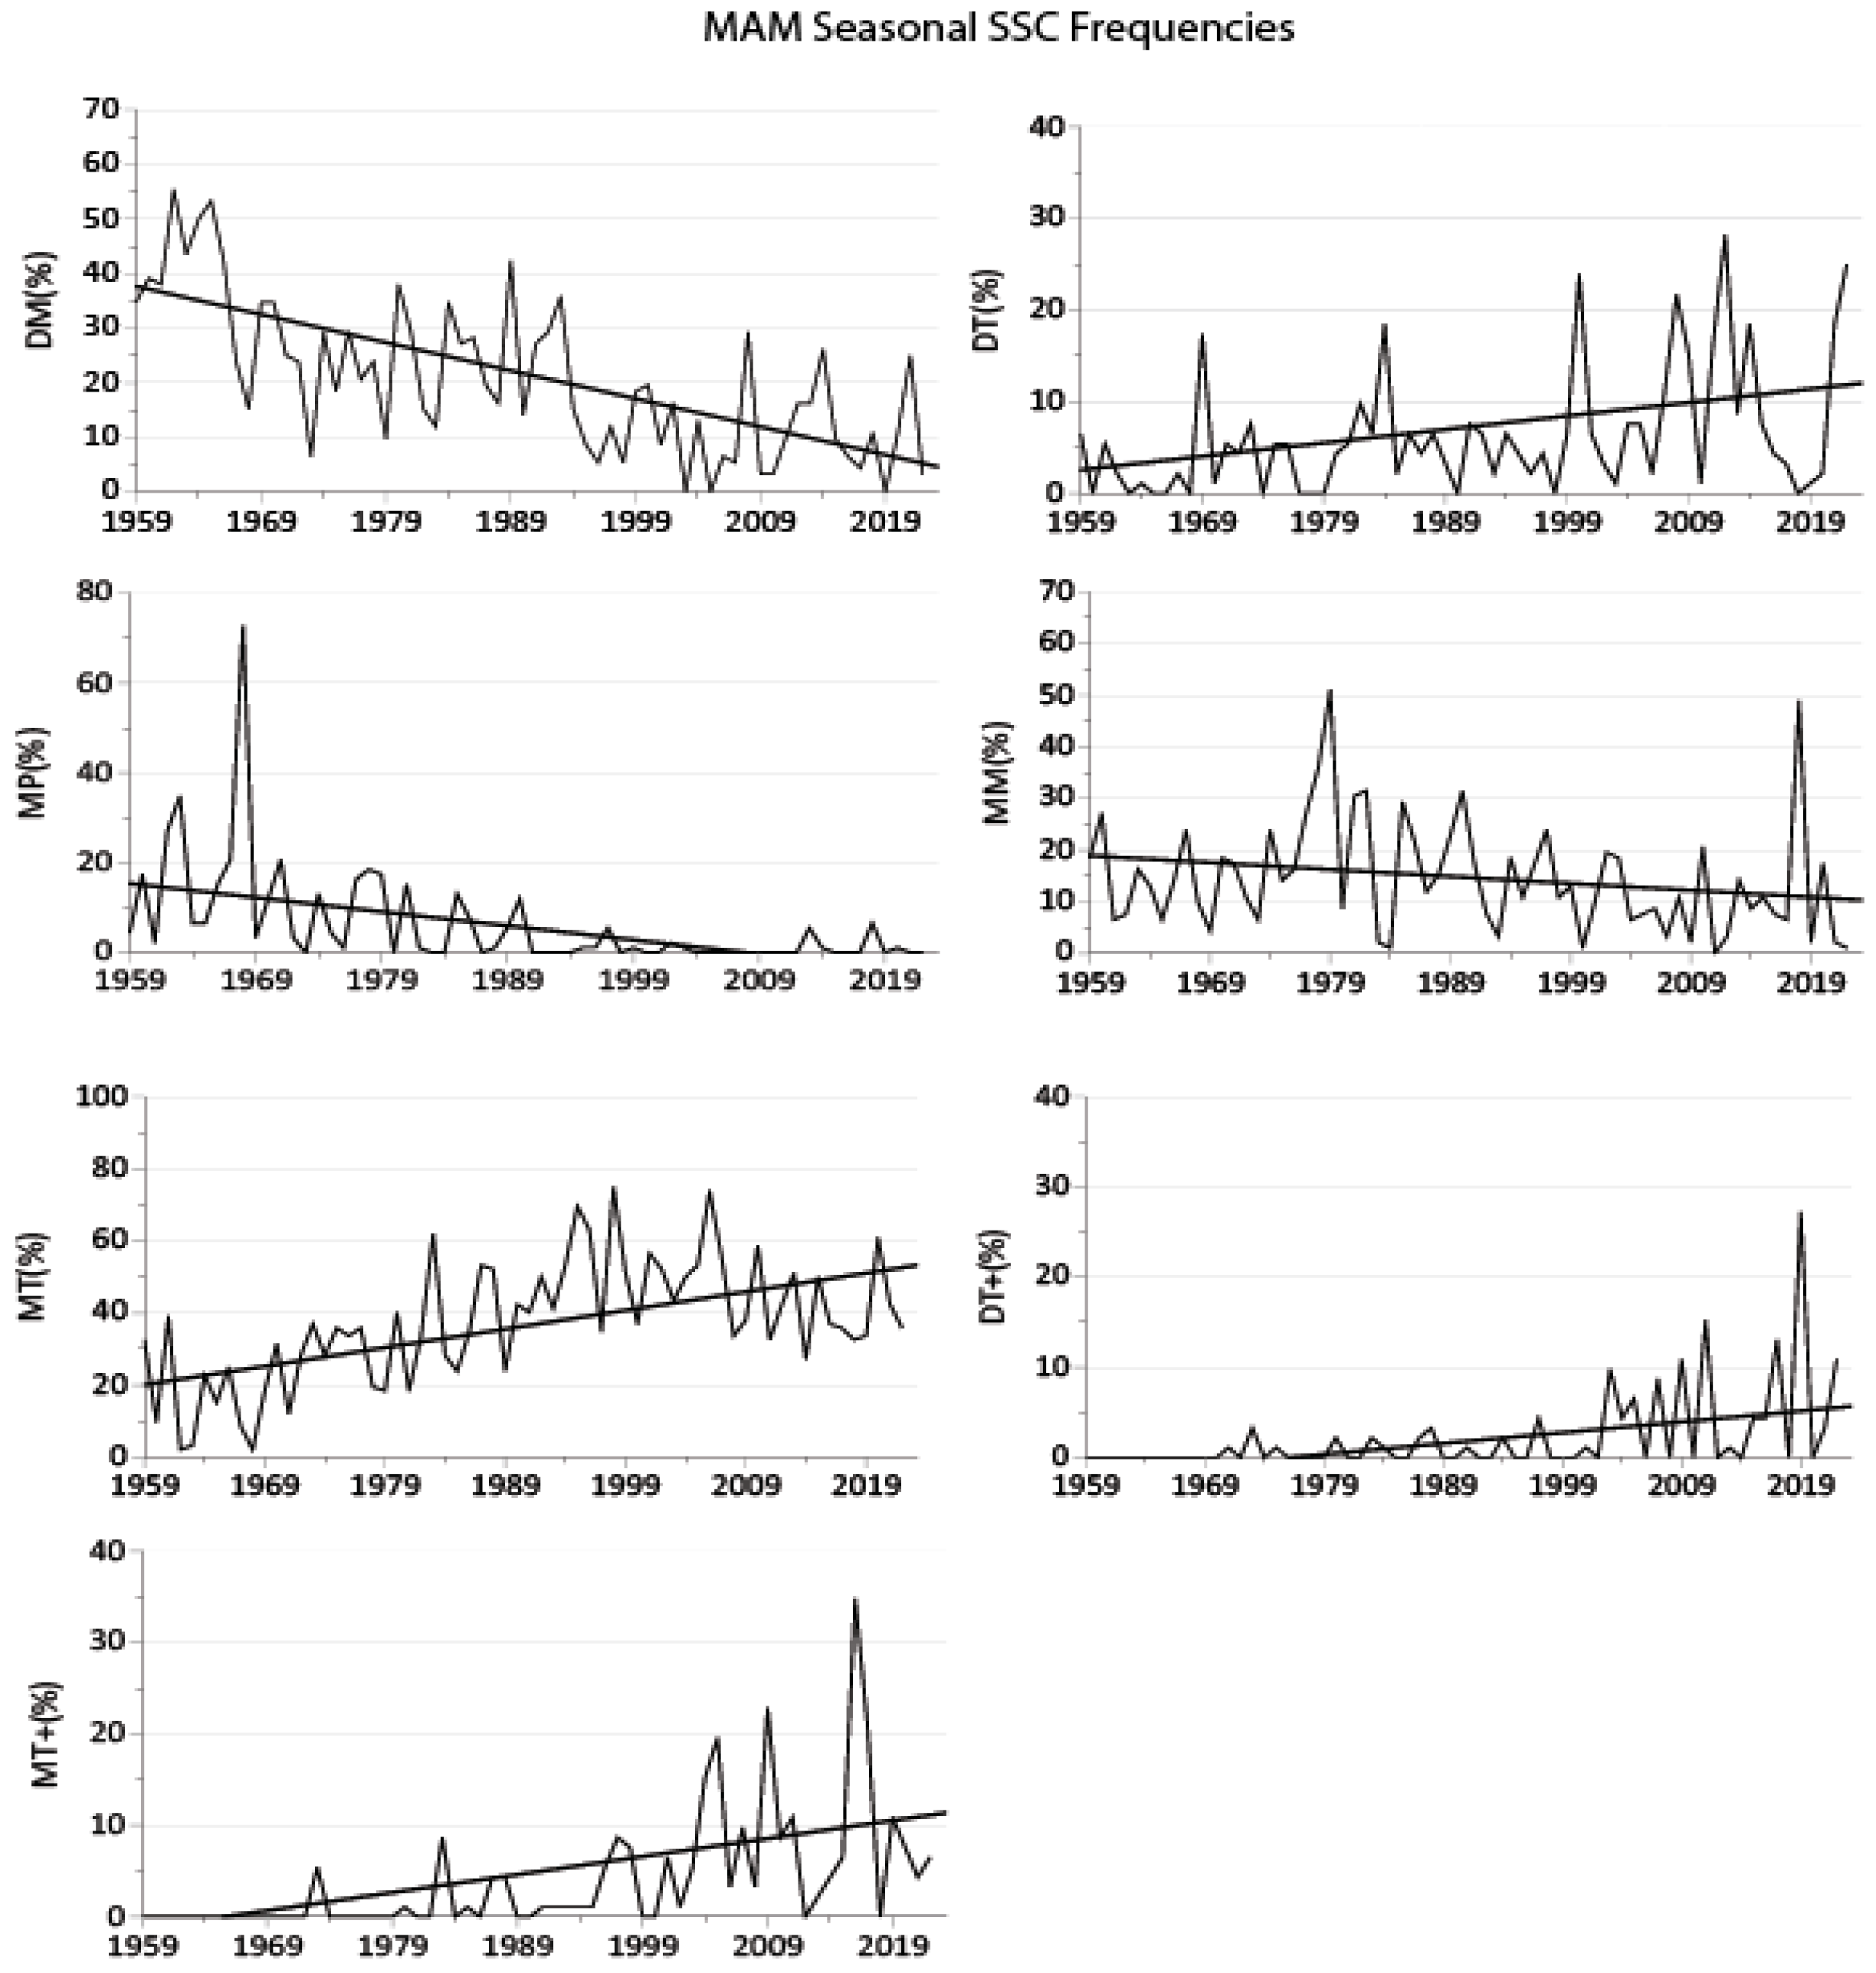
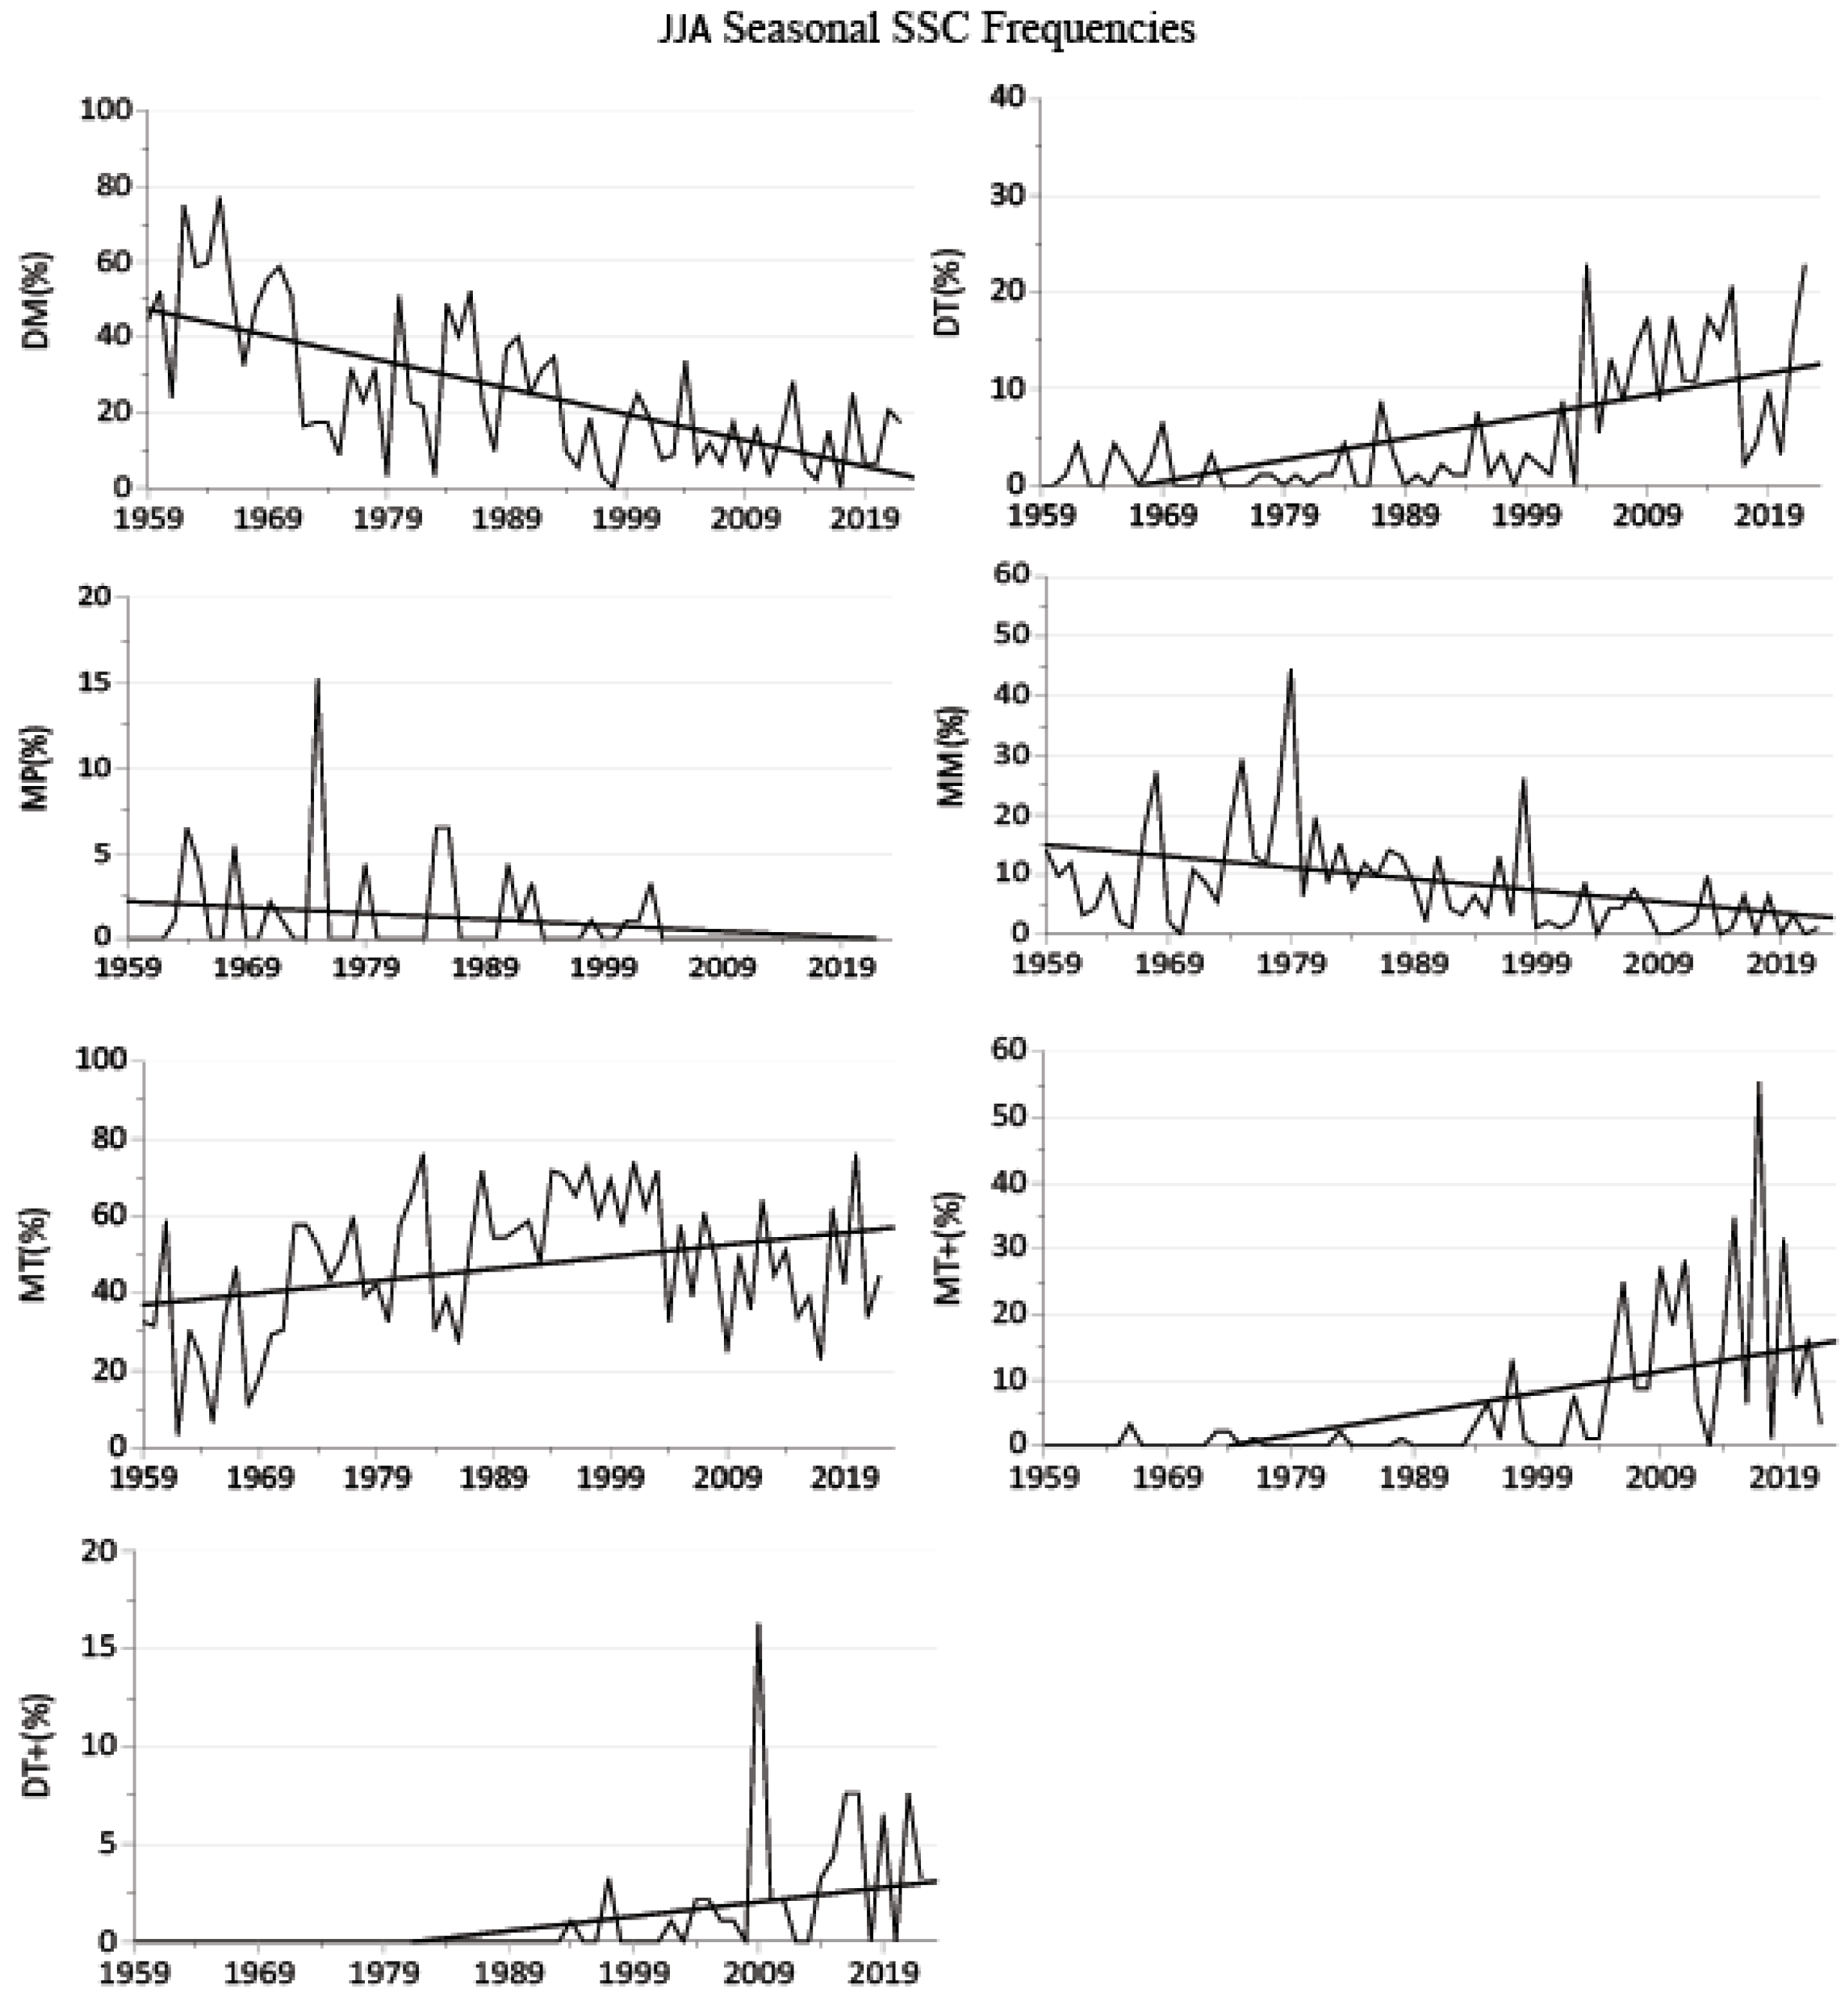
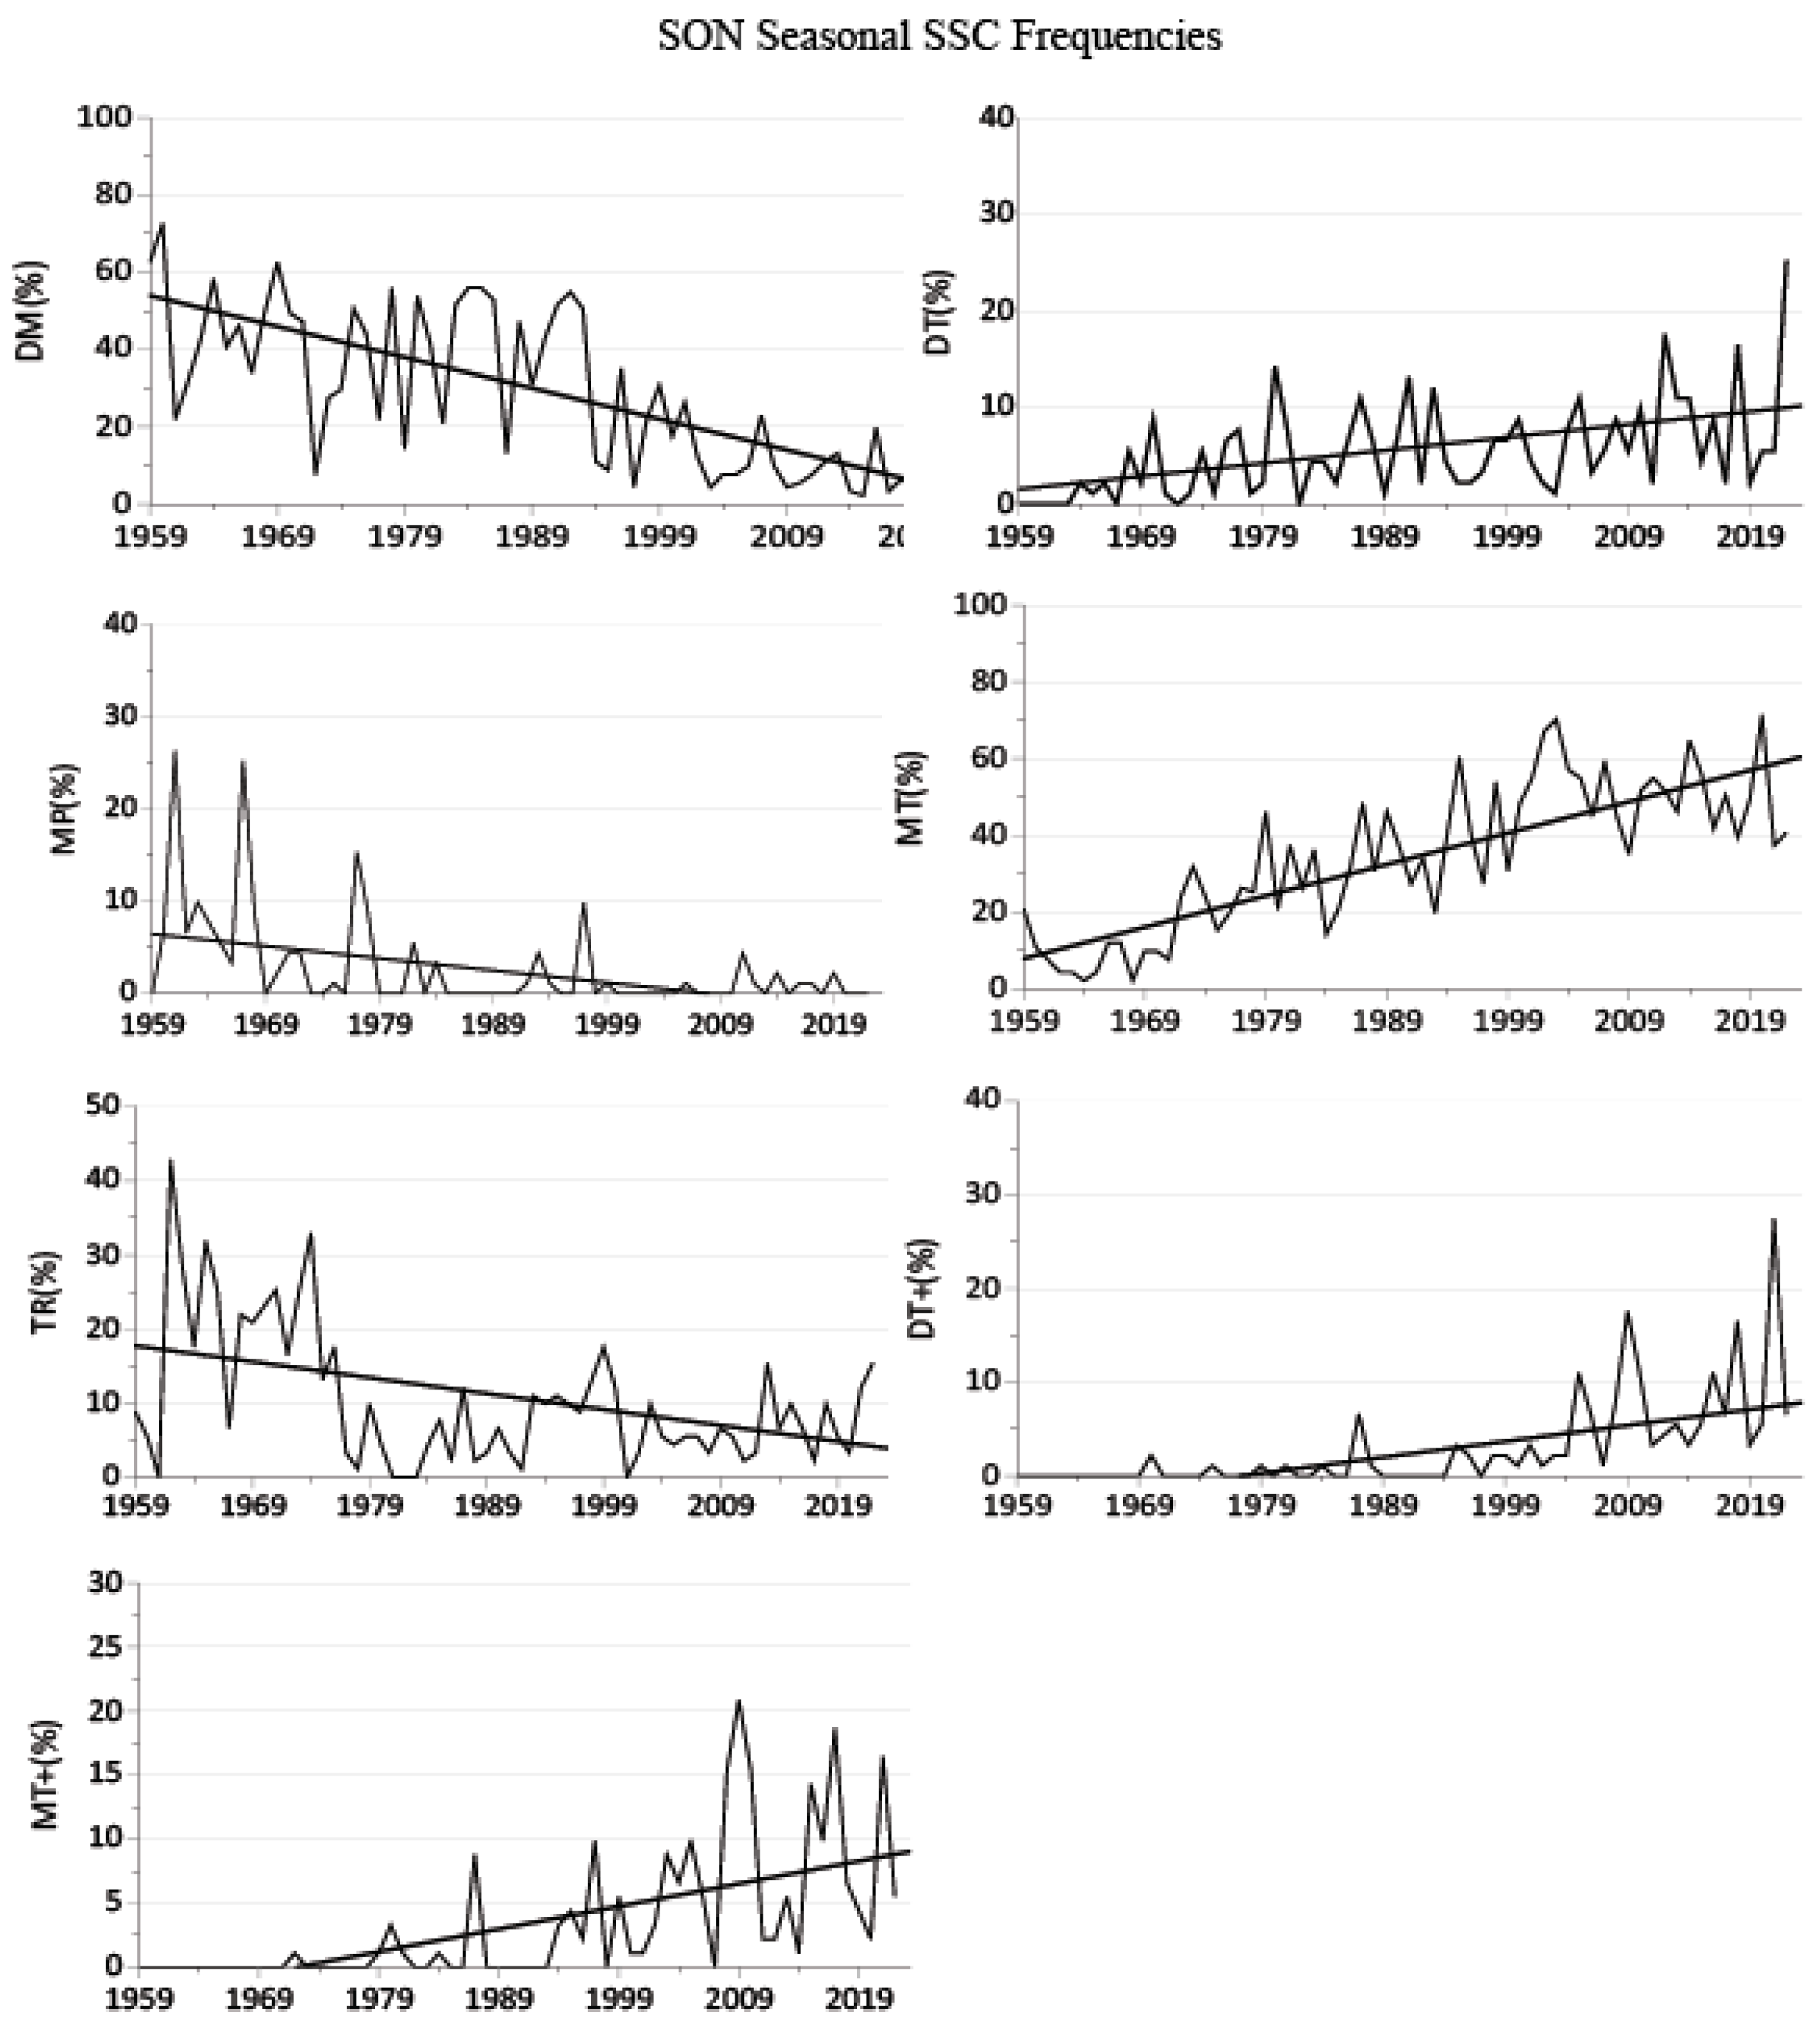
4.3.2. Seasonal Variability

The frequencies of all seven weather types and subsets were assessed for seasonal trends to better understand the interannual trends. Long-term seasonal variations of the SSC weather types indicate that in the DJF season, the DT (p < 0.001, 3.8% per decade) and MT (p < 0.001, 4.7% per decade) weather types have statistically significant increasing trends (Figure 4 and Table 5). The DM (p < 0.001, −7.0% per decade) and MP (p < 0.001, −1.0% per decade) weather types have statistically significant decreasing trends. In the MAM long rains season, the DT (p = 0.002, 2.1% per decade) and MT (p < 0.001, 7.1% per decade) weather types have statistically significant increasing trends, while the DM (p < 0.001, −5.1%), MP (p < 0.001, −2.8% per decade), and MM (p = 0.016, −1.6% per decade) weather types have statistically significant decreasing trends (Figure 5). In the JJA season, the DT (p < 0.001, 2.4% per decade) and MT (p = 0.008, 6.9% per decade) weather types have statistically significant increasing trends, while the DM (p < 0.001, −7.2% per decade), MM (p = 0.001, −1.6% per decade) and MP (p = 0.028, −0.1% per decade) weather types have statistically significant decreasing trends (Figure 6). In the SON short rains season, the DT (p < 0.001, 2.4% per decade) and MT (p < 0.001, 9.2% per decade) weather types have statistically significant increasing trends, while the DM (p < 0.001, −9.0% per decade), MP (p < 0.001, −1.0% per decade) and TR (p = 0.025, −1.9% per decade) weather types have statistically significant decreasing trends (Figure 7). In all seasons, there is a general decline in the occurrence of the cool and mild weather types and an increase in the warmer weather types, which also matches the interannual trends.

5. Conclusions

In this research, an SSC scheme for Kenya was developed and utilized to identify trends in weather type frequency from 1959 to 2022. The monthly frequencies of each weather type were examined, as were annual and seasonal trends over the study period. The results revealed that annually, the dominant SSC weather types in Kenya are the MT and DM weather types. The dry weather types (DM and DT) occur most frequently in the DJF dry season, with peak frequency in January (39.7% and 14.6%, respectively). The TR weather types have a bimodal peak in April and November, which is in agreement with the northward and southward movement of the ITCZ across equatorial East Africa. The MT type occurs most frequently from April to September with peak frequency in July (56.1%). The temporal variations in the SSC weather types show coherence with the general climatology of Kenya. Nevertheless, the relatively high frequency of occurrence of the DM types in the MAM and SON rainy seasons, and MT types in the JJA dry season, calls for further research potentially incorporating vertically integrated moisture to understand moisture transport as it relates to the SSC types in Kenya.
Analysis of the annual and seasonal trends uncovered evidence of climate change in Kenya. The temporal variation in the SSC weather types shows clear long-term trends. Overall, statistically significant trends between 1959 and 2022 show a decreasing trend of the moderate weather types of the DM, MP, and MM types and an increasing trend of the MT/MT+ and DT/DT+ weather types in the region. There is a significant increase in the DT frequency, approaching 4% per decade in the DJF season at the expense of the DM type, which decreases sharply within the same season. The MT type also increases significantly in the MAM, JJA, and SON seasons, with a significant decrease in the DM type in the same seasons. The increase in the warmer weather types in Kenya may be attributed to increasing global temperature [41] coupled with other local factors such as land use and land cover changes [42]. However, an analysis of the extent to which local factors such as urbanization influence our findings is outside the scope of this research.
While we did not directly examine the spatial variation of the weather types, this research provides valuable information about the temporal variability of the SSC types in Kenya. The analysis of the frequency of individual weather types allows for an understanding of climatic variability and change. In addition, this analysis advances our understanding of temporal changes in the relative severity of climatic conditions in Kenya in terms of the physical characteristics of the oppressive weather types.
It is evident that the SSC, previously largely utilized in the sub-tropics and mid-latitudes, provides useful climate information in the tropics. The developed SSC weather types have the potential to be utilized to assess various environmental phenomena in Kenya. Previously, the SSC has been applied to study climate change [6,16,30], air pollution and health [43,44,45], ozone variability [29,46], precipitation [47,48,49], and weather and tree growth [50]. Therefore, this research may open similar avenues in East Africa.
In addition to that, the simultaneous consideration of several weather variables, a key strength of the SSC, has been leveraged in developing heat-health watch-warning Systems (HHWWS) in select cities in the USA, Canada, Republic of Korea, Italy, and China [51,52,53,54]. Using the SSC, spatial and temporal variability as well as the persistence of surface meteorological characteristics can be related to human health outcomes. As it is likely that the number of warm days surpassing deadly thresholds will increase in frequency in the 21st Century, with a greater increase in the tropics [55], there is a need for future studies to explore the applicability of the SSC in developing HHWWS in Kenya and East Africa. The findings of this research will be linked to atmospheric flow patterns in subsequent research to further examine changes in atmospheric flow that are potentially associated with the increases in DT and MT found in this research.

Author Contributions

Conceptualization: D.C.A. and J.C.S.; Methodology: S.C.S., J.C.S. and D.C.A.; Formal analysis and investigation: D.C.A., S.C.S. and J.C.S.; Writing—original draft preparation: D.C.A. and J.C.S.; Writing—review and editing, D.C.A., J.C.S. and S.C.S.; Visualization: D.C.A.; Supervision: J.C.S. All authors have read and agreed to the published version of the manuscript.

Funding

This research received no external funding.

Data Availability Statement

Meteorological data used in the SSC development was obtained from European Centre for Medium-Range Weather Forecasts (ECMWF’s) ERA5 database https://cds.climate.copernicus.eu/cdsapp#!/dataset/reanalysis-era5-single-levels?tab=overview (accessed on 20 August 2024). The SSC calendar created for Kenya can be found at http://sheridan.geog.kent.edu/ssc3.html with the station code “KEN”.

Conflicts of Interest

The authors declare no conflicts of interest.

References

  1. Yarnal, B. Synoptic Climatology in Environmental Analysis: A Primer. Belhaven Press: London, UK, 1993. [Google Scholar]
  2. Kalkstein, L.S.; Nichols, M.C.; Barthel, C.D.; Greene, J.S. A new spatial synoptic classification: Application to air-mass analysis. Int. J. Climatol. J. R. Meteorol. Soc. 1996, 16, 983–1004. [Google Scholar] [CrossRef]
  3. McGregor, G.; Walters, S.; Wordley, J. Daily hospital respiratory admissions and winter air mass types, Birmingham, UK. Int. J. Biometeorol. 1999, 43, 21–30. [Google Scholar] [CrossRef]
  4. Sheridan, S. The redevelopment of a weather-type classification scheme for North America. Int. J. Climatol. 2002, 22, 51–68. [Google Scholar] [CrossRef]
  5. Hardin, A.; Liu, Y.; Cao, G.; Vanos, J. Urban heat island intensity and spatial variability by synoptic weather type in the northeast US. Urban Clim. 2018, 24, 747–762. [Google Scholar] [CrossRef]
  6. Sheridan, S.; Allen, M.; Lee, C.; Kalkstein, L. Future heat vulnerability in California Part II: Projecting future heat related mortality. Clim. Change 2012, 115, 311–326. [Google Scholar] [CrossRef]
  7. Senkbeil, J.; Saunders, M.; Taylor, B. Changes in Summer Weather Type Frequency in Eastern North America. Ann. Am. Assoc. Geogr. 2017, 107, 1229–1245. [Google Scholar] [CrossRef]
  8. Fonseca-Rodríguez, O.; Adams, R.E.; Sheridan, S.C.; Schumann, B. Projection of extreme heat-and cold-related mortality in Sweden based on the spatial synoptic classification. Environ. Res. 2023, 239, 117359. [Google Scholar] [CrossRef]
  9. Saha, S. Spatial variation in hyperthermia emergency department visits among those with employer-based insurance in the United States—A case-crossover analysis. Environ. Health 2015, 14, 20. [Google Scholar] [CrossRef]
  10. Lee, D.-G.; Kim, K.R.; Kim, J.; Kim, B.-J.; Cho, C.-H.; Sheridan, S.C.; Kalkstein, L.S.; Kim, H.; Yi, S.-M. Effects of heat waves on daily excess mortality in 14 Korean cities during the past 20 years (1991–2010): An application of the spatial synoptic classification approach. Int. J. Biometeorol. 2018, 62, 575–583. [Google Scholar] [CrossRef]
  11. Dixon, P.G.; Allen, M.; Gosling, S.N.; Hondula, D.M.; Ingole, V.; Lucas, R.; Vanos, J. Perspectives on the synoptic climate classification and its role in interdisciplinary research. Geogr. Compass 2016, 10, 147–164. [Google Scholar] [CrossRef]
  12. Climate Change 2014: Impacts, Adaptation, and Vulnerability. Part B: Regional Aspects Contribution of Working Group II to the Fifth Assessment Report of the Intergovernmental Panel on Climate Change (pp. 1199–1265). Available online: https://www.ipcc.ch/report/ar5/wg2/ (accessed on 6 January 2023).
  13. Mumo, L.; Yu, J.; Ayugi, B. Evaluation of spatiotemporal variability of rainfall over Kenya from 1979 to 2017. J. Atmos. Sol. Terr. Phys. 2019, 194, 105097. [Google Scholar] [CrossRef]
  14. Ayana, E.K.; Ceccato, P.; Fisher, J.R.; DeFries, R. Examining the relationship between environmental factors and conflict in pastoralist areas of East Africa. Sci. Total Environ. 2016, 557, 601–611. [Google Scholar] [CrossRef] [PubMed]
  15. Masson-Delmotte, V.; Zhai, P.; Pirani, A.; Connors, S.L.; Péan, C.; Berger, S.; Caud, N.; Chen, Y.; Goldfarb, L.; Gomis, M. Climate Change 2021: The Physical Science Basis; Contribution of working group I to the sixth assessment report of the intergovernmental panel on climate change; IPPC Secretariat: Geneva, Switzerland, 2021; Volume 2, p. 2391. [Google Scholar]
  16. Knight, D.B.; Davis, R.E.; Sheridan, S.C.; Hondula, D.M.; Sitka, L.J.; Deaton, M.; Lee, T.R.; Gawtry, S.D.; Stenger, P.J.; Mazzei, F. Increasing frequencies of warm and humid air masses over the conterminous United States from 1948 to 2005. Geophys. Res. Lett. 2008, 35, L10702. [Google Scholar] [CrossRef]
  17. Hersbach, H.; Bell, B.; Berrisford, P.; Biavati, G.; Horányi, A.; Sabater, J.M.; Nicolas, J.; Peubey, C.; Radu, R.; Rozum, I.; et al. ERA5 Hourly Data on Pressure Levels from 1940 to Present. Copernicus Climate Change Service (C3S) Climate Data Store (CDS), 2023. Available online: https://cds.climate.copernicus.eu/cdsapp#!/dataset/reanalysis-era5-pressure-levels?tab=overview (accessed on 26 January 2023).
  18. Beck, H.E.; McVicar, T.R.; Vergopolan, N.; Berg, A.; Lutsko, N.J.; Dufour, A.; Zeng, Z.; Jiang, X.; van Dijk, A.I.; Miralles, D.G. High-resolution (1 km) Köppen-Geiger maps for 1901–2099 based on constrained CMIP6 projections. Sci. Data 2023, 10, 724. [Google Scholar] [CrossRef] [PubMed]
  19. World Bank Group. Climate Change Knowledge Portal. 2023. Available online: https://climateknowledgeportal.worldbank.org/ (accessed on 26 May 2023).
  20. Nicholson, S.E. Climate and climatic variability of rainfall over eastern Africa. Rev. Geophys. 2017, 55, 590–635. [Google Scholar] [CrossRef]
  21. Ayugi, B.O.; Tan, G.; Ongoma, V.; Mafuru, K.B. Circulations associated with variations in boreal spring rainfall over Kenya. Earth Syst. Environ. 2018, 2, 421–434. [Google Scholar] [CrossRef]
  22. Nicholson, S.E. The intensity, location and structure of the tropical rainbelt over west Africa as factors in interannual variability. Int. J. Climatol. J. R. Meteorol. Soc. 2008, 28, 1775–1785. [Google Scholar] [CrossRef]
  23. Pohl, B.; Camberlin, P. Influence of the Madden-Julian Oscillation on East African rainfall. Part II: March-May season extremes and interannual variability. Q. J. R. Meteorol. Soc. 2006, 132, 2541–2558. [Google Scholar] [CrossRef]
  24. Saji, N.; Goswami, B.N.; Vinayachandran, P.; Yamagata, T. A dipole mode in the tropical Indian Ocean. Nature 1999, 401, 360–363. [Google Scholar] [CrossRef]
  25. Owiti, Z.; Ogallo, L.A.; Mutemi, J. Linkages between the Indian Ocean Dipole and East African seasonal rainfall anomalies. J. Kenya Meteorol. Soc. Vol. 2008, 2, 3–17. [Google Scholar]
  26. Yamagata, T.; Behera, S.K.; Luo, J.-J.; Masson, S.; Jury, M.R.; Rao, S.A. Coupled ocean-atmosphere variability in the tropical Indian Ocean. Earth’s Clim. Ocean Atmos. Interact. Geophys. Monogr. 2004, 147, 189–212. [Google Scholar]
  27. Hersbach, H.; Bell, B.; Berrisford, P.; Hirahara, S.; Horányi, A.; Muñoz-Sabater, J.; Nicolas, J.; Peubey, C.; Radu, R.; Schepers, D.; et al. The ERA5 global reanalysis. Q. J. R. Meteorol. Soc. 2020, 146, 1999–2049. [Google Scholar] [CrossRef]
  28. Tarek, M.; Brissette, F.; Arsenault, R. Evaluation of the ERA5 reanalysis as a potential reference dataset for hydrological modeling over North-America. Hydrol. Earth Syst. Sci. Discuss. 2020, 24, 2527–2544. [Google Scholar] [CrossRef]
  29. Yan, D.; Zhang, Z.; Jin, Z.; Li, M.; Sheridan, S.C.; Wang, T. Ozone variability driven by the synoptic patterns over China during 2014–2022 and its implications for crop yield and economy. Atmos. Pollut. Res. 2023, 14, 101843. [Google Scholar] [CrossRef]
  30. Bower, D.; McGregor, G.R.; Hannah, D.M.; Sheridan, S.C. Development of a spatial synoptic classification scheme for western Europe. Int. J. Climatol. J. R. Meteorol. Soc. 2007, 27, 2017–2040. [Google Scholar] [CrossRef]
  31. Camberlin, P.; Fontaine, B.; Louvet, S.; Oettli, P.; Valimba, P. Climate adjustments over Africa accompanying the Indian monsoon onset. J. Clim. 2010, 23, 2047–2064. [Google Scholar] [CrossRef]
  32. Yang, W.; Seager, R.; Cane, M.A.; Lyon, B. The annual cycle of East African precipitation. J. Clim. 2015, 28, 2385–2404. [Google Scholar] [CrossRef]
  33. Wang, H.; Xue, F. The Interannual Variability of Somali Jet and its Influences on the Inter-Hemispheric Water Vapor Transport and the East Asian Summer Rainfall. Chin. J. Geophys. 2003, 46, 11–20. [Google Scholar]
  34. Ayugi, B.O.; Tan, G. Recent trends of surface air temperatures over Kenya from 1971 to 2010. Meteorol. Atmos. Phys. 2019, 131, 1401–1413. [Google Scholar] [CrossRef]
  35. Ongoma, V.; Chen, H.; Gao, C.; Sagero, P. Variability of temperature properties over Kenya based on observed and reanalyzed datasets. Theor. Appl. Climatol. 2018, 133, 1175–1190. [Google Scholar] [CrossRef]
  36. Gebrechorkos, S.H.; Hülsmann, S.; Bernhofer, C. Long-term trends in rainfall and temperature using high-resolution climate datasets in East Africa. Sci. Rep. 2019, 9, 11376. [Google Scholar] [CrossRef] [PubMed]
  37. Ouma, J.O.; Olang, L.O.; Ouma, G.O.; Oludhe, C.; Ogallo, L.; Artan, G. Magnitudes of climate variability and changes over the arid and semi-arid lands of Kenya between 1961 and 2013 period. Am. J. Clim. Change 2018, 7, 27. [Google Scholar] [CrossRef]
  38. Levitus, S.; Antonov, J.; Boyer, T. Warming of the world ocean, 1955–2003. Geophys. Res. Lett. 2005, 32. [Google Scholar] [CrossRef]
  39. Alory, G.; Wijffels, S.; Meyers, G. Observed temperature trends in the Indian Ocean over 1960–1999 and associated mechanisms. Geophys. Res. Lett. 2007, 34. [Google Scholar] [CrossRef]
  40. Beal, L.M.; Vialard, J.; Roxy, M.K.; Commission, I.O. IndOOS-2: A Roadmap to Sustained Observations of the Indian Ocean for 2020–2030; Executive Summary; International CLIVAR Project Office: Qingdao, China, 2019. [Google Scholar]
  41. Intergovernmental Panel of Climate Change (IPCC). 2023: Summary for Policymakers. In Climate Change 2023: Synthesis Report; Contribution of Working Groups I, II and III to the Sixth Assessment Report of the Intergovernmental Panel on Climate Change; Core Writing Team, Lee, H., Romero, J., Eds.; IPCC: Geneva, Switzerland, 2023; pp. 1–34. [Google Scholar] [CrossRef]
  42. Oyugi, M. The Implications of Land Use and Land Cover Dynamics on the Environmental Quality of Nairobi City, Kenya. Am. J. Geogr. Inf. Syst. 2017, 6, 111–127. [Google Scholar]
  43. Hanna, A.F.; Yeatts, K.B.; Xiu, A.; Zhu, Z.; Smith, R.L.; Davis, N.N.; Talgo, K.D.; Arora, G.; Robinson, P.J.; Meng, Q. Associations between ozone and morbidity using the Spatial Synoptic Classification system. Environ. Health 2011, 10, 49. [Google Scholar] [CrossRef] [PubMed]
  44. Vanos, J.K.; Cakmak, S.; Bristow, C.; Brion, V.; Tremblay, N.; Martin, S.L.; Sheridan, S.S. Synoptic weather typing applied to air pollution mortality among the elderly in 10 Canadian cities. Environ. Res. 2013, 126, 66–75. [Google Scholar] [CrossRef]
  45. Cakmak, S.; Hebbern, C.; Pinault, L.; Lavigne, E.; Vanos, J.; Crouse, D.L.; Tjepkema, M. Associations between long-term PM2. 5 and ozone exposure and mortality in the Canadian Census Health and Environment Cohort (CANCHEC), by spatial synoptic classification zone. Environ. Int. 2018, 111, 200–211. [Google Scholar] [CrossRef]
  46. Kim, H.C.; Choi, H.; Ngan, F.; Lee, P. Surface ozone variability in synoptic pattern perspectives. In Air Pollution Modeling and its Application XXIII; Springer International Publishing: Berlin/Heidelberg, Germany, 2014; pp. 551–556. [Google Scholar]
  47. Skeeter, W.; Senkbeil, J.; Keellings, D. Spatial and temporal changes in the frequency and magnitude of intense precipitation events in the southeastern United States. Int. J. Climatol. 2018, 39, 768–782. [Google Scholar] [CrossRef]
  48. Burow, D.; Ellis, K. Precipitation and synoptic weather types on hazardous weather days in the Southeastern US. Theor. Appl. Climatol. 2021, 146, 213–229. [Google Scholar] [CrossRef]
  49. Reesman, C.; Miller, P.; D’Antonio, R.; Gilmore, K.; Schott, B.; Bannan, C. Areal Probability of Precipitation in Moist Tropical Air Masses for the United States. Atmosphere 2021, 12, 255. [Google Scholar] [CrossRef]
  50. Senkbeil, J.; Rodgers, J.; Sheridan, S. The sensitivity of tree growth to air mass variability and the Pacific Decadal Oscillation in coastal Alabama. Int. J. Biometeorol. 2007, 51, 483–491. [Google Scholar] [CrossRef] [PubMed]
  51. Sheridan, S.; Kalkstein, L. Progress in Heat Watch Warning System Technology. Bull. Amer. Meteorol. Soc. 2004, 85, 1931–1942. [Google Scholar] [CrossRef]
  52. Lee, D.-G.; Choi, Y.-J.; Kim, K.R.; Kalkstein, L.; Sheridan, S. Regional characteristics of heat-related deaths and the application of a heat-health warning system in Korea. Epidemiology 2011, 22, S180. [Google Scholar] [CrossRef]
  53. Kirchmayer, U.; Michelozzi, P.; de’Donato, F.; Kalkstein, L.S.; Perucci, C.A. A national system for the prevention of health effects of heat in Italy. Epidemiology 2004, 15, S100–S101. [Google Scholar] [CrossRef]
  54. Tan, J.; Kalkstein, L.; Huang, J.; Lin, S.; Yin, H.; Shao, D. An operational heat/health warning system in Shanghai. Int. J. Biometeorol. 2004, 48, 157–162. [Google Scholar] [CrossRef]
  55. Mora, C.; Dousset, B.; Caldwell, I.R.; Powell, F.E.; Geronimo, R.C.; Bielecki, C.R.; Counsell, C.W.; Dietrich, B.S.; Johnston, E.T.; Louis, L.V. Global risk of deadly heat. Nat. Clim. Change 2017, 7, 501–506. [Google Scholar] [CrossRef]
Figure 1. Area of study. A topographical elevation map (m) of Kenya enclosed in the red boundary.
Climate 12 00133 g001
Figure 2. Mean annual frequency change of SSC weather types over Kenya for the period 1959–2022. Trend statistics are found in Table 4.
Climate 12 00133 g002
Figure 3. (A) Annual 2 m temperature (°C) anomaly (1948–2022) relative to 1951–2000 average temperature. Eastern Africa (20° S–12° N, 25° E–52° E). Data source: NCEP/NCAR reanalysis data. (B) Same as A but data source is ECMWF ERA 5 reanalysis data. (C) Annual Indian Ocean sea surface temperature (°C) anomaly (1940–2023) relative to 1951–2000 average temperature. Indian Ocean (50° S–25° N, 40° E–110° E). Data source: ECMWF ERA 5 reanalysis data. (D) Annual Indian Ocean sea surface temperature (°C) anomaly (1979–2018) relative to 1979–2000 average temperature. Indian Ocean (50° S–25° N, 40° E–110° E). Data source: ECMWF ERA-Interim reanalysis data. Source: Climate Reanalyzer, Climate Change Institute, University of Maine https://climatereanalyzer.org/ (accessed 27 February 2024). Red represents higher than average temperatures and blue represents lower than average temperatures.
Climate 12 00133 g003aClimate 12 00133 g003b
Figure 4. December–February (DJF) frequency change (%) in SSC weather types for each year (1959–2022) with statistically significant linear trendlines. Trend statistics are found in Table 5.
Climate 12 00133 g004
Figure 5. March–May (MAM) frequency change (%) in SSC weather types for each year (1959–2022) with statistically significant linear trendlines. Trend statistics are found in Table 5.
Climate 12 00133 g005
Figure 6. June–August (JJA) frequency change (%) in SSC weather types for each year (1959–2022) with statistically significant linear trendlines. Trend statistics are found in Table 5.
Climate 12 00133 g006
Figure 7. September–November (SON) frequency change (%) in SSC weather types for each year (1959–2022) with statistically significant linear trendlines. Trend statistics are found in Table 5.
Climate 12 00133 g007
Table 1. Mean annual surface temperature and precipitation of different towns in Kenya (1991–2020).
TownRegionTemp (°C)Rainfall (mm)
MombasaCoastal26.61034.0
MarsabitNorthern27.0513.0
KituiEastern25.3696.0
WajirNortheastern27.9410.0
NairobiCentral18.9913.0
KerichoRift Valley18.31654.0
Note: Data for mean annual surface temperature and precipitation in Kenya were obtained from World Bank Group, Climate Knowledge Portal (2024) [19].
Table 2. Meteorological conditions of each SSC weather type in Kenya at 1500z. Each weather type represents distinct thermal and moisture characteristics.
DMDTMPMMMTTRDT+MT+
Temperature (°C)26–2927–3123–2624–2725–2926–3027–3227–31
Dew Point (°C)13–1812–1614–1915–2015–1911–1612–1715–18
Cloud Cover (10 ths)4–63–57–86–85–73–53–54–6
Wind Speed (Km/h)7–157–166–127–127–147–1811–1310–13
Apparent Temperature (°C)26–2827–3024–2724–2826–2926–2827–3126–31
Table 3. Mean monthly frequencies of the SSC weather types in Kenya, 1959–2022 (Unit %). DT+ and MT+ weather types are part of the DT and MT weather types. The percentage values for DT+ and MT+ are separate from the other seven weather types and not included in the total mean values.
DPDMDTMPMMMTTRDT+MT+
January0.039.714.63.85.427.68.94.91.3
February0.039.611.44.35.530.58.73.02.7
March0.024.712.96.911.534.39.73.84.0
April0.014.47.16.117.544.710.22.13.1
May0.023.15.85.814.744.95.70.84.9
June0.127.95.51.99.249.95.61.05.7
July0.023.65.60.48.256.16.10.85.9
August0.025.37.31.07.451.97.21.64.9
September0.025.77.20.48.249.78.92.04.3
October0.029.910.02.311.633.812.43.23.8
November0.029.57.85.713.630.113.33.52.1
December0.035.28.64.910.629.211.54.40.9
Total0.0%28.2%8.6%3.6%10.3%40.3%9.0%2.6%3.6%
Table 4. SSC interannual trend statistics for Kenya (1959–2022) and r2 values for interannual frequency change. p values for both OLS and MK tests: bold (OLS) = p < 0.05, italics (MK) = p < 0.05.
SSCDMDPDTMMMPMTTRMT+DT+
r20.626 0.502
p<0.0010.55<0.0010.004<0.001<0.0010.18<0.001<0.001
Table 5. SSC seasonal trend statistics for Kenya (1959–2022). r2 values for weather type frequency change for each season. p values for both OLS and MK tests: bold (OLS) = p < 0.05, italics (MK) = p < 0.05. Δ indicates mean change in frequency in % per decade.
DMDTMMMPMTTRMT+DT+
DJFr20.535 0.485
p<0.001<0.0010.581<0.001<0.0010.642<0.001<0.001
Δ−7.03.80.0−1.04.7−0.50.71.7
MAMr20.474 0.324
p<0.0010.0020.016<0.001<0.0010.829<0.001<0.001
Δ−5.12.1−1.6−2.87.10.31.81.0
JJAr2 0.108
p<0.001<0.001<0.0010.0280.0081.0<0.001<0.001
Δ−7.22.4−1.6−0.16.9−0.22.80.5
SONr2 0.658
p<0.001<0.0010.3150.001<0.0010.025<0.001<0.001
Δ−9.02.40.2−1.09.2−1.91.41.2
Disclaimer/Publisher’s Note: The statements, opinions and data contained in all publications are solely those of the individual author(s) and contributor(s) and not of MDPI and/or the editor(s). MDPI and/or the editor(s) disclaim responsibility for any injury to people or property resulting from any ideas, methods, instructions or products referred to in the content.

