Article

A Statistical Analysis of Drought and Fire Weather Indicators in the Context of Climate Change: The Case of the Attica Region, Greece

by
Nadia Politi
*,
Diamando Vlachogiannis
and
Athanasios Sfetsos
Environmental Research Laboratory, NCSR “Demokritos”, 15341 Athens, Greece
*
Author to whom correspondence should be addressed.
Climate 2024, 12(9), 135; https://doi.org/10.3390/cli12090135
Submission received: 31 July 2024 / Revised: 27 August 2024 / Accepted: 30 August 2024 / Published: 3 September 2024

Abstract

:
As warmer and drier conditions associated with global warming are projected to increase in southern Europe, the Mediterranean countries are currently the most prone to wildfire danger. In the present study, we investigated the statistical relationship between drought and fire weather risks in the context of climate change using drought index and fire weather-related indicators. We focused on the vulnerable and long-suffering area of the Attica region using high-resolution gridded climate datasets. Concerning fire weather components and fire hazard days, the majority of Attica consistently produced values that were moderately to highly anti-correlated (−0.5 to −0.9). This suggests that drier circumstances raise the risk of fires. Additionally, it was shown that the spatial dependence of each variable on the 6-months scale Standardized Precipitation Evapotranspiration Index (SPEI6), varied based on the period and climate scenario. Under both scenarios, an increasing rate of change between the drought index and fire indicators was calculated over future periods versus the historical period. In the case of mean and 95th percentiles of FWI with SPEI6, abrupt changes in linear regression slope values were observed, shifting from lower in the past to higher values in the future periods. Finally, the fire indicators’ future projections demonstrated a tendency towards an increasing fire weather risk for the region’s non-urban (forested and agricultural) areas. This increase was evident from the probability distributions shifting to higher mean and even more extreme values in future periods and scenarios. The study demonstrated the region’s growing vulnerability to future fire incidents in the context of climate change.

1. Introduction

The Mediterranean region is at high risk of fires, which have the potential to cause serious harm to the environment, the economy, and individual lives, as reported by [1]. Since the beginning of this century, Europe has experienced large-scale forest fires every year, with the five European–Mediterranean countries accounting for a substantial 85% of the total burned area in Europe each year [2]. Ref. [3] highlights that the combination of prolonged drought with extreme winds or heatwaves in the Mediterranean Basin is crucial in favouring fire occurrence and extreme fire events. It also observes that in years with exceptionally high numbers of wildfires, meteorological conditions were favourable, because without warm and dry weather, it is usually not possible for numerous fires to occur [4]. In [5], it was found that the frequency of the compound heatwave fire hazard was double that of simultaneously occurring drought-heatwaves. It affected regions mainly in Spain, Portugal, Italy (Sicily), Greece, and Scandinavian countries. Several studies have indicated that due to global warming, the Mediterranean region is predicted to experience increased fire danger, with a considerably higher frequency and greater affected area of large wildfires in the future [3,6,7,8,9].
Prolonged high temperature and low precipitation periods increase wildfire risk. During a drought, vegetation of low moisture or dead fuels become more flammable, increasing the likelihood of ignition and the rate of fire spread [10]. Due to their impacts on fuel moisture, even short-term droughts typically lead to an increase in the frequency of wildfire risk. Extended periods of high temperatures combined with dry conditions increase the likelihood of wildfire ignition. The mechanism that favours wildfire risk is based on hot, dry, and windy conditions that enhance evapotranspiration and reduce fuel moisture, leading to an increase in available fuel combustion. Consequently, hot and dry conditions typically precede wildfires. Recent global extreme events (unprecedented Pacific Northwest heatwave of June 2021 and 2019–2020 southeast Australia wildfires) have also demonstrated that the wildfire risk readily escalates to an extreme level when subjected to combined hot and drought conditions [11,12].
Concerning wildfires in Greece, most studies have focused on the relationship and trend analysis of burned areas, the fire weather index (FWI), and the number of fire events based on historical records [13,14,15]. Overall, research findings indicate a favourable correlation between drought severity and fire occurrence or severity. On the other hand, few studies have examined the relationship between wildfires or fire occurrences and drought as expressed by their related indices. The effect of drought on the occurrence of wildfires and the size of burned area in Greece was studied by [16]. They concluded that, while not entirely at fault for fire occurrence and area burned, drought episodes, as expressed by the Standardized Precipitation Index, SPI (summer SPI6_October and annual drought SPI12_September), substantially affect wildfire risk in Greece. According to [17], which examined long-term statistical relationships (1894–2010) between forest fires and meteorological records, the pattern of fires in Mediterranean regions is influenced by several aspects other than those promptly linked to the weather, such as socioeconomic issues, changes in land use and cover (LULC), and significant human influences. However, climatic conditions have a profound effect on fire occurrence over time. The same study underlined the influence of precipitation in controlling fuel moisture and fuel production as derived from the statistical correlations between total burned area and seasonal or annual precipitation. More recently, ref. [18] investigated the link between FWI and climate conditions with emphasis on drought, where the 1-month SPI values showed a strong link to the FWI values, with R2 = 0.71 for the area of Greece during the historical period.
The current study concentrates on the role that drought can play as a relevant driver of wildfire occurrence in the Attica region. In recent years, the subregion of Athens (Attica) has had a significant number of devastating wildfires (e.g., Mati in 2018, Parnitha Mountain in 2021, and Penteli Mountain in 2022), resulting in fatalities as well as major socio-economic and environmental impacts, recently analysed in several studies [19,20,21,22]. According to [23], the Attica region presents one of the highest percentage densities (2.44–10.35%) of wildland–urban interface (WUI) areas in Greece, derived from Corine Land Cover CLC 2018. In addition, the WUI burned area increased in East Attica (465 ha) between 2006 and 2018, when one of the deadliest and most devastating wildfires of the 21st century occurred (Mati area, July 2018). Due to the prevailing warm and dry atmospheric conditions and the increasing incidents of wildfires in this particular region, it has become imperative to investigate potential modifications to wildfire patterns in light of climate change. Consequently, the primary goal of this work is to analyse the statistical relationship between indices and the climate factors that increase the risk of fire weather in the Attica region. The study also examines how these statistics are expected to evolve due to climate change.
This study is novel because it is the first to use high-resolution (5 km) historical and future climate-gridded datasets over the Attica region to assess the effect of drought on fire danger (through their descriptive indices) in terms of statistical analysis while accounting for the topographical complexity of the region. The high-resolution topography features, which control the local climate and vegetation distribution (e.g., elevation and slope affect precipitation, exposure to wind, wind speed/direction, and fuel drying), are a major factor in the occurrence of fires [24]. Based on earlier research, using these climate-gridded datasets, it has been determined that this region is trending warm, dry and, more fire-prone [25,26,27]. Moreover, it is also anticipated that in the far future, when the extreme maximum temperature will outweigh all other hazards, the impact of global warming on the country will become increasingly apparent [28].
The general methodology, divided into multiple subsections, is explained in the section that follows. The subsections include a brief description of the study area, the model employed to generate the primary climate-gridded datasets, a description of the indices that have been computed and examined, and a presentation of the statistical metrics and analysis carried out. The statistical association between drought and fire indicators under the two distinct climatic scenarios and periods is analysed and discussed in the third section. The results are finally summarised in the concluding section.

2. Materials and Methods

2.1. Study Area

The climate of the Attica region can be characterised as Mediterranean, with notable climate variability due to complex topography, mountain ranges (Pathnitha, Ymettus, Penteli, Pateras) and coastal areas (Figure 1). The mean annual precipitation of this region is around 400 mm, while the mean annual temperature ranges from 16 °C to 18 °C, depending on the altitude and distance to the coastline [29]. The warm and dry period between May and September in the Attica region is associated with the prevailing atmospheric patterns, also identified in [30]. These are the Azores’ high-pressure system extending over southern Europe, with ridges of high pressure reaching Northern Greece in some cases, and the development of the Asiatic Low into the eastern Mediterranean and Cyprus. In general, these atmospheric patterns are responsible for the characteristic summer circulations and the formation of the prevailing strong northerly flow known as “Etesian” winds over the Aegean Sea (prevailing also over the north-eastern Attica region). As reported also by [31], “Etesian” winds occur “when the Persian trough or Cyprus low is clearly established over the Eastern Mediterranean”. The Attica region is characterised by major urbanization, with agricultural activity being located in the western, northern, and eastern parts of the region.

2.2. Data Provision

High-resolution drought and fire weather input climate datasets are required for calculating the related indices for more detailed analysis in a region of complex topography. For this purpose, time series of daily gridded precipitation, temperature, wind speed and relative humidity datasets were available from 5 km high-resolution long-term climate simulations with the non-hydrostatic Weather Research and Forecasting (WRF/ARW, v3.6.1) model [32] for Greece. EC-EARTH [33,34] global climate simulations input datasets feeded the WRF model for the historical (1980–2004), near- (2025–2049), and far-future (2075–2099) periods, under two different Representative Concentration Pathways (RCPs) of the Fifth Assessment Report (AR5) [35], RCP4.5 and RCP8.5. Validation studies [27] have proved the reliability and the capability of the WRF model to reproduce the historical climate of Greece (mainly for temperature, precipitation, and wind variables). Further information regarding the overall model setup, physics parameterisations, and validation results can be found in these studies.

2.3. Indices

In the present study, the 6-month scale Standardized Precipitation Evapotranspiration Index (SPEI) was used to address the joint effect of precipitation and temperature in drought assessment. SPEI was developed by [36] by taking into account temperature through the calculation of evapotranspiration and water availability and making use of this index more suitable for the study of the impact of climate change, as indicated by previous studies [37,38,39,40]. Further information on the calculation of the recommended 6-month scale (SPEI6) for the study area of Greece (including the Attica region) and the derived historical and future SPEI6 gridded datasets at 5 km can be found in [25].
For the fire risk assessment, the meteorological Canadian Fire Weather Index (FWI) was used, being the most commonly used fire danger indicator. The FWI and its subcomponents, some of which are explored in this work (ISI and FFMC), are based on the Canadian Forest Fire Weather Index (FWI) System (CFFWIS) and extensively described in the following link: https://cwfis.cfs.nrcan.gc.ca/background/summary/fwi (accessed on 10 May 2024. More specifically, the “CFFWIS consists of six components that account for the effects of fuel moisture and weather conditions on fire behaviour”. Further information regarding the formulas, system equations, and codes of the examined components can be found in [41]. As input, for the calculation of FWI and its subcomponents, four meteorological daily variables were used: precipitation, wind speed at 10 m, relative humidity, and air temperature. The calculated historical and future fire weather gridded datasets at 5 km for Greece and the Attica region are extensively described and analysed in [42].

2.4. Methodology

The statistical analysis in the current study was based on high-resolution historical and future climate-gridded datasets for two RCPs. A subset of the gridded datasets mentioned above, focused on the Attica region, was extracted for the present work. The Attica region consisted of 125 (5 × 5 km2) gridded points. The procedure of the analysis required, first, calculation of the daily values of three indices of the Canadian FWI system—the Fire Weather Index (FWI), see Table 1 for FWI’s classification, and two sub-indices, the Initial Spread Index (ISI) and the Fine Fuel Moisture Content (FFMC)—and fire danger day-related indices during the historical and the two future periods specified in Section 2.2. The FFMC is the moisture content of fine dead surface fuels, which indicates the relative ease of ignition and the flammability of fine fuel. The ISI is a numeric rating of the expected rate of fire spread which derives from the combination of wind speed and FFMC.
The calculations of the three indices were performed for the fire season, which runs from May to October in Greece, along with SPEI6 for the historical and two future periods under RCP4.5 and RCP8.5. The second step involved the integration of daily fire weather information according to the monthly SPEI6 per grid point for the fire season. Thus, each monthly SPEI6 index value corresponded to 30 or 31 daily values of the examined fire components (e.g., SPEI6 of May to 31 daily values of FWI, ISI, and FFMC). The daily fire indices were converted to monthly FWI, ISI, FFMC, and to the examined fire danger days based on FWI values, resulting in a final count of 150 monthly values of SPEI6 and fire-related indices in total (25 years ∗ 6 months) per historical/future period. Therefore, the monthly values of the SPEI6 and fire components were used to quantify wildfire danger and fire-prone weather under drought conditions and to proceed to the spatiotemporal statistical analysis of these components, described in Table 2, with SPEI6 during the fire season. All indices mentioned above were estimated during the Greek fire season.
The first objective was to investigate the statistical relationship between drought and fire indices on an annual scale for historical and future periods. The analysis involved using the October SPEI6 values, which represent the fire season in Greece, and using the cumulative monthly data from May to October to spatially examine the correlation coefficient between the SPEI6 and the annual fire indicators during the fire season. The correlation was tested using the Pearson correlation (r); the independent variable was the October SPEI6, while the dependent was the produced index or component related to fire. The degree of relationship based on the Pearson correlation coefficient is depicted in Table 3 [43] below:
The second objective was to study the relationship between monthly SPEI6 and all the derived monthly fire components and derived indices in terms of “a” coefficient by implementing a linear regression equation (y = a ∗ x +b) on a monthly scale. SPEI6 is the independent variable “x”, while the fire indicators play the role of the dependent variable “y”. The two latter statistics were estimated for every cell, so that the representation of the results was made spatially for the historical and future periods. Along with the statistical analysis, the statistical significance of the statistical metrics was also considered and illustrated in the figures, at the 5% significance level (i.e., p < 0.05). Finally, we examined the probability distribution of the fire weather risk indicators only for the non-urban areas of the Attica region (Figure 2) and the potential changes to these distributions due to climate change. The analysis does not pursue investigation of the WUI/non-WUI areas. It should also be noted that the excluded “urban” areas of the Attica region are areas of heavy population density, characterised by the absence of forest or agricultural areas. On the other hand, the more considerable extent of “non-urban” areas in the Attica region could be considered of high fire risk interest, as these parts of the region are mostly surrounded by forest, agriculture, and residential areas, with few exceptions (some mountainous parts).

3. Results and Discussion

3.1. Correlation between SPEI6 and Fire-Related Indicators on an Annual Basis

The correlation between the drought index, the October SPEI6, and the annual values of the fire weather-related indicators during the fire season was calculated for all periods under the two climate change scenarios (Figure 3, Figure 4, Figure 5 and Figure 6). The spatial patterns of the correlation results varied in all periods, particularly under the future scenarios. In general, all the results showed many areas moderately anti-correlated (−0.5 to −0.6) and others with strong anti-correlation (up to −0.9), meaning that, as the SPEI6 index decreases, fire danger increases, which is consistent with the fact that drier conditions (the more negative SPEI6 becomes) increase the risk of fire danger in terms of fire components and fire danger days.
Furthermore, the results indicated parts of the region with moderate and strong anti-correlation between mean FWI and SPEI6 (see Figure 3) during the historical and future periods under both scenarios. The strongest anti-correlation values were found mainly in the northern and central parts. An exception of no correlation or low anti-correlation values (from 0 to −0.4) was found in the near-future period under RCP4.5, mainly in southern and eastern Attica, as well as in a limited area of the eastern coastal area under RPC 8.5 in the far future. A possible explanation for this could be the influence of the wind speed parameter, which is estimated to change in the future and is also reflected in ISI’s future behaviour (, which is one of the main subcomponents of FWI, and therefore affects FWI result, and will be further analysed later in the corresponding figure.
Figure 3. Correlation of SPEI6_oct and mean FWI for the Attica region for (a) the historical and future periods: (b) near future under RCP4.5, (c) near future under RCP8.5, (d) far future under RCP4.5, and (e) far future under RCP8.5. The black dotted areas show a statistically significant correlation at the 5% significance level.
Climate 12 00135 g003
Regarding the relation between FWI95 and SPEI6, moderate-to-strong anti-correlation was observed in the historical period, as shown in Figure 4, over the whole region. Lower anti-correlation values were found in both future periods and scenarios compared to the historical period. In the near-future period under RCP4.5, the correlation was not significant, compared to the standard alpha level of 0.05, for almost the whole region, with the lowest anti-correlation values (~−0.1) in the south-eastern parts of the region in particular. However, the variables were moderately to strongly anti-correlated in the northern-central areas of the region under RCP8.5 in the near future and under 4.5 in the far future.
Figure 4. Correlation of SPEI6_oct and FWI95 for the Attica region for (a) the historical and future periods: (b) near future under RCP4.5, (c) near future under RCP8.5, (d) far future under RCP4.5, and (e) far future under RCP8.5. The black dotted areas show a statistically significant correlation at the 5% significance level.
Climate 12 00135 g004
As FWI depends on temperature, precipitation, wind speed, and relative humidity, additional research was undertaken on the correlation between the 95th percentile of the meteorological components of the FWI95 with October SPEI6 and its spatial patterns to interpret the low correlation values. The results are included in the Supplementary Material in Figures S1–S4. Each figure depicts the correlation of SPEI6 with the examined meteorological variable (TX95 for maximum temperature, WS95 for wind speed, RR95 for precipitation, and RH95 for relative humidity) for the historical and future periods under both scenarios. The extreme percentiles of climatic variables across the historical period produced results with a moderate-to-strong correlation with SPEI6. An exception was detected in the northern part, where not-statistically-significant, low anti-correlation values were found only for the wind speed (Figure S2a). Moderate-to-strong anti-correlation values were observed for the maximum temperature (Figure S1a). The effect of the complex topography of the region on high-resolution statistical results is evident concerning maximum temperature. In particular, during the historical period, values between TX95 and SPEI6 showed a strong anti-correlation in the southern-eastern areas of Attica, which are generally warmer and drier than the rest of the region. Moreover, anti-correlation values shifted to moderate values (−0.5, to −0.7) in mountainous areas (see Figure 1, Parnitha, Penteli, and Pateras mountains). Imettus Mt also affects the relationship of TX95 and SPEI6 by dividing southern from more central areas, which show moderate anti-correlated values (−0.6/−0.7).
In addition, during the historical period, positive correlations were found for precipitation and relative humidity with SPEI (Figures S3a and S4a). In particular, it was found that precipitation indicated a strong correlation with SPEI6 across the whole region, consistent with the fact that precipitation moderates the SPEI index. The relationship between FWI and SPEI6 is in agreement with [18], which also indicated FWI and precipitation to be significantly correlated with the SPI index, in the case of the entire country.
Concerning the future periods, the spatial correlation patterns of all meteorological variables (TX95, WS95, RR95 and RH95) changed in both scenarios (Figures S1–S4). In particular, precipitation (RR95) showed a strong linear relationship with SPEI6 (Figure S3) across the region throughout the two future periods and scenarios, which was similar to the historical period, suggesting that the spatial dependence of the RR95 and SPEI6 correlation was not essential. The precipitation patterns that include increases and decreases in the different parts of the Attica region (as derived in [27]) remain important to SPEI, demonstrated by the strong correlation in all periods and scenarios investigated. Regarding maximum temperature (Figure S1), the linear anti-correlation between TX95 and SPEI6 is lower in the projected results, apart from the case of RCP4.5 in the near future, where there was no significant anti-correlation (negative values were higher than −0.4) for the entire region. Furthermore, no significant weak anti-correlated values were found in RCP8.5 or both periods, with a lower correlation in the far future, particularly in the eastern region. On the contrary, moderate-to-strong anti-correlation was seen only in the far future under RCP4.5. A moderate correlation was observed in both future periods and scenarios for the relative humidity and SPEI6 (Figure S4), with values in the range of 0.5–0.7. The lowest correlation values were detected in the southwestern part under RCP4.5 in the far future, and the south-eastern part under RCP8.5. The highest correlation values were found in the northern parts of the region under RCP8.5 in the far-future period and under RCP4.5 in the near future. The analysis of extreme wind speed and SPEI6 (Figure S2), unlike the anti-correlation in the historical period and the absence of statistically significant correlated values in both future periods and scenarios, showed a significant correlation in the near future, under RCP4.5 in the eastern parts. In general, the weak correlation results of maximum temperature and wind speed with SPEI6 under the projected scenarios and over certain parts could imply a non-linear correlation, consequently suggesting a non-linear relationship between FWI95 and SPEI6 in the future.
The analysis of the meteorological variables highlights that the relationship between the FWI95 and SPEI6 (Figure 4) may change in the future, which could impact their relationship by lowering their correlation. There are several possible causes for this. In [27], an increase in projected seasonal maximum temperature change was concluded in both scenarios and periods for the Attica region. Also based on the same study, the increase in seasonal (summer) precipitation observed in the south-eastern parts under RCP8.5 in the far future weakens the anti-correlation between FWI95 and SPEI6, to a greater extent than TX95. This was also indicated by [44], which reported that, due to the region’s existing dry summertime conditions, in which more drying may have little effect on escalating the already highly fire-prone conditions, future extreme fire danger could be increased by rising temperatures with low sensitivity to changes in precipitation. Moreover, refs. [45,46] reported that the FWI is complex because its meteorological input variables are not specified by a linear equation, making it challenging to ascribe its performance to a single variable or component. In addition, in the context of global warming, several studies have revealed modifications in atmospheric circulation patterns, potentially affecting the future relationship between the two indices. For example, [47,48] revealed changes in the geopotential height at 500 hPa, barotropic sea level pressure, and anticyclonic circulation with increasing anticyclonic circulation in the central Mediterranean. In particular, the differential warming of Mediterranean Sea (due to its thermal inertia), which increases the land–sea temperature contrast in the summer, increases the sea level pressure gradient across the region and geopotential height at the 500 hPa level under the effect of climate change, intensifying the Azores’ anticyclonic circulation and the horizontal transfer of warm, dry continental air masses towards the central and eastern Mediterranean regions [49]. This mechanism has an impact on FWI and the other fire weather related indices due to temperature (increase) and precipitation (reduction) changes, by enhancing risk of drought and wildfires. Moreover, ref. [50] studied the climate change impact on air masses arriving in the Attica region through backward trajectories in the near future and both RCPs, using the same high-resolution climate datasets. Their results highlighted a significant decrease in the Etesian winds, which provide cooling and low-humidity conditions in the summer in the region. Along with a higher likelihood of increased southerly flows from Africa (about 40%), the same study also showed a drop in the frequency of cyclones emerging from the central Mediterranean and the Adriatic Sea, which might lead to more heatwaves and drier conditions.
The number of days with FWI > 38, indicated as the high fire danger days index, illustrated in Figure 5, showed strong correlations for all periods and scenarios with SPEI6. The extreme fire danger days (FWI > 50), depicted in Figure 6, yielded high correlations under RCP8.5 and RCP4.5 in the near future and far future, respectively, for nearly the whole region, as well as exceptionally high correlation values for the historical period. On the other hand, the northern parts of the region and some western central areas exhibited the strongest anti-correlations under RCP4.5 and RCP8.5 in the near and far future, respectively. From an atmospheric pattern perspective, it is noteworthy that [51] revealed that the association between low 500 hPa geopotential heights, high atmospheric pressure, and negative total water column anomalies enhance the relationship between wildfires (in terms of high fire danger days) and drought. Low anti-correlated results under RCP4.5 and RCP8.5 in the near and far future, respectively, may also be related to FWI values above a certain threshold, as observed here with FWI > 50 or 95th percentile, associated with atmospheric circulation patterns and dynamical changes that affect the main components of both indicators in these periods and scenarios. Changes in the synoptic atmospheric patterns of air mass flows, analysed by [50], could be associated with increasing transport of warm air masses, arriving over the study area during the summer months under both scenarios, implying an increase in the occurrence of heatwaves and Saharan dust events, and also the shifting of Etesian winds between September and October also reported by [52]. Moreover, Reale et al., 2021 [53], reported a decrease in the number and an overall weakening of cyclones moving across the Mediterranean at the end of the twenty-first century, pointing out a reduction in the south-eastern part of the region in the cyclone-related wind speed and precipitation rate under RCP8.5, linked to a persistent anticyclonic pattern prevailing over the area. As a result, higher temperatures and drier conditions will lead to increasing FWI values during fire season.
Figure 5. Correlation of SPEI6_oct and high fire danger days index for the Attica region for (a) the historical and future periods: (b) near future under RCP4.5, (c) near future under RCP8.5, (d) far future under RCP4.5, and (e) far future under RCP8.5. The black dotted areas show statistically significant correlation at the 5% significance level.
Climate 12 00135 g005
Figure 6. Correlation of SPEI6_oct and extreme fire danger days index for the Attica region for (a) the historical and future periods: (b) near future under RCP4.5, (c) near future under RCP8.5, (d) far future under RCP4.5, and (e) far future under RCP8.5. The black dotted areas show a statistically significant correlation at the 5% significance level.
Climate 12 00135 g006
Concerning the correlation between the other two examined FWI system components, the mean FFMC (Figure 7) exhibits a statistically significant and considerably stronger anti-correlation with the SPEI6 compared to the historical period, across the whole region, during all periods and under both scenarios. This implies that higher mean FFMC values across the study area are strongly associated with dry periods. This is to be expected due to the decreasing moisture content. Higher fire danger conditions are indicated by higher FFMC values [54]. Regarding the correlation between the mean ISI (Figure 8) component and SPEI6, the largest part of the region shows a moderate anti-correlation (−0.5 to −0.7) during the historical period; however, in the future periods, especially in the southern region, there is a low anti-correlation with no significant correlation. There are a few notable exceptions, such as the central north region under RCP4.5 in the near future, and the north region and occasionally some areas in the far future under RCP4.5 and RCP8.5, respectively. These areas yielded significant moderate-to-high anti-correlated relationships (e.g., central north region). Nonetheless, in the near future, a weak correlation was observed in the southern parts under RCP4.5. This indicates that SPEI6 has no discernible effect on the ISI, which is most likely because the wind speed component, taken into consideration in the calculation of ISI, influences the result. FFMC and wind speed are combined in the ISI calculation. Moreover, the shifted formation of Etesian winds between September and October, because of the atmospheric circulation change, could lead to increasing ISI values during that period. ISI supports fire growth during initial stages and could be linked to different wildfire response strategies. Thus, “faster” fires (higher ISI), especially under drought conditions, could require a shift in procedures and the introduction of new technologies for even earlier detection and identification. In general, compared to ISI, FFMC had the greatest impact on the increasing anti-correlation with SPEI6 under both scenarios and future periods, to an extensive degree across the study area, highlighting the effect of drought conditions on fuel moisture content. It should also be noted that the strongest anti-correlation of ISI with SPEI6 was observed in the far future under RCP4.5 only in the mountainous areas of the north-western region; in contrast, in the historical period, it appeared in the mountainous blocks of Parnitha and Imittus (see Figure 7a).

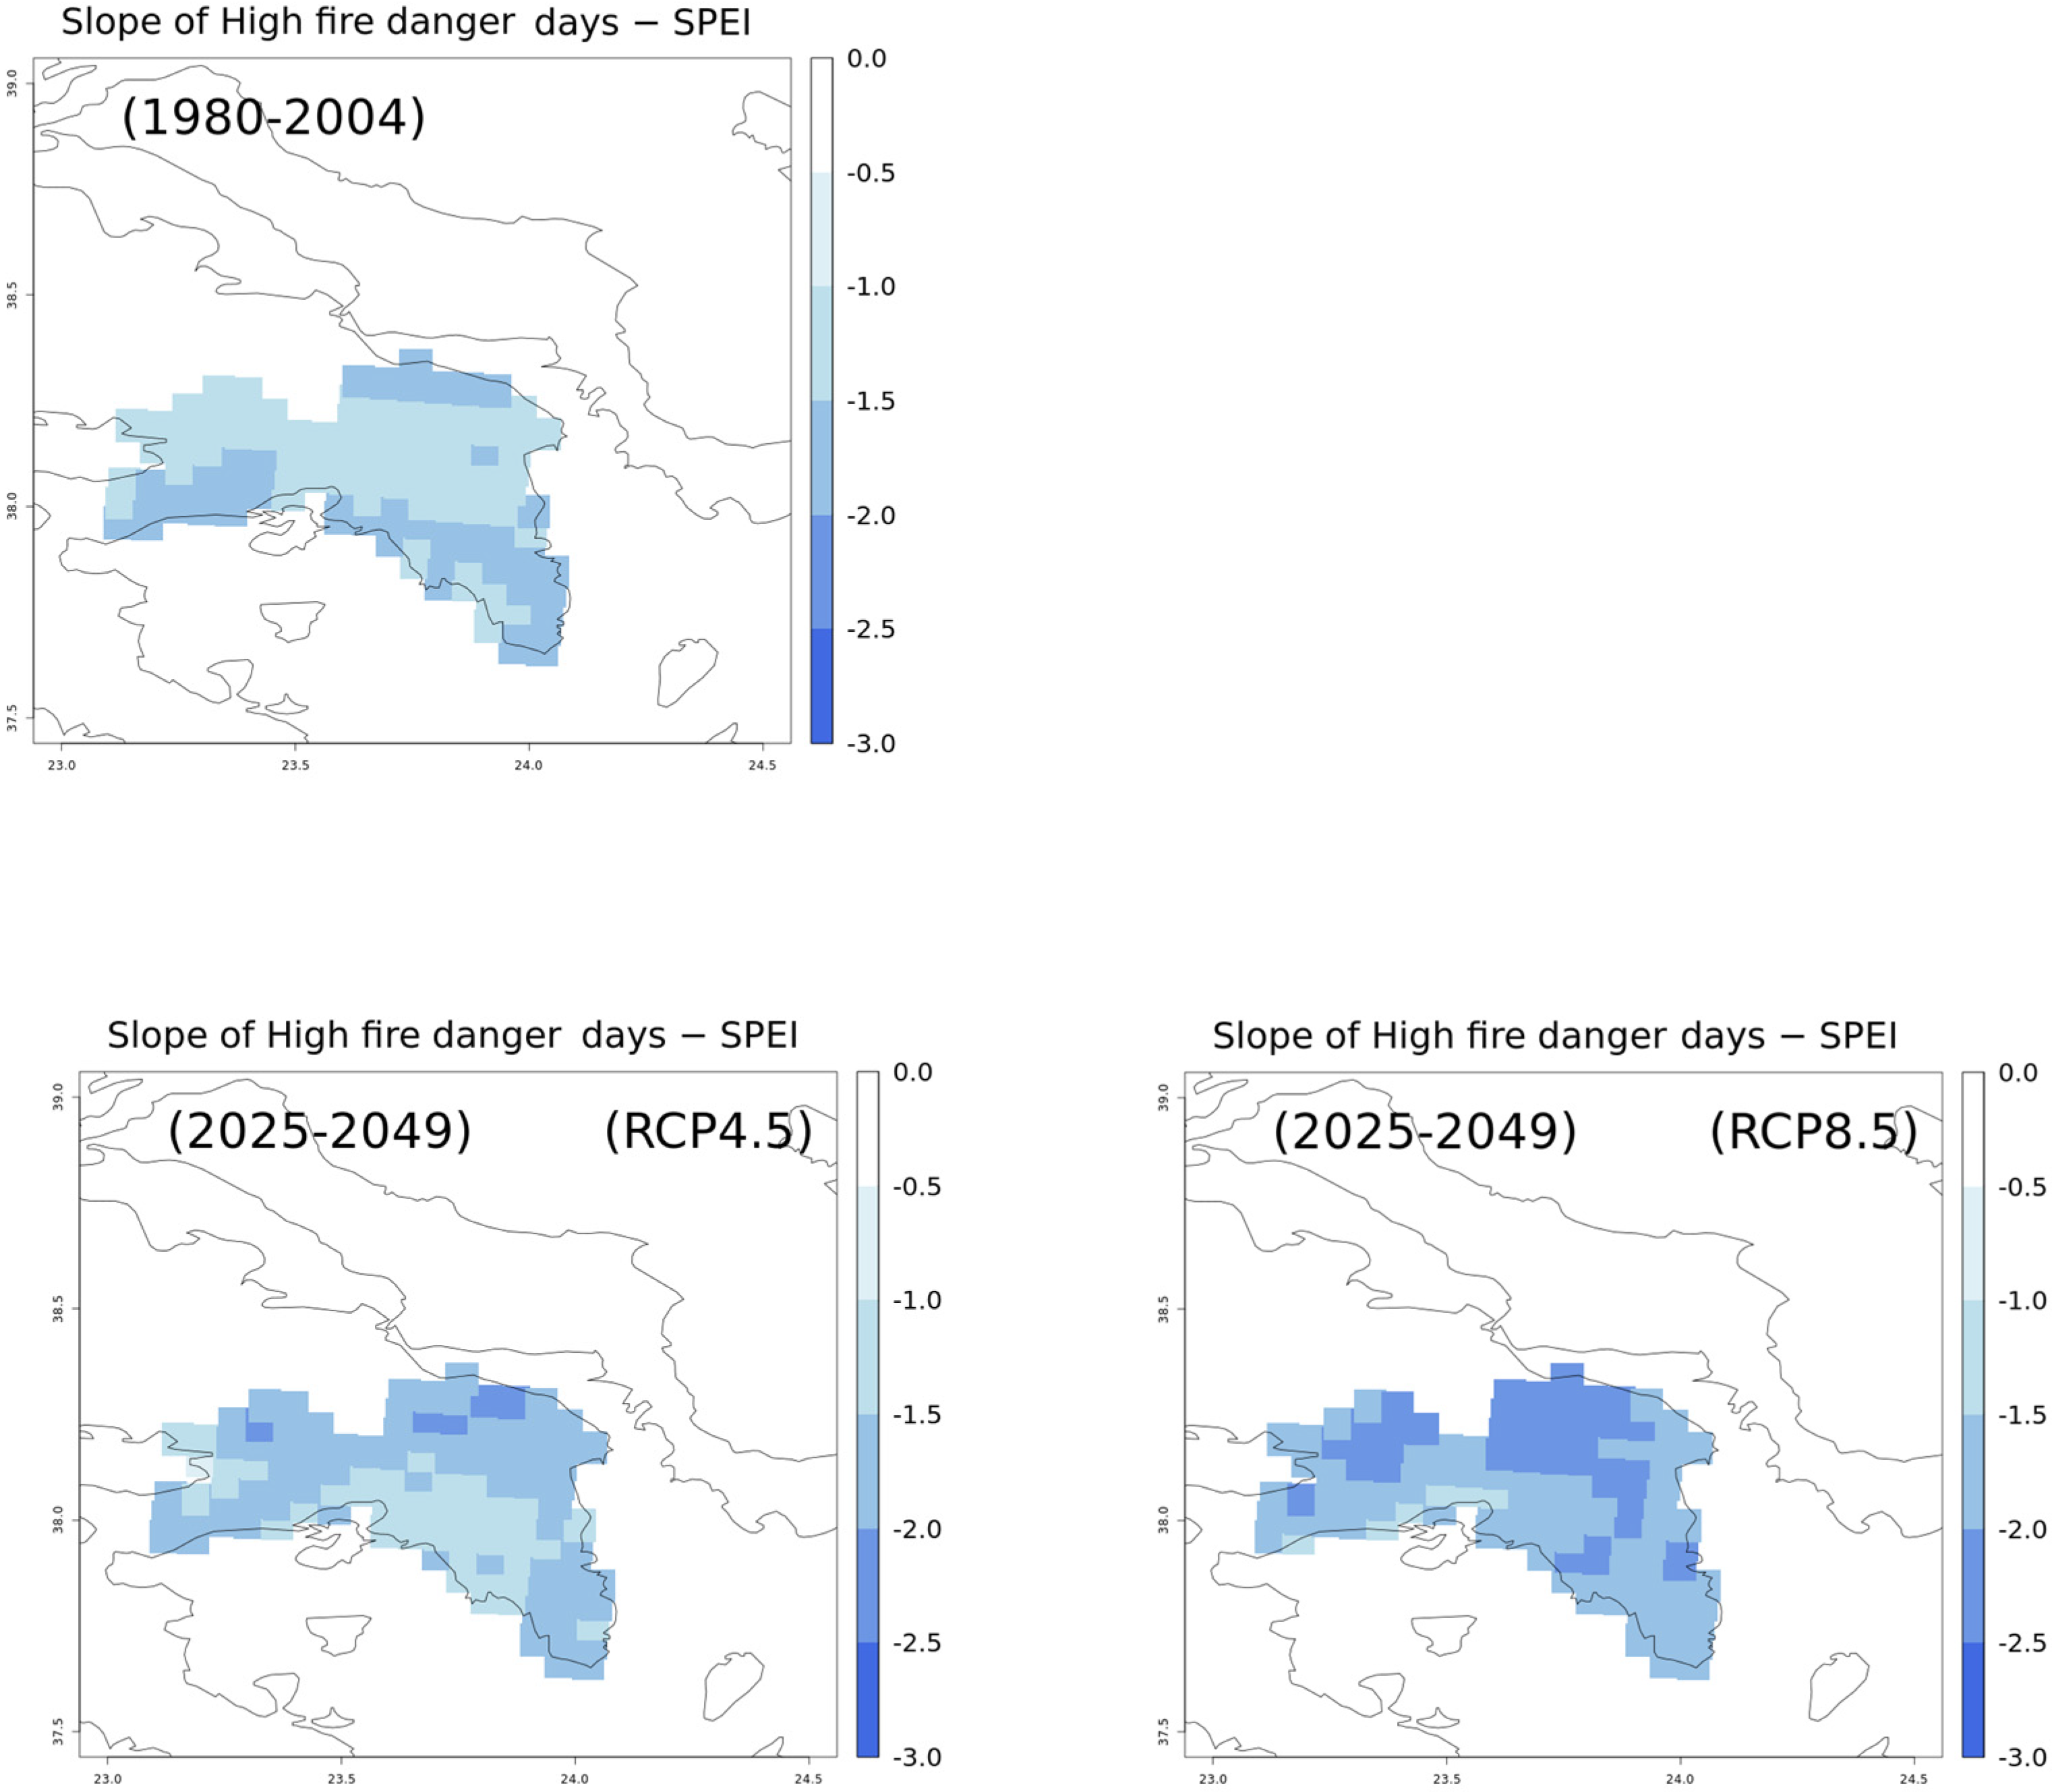
3.2. Linear Regression Statistics SPEI6 and Fire Sub-Indices on a Monthly Basis

The following subsection investigates the changes in the relevant fire index values during the historical and future periods under the two climate change scenarios relative to the monthly values of SPEI6 obtained from the slope’s linear regression calculation (Figure 9, Figure 10, Figure 11 and Figure 12). The slope values for all the examined indicators were consistently negative. This was expected because the fire weather danger increases when the SPEI is negative and its values shift to drier conditions. In addition, it was observed that the dependence of each variable on the SPEI6 changed with the period, space, and climate scenario. Moreover, it was noticed that the slope values during the future periods were more negative than during the historical period, implying an abrupt change in fire danger indicators. Figure 9 shows that the largest part of the Attica region is characterised by slope values in the range of −4 to −6 in terms of the extreme FWI95 during the historical and future periods under both scenarios, with an exception in the near future under RCP8.5, where values were found in a range of −6 to −10. In both periods under RCP4.5 and the far future under RCP8.5, limited areas in the western coastal part of the region exhibited the lowest values. Concerning the mean FWI and SPEI slope values, most of the region showed values in the range of −4 to −6 in both periods and scenarios (Figure S5).
Linear regression analysis regarding the number of days with FWI > 38 (high fire risk) and FWI > 50 (extreme fire risk), shown in Figure 10 and Figure S6 in the Supplementary Material, respectively, revealed slope values in the range of −1 to −3 under both scenarios and periods. Nonetheless, the most negative values were found under RCP8.5 in the near future and under RCP4.5 in the far-future period, specifically in the northern parts, which are primarily classified as forested areas and are thus more prone to fires.
ISI–SPEI6 linear regression statistics (Figure 11) indicated negative slope values in all cases, which shifted to more negative values in the future periods compared to the historical period, with values in the range of −4 to −6 found in the coastal western area of the Attica region under both projected scenarios and periods. Investigation of the relationship between FFMC and SPEI6 (Figure 12) showed a negative rate of change (up to −2.5), with the most negative values found in the northern part of the region under RCP4.5 during both future periods.
Figure 10. Spatial trend results of the relationship between SPEI6 and FWI > 38 for the historical and future periods under RCP4.5 and RCP8.5 for the Attica region.
Climate 12 00135 g010aClimate 12 00135 g010b
Figure 11. Spatial trend results of the relationship between SPEI6 and mean ISI for the historical and future periods under RCP4.5 and RCP8.5 for the Attica region.
Climate 12 00135 g011aClimate 12 00135 g011b
Figure 12. Spatial trend results of the relationship between SPEI6 and mean FFMC for the historical and future periods under RCP4.5 and RCP8.5 for the Attica region.
Climate 12 00135 g012aClimate 12 00135 g012b

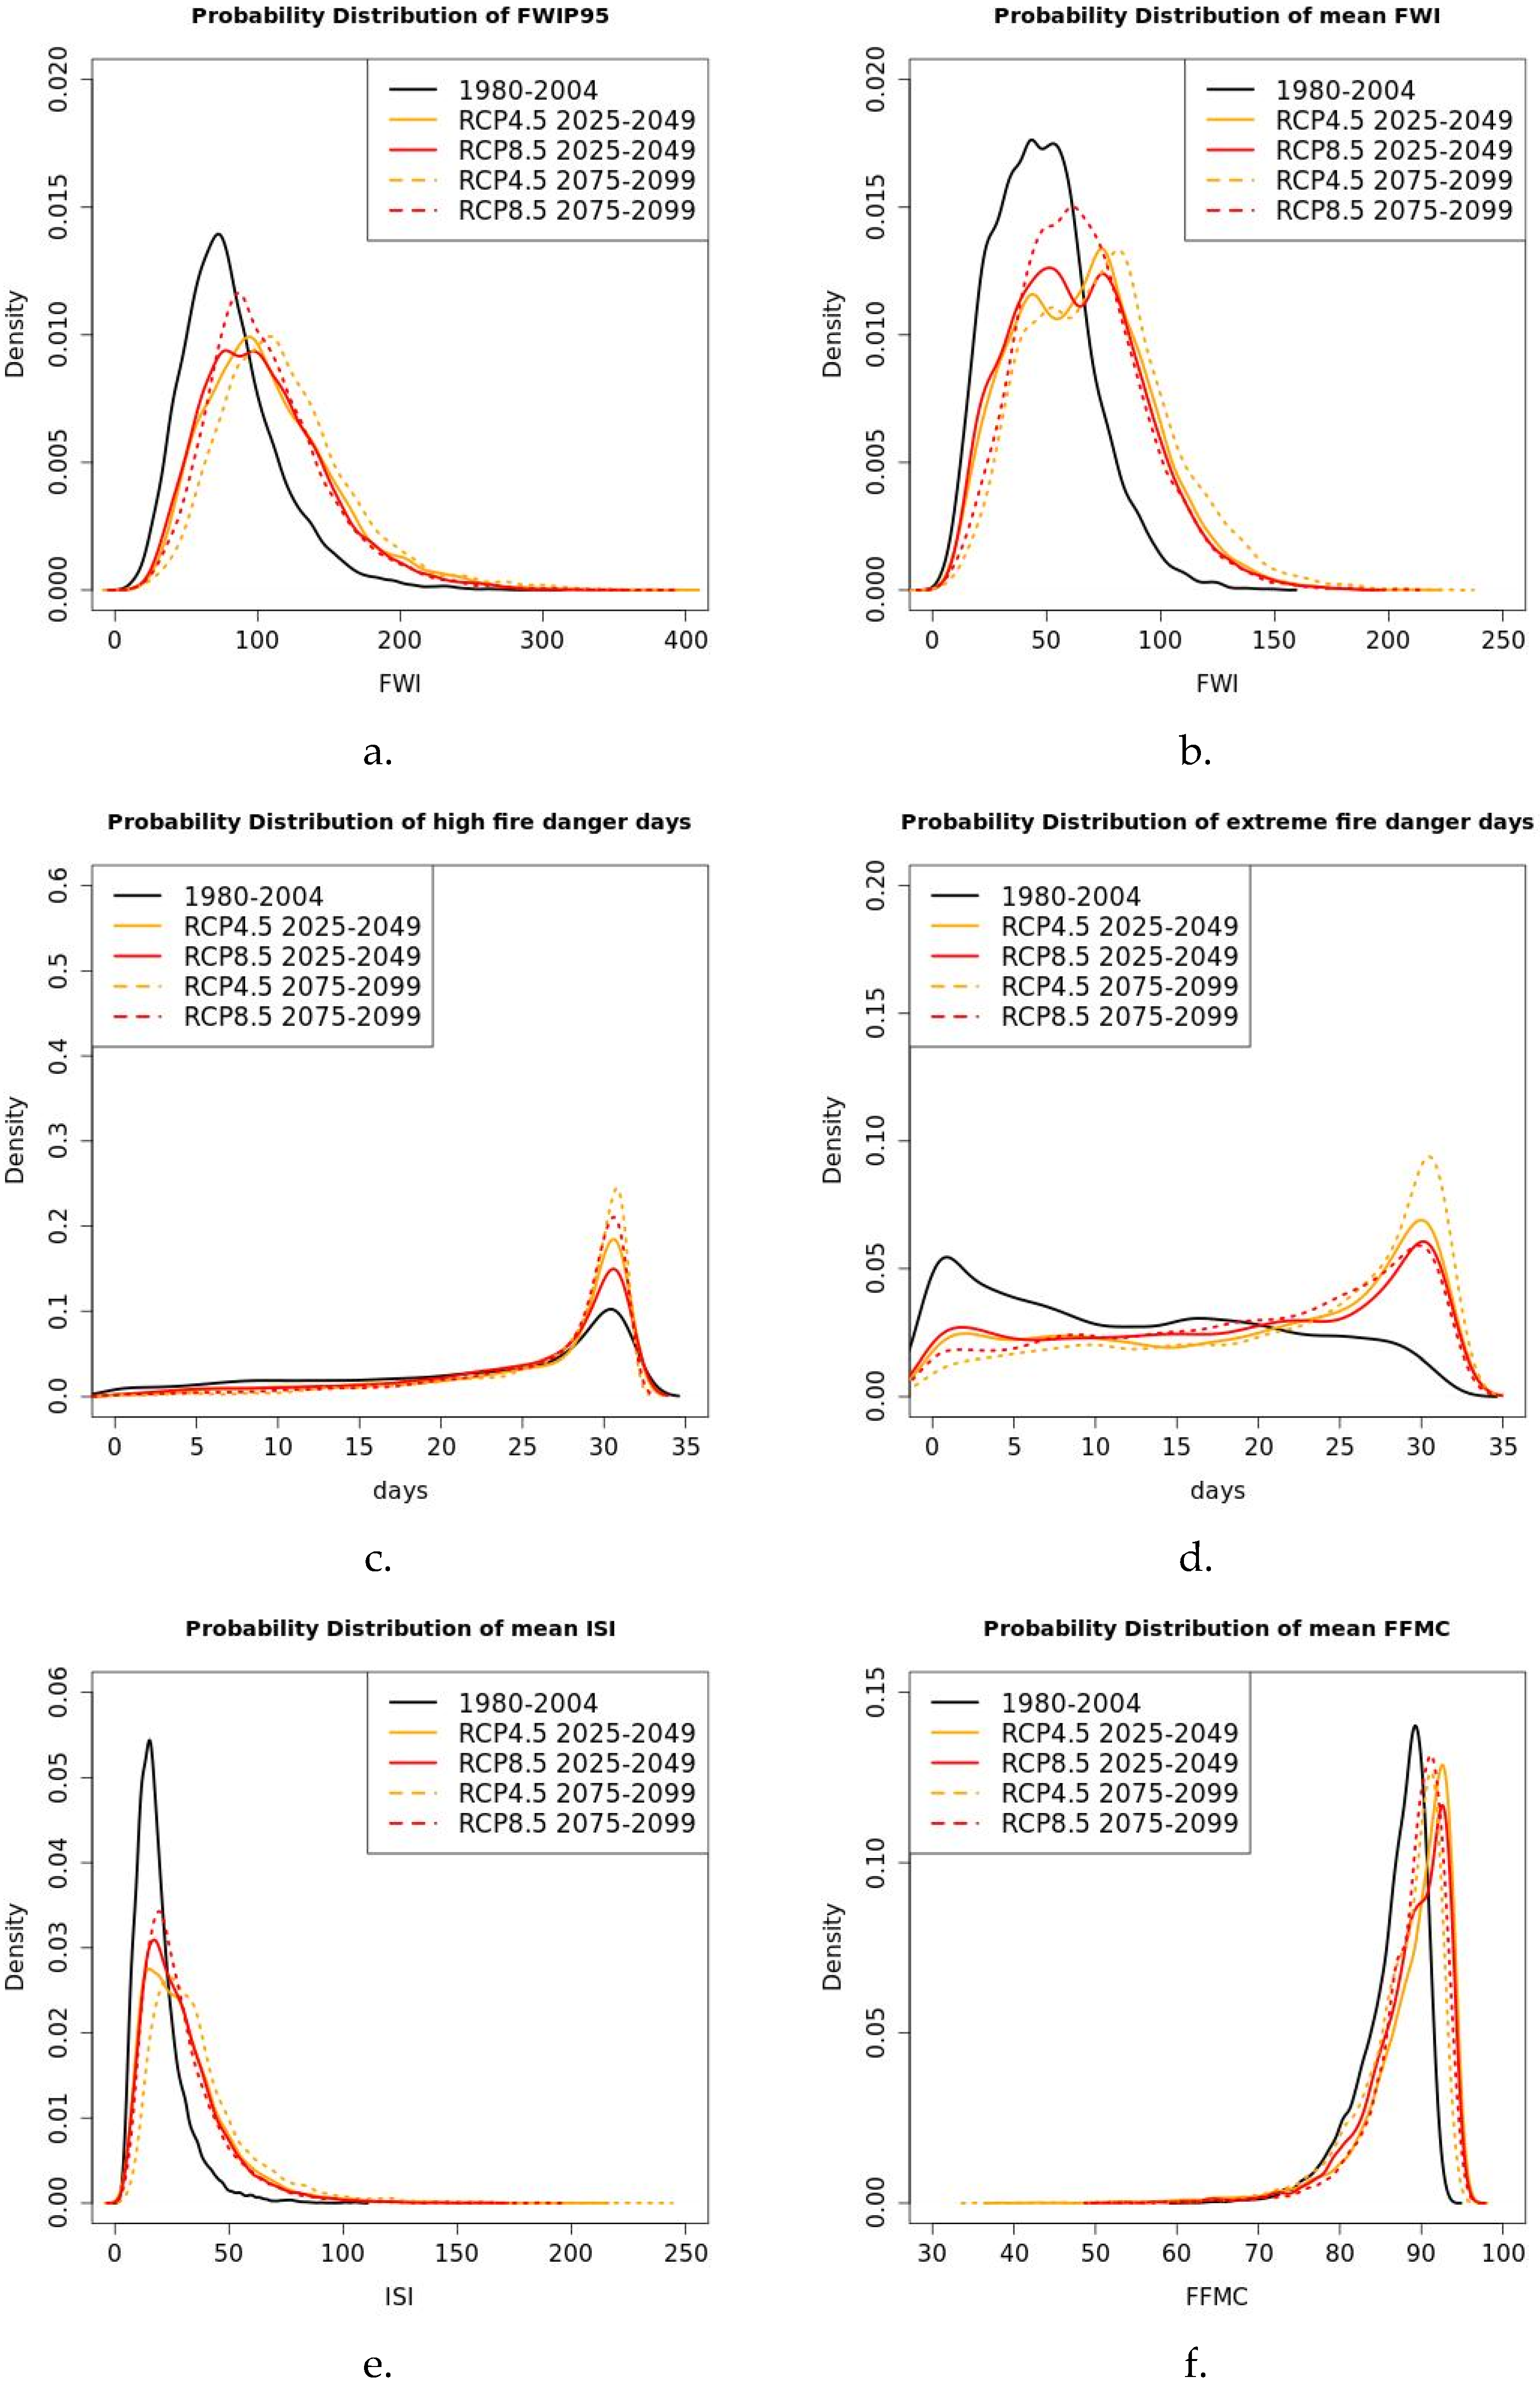
3.3. Evaluation of Probability Density Functions

In this subsection, we discuss the corresponding probability distribution functions (PDFs) of the variables under investigation for the historical, near- (2025–2049), and far-future (2075–2099) periods under the RP4.5 and RCP8.5 scenarios for the Attica region’s non-urban areas shown in Figure 1.
The PDFs that correspond to the future periods of the extreme FWI95 (Figure 13a) showed a shift towards the highest FWI95 extreme values, not only regarding the mean (although of the lowest density compared to the historical period) but also towards the tails of the distributions. It was noticed that under RCP4.5, the curve was shifted to higher values in the far-future period, but with lower probability density values. Concerning RCP8.5, the main difference was that even though the two distributions were similar, the density of the mean values increased in the far future. Furthermore, a similar behaviour was observed in the distributions of the mean FWI (Figure 13b). When comparing the probability distribution of fire danger days to the historical period, it was predicted that both high and extreme fire days would be characterised by higher probability density values in the future (Figure 13c and Figure 13d, respectively). Moreover, the highest increase was observed under RCP4.5 in both future periods compared to RCP8.5. The historical and future periods’ curves for extreme fire danger days showed completely different behaviour; the curve skewed to the right, indicating low probability density values of extreme fire danger days in the historical period, while the projected curves under both periods and scenarios skewed to the left, underlining a notable shift of the probability value towards an increasing number of extreme fire danger days, especially in the far future under RCP4.5. These results are in agreement with recent studies ([18,55]) which reported increasing trends regarding the mean and maximum values of the FWI, and exceeding thresholds of FWI during the near and future periods for both RCPs, in particular under RCP8.5 in the far future, in the southern and eastern parts of Greece (with the Attica region included). Richardson et al. [56] indicated that the increase in the occurrence of extreme fire danger days from the late 1990s for Australia was mainly associated with rising temperature, wind speed, and decreases in relative humidity. Dupuy et al., 2020 [6], in a review study of future wildfire danger based on the FWI system, pointed out increasing wildfire danger under climate change scenarios in southern Europe, depending on fuel dynamics.
Furthermore, the mean ISI, as seen in Figure 13e, revealed a shift towards extreme values in the tail of the distributions for both periods and scenarios, but with lower probability density values compared to the historical period, probably associated with the estimated reduction of “Etesian” winds in the future, as previously mentioned by [50,52]. Finally, the distribution of the mean FFMC (Figure 13f), is projected to trend towards higher values but with lower density in the future. It is noteworthy that lower values of FFMC under RCP4.5 are seen in the right tail of the distributions in both future periods.
Figure 13. Probability density distributions of the examined fire indicators for the historical and future periods under RCP4.5 and RCP8.5 considering only the forest and agricultural areas in the Attica region: (a) FWI95, (b) mean FWI, (c) extreme fire days, (d) high fire days, (e) mean ISI, and (f) mean FFMC.
Climate 12 00135 g013

4. Conclusions

This study focused on the investigation of the role that drought could play as a relevant driver of wildfire occurrence in the Attica region based on statistical analysis of model climate data. It should be noted that this work was undertaken within the framework of the European project FirEUrisk, as one of the project’s pilot sites for fire risk assessment is the Attica region. More specifically, the aim was to explore the statistical relationship between drought and fire weather-related indices that reflect the conditions associated with climate change in Attica.
Emphasis was placed on how these statistical relationships are projected to change under RCP4.5 and RCP8.5 in the near- (2025–2049) and far-future (2075–2099) periods. The use of high-resolution (5 km) gridded meteorological fields in the regional weather model (WRF), which can resolve local weather conditions and improve our understanding of the spatiotemporal variability of fire risk, was crucial to this work, which focused on the complex and diverse topography of the Attica region. Concerning the derived variables, SPEI was used to assess drought, whereas FWI with its two sub-components (ISI and FFMC) and other fire-related variables, like fire danger days, were calculated to estimate fire risks.
Statistical analysis of the relation of mean and extreme values of FWI (in terms of 95th percentile and FWI > 50) with SPEI6 indicated moderate-to-strong anti-correlation and negative slope results for the whole region, which were observed to be non-uniformly spatially distributed during the historical and future periods. The statistical results of those indices differentiated in the context of climate change based on the RCP scenarios and future periods, yielding a low anti-correlation and more abrupt changes in fire danger. The spatial distribution varied due to the region’s complex topography, which affects climate conditions locally and enhances climate variability. Analysis of SPEI with the main meteorological variables of FWI95 showed that the spatial variation of the linear correlation between FWI95 and SPEI in the region depended on the spatial variation of the linear correlation between SPEI and its main variables: precipitation, relative humidity, and temperature. It also highlighted that the relationship between the extreme FWI and SPEI6 may change in future, which could impact their relationship by lowering their correlation.
Overall, the findings suggest a significant effect on the relationship between drought and fire weather-related indices in the future, which could be attributed to projected dynamic and thermodynamic changes in atmospheric circulation patterns. More specifically, these are related to a projected enhanced anticyclonic circulation in the area and a reduction of prevailing strong north-eastern flows (Etesian winds) during the summer months that may consequently lead to heatwaves and prolonged drought conditions due to increased southerly flows from Africa, as already reported in [50].
Moreover, this behaviour was also explained by the projected changes in the corresponding PDFs, which highlighted an apparent shift to more extreme values of fire indicators under both scenarios and future periods. Similarly, the impact of climate change was evident on both ISI and FFMC in terms of correlation and slope results, as well as on the tendency towards more extreme values in the corresponding PDF patterns. Of the two FWI components, drought had a greater influence on FFMC, with statistically significant and more robust anti-correlation values, compared to ISI in both scenarios and future periods, everywhere in the region. Notably, compared to the historical period, the increasing values of the projected fire weather danger indicators showed higher fire danger in the non-urban parts of Attica. This was more obvious under RCP4.5, especially in the far-future period, for the mean and extreme values (on the tails of the distributions) of FWI95, the mean FWI, ISI, and FFMC indices.
In conclusion, statistical analysis of the fire and drought indices using high-resolution climate data suggested that climate change is projected to impact their relationship in different periods, climate scenarios, and areas of the Attica region, which, in turn, could affect the severity of fire weather. The derived moderate-to-strong anti-correlations between fire weather, fire danger, and drought indices emphasise the importance of spatially varying climate conditions for fire occurrence.

Supplementary Materials

The following supporting information can be downloaded at: https://www.mdpi.com/article/10.3390/cli12090135/s1, Figure S1 Correlation of SPEI6_oct and TX95 (95th percentile of TX) for the Attica region; Correlation of SPEI6_oct and WS95 (95th percentile of wind) for the Attica region; Figure S3 Correlation of SPEI6_oct and RR95 (95th percentile of precipitation) for the Attica region; Figure S4 Correlation of SPEI6_oct and RH95 (95th percentile of relative humidity) for the Attica region; Figure S5 Spatial slope results of the relation SPEI6 ~ mean FWI for the historical and future periods under RCP4.5 and RCP8.5 for the Attica region; Figure S6 Spatial slope results of the relation SPEI6 ~ Extreme Fire danger days for the historical and future periods under RCP4.5 and RCP8.5 for the Attica region.

Author Contributions

Conceptualization, A.S., D.V. and N.P.; methodology, A.S. and N.P.; software, N.P.; validation, A.S. and N.P.; formal analysis, N.P.; investigation, A.S., D.V. and N.P.; data curation, N.P.; writing—original draft preparation, N.P.; writing—review and editing, D.V.; visualization, N.P.; supervision, A.S. and D.V.; project administration, A.S. and D.V. All authors have read and agreed to the published version of the manuscript.

Funding

This research has received funding from the European Union’s Horizon 2020 research and innovation programme “FirEUrisk” under grant agreement No 101003890.

Data Availability Statement

The raw data supporting the conclusions of this article will be made available by the authors on request.

Acknowledgments

This work was supported by computational time granted by the Greek Research and Technology Network (GRNET) in the National HPC facility, ARIS, under project IDs HRCOG (pr004020) and HRPOG (pr006028).

Conflicts of Interest

The authors declare no conflicts of interest. The funders had no role in the design of the study; in the collection, analyses, or interpretation of data; in the writing of the manuscript; or in the decision to publish the results.

References

  1. MedECC. Climate and Environmental Change in the Mediterranean Basin—Current Situation and Risks for the Future. First Mediterranean Assessment; MedECC: Marseille, France, 2021. [Google Scholar]
  2. Costa, H.; Rigo, D.; Libertà, G.; Houston Durrant, T.; San-Miguel-Ayanz, J. European Wildfire Danger and Vulnerability in a Changing Climate: Towards Integrating Risk Dimensions: JRC PESETA IV Project: Task 9—Forest Fires; Publications Office: Luxembourg, 2020. [Google Scholar]
  3. Ruffault, J.; Curt, T.; Moron, V.; Trigo, R.M.; Mouillot, F.; Koutsias, N.; Pimont, F.; Martin-StPaul, N.; Barbero, R.; Dupuy, J.-L.; et al. Increased Likelihood of Heat-Induced Large Wildfires in the Mediterranean Basin. Sci. Rep. 2020, 10, 13790. [Google Scholar] [CrossRef]
  4. Steinfeld, D.; Peter, A.; Martius, O.; Brönnimann, S. Assessing the Performance of Various Fire Weather Indices for Wildfire Occurrence in Northern Switzerland. EGUsphere 2022, 2022, 1–23. [Google Scholar] [CrossRef]
  5. Sutanto, S.J.; Vitolo, C.; Di Napoli, C.; D’Andrea, M.; Van Lanen, H.A.J. Heatwaves, Droughts, and Fires: Exploring Compound and Cascading Dry Hazards at the Pan-European Scale. Environ. Int. 2020, 134, 105276. [Google Scholar] [CrossRef] [PubMed]
  6. Dupuy, J.; Fargeon, H.; Martin-StPaul, N.; Pimont, F.; Ruffault, J.; Guijarro, M.; Hernando, C.; Madrigal, J.; Fernandes, P. Climate Change Impact on Future Wildfire Danger and Activity in Southern Europe: A Review. Ann. For. Sci. 2020, 77, 35. [Google Scholar] [CrossRef]
  7. Turco, M.; Rosa-Cánovas, J.J.; Bedia, J.; Jerez, S.; Montávez, J.P.; Llasat, M.C.; Provenzale, A. Exacerbated Fires in Mediterranean Europe Due to Anthropogenic Warming Projected with Non-Stationary Climate-Fire Models. Nat. Commun. 2018, 9, 3821. [Google Scholar] [CrossRef]
  8. Varela, V.; Vlachogiannis, D.; Sfetsos, A.; Politi, N.; Karozis, S. Methodology for the Study of Near-Future Changes of Fire Weather Patterns with Emphasis on Archaeological and Protected Touristic Areas in Greece. Forests 2020, 11, 1168. [Google Scholar] [CrossRef]
  9. Varela, V.; Vlachogiannis, D.; Sfetsos, A.; Karozis, S.; Politi, N.; Giroud, F. Projection of Forest Fire Danger Due to Climate Change in the French Mediterranean Region. Sustainability 2019, 11, 4284. [Google Scholar] [CrossRef]
  10. Littell, J.S.; Peterson, D.L.; Riley, K.L.; Liu, Y.; Luce, C.H. A Review of the Relationships between Drought and Forest Fire in the United States. Glob. Change Biol. 2016, 22, 2353–2369. [Google Scholar] [CrossRef]
  11. Squire, D.T.; Richardson, D.; Risbey, J.S.; Black, A.S.; Kitsios, V.; Matear, R.J.; Monselesan, D.; Moore, T.S.; Tozer, C.R. Likelihood of Unprecedented Drought and Fire Weather during Australia’s 2019 Megafires. NPJ Clim. Atmos. Sci. 2021, 4, 64. [Google Scholar] [CrossRef]
  12. White, R.H.; Anderson, S.; Booth, J.F.; Braich, G.; Draeger, C.; Fei, C.; Harley, C.D.G.; Henderson, S.B.; Jakob, M.; Lau, C.-A.; et al. The Unprecedented Pacific Northwest Heatwave of June 2021. Nat. Commun. 2023, 14, 727. [Google Scholar] [CrossRef]
  13. Papagiannaki, K.; Giannaros, T.M.; Lykoudis, S.; Kotroni, V.; Lagouvardos, K. Weather-Related Thresholds for Wildfire Danger in a Mediterranean Region: The Case of Greece. Agric. For. Meteorol. 2020, 291, 108076. [Google Scholar] [CrossRef]
  14. Karali, A.; Hatzaki, M.; Giannakopoulos, C.; Roussos, A.; Xanthopoulos, G.; Tenentes, V. Sensitivity and Evaluation of Current Fire Risk and Future Projections Due to Climate Change: The Case Study of Greece. Nat. Hazards Earth Syst. Sci. 2014, 14, 143–153. [Google Scholar] [CrossRef]
  15. Dimitrakopoulos, A.P.; Vlahou, M.; Anagnostopoulou, C.G.; Mitsopoulos, I.D. Impact of Drought on Wildland Fires in Greece: Implications of Climatic Change? Clim. Change 2011, 109, 331–347. [Google Scholar] [CrossRef]
  16. Dimitrakopoulos, A.P.; Bemmerzouk, A.M.; Mitsopoulos, I.D. Evaluation of the Canadian Fire Weather Index System in an Eastern Mediterranean Environment. Meteorol. Appl. 2011, 18, 83–93. [Google Scholar] [CrossRef]
  17. Koutsias, N.; Xanthopoulos, G.; Founda, D.; Xystrakis, F.; Nioti, F.; Pleniou, M.; Mallinis, G.; Arianoutsou, M. On the Relationships between Forest Fires and Weather Conditions in Greece from Long-Term National Observations (1894–2010). Int. J. Wildland Fire 2013, 22, 493–507. [Google Scholar] [CrossRef]
  18. Ntinopoulos, N.; Spiliotopoulos, M.; Vasiliades, L.; Mylopoulos, N. Contribution to the Study of Forest Fires in Semi-Arid Regions with the Use of Canadian Fire Weather Index Application in Greece. Climate 2022, 10, 143. [Google Scholar] [CrossRef]
  19. Zikeloglou, I.; Lekkas, E.; Lozios, S.; Stavropoulou, M. Is Early Evacuation the Best and Only Strategy to Protect and Mitigate the Effects of Forest Fires in WUI Areas? A Qualitative Research on the Residents’ Response during the 2021 Forest Fires in NE Attica, Greece. Int. J. Disaster Risk Reduct. 2023, 88, 103612. [Google Scholar] [CrossRef]
  20. Evelpidou, N.; Tzouxanioti, M.; Gavalas, T.; Spyrou, E.; Saitis, G.; Petropoulos, A.; Karkani, A. Assessment of Fire Effects on Surface Runoff Erosion Susceptibility: The Case of the Summer 2021 Forest Fires in Greece. Land 2022, 11, 21. [Google Scholar] [CrossRef]
  21. Lagouvardos, K.; Kotroni, V.; Giannaros, T.M.; Dafis, S. Meteorological Conditions Conducive to the Rapid Spread of the Deadly Wildfire in Eastern Attica, Greece. Bull. Am. Meteorol. Soc. 2019, 100, 2137–2145. [Google Scholar] [CrossRef]
  22. Efthimiou, N.; Psomiadis, E.; Panagos, P. Fire Severity and Soil Erosion Susceptibility Mapping Using Multi-Temporal Earth Observation Data: The Case of Mati Fatal Wildfire in Eastern Attica, Greece. Catena 2020, 187, 104320. [Google Scholar] [CrossRef]
  23. Mitsopoulos, I.; Mallinis, G.; Dimitrakopoulos, A.; Xanthopoulos, G.; Eftychidis, G.; Goldammer, J.G. Vulnerability of Peri-urban and Residential Areas to Landscape Fires in Greece: Evidence by Wildland-Urban Interface Data. Data Brief. 2020, 31, 106025. [Google Scholar] [CrossRef]
  24. Makhaya, Z.; Odindi, J.; Mutanga, O. The Influence of Bioclimatic and Topographic Variables on Grassland Fire Occurrence within an Urbanized Landscape. Sci. Afr. 2022, 15, e01127. [Google Scholar] [CrossRef]
  25. Politi, N.; Vlachogiannis, D.; Sfetsos, A.; Nastos, P.T.; Dalezios, N.R. High Resolution Future Projections of Drought Characteristics in Greece Based on SPI and SPEI Indices. Atmosphere 2022, 13, 1468. [Google Scholar] [CrossRef]
  26. Politi, N.; Vlachogiannis, D.; Sfetsos, A.; Gounaris, N. Fire Weather Assessment of Future Changes in Fire Weather Conditions in the Attica Region. Environ. Sci. Proc. 2023, 26, 186. [Google Scholar] [CrossRef]
  27. Politi, N.; Vlachogiannis, D.; Sfetsos, A.; Nastos, P.T. High Resolution Projections for Extreme Temperatures and Precipitation over Greece. Clim. Dyn. 2022, 61, 633–667. [Google Scholar] [CrossRef]
  28. Vlachogiannis, D.; Sfetsos, A.; Markantonis, I.; Politi, N.; Karozis, S.; Gounaris, N. Quantifying the Occurrence of Multi-Hazards Due to Climate Change. Appl. Sci. 2022, 12, 1218. [Google Scholar] [CrossRef]
  29. Feidas, H. Trend Analysis of Air Temperature Time Series in Greece and Their Relationship with Circulation Using Surface and Satellite Data: Recent Trends and an Update to 2013. Theor. Appl. Climatol. 2017, 129, 1383–1406. [Google Scholar] [CrossRef]
  30. Petrou, I.; Kyriazis, N.; Kassomenos, P. Evaluating the Spatial and Temporal Characteristics of Summer Urban Overheating through Weather Types in the Attica Region, Greece. Sustainability 2023, 15, 10633. [Google Scholar] [CrossRef]
  31. Prezerakos, N.G. Etesian Winds Outbursts over the Greek Seas and Their Linkage with Larger-Scale Atmospheric Circulation Features: Two Real Time Data Case Studies. Atmosfera 2022, 35, 89–110. [Google Scholar] [CrossRef]
  32. Skamarock, W.C.; Skamarock, W.C.; Klemp, J.B.; Dudhia, J.; Gill, D.O.; Barker, D.M.; Wang, W.; Powers, J.G. A Description of the Advanced Research WRF Version 3. NCAR Tech. Note 2008, 475, 113. [Google Scholar]
  33. Hazeleger, W.; Severijns, C.; Semmler, T.; Ştefǎnescu, S.; Yang, S.; Wang, X.; Wyser, K.; Dutra, E.; Baldasano, J.M.; Bintanja, R.; et al. EC-Earth: A Seamless Earth-System Prediction Approach in Action. Bull. Am. Meteorol. Soc. 2010, 91, 1357–1364. [Google Scholar] [CrossRef]
  34. Hazeleger, W.; Wang, X.; Severijns, C.; Ştefănescu, S.; Bintanja, R.; Sterl, A.; Wyser, K.; Semmler, T.; Yang, S.; van den Hurk, B.; et al. EC-Earth V2.2: Description and Validation of a New Seamless Earth System Prediction Model. Clim. Dyn. 2012, 39, 2611–2629. [Google Scholar] [CrossRef]
  35. IPCC AR5 Climate Change 2014: Impacts, Adaptation, and Vulnerability—IPCC. Available online: https://www.ipcc.ch/report/ar5/wg2/ (accessed on 11 May 2022).
  36. Vicente-Serrano, S.M.; Beguería, S.; López-Moreno, J.I. A Multiscalar Drought Index Sensitive to Global Warming: The Standardized Precipitation Evapotranspiration Index. J. Clim. 2010, 23, 1696–1718. [Google Scholar] [CrossRef]
  37. Marín, P.-G.; Julio, C.J.; Dante Arturo, R.-T.; Daniel Jose, V.-N. Drought and Spatiotemporal Variability of Forest Fires across Mexico. Chin. Geogr. Sci. 2018, 28, 25–37. [Google Scholar] [CrossRef]
  38. Yang, S.; Zeng, A.; Tigabu, M.; Wang, G.; Zhang, Z.; Zhu, H.; Guo, F. Investigating Drought Events and Their Consequences in Wildfires: An Application in China. Fire 2023, 6, 223. [Google Scholar] [CrossRef]
  39. Charchousi, D.; Papadopoulou, M.P.; Papadaskalopoulou, C.; Karali, A.; Giannakopoulos, C.; Loizidou, M. Assessing Climate Change Impacts on Drought Severity in Mediterranean Islands Using the Standardized Precipitation Evapotranspiration Index (SPEI). Available online: http://uest.ntua.gr/adapt2clima/proceedings/presentation/charchousi_SPEI.pdf (accessed on 30 July 2024).
  40. Arnell, N.W.; Kay, A.L.; Freeman, A.; Rudd, A.C.; Lowe, J.A. Changing Climate Risk in the UK: A Multi-Sectoral Analysis Using Policy-Relevant Indicators. Clim. Risk Manag. 2021, 31, 100265. [Google Scholar] [CrossRef]
  41. Van Wagner, C.E.; Pickett, T.L. Equations and FORTRAN Program for the Canadian Forest Fire Weather Index System; Canadian Forestry Service: Ottawa, ON, Canada, 1985.
  42. Politi, N.; Vlachogiannis, D.; Sfetsos, A.; Gounaris, N.; Varela, V. Investigation of Fire Weather Danger under a Changing Climate at High Resolution in Greece. Sustainability 2023, 15, 2498. [Google Scholar] [CrossRef]
  43. Ahmed, M.H.; Kutsuzawa, K.; Hayashibe, M. Transhumeral Arm Reaching Motion Prediction through Deep Reinforcement Learning-Based Synthetic Motion Cloning. Biomimetics 2023, 8, 367. [Google Scholar] [CrossRef]
  44. El Garroussi, S.; Di Giuseppe, F.; Barnard, C.; Wetterhall, F. Europe Faces up to Tenfold Increase in Extreme Fires in a Warming Climate. NPJ Clim. Atmos. Sci. 2024, 7, 30. [Google Scholar] [CrossRef]
  45. Karali, A.; Varotsos, K.V.; Giannakopoulos, C.; Nastos, P.P.; Hatzaki, M. Seasonal Fire Danger Forecasts for Supporting Fire Prevention Management in an Eastern Mediterranean Environment: The Case Study of Attica, Greece. Nat. Hazards Earth Syst. Sci. 2023, 23, 429–445. [Google Scholar] [CrossRef]
  46. Carrillo, J.; González, A.; Pérez, J.C.; Expósito, F.J.; Díaz, J.P. Projected Impacts of Climate Change on Tourism in the Canary Islands. Reg. Environ. Change 2022, 22, 61. [Google Scholar] [CrossRef]
  47. Giorgi, F.; Lionello, P. Climate Change Projections for the Mediterranean Region. Glob. Planet Change 2008, 63, 90–104. [Google Scholar] [CrossRef]
  48. Lionello, P.; Scarascia, L. The Relation of Climate Extremes with Global Warming in the Mediterranean Region and Its North versus South Contrast. Reg. Environ. Change 2020, 20, 31. [Google Scholar] [CrossRef]
  49. Lionello, P.; Scarascia, L. The Relation between Climate Change in the Mediterranean Region and Global Warming. Reg. Environ. Change 2018, 18, 1481–1493. [Google Scholar] [CrossRef]
  50. Karozis, S.; Sfetsos, A.; Gounaris, N.; Vlachogiannis, D. An Assessment of Climate Change Impact on Air Masses Arriving in Athens, Greece. Theor. Appl. Climatol. 2021, 145, 501–517. [Google Scholar] [CrossRef]
  51. Paschalidou, A.K.; Kassomenos, P.A. What are the Most Fire-Dangerous Atmospheric Circulations in the Eastern-Mediterranean? Analysis of the Synoptic Wildfire Climatology. Sci. Total Environ. 2016, 539, 536–545. [Google Scholar] [CrossRef] [PubMed]
  52. Dafka, S.; Toreti, A.; Zanis, P.; Xoplaki, E.; Luterbacher, J. Twenty-First-Century Changes in the Eastern Mediterranean Etesians and Associated Midlatitude Atmospheric Circulation. J. Geophys. Res. Atmos. 2019, 124, 12741–12754. [Google Scholar] [CrossRef]
  53. Reale, M.; Cabos Narvaez, W.D.; Cavicchia, L.; Conte, D.; Coppola, E.; Flaounas, E.; Giorgi, F.; Gualdi, S.; Hochman, A.; Li, L.; et al. Future Projections of Mediterranean Cyclone Characteristics Using the Med-CORDEX Ensemble of Coupled Regional Climate System Models. Clim. Dyn. 2022, 58, 2501–2524. [Google Scholar] [CrossRef]
  54. Flannigan, M.D.; Wotton, B.M.; Marshall, G.A.; de Groot, W.J.; Johnston, J.; Jurko, N.; Cantin, A.S. Fuel Moisture Sensitivity to Temperature and Precipitation: Climate Change Implications. Clim. Change 2016, 134, 59–71. [Google Scholar] [CrossRef]
  55. Rovithakis, A.; Grillakis, M.G.; Seiradakis, K.D.; Giannakopoulos, C.; Karali, A.; Field, R.; Lazaridis, M.; Voulgarakis, A. Future Climate Change Impact on Wildfire Danger over the Mediterranean: The Case of Greece. Environ. Res. Lett. 2022, 17, 045022. [Google Scholar] [CrossRef]
  56. Richardson, D.; Black, A.S.; Monselesan, D.P.; Risbey, J.S.; Squire, D.T.; Tozer, C.R.; Canadell, J.G. Increased Extreme Fire Weather Occurrence in Southeast Australia and Related Atmospheric Drivers. Weather Clim. Extrem. 2021, 34, 100397. [Google Scholar] [CrossRef]
Figure 1. Attica topographic map.
Climate 12 00135 g001
Figure 2. Non-urban areas (yellow color) and urban areas (red) of the Attica region according to CORINE 2020.
Climate 12 00135 g002
Figure 7. Correlation of SPEI6_oct and mean FFMC for the Attica region for (a) the historical and future periods: (b) near future under RCP4.5, (c) near future under RCP8.5, (d) far future under RCP4.5, and (e) far future under RCP8.5. The black dotted areas show a statistically significant correlation at the 5% significance level.
Climate 12 00135 g007
Figure 8. Correlation of SPEI6_oct and mean ISI for the Attica region for (a) the historical and future periods: (b) near future under RCP4.5, (c) near future under RCP8.5, (d) far future under RCP4.5, and (e) far future under RCP8.5. The black dotted areas show a statistically significant correlation at the 5% significance level.
Climate 12 00135 g008
Figure 9. Spatial trend results of the SPEI6–FWI95 relationship for the historical and future periods under RCP4.5 and RCP8.5 for the Attica region.
Climate 12 00135 g009
Table 1. Fire danger classification of FWI’s values according to EFFIS.
Fire Danger ClassesFWI
Low<11.2
Moderate11.2–21.3
High21.3–38.0
Very High38.0–50
Extreme>50
Table 2. Description of the statistics for monthly drought and fire indices.
StatisticsDescription
Drought indexSPEI6 Monthly values of 6-month scale SPEI
FWI components and fire-related indicesFWI mean Monthly average of daily FWI values
FWI95 The monthly 95th percentile of FWI (extreme)
High fire danger daysNumber of days with FWI > 38 per month, based on European Forest Fire Information System (EFFIS) classification
Extreme fire danger daysNumber of days with FWI > 50 per month, based on European Forest Fire Information System (EFFIS) classification
ISI mean Monthly average of daily ISI values
FFMC mean Monthly average of daily FFMC values
Table 3. Characterization of the Pearson correlation coefficient values (r).
Range of Correlation Values
−1 ≤ r ≤ −0.7Strong negative linear relationship
−0.5 ≤ r ≤ −0.3Moderate negative linear relationship
−0.3 ≤ r ≤ −0.1Weak/low negative linear relationship
−0.1 ≤ r ≤ +0.1Not a linear relationship
+0.1 ≤ r ≤ +0.3Weak/low positive linear relationship
+0.3 ≤ r ≤ +0.7Moderate positive linear relationship
+0.7 ≤ r ≤ +1Strong positive linear relationship
Disclaimer/Publisher’s Note: The statements, opinions and data contained in all publications are solely those of the individual author(s) and contributor(s) and not of MDPI and/or the editor(s). MDPI and/or the editor(s) disclaim responsibility for any injury to people or property resulting from any ideas, methods, instructions or products referred to in the content.

