Article

Assessing the Vulnerability of Farming Households on the Caribbean Island of Hispaniola to Climate Change

1
Identity and Differentiation of Space, Environment and Societies (IDEES), UMR 6266, CNRS, Caen University, 14000 Caen, France
2
Climate Change Research Team (ERC2), Quisqueya University, Port-au-Prince HT 6113, Haiti
3
AgroUniQ, Quisqueya University, Port-au-Prince HT 6113, Haiti
*
Author to whom correspondence should be addressed.
Climate 2024, 12(9), 138; https://doi.org/10.3390/cli12090138
Submission received: 24 July 2024 / Revised: 22 August 2024 / Accepted: 28 August 2024 / Published: 6 September 2024

Abstract

:
This article assesses the individual vulnerability of 550 farming households, 430 in Haiti and 120 in the Dominican Republic, on the Caribbean island of Hispaniola to the impacts of climate change. This assessment is based on an integrated approach, using socio-economic and biophysical variables. The variables collected for each farm household were grouped into three categories: adaptive capacity, sensitivity, and exposure. Multiple correspondence analysis (MCA) was used to develop a vulnerability index for each farm household, enabling them to be classified according to their level of vulnerability to the impacts of climate change. A logistic regression model was then used to identify the main factors influencing their vulnerability. The results revealed that on the island of Hispaniola, 33.91%, 32.09%, and 34% of farming households were classified as very vulnerable, vulnerable, and less vulnerable. In Haiti, these proportions were 36.74%, 36.51%, and 26.75%, while in the Dominican Republic, they were 20%, 20%, and 60%. Agricultural households with highly accessible credit (OR = 0.16, p < 0.001) and university education (OR = 0.05, p < 0.001) were relatively less vulnerable to climate change impacts compared to their counterparts.

1. Introduction

Climate has a considerable influence on agriculture, as this human activity is highly dependent on climatic variations [1,2]. The Intergovernmental Panel on Climate Change (IPCC), established in 1988 in response to widespread man-made greenhouse gas emissions, has warned that the agricultural sector will be particularly affected by climate change due to its intrinsic vulnerability [3]. The negative effects of climate change have different repercussions on agricultural production in many regions of the globe. These repercussions have significant socio-economic consequences on farm households in developing countries located in tropical latitudes [1,4,5].
On the island of Hispaniola, which includes Haiti and the Dominican Republic, as well as on the other islands in the Caribbean, the increased frequency and intensity of extreme weather phenomena such as drought, cyclones, and floods is already significantly affecting a vast number of territories and agricultural production basins [6,7,8]. This island was one of the territories most vulnerable to climate risks between 2000 and 2019 [9], and the agricultural sector is strongly impacted by these phenomena [8]. These changes have had a significant negative impact on farming practices, threatening the way of life and livelihoods of already vulnerable farming households [2,10]. The causes of this vulnerability are multidimensional [11,12]. Moreover, when individuals have limited access to the institutions and policies that govern their access to resources, they have few means of addressing the underlying causes of their vulnerability [13]. To date, the vulnerability of agricultural households on the Caribbean island of Hispaniola has not been assessed with multidimensional indicators. In this context, the present paper aims to fill this gap by assessing the level of vulnerability to climate change within a sample of farming households from both parts of the island. We know that agricultural households are becoming more and more vulnerable to climate change. This vulnerability, according to the literature, can be explained by social, economic, and biophysical dimensions [2,10,11,12,13]. These three dimensions can explain the vulnerability of farming households on the Caribbean island of Hispaniola. In this context, it is assumed that the higher a farming household’s level of dependency on natural and socio-economic resources is, the greater its vulnerability to climate change is. Given that, almost all farming households on the Caribbean island of Hispaniola depend directly on agricultural activities that are likely to change under the impact of climate change. We tested this hypothesis in our study region. In addition, we calculated a vulnerability index and related it to the potential factors determining this vulnerability, corresponding to the hypothesis we posed. This study has crucial importance in guiding policies and interventions aimed at strengthening the resilience of farm households to the challenges of climate change in this already highly fragile region of the world. The remainder of this article is organized as follows: Section 2 presents a review of the literature on vulnerability to climate change, measurement methods, and the main drivers of vulnerability. Section 3 presents the data and methodology of the research, including the construction of the vulnerability index of agricultural households. Section 4 presents the results, Section 5 presents the discussion, and Section 6 presents the conclusions and policy recommendations.

2. Literature Review

2.1. Conceptualizing Vulnerability to Climate Change

The term vulnerability is used differentially in different disciplines and contexts, ranging from medicine to poverty and development [14]. In studies on global environmental change, the concept of vulnerability is often derived from the social sciences [15,16,17]. In research on vulnerability, adaptation, and policy, Chambers [18] introduced the concept that vulnerability has two faces: an external face consisting of the risks, shocks, and stresses to which an individual or household is subjected, and an internal face which is powerlessness, meaning a lack of means to cope without damaging loss. Adger [19] also identified two components of vulnerability: the effects an event can have on humans (called adaptive capacity or social vulnerability) and the risk of such an event occurring (called exposure). In addition, Bohle [20] developed a conceptual framework for vulnerability called the double vulnerability structure, which includes exposure and adaptation. Here, the external perspective refers primarily to the structural dimensions of vulnerability and risk, while the internal dimension of vulnerability focuses on adaptation and the measures taken to overcome or at least mitigate the negative effects of economic and ecological changes [21]. The Second Assessment Report of the Intergovernmental Panel on Climate Change (IPCC) [22] and Moser [23] shifted the focus of vulnerability from internal/adaptation to external/exposure and examined two similar but different factors: sensitivity and adaptive capacity (or resilience). In this report, the IPCC defines vulnerability as the extent to which climate change can damage or harm a system; vulnerability, therefore, depends not only on the sensitivity of the system but also on its ability to adapt to new climatic conditions [12,24]. According to Moser [23], any definition of vulnerability requires the identification of two components: sensitivity and resilience. Sensitivity refers to the responsiveness of a system to climatic influences and the extent to which this responsiveness could be affected by climate change. The IPCC’s Third Assessment Report reconciles the two sides by adding a third component to vulnerability, defining it as “The degree to which a system is susceptible to or unable to cope with, adverse effects of climate change, including climate variability and extremes”. Vulnerability is a function of the nature, magnitude, and rate of climate change to which a system is exposed, its sensitivity, and its adaptive capacity [25]. According to this definition, vulnerability comprises an external dimension represented by a system’s exposure to climatic variations, as well as a more complex internal dimension including its sensitivity and adaptive capacity to stress factors [26]. The IPCC’s Fourth Assessment Report, which reports on recent progress in our understanding of climate change, contains a definition of vulnerability consistent with that of the Third Assessment Report [27]. In this framework, a highly vulnerable system would be highly sensitive to modest climate changes, where sensitivity includes the potential for significant adverse effects and for which adaptive capacity is severely limited. Other authors have also characterized vulnerability using these three dimensions. For example, Luers et al. [28] proposed a method for quantifying vulnerability based on its three components: exposure, sensitivity, and adaptive capacity. On the other hand, the 5th and 6th IPCC reports also redefine vulnerability. Vulnerability is seen as the propensity of a system or population to suffer the adverse effects of climate change, depending on exposure to climate risks and the sensitivity of the system. Vulnerability is seen as a key element in the risk equation: Risk = Hazard × Exposure × Vulnerability [3]. This redefinition allows for vulnerability to be understood not in isolation, but as an integral part of the overall risk associated with climate change. In this context, vulnerability is a function of just two elements: sensitivity and adaptive capacity [3]. Turner et al. [29] recognized that vulnerability is not determined solely by exposure to hazards (disturbances and stress) but also depends on the sensitivity and resilience of the system subjected to such hazards. To date, the scientific community has so far conceptualized vulnerability differently depending on the disciplines, objectives to be achieved, and methodologies employed [4,14,30,31,32,33,34,35,36]. These differences limit the possibility of a standardized definition and methodological approach to assessing vulnerability. There is little consensus in the literature beyond the fact that there are multiple conceptualizations of vulnerability and that it is context-specific [4,37,38,39]. For example, in a comprehensive study, Nelson et al. [40] defined vulnerability as the susceptibility of a system to disturbance, determined by exposure to disturbance, sensitivity to disturbance, and adaptive capacity. In line with this definition, it is widely accepted that the vulnerability of human-environment systems to climate risks depends on their relative exposure to climate variability and change, their sensitivity to exposure, and their adaptive capacity. Similarly, several authors, in their research work, consider the vulnerability of any system in terms of these three components [13,36,41,42,43,44,45]. In this context, vulnerability is a function of just two elements: sensitivity and adaptive capacity. Thus, for the purposes of this study, vulnerability is seen as a function of three elements: exposure, sensitivity, and adaptive capacity, which are influenced by a range of biophysical and socio-economic factors. For this reason, we retain the classic definition of vulnerability (that of the 4th report) and retain exposure in order to contextualize and refine vulnerability. In the following section, we review the three main conceptual approaches. These are the socio-economic approach, the biophysical approach, and the integrated approach.

2.1.1. Socio-Economic Approach

The socioeconomic vulnerability assessment approach focuses primarily on the social, economic, and political aspects of society [13,31,44,46,47,48]. In this approach, vulnerability is essentially examined in terms of socioeconomic variables such as education, gender, wealth, health status, access to credit, access to information and technology, etc., which are responsible for variations in levels of vulnerability [49]. In this context, vulnerability is seen as an initial state or starting point (i.e., a variable describing the internal state of a system) that exists in a system before facing a hazardous event [34]. Thus, vulnerability is constructed by society in response to institutional and economic changes [34,50]. In general, the socioeconomic approach focuses on identifying the adaptive capacity of individuals or communities based on their internal characteristics. However, its main limitation lies in its focus solely on variations within society (i.e., differences between individuals or social groups). In reality, societies vary not only due to socio-political factors but also due to environmental factors. Thus, two social groups with similar socioeconomic characteristics but different environmental attributes may present different levels of vulnerability and vice versa [45]. Overall, this approach neglects—or considers as exogenous—the environment-related intensities, frequencies, and probabilities of environmental shocks such as drought and floods. It also does not take into account the availability of natural resources to mitigate the negative impacts of these environmental shocks. For example, areas with easily accessible groundwater can better cope with drought by using this resource [34].

2.1.2. Biophysical Approach (Impact Assessment)

The biophysical approach is used to study the physical damage caused by climate change [27,42,51,52]. As cited by Gutu et al. [49], this method is sometimes known as impact assessment. For example, the monetary impact of climate change on agriculture can be measured by modeling the relationships between climate variables (temperature, rainfall, etc.) and farm income [34,53,54,55] or by modeling the relationships between crop yields and climate variables [34,56,57,58]. These impacts are most often estimated on the basis of climate forecasts or sensitivity indicators [51,59,60]. Kelly and Adger [50] described the biophysical approach as the final analysis answering research questions such as “How big is the climate change problem?” and “Do the costs of climate change exceed the costs of greenhouse gas mitigation?” Although the biophysical approach is highly instructive, it does have its limitations [33]. The main limitation is that it focuses primarily on physical damages such as yield, income, etc. [34]. For example, a 50% reduction in yield due to climate change does not have the same effect on poor households as on large ones. It does not take into account the adaptive capacity of individuals or social groups. Farming households are very often unable to cope with marginal changes in their yields or incomes, whereas better-off households can cushion their losses (smooth consumption, in technical terms) by relying on savings or the sale of some of their assets.

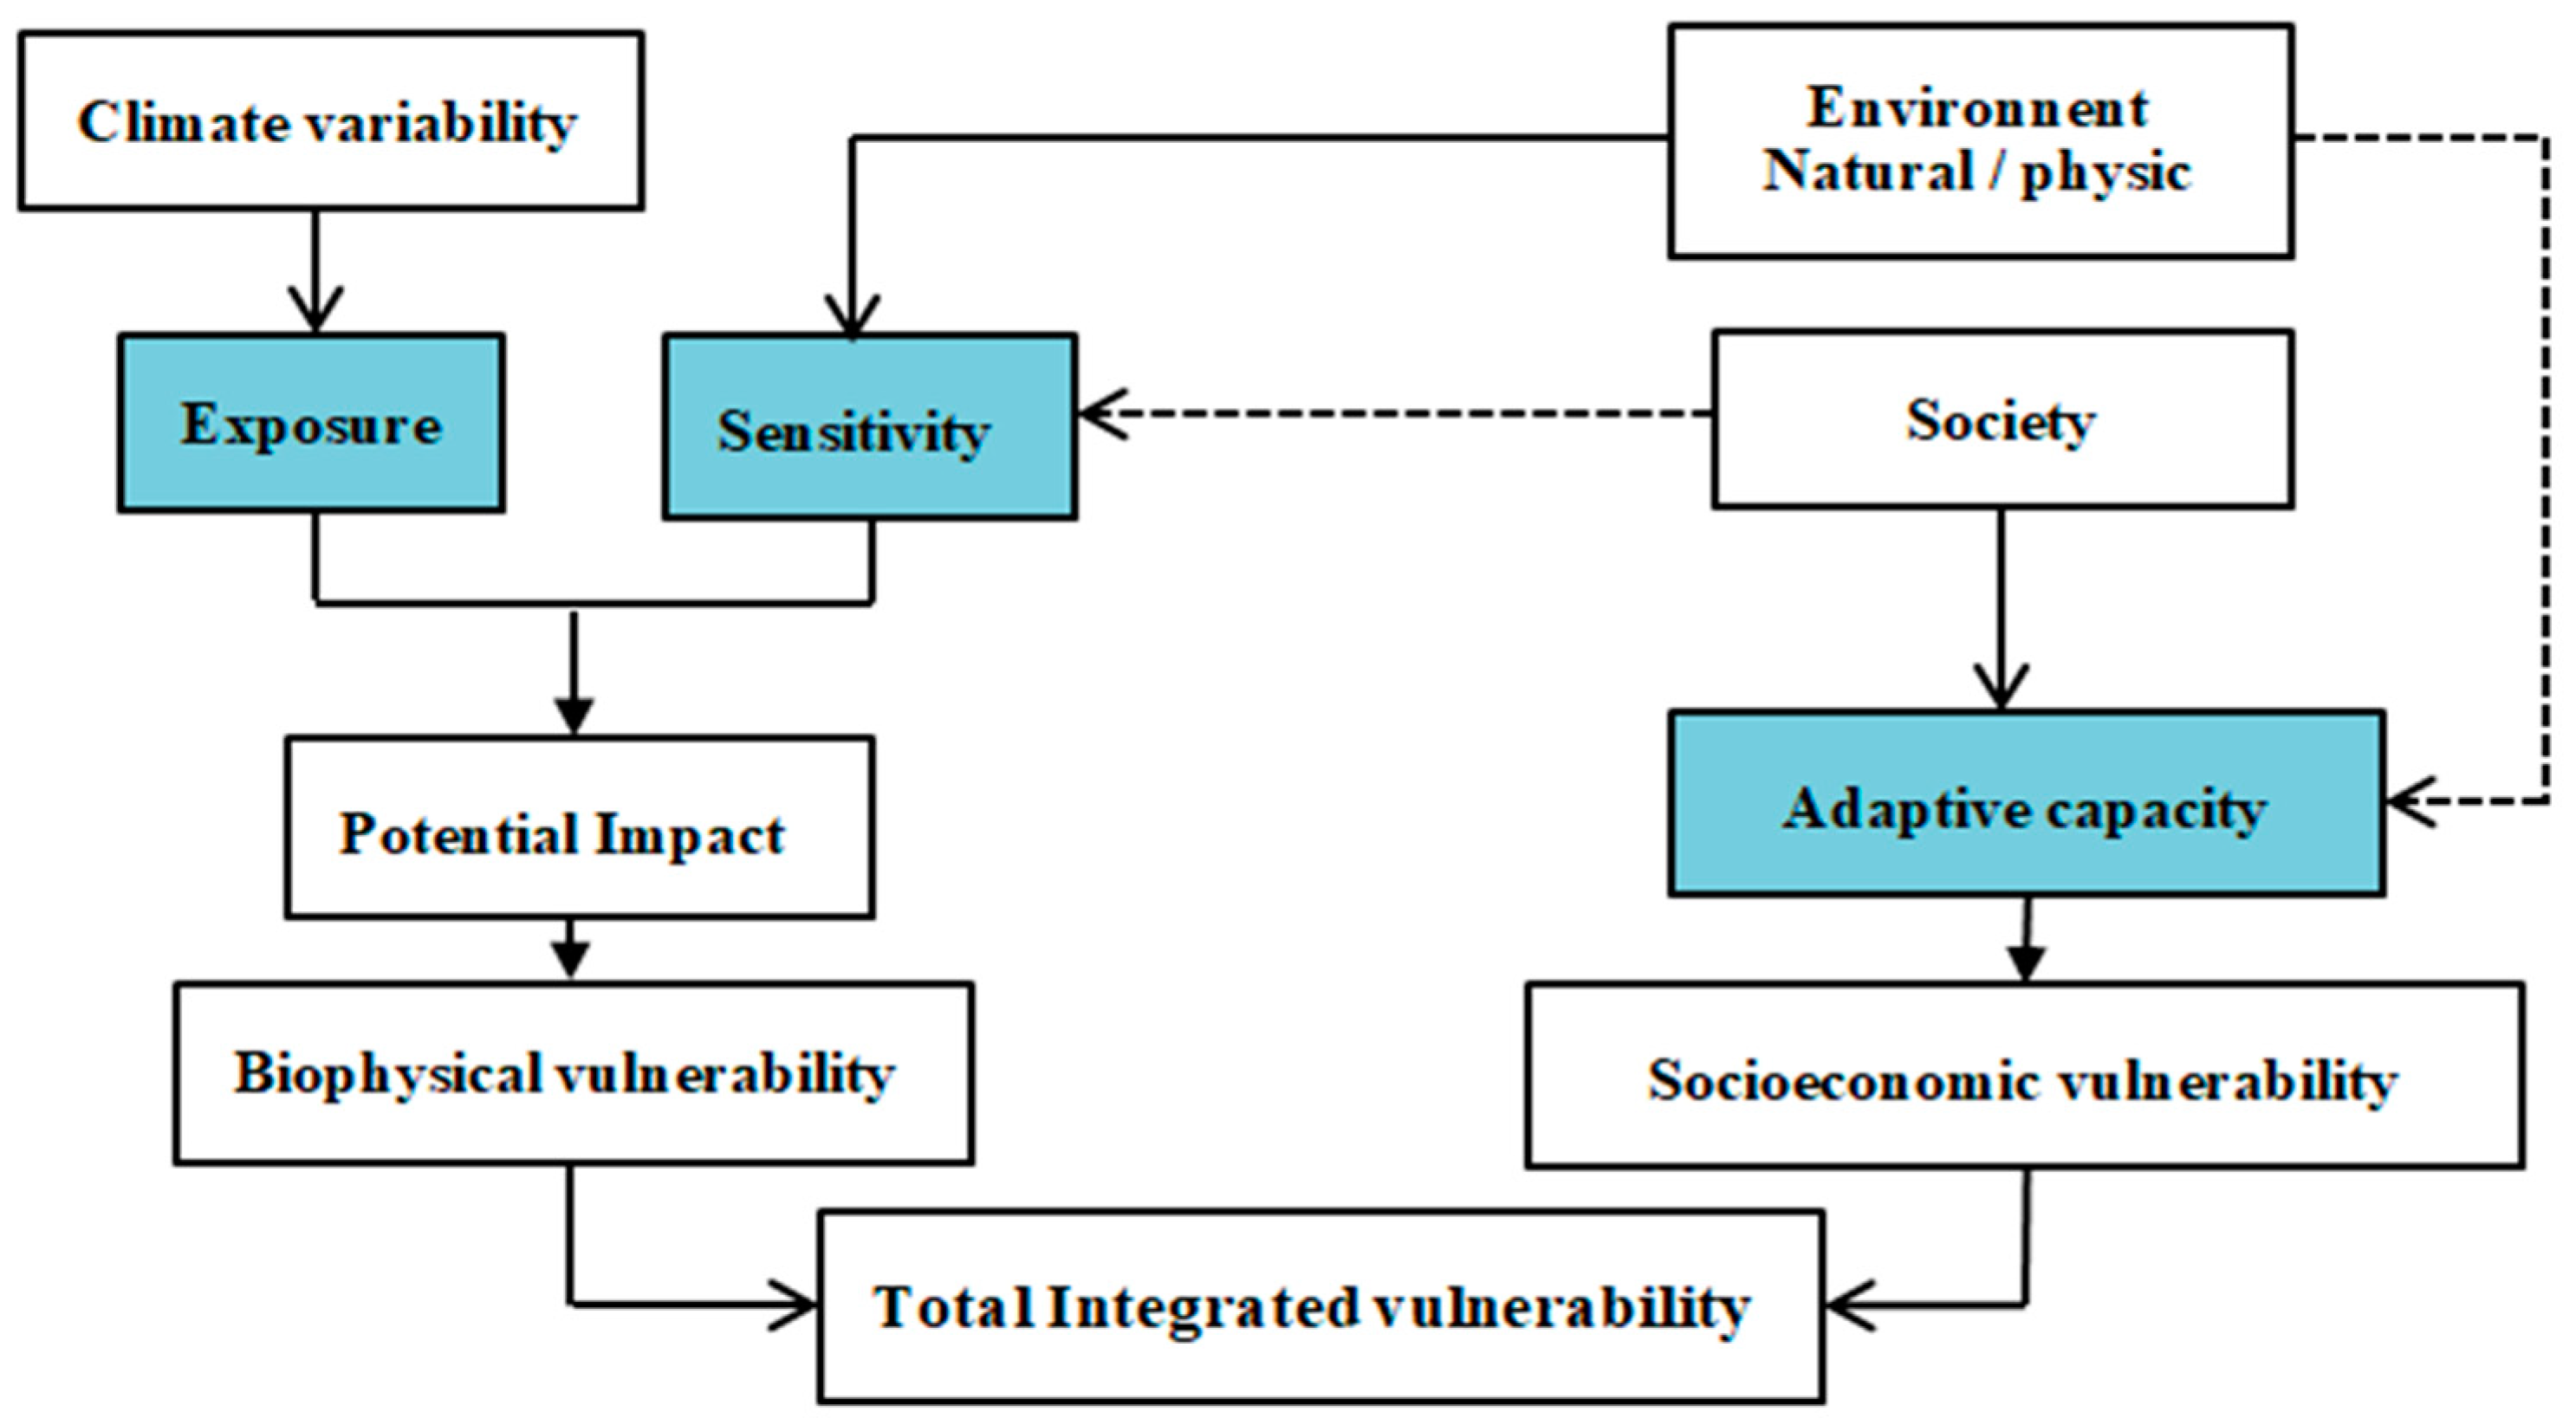
2.1.3. Integrated Approach

The integrated assessment approach combines socioeconomic (adaptive capacity) and biophysical (exposure and sensitivity) approaches to determine vulnerability [12,14,21,26,33,34,36,61,62]. The vulnerability mapping approach [34] is another related example, in which socioeconomic and biophysical factors are combined to indicate the level of vulnerability through mapping. Füssel [33] and Füssel and Klein [26] argued that the IPCC’s [25] definition, which conceptualizes climate vulnerability in terms of adaptive capacity, sensitivity, and exposure, fits the integrated approach to vulnerability analysis. According to Füssel and Klein [26], the risk-hazard framework (biophysical approach) corresponds best to sensitivity. Adaptive capacity (broader social development) is largely consistent with the socioeconomic approach [33]. Moreover, Nelson et al. [40] demonstrated that the use of biophysical modeling alone, without integrating socio-economic determinants (adaptive capacity), leads to totally erroneous results, thus sending the wrong message to political decision-makers. Although the integrated assessment approach corrects the weaknesses of other approaches, it also has certain limitations. The main limitation is that there is no standard method for combining biophysical and socioeconomic indicators [34,45,49]. This approach uses different datasets, ranging from socioeconomic datasets (e.g., race and age structure of households) to biophysical factors (e.g., earthquake frequency); these datasets certainly have different, and as yet unknown, weights. Cutter, Mitchell, and Scott [51] explained that because this analysis provides no common measure for determining the relative importance of social and biophysical vulnerability, nor for determining the relative importance of each individual variable, great caution is called for. The other weakness of this approach is that it does not account for the dynamism of vulnerability. For example, adaptation is characterized by a continuous change of strategies to take advantage of opportunities [63,64,65]; thus, this dynamism is lacking in the integrated assessment approach. Despite its weaknesses, this approach has much to offer in terms of policy decisions [12]. Thus, we adopted this approach to assess the vulnerability of farming households on the island of Hispaniola.

2.2. Methods for Measuring Vulnerability to Climate Change

On the basis of the approaches discussed above, there are numerous methods for measuring vulnerability to climate change. Interdisciplinary research on vulnerability generally advocates two main approaches. These are econometric approaches and indicator-based multi-criteria approaches [4,34,36,44,49]. Thus, these two measurement methods are discussed below.

2.2.1. Econometric Method

The econometric method has its roots in the literature on poverty and development [36]. It is based on the reconstitution of an econometric model for a given system (household, region, country, etc.) and makes it possible to assess the expected or observed effects of a climate change-related issue [45]. This method uses household-level socio-economic survey data to analyze the level of vulnerability of different social groups [34,36]. It is divided into three main categories: vulnerability as expected poverty (VEP) [66], vulnerability as expected low utility (VEU) [67], and vulnerability as uninsured expression to risk (VER) [68]. Thus, we present in Table 1 some examples of econometric methods for assessing vulnerability.

2.2.2. Indicator Method

The indicator method is based on the selection of certain potential indicators to indicate levels of vulnerability [4]. This indicator-based method is suitable for vulnerability assessments since vulnerability is a theoretical phenomenon that cannot be measured directly like observable phenomena [4]. Indicators are used to operationalize theoretical concepts through latent variables that serve as operational representations of a system’s characteristics, qualities, or properties [4,69,70,71]. This method enables vulnerability to be quantified by systematically combining the various indicators selected [4,34,46,48,62,72,73]. We speak of a multi-criteria approach insofar as the different dimensions of vulnerability can be synthesized through the indicators and variables that are mobilized [45]. Typically, a quantitative vulnerability assessment based on multi-criteria indicators involves several steps: defining the objective, context, and conceptual framework of the study; indicator selection; data collection and management; indicator aggregation; and presentation of results [4,66]. When conceptualizing vulnerability, exposure, sensitivity, and adaptive capacity are made explicit. Researchers use indicators to represent these key aspects that define the vulnerability of a given system [4]. These three aspects are often combined in a multi-criteria composite index because of their ability to capture multiple dimensions of vulnerability [4,31,66,67,74,75,76,77]. However, despite the feasibility of using indicators to assess vulnerability, this approach is subject to numerous pitfalls and has attracted much criticism [64,67,77,78]. For example, Birkmann [75] highlights the shortcomings of up-scaling and down-scaling indicators due to the challenges of contextualizing indicators and approaches in different contexts and scales. Other challenges and uncertainties are related to the selection of indicators [78,79], uncertainty about the robustness of the validity of indicators and conceptual frameworks [64,71], the accuracy and accessibility of data [71], the aggregation and weighting of indicators [64,80], and the lack of transparency in methodology and assumptions [4,64]. Despite the challenges posed by indicator-based methods, they provide valuable tools to enable the assessment of the causes of vulnerability and ways to reduce it [4,13,31,34,45,70,76,80]. Thus, we adopted the indicator method to develop and calculate a vulnerability index to assess the vulnerability of farming households on the Caribbean island of Hispaniola to climate change and its main drivers.

2.3. Factors Influencing Vulnerability

Vulnerability is essentially context-dependent, and the factors that make a system vulnerable to a hazard depend on the nature of the system and the type of hazard in question [30]. The factors that make farming households in the Caribbean region vulnerable to drought, for example [8], will not be identical to those that make areas of a wealthy industrialized country like Norway vulnerable to floods, windstorms, and other extreme weather events. Isolation and income diversity could be important determinants of drought vulnerability for farming households in the Caribbean region, while the drivers of storm and flood vulnerability in Norway could be the quality of physical infrastructure and the effectiveness of land-use planning [30]. Several studies provide interesting classifications of vulnerability factors [27,45,66,81]. By way of example, we can cite the following classifications. The United Nations [81] distinguished four groups of factors that influence vulnerability: physical factors, which describe the exposure of vulnerable elements in a region; economic factors, which describe the economic resources of individuals, population groups, and communities; social factors, which describe the non-economic factors that determine the well-being of individuals, population groups, and communities, such as levels of education, security, access to basic human rights, and good governance; and environmental factors, which describe the state of the environment in a region. Nevertheless, certain factors are likely to influence vulnerability to a wide variety of hazards in different geographical and socio-political contexts. These include development factors such as poverty, health status, economic inequality, and elements of governance, to name but a few [31,33,44,46,47,48]. These factors can be called generic determinants of vulnerability, as opposed to specific determinants relevant to a particular context and a particular type of risk, such as the price of a particular food crop [30]. Although there are some variations in the relative importance of the different generic factors, they can be seen as the foundation on which specific measures to reduce vulnerability and facilitate adaptation are built. The concept of generic, as opposed to hazard- and context-specific, vulnerability determinants is useful if we wish to undertake comparative vulnerability assessments at the national level. Generic vulnerability assessments can tell us how well equipped a country is to cope with and adapt to climate change. However, the aim of the study presented here was not to assess “generic” vulnerability but rather to identify the key factors influencing a specific level of vulnerability based on individual farm household data.

3. Materials and Methods
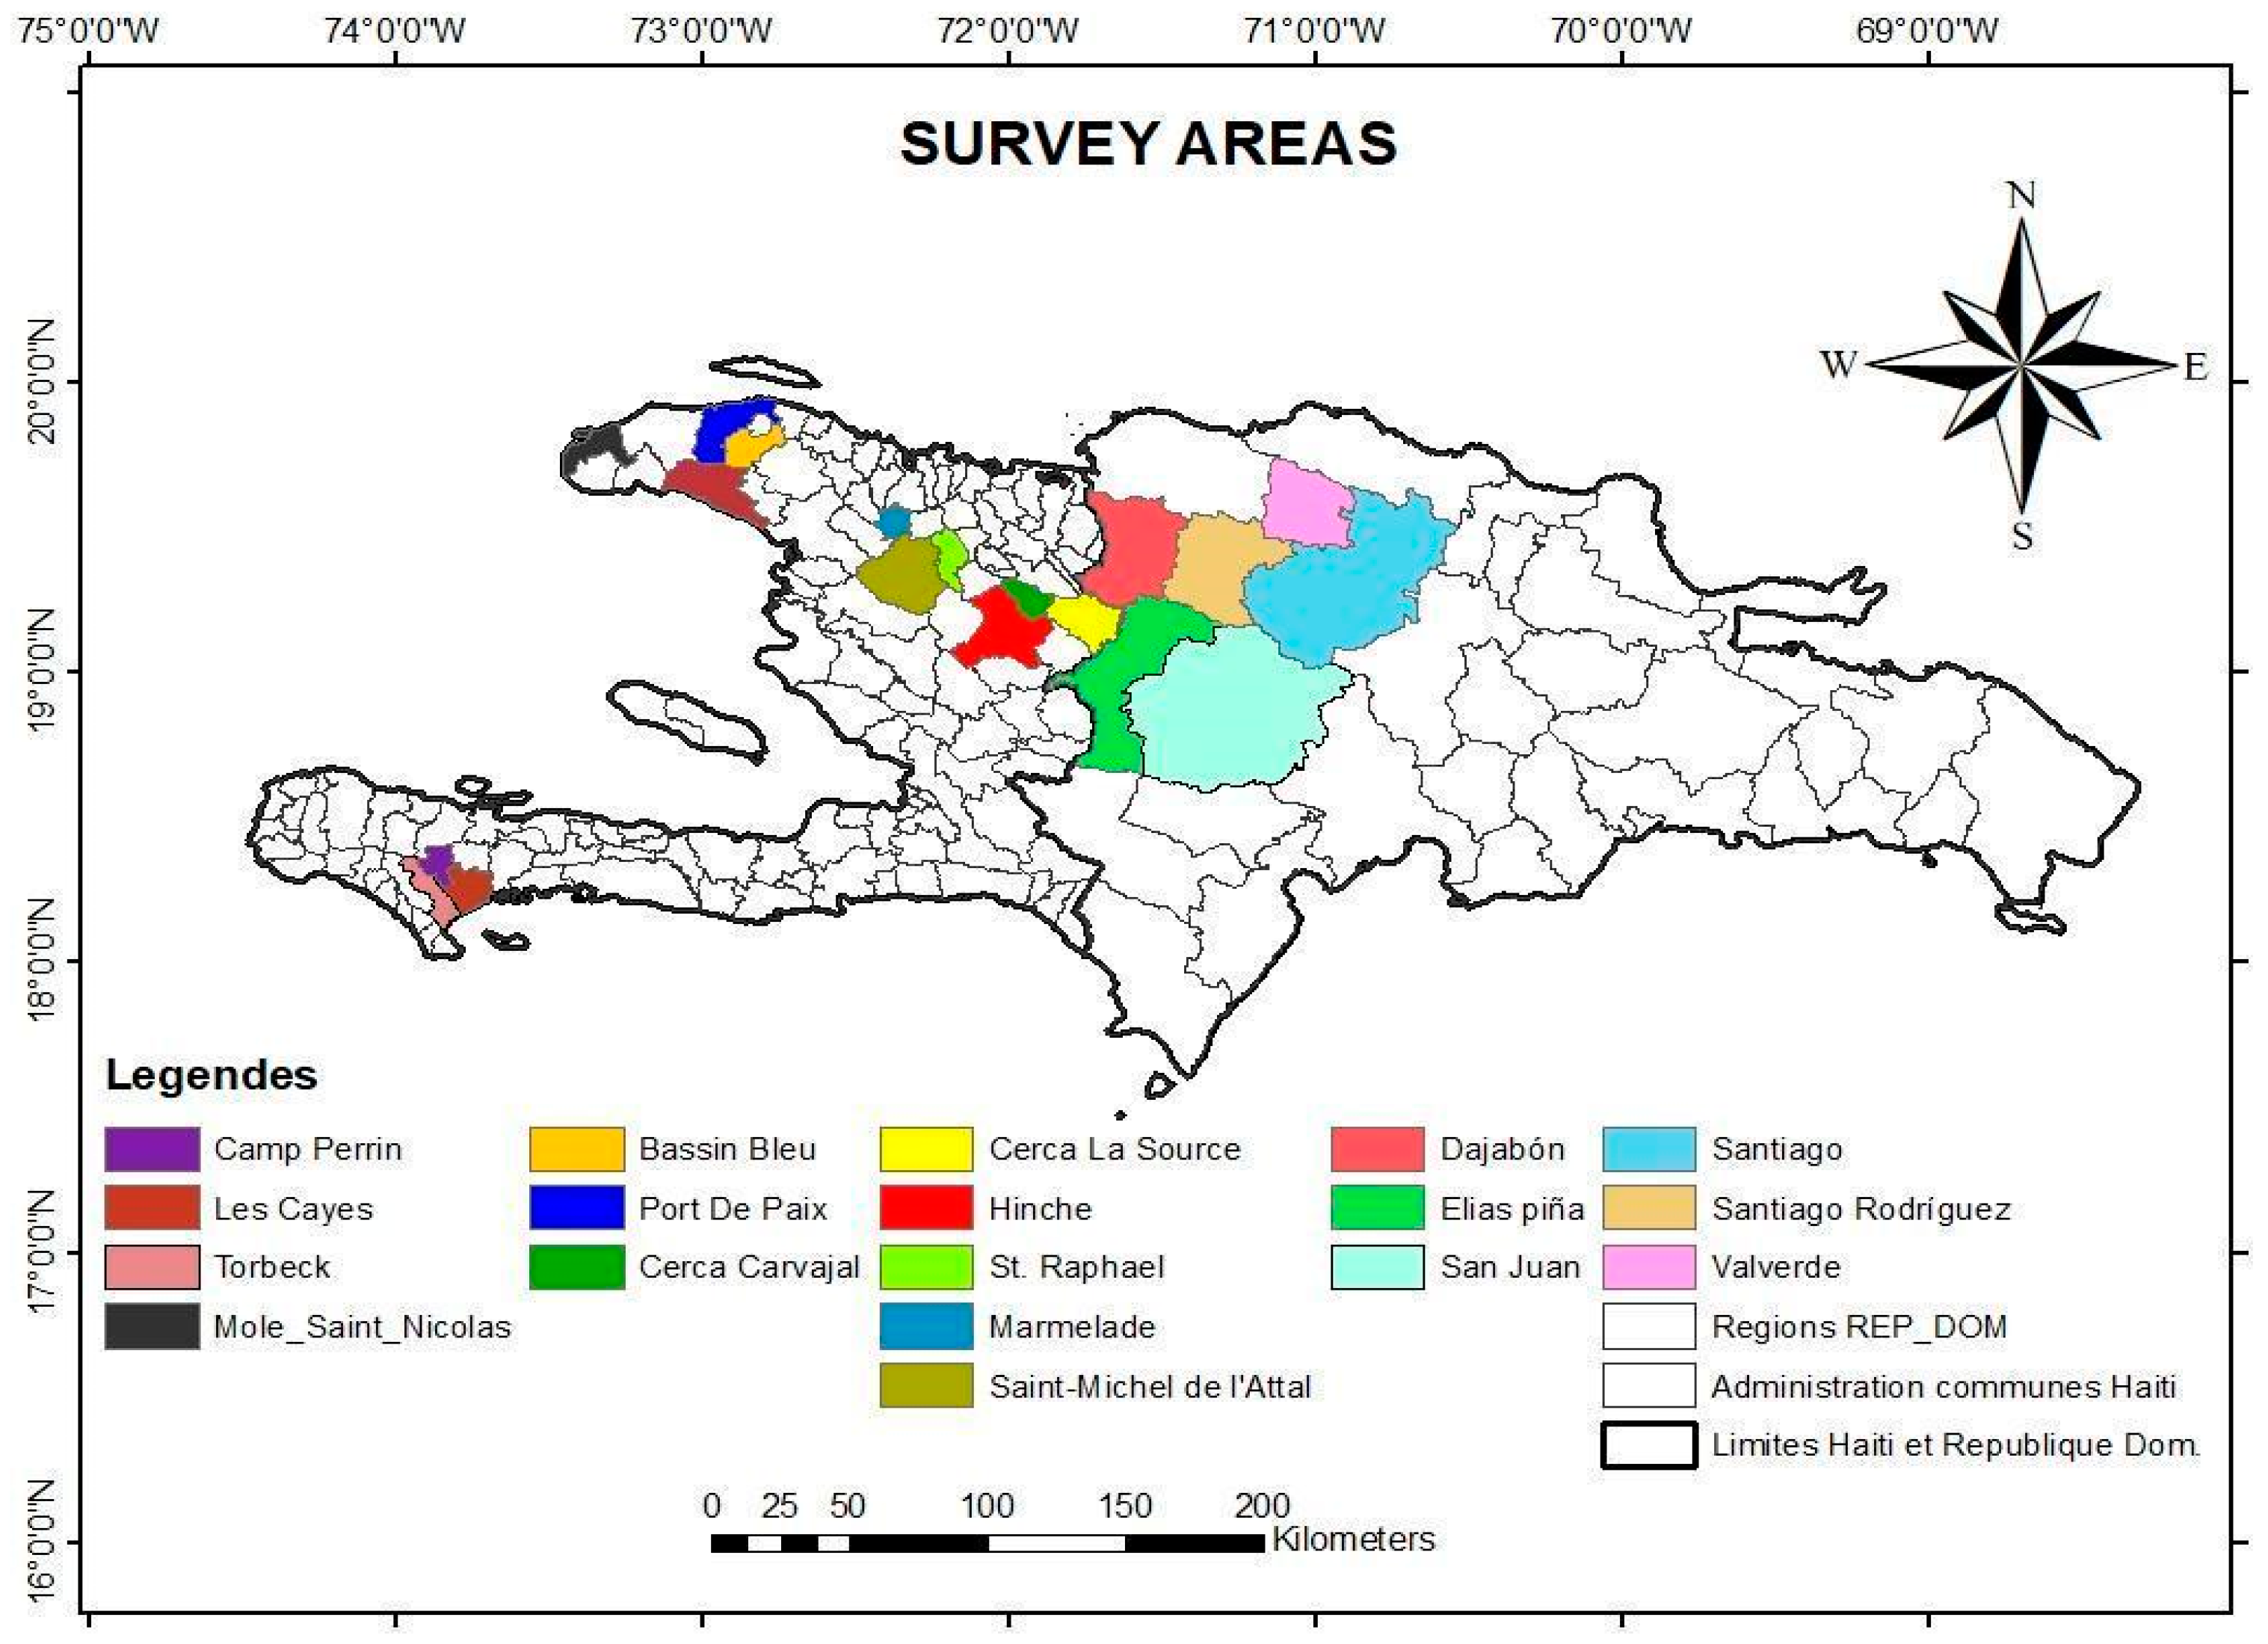
3.1. Study Areas

Located in the north of the Caribbean region, Hispaniola (17.6°–20.0° N and 68.3°–74.5° W) is an island divided into two sovereign and independent states: the Dominican Republic to the east, and the Republic of Haiti to the west (Figure 1). The island is part of the Greater Antilles group of the Caribbean archipelago, with a surface area of 76,480 km2, making it the second-largest and most populous island in the Caribbean, with over 21 million inhabitants [8]. The Dominican Republic occupies two-thirds of the eastern part of the island, covering an area of 48,310.97 km2 (excluding maritime territory), while Haiti, itself more mountainous, covers an area of 27,750 km2 [82]. As in many Caribbean islands, the annual rainfall cycle has two peaks (April–May and August–October) and a minimum (November–March). Between June and July, there is a period of relatively lower rainfall, with a mid-summer drought observed in the Caribbean [8].
The choice of Hispaniola Island in the Caribbean region is justified by the fact that the two countries that share this same island territory, Haiti and the Dominican Republic, are increasingly being affected by extreme weather events [8,82] and suffer the consequences differently in terms of their agriculture [6]. This makes it the Caribbean island most vulnerable to the impacts of climate change [84]. In addition, agro-ecological sectors that constitute genuine agricultural basins undergoing change, such as the Cibao in the Dominican Republic (Santiago, Valverde, Santiago Rodriguez, etc.), are among the most fertile and productive regions on the island. On the Haitian side, areas such as the Cayes plain, Artibonite, and the arid north-west have not yet been studied in-depth. Given the size of the island of Hispaniola, it was deemed useful to limit our field of study to 18 communes/provinces (Table 2). These 18 areas reflect the 16 agro-ecological areas, ranging from dry or irrigated plains to humid mountains, of the two parts of the island of Hispaniola.
These 18 areas offer a privileged setting for this study, as the main impacts of climate variability on the agricultural sector are manifested in these regions.

3.2. Data Collection

Surveys were carried out between June and October 2023 in 18 communes and provinces among 550 heads of households (made up of men and women). In each commune, 30 heads of agricultural households in Haiti (except in the communes of Hinche and Cerca-la-Source, where we surveyed 40 heads of household) and 20 heads of agricultural households per province in the Dominican Republic were selected, following an aerial sampling from a list of people meeting the criteria defined below. This number is based on studies by Ouédraogo et al. [86] in Burkina Faso (30 farms per department), Kabore et al. [87] in north-central Burkina Faso, and Arun and Yeo [88] in Nepal (the same number per district). The selection of heads of farming households on the island of Hispaniola was carried out with the assistance of agricultural officers and local stakeholders. Two selection criteria were used: a minimum age of 35 and a minimum experience of 15 years. This selection was necessary to ensure that the households interviewed had sufficient experience to understand climate change and its impact on agricultural production. The selected households answered an individual questionnaire comprising 80 closed and open-ended questions during face-to-face interviews in the local language (Spanish in the Dominican Republic and Creole in Haiti) between the 15 interviewers (10 graduating students in agronomic sciences, 3 agricultural technicians, and 2 agricultural engineers) and the 550 respondents. Data was collected using the ODK Collect v. 2023.2.3 application and recorded on the Kobotoolbox server, following an identical protocol. Each interview lasted between 50 and 60 min. The survey focused on household characterization, level of education, household size, ancestral knowledge of weather and climate forecasting, access to social networks, access to credit, off-farm income, farm size, number of livestock, marketing circuit, as well as climatic and telluric hazards and level of perception (of rainfall and temperatures). In addition, relevant secondary data on the agroecological characteristics of each commune/province were obtained from the Ministry of Agriculture, Natural Resources and the Environment (MARNDR) (https://agriculture.gouv.ht/statistiques_agricoles/, accessed on 2 October 2023) and the Haitian Innovation Center for Biotechnology and Sustainable Agriculture (CHIBAS) (https://uniq.edu.ht/chibas/presentation/, accessed on 15 July 2023). Table 2 describes the 23 variables selected for the development of a vulnerability index.

3.3. Development of an Individual Vulnerability Index for Agricultural Households

This study aimed to assess the individual vulnerability of farming households on the Caribbean island of Hispaniola to the impacts of climate change using the integrated approach through a vulnerability index. As indicated in the literature review, the use of indices is faced with numerous ambiguities, including those related to the choice of the right indicators, the directions of relationships with vulnerability, the weights assigned, and the optimal scale [4,44,64,70,71,77,78,80,89,90]. To minimize these ambiguities, we chose a scale of analysis that reflects the reality of farming households on the island of Hispaniola. As Deressa et al. [34] and Gutu et al. [49] pointed out, vulnerability analysis can be conducted at different scales, ranging from the local or household [46,91], national [62], and regional [80,92] to the global [4,30,71]. The choice of analysis scale is dictated by research objectives, methodologies used, and data availability [4,13,66]. For this study, the scale of analysis was set at the farm household level. Indeed, most previous studies using aggregated data at regional, national, and district levels have neglected variations at the individual level. However, this approach is crucial for assessing the vulnerability of farm households living in small island states such as the Caribbean island of Hispaniola, which comprises around 16 agro-ecological zones. In our study, the direction of the relationship in the vulnerability indicators (i.e., their sign) was determined by following the procedure used by Deressa et al. [34] and Neset et al. [4], who assigned a negative value to exposure and sensitivity and a positive value to adaptive capacity and then calculated the vulnerability indicator accordingly. Thus, we chose indicators that reflect the socio-economic and biophysical characteristics of farming households on the Caribbean island of Hispaniola.

3.3.1. Choice of Variables for the Vulnerability Assessment of Farming Households

Vulnerability to climate change is a complex and multidimensional topic influenced by many interconnected factors [12,44]. Although many variables representing this vulnerability are not directly measurable, the creation of an index can be useful for comparing similar systems and for helping policymakers understand the underlying processes and determinants of vulnerability. The construction of such an index involves several steps. First, it is necessary to select the relevant variables and indicators. Next, weights are assigned to these indicators, and finally, they are aggregated to form an overall index. Indicators and indices provide a simplified representation of a complex reality, but the methodology used to select them is crucial, as inappropriate indicators could compromise the validity of the index. The choice of indicators is limited by the abstract nature of vulnerability itself [12]. Two main approaches are used to select these indicators: the data-driven approach and the theory-driven approach [81]. Ideally, theories provide a framework for understanding the nature and causes of vulnerability, but they are also limited by data availability. Thus, the best approach is to combine the two, checking the representativeness of theoretically based indicators with data from reliable sources [44] and taking into account local knowledge from group discussions [12]. In this study, a balanced combination of theoretical and data-driven approaches was used for variable choice and indicator selection, adopting the definition of the concept of vulnerability as a function of exposure, sensitivity, and adaptive capacity [13,25,27,36,42,44,54,93,94,95]. Figure 2 shows the various components of this integrated vulnerability.
Thus, the indicators for each vulnerability sub-sector, i.e., exposure, sensitivity, and adaptive capacity, are presented in Table 2 and discussed as follows:

Adaptive Capacity (AC)

Adaptive capacity is defined as the ability of a system to modify or change its characteristics or behavior in order to better cope with existing or anticipated external factors [4,92]. In most works on vulnerability, adaptive capacity is generally considered as a set of factors determining a system’s ability to design and implement adaptive measures [14,27,36,44,45]. Key characteristics determining the adaptive capacity of a community or region include economic wealth, technology, information, skills, infrastructure, institutions, and equity [24,93,94,95,96,97,98]. For this study, the choice of adaptive capacity variables was made based on previous studies and expert opinions (Table 3). Ultimately, 15 variables (6 social and 9 economic) were used for this study.

Exposure

Exposure is defined as the presence of people, livelihoods, species or ecosystems, environmental resources or services, infrastructure elements or economic, and social or cultural assets in a place or context susceptible to damage [98]. Of all the elements that contribute to vulnerability, exposure is the only one that is directly linked to climatic parameters [45]. In much of the literature on vulnerability [44,62,99], exposure is conceptualized in terms of climate variability (e.g., temperature increase, precipitation variability, and change) or any event likely to occur and damage a given system. It is generally accepted that increasing temperature and decreasing rainfall are both detrimental to agriculture on the already hot and water-poor Caribbean island of Hispaniola [6,8,83]. Since data on future climate probabilities are not available in Haiti (only climate data from East-CRU University in the UK, but the 50 km × 50 km resolution is too large), we were forced to make a very simple assumption. Thus, we hypothesized that households who perceive their farms as being subject to high temperature variability and rainfall variability and change are more exposed. Two variables were, therefore, selected for this study: rainfall variability (VAP) and temperature variability (VAT) as perceived by farm households (Table 4).

Sensitivity

In the context of this study, sensitivity refers to the responsiveness of a system to climatic hazards. It also refers to human activities that influence the physical composition of a system, such as cultivation methods [34,45,93,99]. This notion is often represented in the form of a “dose-response” model: the more sensitive a system, the higher the rate or magnitude of a negative response to a given hazard [93]. Sensitivity can vary considerably from one system, sector, or population to another [46]. In their case study of Ethiopian agriculture, Deressa et al. [34] estimated that areas where climatic extremes (droughts and floods) are more frequent will be more sensitive due to yield loss and, hence, loss of livelihoods. O’Brien et al. [62] developed a climate sensitivity index based on climatic variables (drought, rainfall). Similarly, Maiti et al. [44] used rainfed area, number of marginal farms, agricultural productivity, etc., as sensitivity indicators. Zaatra [45] studied soil type, crop diversification, and varieties as sensitivity indicators. Overall, the authors consider sensitivity to be an intrinsic condition of a system that makes it particularly vulnerable. It translates into a propensity to be affected, favorably or unfavorably, by the manifestation of hazards. However, it was not possible to find this type of data reliably on the island of Hispaniola, more precisely in Haiti. In this context, we were forced to make a simple assumption for each sensitivity variable studied. In this context, we first asked farm households to recall how often, in the past, their livelihoods had been significantly affected by climate (drought, floods, cyclones). Thus, this study argues that farm households who feel that their farms are subject to higher frequencies of climate extremes (e.g., drought and floods, cyclones, etc.) are more vulnerable due to loss of agricultural yields and, thus, livelihoods [13,34,44,62,100]. Similarly, we assume that farming households located in areas prone to telluric hazards are more sensitive. This is justified by the fact that some communes in Haiti and the Dominican Republic have been hard hit by earthquakes, landslides, and rockslides in recent decades. In this context, we assume that in areas where earthquakes, landslides, or rockslides are more significant, farming households are more sensitive, as they can strongly affect household income, housing, health, etc. This will require expenditure that could be very high in the future. This will require expenditure that could be very costly and put the household in a difficult situation for the purchase of seeds, chemical fertilizers, labor, or pesticides, etc., which are important elements in finding yields. Finally, we used other variables such as crop diversification. We assumed that the more diversified the household farm, the less sensitive it is, due to the system’s ability to minimize the various risks associated with climate change. A total of six variables were taken into account to calculate the degree of sensitivity of the farming households studied. These were land-based hazards (AT), drought (SEC), flooding (INN), cyclone frequency (ALC), plot topography (PEN), altitude (ALT), and crop diversification (DIV) (Table 5).
In this study, we selected 23 variables to calculate the vulnerability index of each farm household on the island of Hispaniola.

3.4. Calculating the Vulnerability Index for Each Farm Household

Having selected the appropriate variables, it is now necessary to normalize them in order to bring the indicator values within a comparable range [12,21,40,44,80,101]. Indeed, in this study, the determining variables for each vulnerability component were calculated from the survey results by standardizing the quantitative variables using the min-max method and the qualitative variables by defining the three classes and intervals according to a standardized field from 0 to 1. The direction of variation for each variable increases from negative to positive ratings. In addition, for each of the 23 variables, each farm household was asked to rate on a scale of 0 to 10, based on their experience and knowledge, their opinion of the importance of each variable on their vulnerability and their operation. These responses on the 0 to 10 scale were then discretized into three categories: Very vulnerable, Vulnerable, Less vulnerable (see example in Table 6 for the experience variable).
Next, we assigned weights to these indicators. Indeed, some studies follow equal weighting [78,99], but this can be too arbitrary and lead to an overweighting of some less important indicators while underweighting the more important ones [12]. Weighting can also be based on expert judgment [78,79], but this approach is often criticized for being too subjective and is often limited by the availability of specialists in the field or by the lack of consensus [12,21]. Weight assignment by principal component analysis (PCA) is, therefore, preferred and frequently used in research over the previous two methods [12,21,34,40,44,102,103,104,105,106], but this procedure could not be applied in this study since the majority of variables were qualitative. As a result, the data transformed into categories were used to perform a Multiple Correspondence Analysis (MCA) to determine the weight of the 23 variables. The first two axes of the MCA were used as weights for the variables. These first two axes were used because they captured the highest percentage of the total variance in the data. Thus, weights were averaged across the 3 levels of each variable on the two axes. The MCA was run separately for the selected social and economic (Adaptive Capacity) and environmental (Sensitivity and Exposure) indicators in R software (4.3.2) to assign weights. The weights of the first component of the MCA are used as weights for the indicators. The weights assigned to each indicator range from −1 to +1, with the indicator sign indicating the direction of the relationship with other indicators used to construct the respective index. The magnitude of the weights describes the contribution of each indicator to the value of the index. A stepwise MCA was performed for the indicators. The first stage of the MCA was carried out separately for each farm household’s indicators in order to observe the relative importance of indicators within each category. From the weights obtained in the first step of the MCA, individual index values for each household were calculated. To calculate the final score for each farm household, we transformed (normalized) the categorical data into scores (0.185, 0.495, 0.83, respectively). These initial scores are equal to the average of the ranges of each of the 23 variables for the three categories (see example in Table 3). This method of using interval-averaged scores followed the principles that were applied in the calculation of the vulnerability index by Zaatra [45]. Thus, the final database was obtained by multiplying the standardized variables (initial score) of the level of each variable by its average weight on the first two dimensions of the MCA to construct the indices (social, economic, and environmental separately). Thus, to calculate the individual vulnerability index for farm households, we used the sum of the final scores of the social variables added to the sum of the final scores of the economic variables to form the adaptive capacity component. Similarly, the sum of the final scores of the exposure variables was summed to the sum of the final scores of the sensitivity variables to form the biophysical component of farm households.
V = ACB where, B = (S + E); then
V = AC − (S + E)
  • V is the vulnerability index;
  • AC is the adaptive capacity index (social and economic variable);
  • B is the biophysical index (E is exposure and S is sensitivity).
Next, to categorize the level of vulnerability of each farm household, we used the percentile-based classification method. Values below or equal to the 33rd percentile were categorized as very vulnerable, and those above the 33rd percentile and below or equal to the 66th percentile were categorized as vulnerable, and finally, those above the 66th percentile were categorized as less vulnerable. The overall vulnerability index made it easier to compare individual farm households between the two countries. A higher value of the vulnerability index indicates lower vulnerability.

3.5. Determinants of Vulnerability

Choices of Potential Determinants

In this study, we selected four potential factors to determine the vulnerability of farming households on the Caribbean island of Hispaniola. Four factors were chosen based on existing literature and their relevance in the context of vulnerability to climate change [12,13,19,21,34,45,50,54,61,72,76,81,91,92]. These include country, access to credit, level of education, and farm size. Country of origin (Haiti or Dominican Republic) was considered the main factor in this study to examine the impact of different national contexts. Furthermore, it is assumed that the vulnerability of farming households on the Caribbean island of Hispaniola can be explained by social, economic, and biophysical dimensions. In this context, we captured these dimensions using three variables: access to credit, farm size, and level of education. These variables, chosen as factors, were excluded from the calculation of the vulnerability index. The choice of these three variables was made taking into account their distribution and following the basic hypothesis of our study: the more a farm household depends on natural and socio-economic resources, the higher its vulnerability to climate change, as most farm households are directly dependent on agricultural activities, which are likely to be affected by climate change. We tested this hypothesis in our study region. Indeed, each of these factors was broken down into three modalities (or categories) defined on the basis of the literature [45,93] and expert opinion. In addition, we decided to weigh only access to credit and country in our analyses due to the uneven distribution of their observations. This weighting aims to better understand the complex dynamics between countries, credit access, and their joint impact on vulnerability. It also enables more balanced and representative analyses of the different sub-populations studied.

3.6. Statistical Modeling

In this study, we opted for an ordinal logistic regression model. The ordinal logit model is used when the outcome variable is categorized on an ordinal scale, as in the present case where our dependent variable, which is the level of vulnerability of farm households, is classified as follows: (1) very vulnerable, i.e., farm households for which the difference between adaptive capacity and sensitivity/exposure is less than or equal to the 33rd percentile; (2) vulnerable, i.e., farm households for which the difference between adaptive capacity and sensitivity/exposure is greater than the 33rd percentile and less than or equal to the 66th percentile; and (3) less vulnerable, i.e., farm households for which the difference between adaptive capacity and sensitivity/exposure is greater than the 66th percentile. This is a powerful model for modeling the probability of belonging to a category as a function of several explanatory variables. It is particularly useful for showing movement between these vulnerability classes, explaining who moves in and out of vulnerability. It takes into account the order of the categories and offers an intuitive interpretation of the effects of the variables through odds ratios.

4. Results

4.1. Description of the Vulnerability of Farming Households on the Island of Hispaniola

Preliminary analyses indicate that farming households on the Caribbean island of Hispaniola have different social, economic, and biophysical characteristics. In the next section, we describe the social, economic, and environmental vulnerability of farming households on the island of Hispaniola.

4.1.1. Social Vulnerability

The social vulnerability of farming households on the island of Hispaniola to climate change is linked to their low social profile. According to the results presented in Table 7, over 73.04% of agricultural households surveyed had not received any agricultural training. This lack of training reduces their ability to understand the constraints induced by climate change and to adopt new, improved technologies. Regarding household size, over 70.54% of respondents reported having four or more dependent family members. This high figure may indicate an increased level of vulnerability during certain periods of climate change-induced shocks (Table 7). Household participation in local institutions such as Tipa and mutual solidarity is an important measure of the level of household social capital. The more involved a household is in agricultural networks, the more likely it is to obtain support and access information. However, the survey reveals that some 57.27% of farming households are not members of agricultural organizations. This highlights a potential lack of support and access to information for these households, increasing their vulnerability to climate change.
In summary, the level of vulnerability of farming households on the Caribbean island of Hispaniola in terms of social capital is high.

4.1.2. Economic Vulnerability

Economic vulnerability focuses primarily on the economic status of individual farm households. The economic status of farming households on the Caribbean island of Hispaniola varies in terms of wealth, access to credit, technology, and so on. Most of these households are considered economically vulnerable to the effects of climate change. For example, a large majority of respondents (79.28%) have no access to credit, over 74.54% have limited off-farm sources of income, over 88.55% have no single-risk or multi-risk agricultural insurance, over 73.64% have small farms, and over 74.18% have no area of irrigated or irrigable land. These data indicate a high level of economic vulnerability among farm households (Table 7).

4.1.3. Environmental (Biophysical) Vulnerability

Small-scale farming households have faced many environmental challenges in recent years, particularly on the Caribbean island of Hispaniola, where most households are directly dependent on agricultural activities, making them vulnerable to climate change. Thus, variables measuring environmental vulnerability are major determinants of the vulnerability of agricultural households. The results presented in Table 7 highlight several environmental factors that contribute significantly to this vulnerability. For example, high rainfall variation was observed by over 77.09% of households, while over 77.63% noted temperature fluctuations and 62.54% were affected by drought. In addition, frequent soil degradation due to erosion, low levels of soil fertility, and the need to diversify crops are also important factors contributing to this environmental vulnerability.

4.2. Vulnerability of Farming Households to Climate Change

To analyze the vulnerability of each household, the variables presented in Table 3, Table 4 and Table 5 were used. Table A1 presents the results of the multiple correspondence analysis (MCA) and the factor scores for each level of vulnerability (see Table A1 in Appendix A). Indeed, the vulnerability index of each farm household is calculated using the formula in Equation (1), where percentiles are used as a method to classify each household according to their level of vulnerability: very vulnerable, vulnerable, and less vulnerable. According to the results of the vulnerability index, the majority of farming households in Haiti (73.25%) fall into the vulnerable and very vulnerable categories (Table 8). In contrast, only 40% of farm households in the Dominican Republic fall into these two categories. We, therefore, classify farm households according to the range of their vulnerability index.
Similarly, the results also indicate that 26.75% of farm households in Haiti belong to the least vulnerable category, while this figure rises to 60% in the Dominican Republic. This suggests a significant disparity in the vulnerability levels of agricultural households between Haiti and the Dominican Republic. Figure 3 shows the level of vulnerability for farm households by country.
This difference highlights the ability of farming households in the Dominican Republic to better cope with environmental challenges, probably owing to factors such as access to resources, more sustainable farming practices, or more effective adaptation measures. These results provide important insights for targeting interventions to strengthen the resilience of farming communities to climate change in each country.

4.3. Factors That Significantly Influence Farm Households’ Vulnerability to Climate Change

In this section, the central question is to determine which factors have a significant influence on the vulnerability of farming households to climate change.

4.3.1. Level of Vulnerability of the Country (Haiti vs. Dominican Republic)

For the purposes of this study, the country is considered to be the main factor. Haiti and the Dominican Republic, two countries sharing the island of Hispaniola, face similar environmental challenges but differ in their vulnerability to climate change. For example, the result of the logistic regression model shows that farm households in Haiti are 9.49 times more likely to be classified as more vulnerable than farm households in the Dominican Republic (DR), indicating a significantly increased risk of higher levels of vulnerability in Haiti (p < 0.001). This vulnerability of Haitian farming households to climate change can be explained by poverty (low adaptive capacity) and mountain farming (high sensitivity). The results of the regression model clearly show that farming households living in the same geographical area and facing the same climatic risks can have different levels of capacity and vulnerability. This analysis also highlights the disparities in vulnerability between Haitian and Dominican farming households, underlining the importance of specific policies and strategies to strengthen the resilience of farming communities to climate change. Despite this disparity, the situation of Haiti and the Dominican Republic in the face of climate change remains a worrying reality, requiring concerted action at local, regional, and international levels. Both countries must continue to strengthen their adaptive capacity in order to minimize the impacts of climate change on their respective populations, particularly farming households.

4.3.2. Level of Education

In this study, the level of education, measured by the number of school years completed by the farm household, is considered an important factor influencing vulnerability to climate change. Education is recognized as playing a central role in the farming community, as it represents a store of knowledge and know-how. Analysis of the logistic regression model for level of education produced several significant results (Table 9). For example, the odds ratio (OR = 0.44) suggests that the probability of being “Very vulnerable” vs. “Less vulnerable” decreases. Thus, farm households classified as “Less Vulnerable” are around 56% less likely to move to a higher level of vulnerability compared to those classified as “Very Vulnerable”, this result being statistically significant (p < 0.05). Similarly, the probability (OR = 1.99) of moving from “Very Vulnerable” to “Vulnerable” increases. Thus, farm households classified as “Vulnerable” are around 99% more likely to move to a higher level of vulnerability compared to those classified as “Very Vulnerable”, and this result is also statistically significant (p < 0.05).
Furthermore, the odds ratio (OR = 0.37) shows that a secondary level of education in Haiti significantly reduces the level of vulnerability (p < 0.05). Farm households with secondary education in Haiti are 63% less likely to move to a higher level of vulnerability than those in the Dominican Republic. Furthermore, the odds ratio (OR = 0.05) shows an even greater reduction in the level of vulnerability for those with university education, with very strong statistical significance (p < 0.001) (Figure 4). In this context, farm households with university education in Haiti are around 95% less likely to move to a higher level of vulnerability compared to those in the Dominican Republic. We, therefore, present the distribution of the vulnerability index by level of education and by country.
The interaction between Haiti and the level of university education shows a significant increase in vulnerability (OR = 10.97). This result suggests a strong decrease in the level of vulnerability for those with university education in Haiti, compared to the Dominican Republic. This result is statistically highly significant (p < 0.001). Thus, agricultural households with university education in Haiti have a 997% chance of moving to a higher level of vulnerability compared to those in the Dominican Republic. It is clear that farm households with a higher level of education on the Caribbean island of Hispaniola have a higher adaptive capacity and are less vulnerable to climate change. In this context, it is clear that policies aimed at improving education, while taking into account national specificities, could play a crucial role in reducing the vulnerability to climate change of farming households on the island of Hispaniola. By investing in education and designing appropriate educational programs, governments could strengthen the ability of farm households to cope with environmental challenges, thereby contributing to the resilience of farming communities in both countries.

4.3.3. Farm Size (TEX)

Farm size is a crucial element in increasing the crop productivity of farm households on Hispaniola Island. In this study, the analysis of the logistic regression model for farm size shows that the probability of vulnerability in Haiti has increased (OR = 9.49), which is highly significant (p < 0.001), suggesting that being in Haiti is associated with an increased level of vulnerability compared to the Dominican Republic.
Medium-sized farms significantly increase vulnerability (OR = 11.35, p < 0.001) (Figure 5). Similarly, small farms also increase vulnerability (OR = 8.38, p < 0.001). The interaction between being a farming household in Haiti and having a medium-sized farm significantly reduces vulnerability (OR = 0.134, p < 0.001). Similarly, the interaction between being an agricultural household in Haiti and having a small farm also significantly reduces vulnerability (OR = 0.165, p < 0.001). Thus, we present the distribution of the vulnerability index as a function of farm size.
In summary, the analyses show that farming households with access to large farms have a greater capacity to adapt to climate change and are less vulnerable.

4.3.4. Access to Credit (ACR)

Access to credit has proven to be a related factor encouraging the adoption of new farming methods and securing climate change adaptation investments. Once a farming household can obtain credit from more formal sources, it can access essential inputs such as fertilizers and improved seeds, as well as plowing services. In the study area, access to agricultural credit is one of the major challenges for small farming households seeking to overcome their vulnerability to the impact of climate change, especially in times of crisis. The results of the logistic regression model (OR = 0.15) show that when credit is very accessible, the level of vulnerability decreases. This result is highly significant (p < 0.001).
This indicates that improving access to credit is an important factor in reducing vulnerability. Since the results of the study show that when credit is highly accessible, the level of vulnerability decreases, it appears that farm households without access to credit are highly vulnerable to the risks induced by climate change. Thus, we present the distribution of vulnerability index by level to credit by country (Figure 6).
These results underline the crucial importance of access to agricultural credit in reducing the vulnerability of small farm households to climate change on the island of Hispaniola, and they highlight the significant disparities between Haiti and the Dominican Republic in terms of the impact of access to credit on vulnerability. Consequently, policies aimed at improving access to agricultural credit, particularly in times of crisis, could play a key role in promoting the resilience of farming communities on the island of Hispaniola.

5. Discussion

Agriculture is one of the most vulnerable sectors to climate change, and it has been the subject of multiple studies in recent years [4,107]. In an attempt to describe and compare agricultural vulnerability in different regions of the world, and at the household level, various quantitative assessments of vulnerability to climate change have been conducted, generating composite indices based on sets of indicators [4,13,34,46,48,62,73,74,108]. These indicators generally cover several dimensions of the vulnerability concept, capturing a system’s exposure, sensitivity, and adaptive capacity [93]. These three aspects are often combined in a composite index [76]. Consequently, composite indices are suitable for vulnerability assessments due to their ability to capture multiple dimensions of vulnerability [76]. In the context of this study, we developed a vulnerability index using indicators to assess the individual vulnerability of farming households on the Caribbean island of Hispaniola.
Although the use of indicators is feasible for vulnerability assessments in the agricultural sector, the approach has considerable pitfalls, and it has been widely criticized for arguably being insensitive to contextual differences and spatial and temporal distributions of impacts, particularly in terms of scaling, applicability, weighting, utility, and policy implications, sometimes producing oversimplified assessments [4,64,67,68,74,78,109,110,111]. This body of research has also encountered a number of limitations, particularly with regard to the quantification of variables and the integration of vulnerability [12,13,44,77,83].
However, unlike conventional assessment approaches, which are mainly based on objective data, this work focuses on endogenizing the declarations of farming households in 18 different agro-ecological zones on the Caribbean island of Hispaniola to assess their vulnerability. These statements, which correspond to a personal and subjective assessment of the role of different variables on their vulnerability, contributed to a better understanding of the factors shaping vulnerability. In this study, variables were calculated from the survey results by standardizing quantitative variables using the min-max method and qualitative variables by defining classes according to a standardized field of 0 to 1 on a scale of 0 to 10. This method followed the principles applied in Zaatra’s [45] vulnerability study.
During the self-assessment exercise, farm households assigned low scores to variables they considered irrelevant and also to those whose influence as a component of their vulnerability (uncertainty) they were unaware of. Their statements may also be linked to the difficulties they had experienced, their current decisions and practices, and the skills and resources that can be implemented at the farm level, as indicated by various scientific research studies [21,45,112,113]. In this context, the fact of having considered the perceived exposure of farm households and not being objective necessarily affects the results, and they should, therefore, not be over-interpreted. However, in line with the literature [4,33,36,45,70,78], our vulnerability assessment was highly sensitive to variable selection and representation. Indeed, variable selection and validation were based on bibliography, field visits, and consultation with resource actors and experts. For each vulnerability component, a specific calculation method was used. Unlike other authors who use principal component analysis (PCA) [12,21,34,40,44,103,104,105,106], equal weighting [82,103], or expert judgment [78,80,114] to assign weights to the different variables for calculating the agricultural household vulnerability index to climate change, we used multiple correspondence analysis (MCA) to assign different weights to the three categories of all vulnerability variables, taking into account the diversity of impact of the variables used. To do this, we used farm household declarations to weigh the different variables.
Another generally observed limitation of vulnerability assessments [4,36,44,70] is that they fail to address the interactions between the different components of vulnerability (adaptive capacity, sensitivity, exposure). Their approach makes it possible to reassess the indicators usually used to assess sensitivity, exposure, and adaptive capacity in terms of their practicality and applicability, as well as their link with climate change. It also helps to identify missing indicators. For example, for exposure to climate change, rainfall variation is reported as the most important climate issue, generating the highest vulnerability in this study. Several studies have suggested that farm households attach greater importance to recent climatic events in shaping their perceptions of risk [21,113]. With regard to sensitivity, the variables drought, flooding, and crop diversification are declared to be the most important sensitivity factors. For adaptive capacity, the factors declared as most important are for social variables: level of agricultural training, household size, and agricultural network; and for economic capital: crop insurance, access to credit, existence of off-farm income, and access to irrigated land. With the exception of accessibility to endogenous information on climate, cyclones, and telluric hazards, which are more qualitative factors, and the land tenure status of farms, the majority of the variables in our approach are already widely addressed in the literature as determinants of agricultural vulnerability [4,13,14,34,45,94,108,115].
Although these determinants of farm household vulnerability have already been widely addressed in several regions of the world, it was important to determine which factors have a significant influence on the vulnerability of farm households in these two countries, Haiti and the Dominican Republic, which share the same island territory [8,85] and are affected differently in their agriculture [6]. Thus, the result of the regression model shows that certain factors, such as level of education, influence the vulnerability of farming households on the island of Hispaniola. This result is in line with previous studies conducted by Deressa et al. [34], Arunrat et al. [115], Zaatra [45], and Nor Diana et al. [97], which showed that farming households with a higher level of education have a greater capacity to adapt to climate change compared to those with a lower level of education due to their greater exposure to new knowledge and technologies. These households are also more likely to acquire skills and knowledge about current adaptation practices than their less-educated counterparts and are, therefore, less vulnerable, as highlighted by Abdul-Razak and Kruse [116]. Similarly, farm size is a factor influencing the vulnerability of farming households on the Caribbean island of Hispaniola. This finding corroborates previous work conducted by Nhemachena and Hassan [117], Gutu et al. [49], Nabikolo et al. [118], Defiesta and Rapera [119], Alauddin and Sarker [120], Abdul-Razak and Kruse [116], and Arunrat et al. [115], who highlight that farm households with large farms generally have a greater capacity to adapt to climate change. This is made possible by higher capital gains, larger farm areas, and the ability to practice new farming methods on their land, which reduces the vulnerability of farm households [45]. In summary, it is clear that farm households with access to large farms have a greater capacity to adapt to climate change and are less vulnerable. Indeed, access to credit is also a factor influencing the vulnerability of farming households on the Caribbean island of Hispaniola. This finding is in line with previous findings by Shewmake [121], Hassan and Nhemachena [117], Defiesta and Rapera [119], Frank and Penrose Buckley [100], and Abdul-Razak and Kruse [116], who also highlighted that households with poor access to agricultural credit are more vulnerable to climate change than their counterparts with better access to credit. Thus, farm households with access to credit are economically more capable of adapting to climate change.

6. Conclusions

This study assessed the vulnerability of farming households on the Caribbean island of Hispaniola to climate change by developing an integrated index that takes into account the social, economic, and environmental factors of each household. Vulnerability assessment approaches were adopted, combining biophysical and socio-economic indicators. Socio-economic indicators include wealth, level of education, and access to technology, while biophysical indicators include irrigation potential, frequency of extreme climatic and land events, changes in temperature and precipitation, topography, and altitude. These indicators were grouped into three categories to reflect the adaptive capacity, sensitivity, and exposure of farm households. Multiple Correspondence Analysis (MCA) was used to develop a vulnerability index for each farm household, ranking them according to their level of vulnerability to the impacts of climate change. Vulnerability was calculated by combining sensitivity and exposure, and then subtracting adaptive capacity. Next, to categorize the level of vulnerability of each farm household, we used the percentile-based classification method. Values below or equal to the 33rd percentile were categorized as very vulnerable, those above the 33rd percentile and below or equal to the 66th percentile were categorized as vulnerable, and finally, those above the 66th percentile were categorized as less vulnerable. The results reveal that Haitian farming households are relatively more individually vulnerable to climate change than Dominican farmers. This heightened vulnerability of Haitian farming households is attributed to their low level of education, limited access to agricultural credit, and limited farm ownership. In general, the vulnerability of Haitian farming households to climate change is strongly associated with poverty (low adaptive capacity) and mountain farming (high sensitivity). This analysis highlights the disparities in vulnerability between Haitian and Dominican farm households, underlining the importance of specific policies and strategies to strengthen the resilience of farming communities to climate change. Indeed, farming households living in the same geographical area and faced with the same climate risks may present different levels of capacity and vulnerability. Categorizing the level of vulnerability can, thus, help policy-makers identify farming households that are not currently vulnerable but are at a high risk of becoming so in the future. This identification will make it possible to strengthen the adaptive capacities of farm households, while focusing on policies aimed at creating off-farm livelihood opportunities, which will not only improve household cash incomes, but also reduce their dependence on natural resources. Greater financial assets mean more choice in productive investment. However, this needs to be supported by community education, the provision of relevant training, and vocational education to develop the human capacity to utilize existing opportunities and assets. As agriculture remains the mainstay of the community, the development of basic infrastructure such as irrigation facilities is essential. Finally, the construction of all-weather roads linking rural areas to the nearest commercial centers will help to create markets for their agricultural produce and also improve their access to inputs, information, and non-agricultural employment opportunities.

Author Contributions

J.D., T.F., B.P. and E.E. made equal contributions. All authors have read and agreed to the published version of the manuscript.

Funding

This work was financed by the Bank of the Republic of Haiti (BRH) and the French Embassy in Haiti as part of the Antenor FIRMIN Excellence Scholarship Program, intended to support doctoral mobility, thus strengthening training in research and scientific cooperation. Funding numbers are: 148290Y and 146890X.

Institutional Review Board Statement

Not applicable.

Informed Consent Statement

Not applicable.

Data Availability Statement

The datasets presented in this article are not easily accessible as they are the data collected as part of the corresponding author’s doctoral thesis. This thesis is currently being carried out at the Doctoral School “Man, Societies, Risks, Territory” of Normandie Univ, UNICAEN, CNRS, UMR IDEES, 14000 Caen, France in international co-direction with the Climate Change Research Team (ERC2),Associated with LMI CARIBACT: Natural risks, climate variability and impacts in the northern Caribbean, Quisqueya University. Requests for access to the datasets should be directed to the corresponding author of this article.

Acknowledgments

We appreciate the efforts of the Bank of the Republic of Haiti (BRH) and the French Embassy, who funded part of this work. We also thank the reviewers from the Equipe de recherche sur le changement climatique (ERC2),and DATA-TERRA (IRD) in Montpellier, France, for their valuable comments that helped improve this work.

Conflicts of Interest

The authors declare no conflict of interest.

Appendix A

Table A1. Factor score for the mean in the multiple correspondence analysis of the first and second dimensions of each vulnerability level.
VariableAcronymLevel VulnerabilityFacteur Comportement
Social vulnerability variables
Farming experienceEXPLess vulnerable0.056
Vulnerable0.171
Highly Vulnerable0.458
Member of professional agricultural organizationsOPALess vulnerable2.593
vulnerable1.071
Highly Vulnerable0.345
Sources of information on climate and weather trendsSICLess vulnerable3.557
vulnerable1.189
Highly Vulnerable0.526
Level of agricultural trainingNFALess vulnérable5.610
vulnerable0.793
Highly vulnerable0.002
Access to social media for information on climate trends and agricultureNFSLess vulnerable
vulnerable1.929
Highly vulnerable2.326
Household sizeMENLess vulnerable0.040
vulnerable0.266
Highly Vulnerable0.012
Economic vulnerability variables
Phytosanitary treatmentsTHPLess vulnerable2.511
vulnerable1.363
Highly Vulnerable2.056
Extra-agricultural incomeREALess vulnerable3.583
vulnerable1.149
Highly vulnerable0.515
Land statusSFOLess vulnerable1.171
vulnerable0.478
Highly vulnerable0.690
Crop insuranceARELess vulnerable5.894
Vulnerable1.393
Highly vulnerable2.559
Livestock ownerPRBLess Vulnérable1.689
Vulnérable0.625
High vulnérable0.980
Land irrigatedIRRLess vulnerable3.813
Highly vulnerable1.190
Vulnerable1.709
Type of fertilizationFERLess vulnerable2.398
vulnerable1.184
Highly vulnerable2.984
Agricultural toolsOUTLess vulnerable2.178
vulnerable0.563
Highly vulnerable0.966
Agricultural marketing circuitCCLess vulnerable2.469
vulnerable1.220
Highly vulnerable0.706
Biophysical vulnerability variables
AltitudeALTLess vulnerable1.529
vulnerable0.345
Highly vulnerable0.006
Land slopePENLess vulnerable0.050
vulnerable0.458
Highly vulnerable0.744
Crop diversificationDIVLess vulnerable0.953
vulnerable0.018
Highly vulnerable1.594
Climatic hazardsALCLess vulnerable1.082
vulnerable1.185
Highly vulnerable0.013
Telluric hazardsATLess vulnerable0.161
vulnerable0.274
Highly vulnerable0.041
Rainfall variabilityVAPLess vulnerable0.831
vulnerable1.541
Highly vulnerable4.461
Temperature variabilityVATLess vulnerable0.676
vulnerable1.598
Highly vulnerable5.123
DroughtSECLess vulnerable2.383
vulnerable1.253
Highly vulnerable0.479
FloodINNLess Vulnerable0.616
Vulnerable2.247
Highly Vulnerable0.689
Source: Computed from HH survey of 2023.

References

  1. Sultan, B.; Roudier, P.; Traoré, S. Les impacts du changement climatique sur les rendements agricoles en Afrique de l’Ouest. In Les Sociétés Rurales Face aux Changements Climatiques et Environnementaux en Afrique de l’Ouest; Sultan, B., Lalou, R., Oumarou, A., Soumaré, M.A., Sanni, A.M., Eds.; Synthèses; IRD: Marseille, France, 2015; pp. 209–224. ISBN 978-2-7099-2146-6. [Google Scholar] [CrossRef]
  2. Duvil, J.; Durone, J.-B.; Paul, B. Innovations agricoles en réponse au changement climatique. In Innovations Agricoles et Agroalimentaires en Haïti; Paul, B., Ed.; Presses Universitaires des Antilles, «Espace, Territoires et Sociétés»: Guadeloupe, France, 2023; pp. 131–165. [Google Scholar] [CrossRef]
  3. Intergovernmental Panel on Climate Change (IPCC). Climate Change 2022: Impacts, Adaptation, and Vulnerability. Contribution of Working Group II to the Sixth Assessment Report of the Intergovernmental Panel on Climate Change; Pörtner, H.O., Roberts, D.C., Tignor, M., Poloczanska, E.S., Mintenbeck, K., Alegría, A., Craig, M., Langsdorf, S., Löschke, S., Möller, V., et al., Eds.; Cambridge University Press: Cambridge, UK; New York, NY, USA, 2001; 3056p. [Google Scholar] [CrossRef]
  4. Neset, T.S.; Wiréhn, L.; Opach, T.; Glaas, E.; Linnér, B.O. Evaluation of indicators for agricultural vulnerability to climate change: The case of Swedish agriculture. Eco. Indic. 2019, 105, 571–580. [Google Scholar] [CrossRef]
  5. Sendhil, R.; Jha, A.; Kumar, A.; Singh, S. Extent of vulnerability in wheat producing agro-ecologies of India: Tracking from indicators of cross-section and multi-dimension data. Eco. Indic. 2018, 89, 771–780. [Google Scholar] [CrossRef]
  6. Sheller, M.; Leon, Y.M. Uneven socio-ecologies of Hispaniola: Asymmetric capabilities for climate adaptation in Haiti and the Dominican Republic. Geoforum 2016, 73, 32–46. [Google Scholar] [CrossRef]
  7. Herrera, D.A.; Ault, T.R.; Fasullo, J.T.; Coats, S.J.; Carrillo, C.M.; Cook, B.I.; Williams, A.P. Exacerbation of the 2013–2016 pan-Caribbean drought by anthropogenic warming. Geophys. Res. Lett. 2018, 45, 10–619. [Google Scholar] [CrossRef] [PubMed]
  8. Herrera, D.A.; Mendez-Tejeda, R.; Centella-Artola, A.; Martínez-Castro, D.; Ault, T.; Delanoy, R. Projected Hydroclimate Changes on Hispaniola Island through the 21st Century in CMIP6 Models. Atmosphere 2020, 12, 6. [Google Scholar] [CrossRef]
  9. David, E.; Vera, K.; Laura, S. Global Climate Risk Index 2021. In Who Suffers Most from Extreme Weather Events? Germanwatch: Berlin, Germany, 2021; Available online: https://www.germanwatch.org/es/17307 (accessed on 15 September 2023).
  10. Jules, J.; Paul, B.; Adam, M.; Andrieu, N. Co-conception avec les producteurs de stratégies d’adaptation au changement climatique: Le cas des exploitations agricoles en Haïti. Cah. Agric. 2023, 32, 27. [Google Scholar] [CrossRef]
  11. Thornton, P.K.; Jones, P.G.; Owiyo, T.; Kruska, R.L.; Herrero, M.; Kristjanson, P.; Notenbaert, A.; Bekele, N.; Omolo, A. Mapping Climate Vulnerability and Poverty in Africa. Report to the Department for International Development; ILRI: Nairobi, Kenya, 2006; p. 171. [Google Scholar]
  12. Piya, L.; Maharjan, K.L.; Joshi, N.P. Vulnerability of rural households to climate change and extremes: Analysis of Chepang households in the mid-hills of Nepal. In Proceedings of the International Association of Agricultural Economics (IAAE) Triennial Conference, Foz do Iguacu, Brazil, 18–24 August 2012; Available online: https://ageconsearch.umn.edu/record/126191 (accessed on 18 July 2023).
  13. Tesso, G. Individual level vulnerability to climate change impact among crop dependent communities of western Ethiopia. J. Agric. Econ. Dev. 2013, 2, 356–370. [Google Scholar]
  14. Berry, P.M.; Rounsevell, M.D.A.; Harrison, P.A.; Audsley, E. Assessing the vulnerability of agricultural land use and species to climate change and the role of policy in facilitating adaptation. Environ. Sci. Policy 2006, 9, 189–204. [Google Scholar] [CrossRef]
  15. Watts, M.J.; Bohle, H.G. The space of vulnerability: The causal structure of hunger and famine. Prog. Hum. Geogr. 1993, 17, 43–67. [Google Scholar] [CrossRef]
  16. Cutter, S.L. Vulnerability to Environmental Hazards. Prog. Hum. Geogr. 1996, 20, 529–539. [Google Scholar] [CrossRef]
  17. Woodward, A.; Hales, S.; Weinstein, P. Climate Change and Human Health in the Asia Pacific Region: Who will Be Most Vulnerable? Clim. Res. 1998, 11, 31–38. Available online: https://www.int-res.com/articles/cr/11/c011p031.pdf (accessed on 1 June 2024). [CrossRef]
  18. Chambers, R. Editorial Introduction: Vulnerability, Coping and Policy. IDS Bull. 1989, 20, 1–7. Available online: https://core.ac.uk/download/pdf/43540545.pdf (accessed on 10 June 2024). [CrossRef]
  19. Adger, W.N. Approches de la Vulnérabilité au Changement Climatique; Centre for Social and Economic Research on the Global Environment Working Paper GEC 96–05; University of East Anglia and University College London: Norwich, UK, 1996. [Google Scholar]
  20. Bohle, H.G. Vulnerability and criticality: Perspectives from social geography. IHDP Update 2001, 2, 3–5. [Google Scholar]
  21. Gbetibouo, G.A.; Ringler, C. Mapping South African Farming Sector Vulnerability to Climate Change and Variability: A Subnational Assessment; IFPRI Discussion Paper 00885; International Food Policy Research Institute (IFPRI): Washington, DC, USA, 2009. [Google Scholar]
  22. GIEC. Bilan 2001 des Changements Climatiques: Conséquences, Adaptation et Vulnérabilité; GIEC: Genève, Switzerland, 1995; 101p, Available online: https://www.observatoireclimat-hautsdefrance.org/Les-ressources/Ressources-documentaires/Bilan-2001-des-changements-climatiques-Consequences-adaptation-et-vulnerabilite (accessed on 24 February 2024).
  23. Moser, C.O.N. The asset vulnerability framework: Reassessing urban poverty reduction strategies. World Dev. 1998, 26, 1–19. [Google Scholar] [CrossRef]
  24. Watson, R.T.; Zinyowera, M.C.; Moss, R.H. (Eds.) Climate Change 1995: Impacts, Adaptations and Mitigation of Climate Change: Scientific-Technical Analyses, Contribution of Working Group II to the Second Assessment Report of the Intergovernmental Panel on Climate Change; Cambridge University Press: Cambridge, UK, 1996. [Google Scholar]
  25. McCarthy, J.J. (Ed.) Climate Change 2001: Impacts, Adaptation, and Vulnerability; Contribution of Working Group II to the Third Assessment Report of the Intergovernmental Panel on Climate Change; Cambridge University Press: Cambridge, UK, 2001; Volume 2. [Google Scholar]
  26. Füssel, H.-M.; Klein, R.J. Climate change vulnerability assessments: An evolution of conceptual thinking. Clim. Chang. 2006, 75, 301–329. [Google Scholar] [CrossRef]
  27. IPCC (Intergovernmental Panel on Climate Change). Climate Change 2007: Impacts, Adaptation and Vulnerability; Contribution of Working Group II to the Fourth Assessment Report of the Intergovernmental Panel on Climate Change; Parry, M.L., Canziani, O.F., Palutikof, J.P., van der Linden, P.J., Hanson, C.E., Eds.; Cambridge University Press: Cambridge, UK, 2007. [Google Scholar]
  28. Luers, A.L.; Lobell, D.B.; Skar, L.S.; Addams, C.L.; Matson, P.A. A method for quantifying vulnerability, applied to the agricultural system of the Yaqui Valley, Mexico. Glob. Environ. Chang. 2003, 13, 255–267. [Google Scholar] [CrossRef]
  29. Turner, B.L.; Kasperson, R.E.; Matson, P.A.; McCarthy, J.J.; Corell, R.W.; Christensen, L.; Eckley, N.; Broda, G.K.H.; Kasperson, J.X.; Kasperson, R.E.; et al. Illustrating the coupled human-environment system for vulnerability analysis: Three case studies. Proc. Natl. Acad. Sci. USA 2003, 100, 8080–8085. [Google Scholar] [CrossRef] [PubMed]
  30. Brooks, N.; Adger, W.N.; Kelly, P.M. The determinants of vulnerability and adaptive capacity at the national level and the implications for adaptation. Glob. Environ. Chang. 2005, 15, 151–163. [Google Scholar] [CrossRef]
  31. Adger, W.N. Vulnerability. Glob. Environ. Chang. 2006, 16, 268–281. [Google Scholar] [CrossRef]
  32. Villegas-González, P.A.; Ramos-Cañón, A.M.; González-Méndez, M.; González-Salazar Ramón, E.; De Plaza-Solórzano, J.S. Territorial vulnerability assessment frame in Colombia: Disaster risk management. Int. J. Disaster Risk Reduct. 2017, 21, 384–395. [Google Scholar] [CrossRef]
  33. Füssel, H.-M. Adaptation planning for climate change: Concepts, assessment approaches, and key lessons. Sustain. Sci. 2007, 2, 265–275. [Google Scholar] [CrossRef]
  34. Deressa, T.; Hassan, R.M.; Ringler, C. Measuring Ethiopian Farmers’ Vulnerability to Climate Change across Regional States. Washington DC (Etats-Unis). Intl. Food Policy Res. Inst. 2008. Available online: http://ebrary.ifpri.org/cdm/ref/collection/p15738coll2/id/1392 (accessed on 3 June 2023).
  35. Murphy, E.; Scott, M. Household vulnerability in rural areas: Results of an index applied during a housing crash, economic crisis and under austerity conditions. Geoforum 2014, 51, 75–86. [Google Scholar] [CrossRef]
  36. Fatemi, F.; Ardalan, A.; Aguirre, B.; Mansouri, N.; Mohammadfam, I. Social vulnerability indicators in disasters: Findings from a systematic review. Int. J. Disaster Risk Reduct. 2017, 22, 219–227. [Google Scholar] [CrossRef]
  37. Burton, C.; Rufat, S.; Tate, E. Social vulnerability: Conceptual foundations and geospatial modeling. In Vulnerability and Resilience to Natural Hazards; Fuchs, S., Thaler, T., Eds.; Cambridge University Press: Cambridge, UK, 2018; pp. 53–81. Available online: https://halshs.archives-ouvertes.fr/hal-02001407 (accessed on 15 May 2024).
  38. Debra, J.D. Rethinking adaptation: Emotions, evolution, and climate change. Nat. Cult. 2018, 13, 378–402. [Google Scholar] [CrossRef]
  39. De Sherbinin, A.; Bukvic, A.; Rohat, G.; Gall, M.; McCusker, B.; Preston, B.; Apotsos, A.; Fish, C.; Kienberger, S.; Muhonda, P.; et al. Climate vulnerability mapping: A systematic review and future prospects. WIREs Clim. Chang. 2019, 10, e600. [Google Scholar] [CrossRef]
  40. Nelson, R.; Kokic, P.; Crimp, S.; Martin, P.; Meinke, H.; Howden, S.M.; de Voil, P.; Nidumolu, U. The vulnerability of Australian rural communities to climate variability and change: Part II—Integrating impacts with adaptive capacity. Environ. Sci. Policy 2010, 13, 18–27. [Google Scholar] [CrossRef]
  41. Reed Johnson, F.; Lancsar, E.; Marshall, D.; Kilambi, V.; Mühlbacher, A.; Regier, D.A.; Bresnahan, B.W.; Kanninen, B.; Bridges, J.F.P. Constructing experimental designs for discrete-choice experiments: Report of the ISPOR conjoint analysis experimental design good research practices task force. Value Health 2013, 16, 3–13. [Google Scholar] [CrossRef]
  42. Tzilivakis, J.; Warner, D.J.; Green, A.; Lewis, K.A. Adapting to climate change: Assessing the vulnerability of ecosystem services in Europe in the context of rural development. Mitig. Adapt Strateg. Glob. Chang. 2015, 20, 547–572. [Google Scholar] [CrossRef]
  43. Rana, I.A.; Routray, J.K. Actual vis-à-vis perceived risk of flood prone urban communities in Pakistan. Int. J. Disaster Risk Reduct. 2016, 19, 366–378. [Google Scholar] [CrossRef]
  44. Maiti, S.; Jha, S.K.; Garai, S.; Nag, A.; Bera, A.K.; Paul, V.; Upadhaya, R.C.; Deb, S.M. An assessment of social vulnerability to climate change among the districts of Arunachal Pradesh, India. Ecol. Indic 2017, 77, 105–113. [Google Scholar] [CrossRef]
  45. Zaatra, A. Vulnérabilité des exploitations agricoles et préférences d’adaptation au changement climatique dans le territoire du Pays Haut Languedoc et vignoble (PHLV). In Economies et Finances; Université Montpellier: Montpellier, France, 2021. [Google Scholar]
  46. Adger, W.N. Social vulnerability to climate change and extremes in coastal Vietnam. World Dev. 1999, 27, 249–269. [Google Scholar] [CrossRef]
  47. Allen, K. Vulnerability reduction and the community-based approach. In Natural Disasters and Development in a Globalizing World; Pelling, M., Ed.; Routledge: London, UK, 2003; pp. 170–185. [Google Scholar] [CrossRef]
  48. André, G. Cartographie du risque naturel dans le monde. Etude comparative entre une approche d’ordre social et une approche d’ordre économique de la vulnérabilité. Cybergeo Eur. J. Geogr. 2004, 286, 1–12. Available online: https://cybergeo.revues.org/2614 (accessed on 27 August 2024). [CrossRef]
  49. Gutu, T.; Bezabih, E.; Mengistu, K. Analysis of vulnerability and resilience to climate change induced shocks in North Shewa, Ethiopia. Scr. J. Agric. Sci. 2012, 3, 871–888. [Google Scholar] [CrossRef]
  50. Kelly, P.M.; Adger, W.N. Theory and practice in assessing vulnerability to climate change and facilitation adaptation. Clim. Chang. 2000, 47, 925–1352. [Google Scholar] [CrossRef]
  51. Cutter, S.L.; Mitchell, J.T.; Scott, M.S. Revealing the vulnerability of people and places: A case study of Georgetown County, South Carolina. Ann. Assoc. Am. Geogr. 2000, 90, 713–737. [Google Scholar] [CrossRef]
  52. Sehgal, V.K.; Dhakar, R. Geospatial approach for assessment of biophysical vulnerability to agricultural drought and its intra-seasonal variations. Environ. Monit. Assess. 2016, 188, 197. [Google Scholar] [CrossRef]
  53. Mendelsohn, R.; Nordhaus, W.; Shaw, D. The impact of global warming on agriculture: A Ricardian analysis. Am. Econ. Rev. 1994, 84, 753–771. [Google Scholar]
  54. Polsky, C.; Neff, R.; Yarnal, B. Building comparable global change vulnerability assessments: The vulnerability scoping diagram. Glob. Environ. Chang. 2007, 17, 472–485. [Google Scholar] [CrossRef]
  55. Sanghi, A.; Mendelsohn, R.; Dinar, A. The climate sensitivity of Indian agriculture. In Measuring the Impact of Climate Change on Indian Agriculture; Dinar, A., Mendelsohn, R., Evenson, R., Parikh, J., Sanghi, A., Kumar, K., Mckinsey, J., Lonergan, S., Eds.; World Bank: Washington, DC, USA, 1998. [Google Scholar]
  56. Adams, R.M. Global climate change and agriculture: An economic perspective. Am. J. Agric. Econ. 1989, 71, 1272–1279. [Google Scholar] [CrossRef]
  57. Kaiser, H.M.; Riha, S.J.; Wilks, D.S.; Rossiter, D.G.; Sampath, R.K. A farm-level analysis of economic and agronomic impacts of gradual warming. Am. J. Agric. Econ. 1993, 75, 387–398. [Google Scholar] [CrossRef]
  58. Olsen, J.E.; Bocher, P.K.; Jensen, Y. Comparison of scales of climate and soil data for aggregating simulated yields in winter wheat in Denmark. Agric. Ecosyst. Environ. 2000, 82, 213–228. [Google Scholar] [CrossRef]
  59. Kurukulasuriya, P.; Mendelsohn, R. A Ricardian analysis of the impact of climate change on African crop land. CEEPA Discussion Paper 8. In Centre for Environmental Economics and Policy in Africa; University of Pretoria: Pretoria, South Africa, 2006. [Google Scholar]
  60. Martens, P.; Kovats, R.S.; Nijhof, S.; De Vries, P.; Livermore, M.T.J.; Bradley, D.J.; Cox, J.; McMichael, A.J. Climate change and future populations at risk of malaria. Glob. Environ. Chang. 1999, 9, 89–107. [Google Scholar] [CrossRef]
  61. Downing, T.E. Assessing Socioeconomic Vulnerability to Famine: Frameworks, Concepts, and Applications; U.S. Agency for International Development: Washington, DC, USA, 1990; 196p. Available online: http://pdf.usaid.gov/pdf_docs/PNABJ875.pdf (accessed on 5 February 2024).
  62. O’Brien, K.; Leichenko, R.; Kelkar, U.; Venema, H.; Aandahl, G.; Tompkins, H.; Javed, A.; Bhadwal, S.; Barg, S.; Nygaard, L.; et al. Mapping vulnerability to multiple stressors: Climate change and globalization in India. Glob. Environ. Chang. 2004, 14, 303–313. [Google Scholar] [CrossRef]
  63. Campbell, D.J. Response to drought among farmers and herders in southern Kajiado district, Kenya: A comparison of 1972–1976 and 1994–1995. Hum. Ecol. 1999, 27, 377–415. [Google Scholar] [CrossRef]
  64. Eriksen, S.H.; Kelly, P.M. Developing credible vulnerability indicators for climate adaptation policy assessment. Mitig. Adapt. Strateg. Glob. Chang. 2007, 12, 495–524. [Google Scholar] [CrossRef]
  65. Christiaensen, L.J.; Subbarao, K. Towards an understanding of household vulnerability in rural Kenya. J. Afr. Econ. 2005, 14, 520–558. [Google Scholar] [CrossRef]
  66. Ligon, E.; Schechter, L. Measuring vulnerability. Econ. J. 2003, 113, 95–102. [Google Scholar] [CrossRef]
  67. Hoddinott, J.; Quisumbing, M.A.R. Data Sources for Microeconometric Risk and Vulnerability Assessments; World Bank, Social Protection; International Food Policy Research Institute: Washington, DC, USA, 2003; Available online: http://documents.worldbank.org/curated/en/653621468782078702/Data-sources-for-microeconometric-risk-and-vulnerability-assessments (accessed on 1 September 2023).
  68. Gallopín, G.C. Environmental and sustainability indicators and the concept of situational indicators. A systems approach. Environ. Model. Assess. 1996, 1, 101–117. [Google Scholar] [CrossRef]
  69. Hinkel, J. Indicators of vulnerability and adaptive capacity”: Towards a clarification of the science–policy interface. Glob. Environ. Chang. 2011, 21, 198–208. [Google Scholar] [CrossRef]
  70. Becker, D.; Schneiderbauer, S.; Forrester, J.M.; Pedoth, L. Guidelines for Development of Indicators, Indicator Systems and Provider Challenges; CRED: Louvain, Belgique, 2015; 128p, Available online: https://1library.net/document/4yrg5vjq-guidelines-development-indicators-indicator-systems[1]provide-challenges.html (accessed on 1 September 2023).
  71. Brooks, N. Vulnerability, Risk and Adaptation: A Conceptual Framework; Working Paper 38; Tydall Centre for Climate Change Research, University of East Anglia: Norwich, UK, 2003; 16p. [Google Scholar]
  72. D’Ercole, R.; Metzger, P. Territorial vulnerability: A new approach of risks in urban areas. Cybergeo Eur. J. Geogr. Doss. Vulnérabilités Urbaines Au Sud 2009, 447, 1–16. [Google Scholar] [CrossRef]
  73. Moss, R.H.; Brenkert, A.L.; Malone, E.L. Vulnerability to Climate Change: A Quantitative Approach; Research Report Prepared for the U.S. Department of Energy; Springer: Dordrecht, The Netherlands, 2001; pp. 33–49. [Google Scholar]
  74. Nhemachena, C.; Benhin, J.; Glwadys, G. Vulnerability to climate change and adaptive capacity in South African agriculture. In Proceedings of the IFPRI Workshop, “Food and Water Security Under Global Change: Developing Adaptive Capacity with a Focus on Rural Africa”, Washington, DC, USA, 16–21 October 2006. [Google Scholar]
  75. Nardo, M.; Saisana, M.; Saltelli, A.; Tarantola, S.; Hoffman, A.; Giovannini, E. Handbook on Constructing Composite Indicators: Methodology and User Guide; Organisation for Economic Co-Operation and Development: Paris, France, 2008. [Google Scholar]
  76. Birkmann, J. Risk and vulnerability indicators at different scales: Applicability, usefulness and policy implications. Environ. Hazards 2007, 7, 20–31. [Google Scholar] [CrossRef]
  77. Vincent, K. Uncertainty in adaptive capacity and the importance of scale. Glob. Environ. Chang. 2007, 17, 12–24. [Google Scholar] [CrossRef]
  78. Binder, C.R.; Feola, G.; Steinberger, J.K. considering the normative, systemic and procedural dimensions in indicator-based sustainability assessments in agriculture. Environ. Impact Assess. Rev. 2010, 30, 71–81. [Google Scholar] [CrossRef]
  79. Barnett, J.; Lambert, S.; Fry, I. The hazards of indicators: Insights from the environmental vulnerability index. Ann. Assoc. Am. Geogr. 2008, 98, 102–119. [Google Scholar] [CrossRef]
  80. Vincent, K. Creating an Index of Social Vulnerability to Climate Change for Africa; Working Paper 56; Tyndall Center for Climate Change Research, University of East Anglia: Norwich, UK, 2004. [Google Scholar]
  81. United Nations. Living with Risk: A Global Review of Disaster Reduction Initiatives; United Nations: Geneve, Switzerland, 2004; 429p, Available online: https://www.unisdr.org/files/657_lwr1.pdf (accessed on 1 May 2024).
  82. Duvil, J. Perceptions and Adaptation Strategies of Farmers Facing the Impacts of Climate Change in the Caribbean Region: The Case of Haiti and the Dominican Republic. Master’s Thesis, Université Paris Saclay, Paris, France, 2021. [Google Scholar] [CrossRef]
  83. Centre National de l’Information Géo-Spatiale (CNIGS). 2024. Available online: http://www.cnigs.ht (accessed on 7 October 2023).
  84. PNACC-RD. Plan Nacional de Adaptación para el cambio climático en la República Dominicana 2015–2030. Un país Resiliente Frente al Cambio Climático; Ministerio de Medio Ambiente y Recursos Naturales, CNCCMDL, GEF y PNUD: Santo Domingo, Dominican Republic, 2016. [Google Scholar]
  85. Paul, B.; Fréguin-Gresh, S.; Marzin, J.; Pressoir, G. Diagnostic Agro-Socio-Economique de la Commune de Saint Michel de l’Attalaye (Haïti). Doctoral Dissertation, CIRAD, Université de Quisqueya, Chibas, Port-au-Prince, Haïti, 2021. [Google Scholar] [CrossRef]
  86. Ouédraogo, M.; Dembélé, Y.; Somé, L. Perceptions et stratégies d’adaptation aux changements des précipitations: Cas des paysans du Burkina Faso. Sécheresse 2010, 21, 87–96. [Google Scholar] [CrossRef]
  87. Kabore, P.N.; Barbier, B.; Ouoba, P.; Kiema, A.; Some, L.; Ouedraogo, A. Perceptions du Changement Climatique, Impacts Environnementaux et Strategies Endogènes D’adaptation par les Producteurs du Centre-nord du Burkina Faso. VertigO 2019, 19, 23. Available online: https://id.erudit.org/iderudit/1065432ar (accessed on 6 October 2023). [CrossRef]
  88. Arun, G.C.; et Yeo, J.H. Perception to Adaptation of Climate Change in Nepal: An Emprirical Analysis Using Multivariate Probit Model. Sci 2019, 1, 14. [Google Scholar]
  89. Sendhil, R.; Jha, A.; Kumar, A.; Singh, S.; Kharub, A.S. Status of vulnerability in wheat and barley producing states of India. J. Wheat Res. 2017, 9, 60–63. [Google Scholar] [CrossRef]
  90. Vásquez-León, M.; West, C.T.; Finan, T.J. A comparative assessment of climate vulnerability: Agriculture and ranching on both sides of the US–Mexico border. Glob. Environ. Chang. 2003, 13, 159–173. [Google Scholar] [CrossRef]
  91. Leichenko, R.M.; O’Brien, K.L. The dynamics of rural vulnerability to global change: The case of Southern Africa. Mitig. Adapt. Strateg. Glob. Chang. 2001, 7, 1–18. [Google Scholar] [CrossRef]
  92. Fritzsche, K.; Schneiderbauer, S.; Bubeck, P.; Kienberger, S.; Buth, M.; Zebisch, M.; Kahlenborn, W. Guide de Référence sur la Vulnérabilité: Concept et Lignes Directrices pour la Conduite D’analyses de Vulnérabilité Standardisées; Deutsche Gesellschaft für Internationale Zusammenarbeit (GIZ): Bonn, Allemagne, 2015; 178p, Available online: https://www.adaptationcommunity.net/?wpfb_dl=262 (accessed on 3 July 2023).
  93. Wiréhn, L.; Opach, T.; Neset, T.-S. Assessing agricultural vulnerability to climate change in the Nordic countries—An interactive geovisualization approach. J. Environ. Plann. Manag. 2017, 60, 115–134. [Google Scholar] [CrossRef]
  94. Lucas, P.L.; Hilderink, H.B.M. The Vulnerability Concept and Its Application to Food Security; Report 550015004/2004; National Institute for Public Health and the Environment (RIVM): Bilthoven, The Netherlands, 2004; 40p, Available online: https://rivm.openrepository.com/bitstream/handle/10029/257643/550015004.pdf?sequence=3&isAllowed=y (accessed on 27 August 2024).
  95. Engle, N.L. Adaptive capacity and its assessment. Glob. Environ. Chang. 2011, 21, 647–656. [Google Scholar] [CrossRef]
  96. Nor Diana, M.I.; Zulkepli, N.A.; Siwar, C.; Zainol, M.R. Farmers’ adaptation strategies to climate change in Southeast Asia: A systematic literature review. Sustainability 2022, 14, 3639. [Google Scholar] [CrossRef]
  97. GIEC. Changements Climatiques 2014: Rapport de Synthèse; GIEC: Genève, Switzerland, 2014; 161p, Available online: http://www.ipcc.ch/site/assets/uploads/2018/02/ar4_syr_fr.pdf (accessed on 1 September 2023).
  98. Preston, B.L.; Stafford-Smith, M. Framing Vulnerability and Adaptive Capacity Assessment: Discussion Paper; CSIRO Climate Adaptation National Research Flagship: Aspendale, Australia, 2009; Available online: https://research.csiro.au/climate/wp-content/uploads/sites/54/2016/03/2_Working-Paper2_CAF_PDF-Standard.pdf (accessed on 7 July 2024).
  99. Handmer, J.; Honda, Y.; Kundzewicz, Z.W.; Arnell, N.; Benito, G.; Hatfield, J.; Mohamed, I.F.; Peduzzi, P.; Wu, S.; Sherstyukov, B.; et al. Changes in impacts of climate extremes: Human systems and ecosystems. In Managing the Risks of Extreme Events and Disasters to Advance Climate Change Adaptation Special Report of the Intergovernmental Panel on Climate Change Adaptation; Field, C.B., Barros, V., Stocker, T.F., Qin, D., Dokken, D.J., Ebi, K.L., Mastrandrea, M.D., Mach, K.J., Plattner, G.-K., Allen, S.K., et al., Eds.; A Special Report of Working Groups I and II of the Intergovernmental Panel on Climate Change (IPCC); Cambridge University Press: Cambridge, UK; New York, NY, USA; pp. 231–290.
  100. Feroze, S.M.; Chouhan, A.K. Performance of dairy self help groups in India: Principal component analysis approach. Indian J. Agric. Econ. 2010, 65, 308–318. [Google Scholar]
  101. Nelson, R.; Kokic, P.; Elliston, L.; Jo-Anne, K. Structural Adjustment: A Vulnerability Index for Australian Broadacre Agriculture. Aust. Commod. 2005, 12, 171–179. [Google Scholar]
  102. Filmer, D.; Pritchett, L.H. Estimating wealth effects without expenditure data—Or tears: An application to educational enrollments of India. Demography 2001, 38, 115–132. [Google Scholar]
  103. Cutter, S.L.; Boruff, B.J.; Shirley, W.L. Social vulnerability to environmental hazards. Soc. Sci. Q. 2003, 84, 243–261. [Google Scholar] [CrossRef]
  104. Langyintuo, A.S. Maize production systems for Zimbabwe: Setting indicators for impact assessment and targeting. In Research Project on Strengthening Seed Marketing Incentives in Southern Africa to Increase Impact of Maize Breeding; International Maize and Wheat Improvement Center (CIMMYT): Harare, Zimbabwe, 2005. [Google Scholar]
  105. Vyas, S.; Kumaranayake, L. Constructing socio-economic status indices: How to use principal component analysis. Health Policy Plan. 2006, 21, 459–468. [Google Scholar] [CrossRef]
  106. Smith, P.; Bustamante, M.; Ahammad, H. Agriculture, forestry and other land use (AFOLU). In Climate Change 2014: Mitigation of Climate Change. Contribution of Working Group III to the Fifth Assessment Report of the Intergovernmental Panel on Climate Change; Edenhofer, O., Pichs-Madruga, R., Sokona, Y., Eds.; Cambridge University Press: Cambridge, UK; New York, NY, USA, 2014. [Google Scholar]
  107. Dong, Z.; Pan, Z.; An, P.; Wang, L.; Zhang, J.; He, D.; Han, H.; Pan, X. A novel method for quantitatively evaluating agricultural vulnerability to climate change. Ecol. Indic. 2015, 48, 49–54. [Google Scholar] [CrossRef]
  108. Vogel, E.; Meyer, R. Chapter 3—Climate change, climate extremes, and global food production—Adaptation in the agricultural sector. In Resilience: The Science of Adaptation to Climate Change; Zommers, Z., Alverson, K., Eds.; Elsevier: Amsterdam, The Netherlands, 2018; pp. 31–49. [Google Scholar] [CrossRef]
  109. Moser, S.C. Entering the period of consequences: The explosive US awakening to the need for adaptation. In Climate Change Adaptation in Developed Nations: From Theory to Practice; Ford, J.D., Berrang-Ford, L., Eds.; Springer: Dordrecht, The Netherlands, 2011; pp. 33–49. [Google Scholar] [CrossRef]
  110. Jones, B.; Andrey, J. Vulnerability index construction: Methodological choices and their influence on identifying vulnerable neighbourhoods. Int. J. Emerg. Manag. 2007, 4, 269–295. [Google Scholar] [CrossRef]
  111. Adger, W.N.; Dessai, S.; Goulden, M.; Hulme, M.; Lorenzoni, I.; Nelson, D.R.; Naess, L.O.; Wolf, J.; Wreford, A. Are there social limits to adaptation to climate change? Clim. Chang. 2009, 93, 335–354. [Google Scholar] [CrossRef]
  112. Bryan, E.; Ringler, C.; Okoba, B.; Roncoli, C.; Silvestri, S.; Herrero, M. Adapting agriculture to climate change in Kenya: Household strategies and determinants. J. Environ. Manag. 2013, 114, 26–35. [Google Scholar] [CrossRef]
  113. Adger, W.N.; Vincent, K. Uncertainty in Adaptive Capacity. C R Geosci. 2005, 337, 399–410. [Google Scholar] [CrossRef]
  114. Shukla, R.; Sachdeva, K.; Joshi, P.K. Inherent vulnerability of agricultural communities in Himalaya: A village-level hotspot analysis in the Uttarakhand state of India. Appl. Geogr. 2016, 74, 182–198. [Google Scholar] [CrossRef]
  115. Arunrat, N.; Wang, C.; Pumijumnong, N.; Sereenonchai, S.; Cai, W. Farmers’ intention and decision to adapt to climate change: A case study in the Yom and Nan basins, Phichit province of Thailand. J. Clean. Prod. 2017, 143, 672–685. [Google Scholar] [CrossRef]
  116. Abdul-Razak, M.; Kruse, S. The adaptive capacity of smallholder farmers to climate change in the Northern Region of Ghana. Clim. Risk Manag. 2017, 17, 104–122. [Google Scholar] [CrossRef]
  117. Nhemachena, C.; Hassan, R. Micro-Level Analysis of Farmers’ Adaptation to Climate Change in Southern Africa; IFPRI Discussion Paper 00714 August; International Food PolicyResearch Institute: Washington, DC, USA, 2007. [Google Scholar]
  118. Nabikolo, D.; Bashaasha, B.; Mangheni, M.N.; Majaliwa, J.G.M. Determinants of climate change adaptation among male and female headed farm households in eastern Uganda. Afr. Crop Sci. J. 2012, 20, 203–212. Available online: https://www.ajol.info/index.php/acsj/article/view/81767 (accessed on 10 July 2023).
  119. Defiesta, G.; Rapera, C. Measuring adaptive capacity of farmers to climate change and variability: Application of a composite index to an agricultural community in the Philippines. J. Environ. Sci. Manag. 2014, 17, 48–62. [Google Scholar] [CrossRef]
  120. Alauddin, M.; Sarker, M.A.R. Climate change and farm-level adaptation decisions and strategies in drought-prone and groundwater-depleted areas of Bangladesh: An empirical investigation. Ecol. Econ. 2014, 106, 204–213. [Google Scholar] [CrossRef]
  121. Shewmake, S. Vulnerability and the Impact of Climate Change in South Africa’s Limpopo River Basin; IFPRI Discussion Paper 00804; Environment and Production Technology Division: New York, NY, USA, 2008. [Google Scholar]
Figure 1. Field survey area. Data source: CNIGS, [83].
Climate 12 00138 g001
Figure 2. Integrated vulnerability component. Source: Fritzsche et al. [92]; adapted by the authors.
Climate 12 00138 g002
Figure 3. Vulnerability index for each farmer by country. Source: Computed from HH survey 2023.
Climate 12 00138 g003
Figure 4. Distribution of vulnerability index by level education and country. Source: Computed from HH survey 2023.
Climate 12 00138 g004
Figure 5. Distribution of the vulnerability index as a function of size. Source: Computed from HH survey of 2023.
Climate 12 00138 g005
Figure 6. Distribution of vulnerability index by level to credit by country. Source: Computed from HH survey of 2023.
Climate 12 00138 g006
Table 1. Some examples of econometric methods for vulnerability assessment.
MethodsDescriptionReferences
Vulnerability as Expected Poverty (VEP)
-
A person’s vulnerability is conceived as the probability that this person will soon become poor if he or she is not currently poor, or that this person will continue to be poor if he or she is currently poor.
-
Consumption (income) is used as a proxy for well-being.
-
This method is based on estimating the probability that a given shock, or set of shocks, will move household consumption below a given minimum level (e.g., consumption poverty line) or force the consumption level to remain below the minimum requirement if it is already below that level.
[66]
Vulnerability as a low expected utility
-
Vulnerability is defined as the difference between the utility derived from a certain level of certainty.
-
Equivalent consumption above which the household would not be considered vulnerable and the expected utility of consumption.
-
The disadvantage of this method is that it is difficult to take account of individual preferences.
[67]
Vulnerability as uninsured exposure to risk
-
It is based on an ex-post evaluation of the loss of well-being caused by a shock.
-
The impact of shocks is assessed using panel data to quantify the variation in induced consumption.
-
The value of the loss incurred due to shocks is equivalent to the amount paid as insurance to keep a household as well off as it was before the shock.
-
This method requires several databases
[68]
Source: Deressa et al. [34]; Zaatra [45].
Table 2. Study area on the island of Hispaniola.
DepartmentMunicipalitiesPopulationSurface Area (Km2)Geographical CoordinatesAltitude (m)Survey
Frequency%
Centre (Haiti)Hinche120,867588.419°09′ N, 72°01′ O2376010.9
Cerca-la-source56,53234519°10′ N, 71°47′ O3716010.9
Cerca-Carvajal23,254156.919°16′ N, 71°57′ O459305.45
Nord’Ouest (Haiti)Port-de-paix185,707351.7519°57′ N, 72°50′ O36305.45
Bassin bleu57,697214.8319°47′ N, 72°48′ O198305.45
Môle saint Nicolas3075227.0719°48′ N, 73°23′ O36407.27
Artibonite en HaïtiSaint Michel de l’Attalaye136,876613.7419°17′ N, 72°04′ O420305.45
Marmalade34,609108.9419°31′ N, 72°21′ O759305.45
Nord (Haiti)Saint Raphaël53,75518319°17′ N, 72°04′ O373305.45
Sud (Haiti)Aux cayes151,696191.1118°11′ N, 73°45′ O70305.45
Camp perrin40,962151.4218°19′ N 73°51′ O424305.45
Tobeck78,603201.8618°10′ N, 73°49′ O40305.45
Elias piñas (RD)Hondo valle10,647128.5318°43′ N, 71°42′ O890203.63
Santiago (RD)Santiago de los caballeros283,651236.5118°77′ N, 70°44′ O199203.63
Dajabón (RD)Dajabón25,983253.419°33′ N, 71°42′ O35203.63
Valverde (RD)Santa cruz de Mao49,475409.6619°34′ N, 75°05 O85203.63
Santiago Rodriguez (RD)Monción11,753101.6119°26′ N, 71°10′ O372203.63
San JuanLas matas de Farfán70,586636.6418°52′ N 71°31′ O415203.63
Sources: Paul et al. [85]; Duvil [82].
Table 3. Statistical description of model variable adaptive capacity (social and economic) by vulnerability category and distribution of farm households according to the criteria chosen for the classification of vulnerability to climate change.
Variable for Studying the Vulnerability of Agricultural HouseholdsNotesID de la ClasseAgricultural Household NumberLevel_Vulnerability of Agricultural Households% of Agricultural Households
Variable adaptive capacity
Variable Social
Farming experience
15 to 301EXP1179Highly vulnerable33.55
31–502EXP2318Vulnerable57.82
51 and more3EXP353Less vulnerable9.64
Household size
7 and more1MEN1315Highly vulnerable57.27
4 to 62MEN273Vulnerable29.45
1 to 33MEN3162Less Vulnerable13.27
Member of professional agricultural organizations
11OPA1167Highly Vulnerable30.36
22OPA2224vulnerable40.72
3 and more3OPA3159Less vulnerable28.70
Access to social media for information on climate trends and agriculture
No access1SFN1138Highly vulnerable25.09
Agricultural technology2SFN2226Vulnerable41.09
Above Bac +43SFN3186Less vulnerable33.82
Sources of information on climate and weather trends
Sign and change in the environment1SIC1233Highly vulnerable42.36
Mutual aid between farmers2SIC2213Vulnerable38.73
Scientific documents (books, articles, etc.)3SIC3104Less vulnerable18.91
Level of agricultural training
No training1NFA191Highly vulnerable73.04
Agricultural technology2NFA2401Vulnerable16.58
Higher than Bac +43NFA357Less vulnerable10.38
Variable economic
Off-farm income
No access1REA1237Highly vulnerable43.09
Sometimes2REA2173Vulnerable31.45
Very often3REA3140Less vulnerable25.45
Land status
FVI > 50%1SFO1220Highly vulnerable40
FVI < 50%2SFO2118Vulnerable21.45
The earth belongs to me3SFO3212Less vulnerable38.55
Crop insurance
No crop insurance1ARE1444Highly vulnerable80.73
Single-risk insurance2ARE243Vulnerable7.82
Multi-risk insurance3ARE363Less vulnerable11.45
Livestock owner
No livestock1PRB1169Highly vulnerable21.45
Less than 3 livestock units2PRB2118Vulnerable30.73
Own more than 3 livestock units3PRB3263Less vulnerable47.82
Irrigation
No Irrigation, dry surface IRR1274Highly vulnerable49.82
Yes, surface irrigated IRR2134Vulnerable24.36
Yes, irrigated area IRR3142Less vulnerable25.82
Phytosanitary treatments
No treatment1TPH1189Highly vulnerable34.36
Systemic2TPH2285Vulnerable51.82
Reasoned and preventive3TPH376Less vulnerable13.82
Type of fertilization
No fertilization1FER1189Highly vulnerable34.36
Chemical2FER2250Vulnerable45.45
Organic3FER3111Less vulnerable11.18
Farming tools
Less than 3 farm implements1OUT1221Highly vulnerable40.18
3 to 5 farming tools2OUT2144Vulnerable26.18
More than 5 farm implements3OUT3185Less vulnerable33.64
Marketing channel
Local market1CC1148Highly vulnerable26.91
Communal market2CC2347Vulnerable63.09
National and international markets3CC355Less vulnerable10
Source: Computed from HH survey 2023.
Table 4. Statistical description of exposure variables (biophysical) by vulnerability category and distribution of farming households according to the criteria chosen for the classification of vulnerability to climate change.
Variable for Studying the Vulnerability of Agricultural HouseholdsNotesID de la ClasseAgricultural Household NumberLevel_Vulnerability of Agricultural Households% of Agricultural Households
Variable exposure (Biophysics)
Temperature variability
High variability1VAT186Highly vulnerable13.64
Low variability2VAT2427Vulnerable77.64
Very low variability3VAT337Lessly vulnerable6.73
Rainfall variability
High variability1VAP191Highly vulnerable16.55
Low variability2VAP2424Vulnerable77.09
Very low variability3VAP335Less vulnerable6.36
Source: Computed from HH survey 2023.
Table 5. Statistical description of sensitivity variables (environmental) by vulnerability category and distribution of farming households according to the criteria chosen for the classification of vulnerability to climate change.
Variable for Studying the Vulnerability of Agricultural HouseholdsNotesID de la ClasseAgricultural Household NumberLevel_Vulnerability of Agricultural Households% of Agricultural Households
Variable environnementale (Biophysique)
Ground slope
Less than 10% slope1PEN1162Highly vulnerable26.91
Slopes from 10 to 25%2PEN2255Vulnerable63.09
Slope greater than 25%3PEN3133Less vulnerable10
Production diversity
Monoculture1DIV1210Highly vulnerable38.19
Two main crops2DIV2110Vulnerable20
Several main crops3DIV3230Less vulnerable41.81
Climatic hazards (cyclones)
>4 hazards1ALC1168Highly vulnerable30.55
2 to 3 hazards2ALC2168Vulnerable30.55
<2 hazards3ALC3214Less vulnerable38.91
Telluric hazards
>4 hazards1AT1378Highly vulnerable68.73
2 to 3 hazards2AT283Vulnerable15.09
<2 hazards3AT389Less vulnerable16.18
Altitude
Low1ALT1200Highly vulnerable36.36
Mean2ALT2284Vulnerable51.64
High3ALT366Less vulnerable12
Drought
High sensitivity1SEC1344Highly vulnerable62.55
Mean sensitivity2SEC2200Vulnerable36.36
Low sensitivity3SEC36Less vulnerable1.09
Flood
High sensitivity1INN171Highly vulnerable12.91
Mean sensitivity2INN2184vulnerable33.45
Low sensitivity3INN3295Less vulnerable53.64
Source: Computed from HH survey 2023.
Table 6. Assessment grid for experience-related adaptability.
ClassScaleIntervalsDescription Ca. NormalizedLabelVulnerability Categorization
15–300–30–0.33Low adaptive capacity0.165EXP1Highly vulnerable
31–504–70.33–0.66Mean adaptive capacity0.495EXP2Vulnerable
51 and more7–100.66–1Highly adaptive capacity0.83EXP3Less vulnerable
Source: Computed from HH survey 2023.
Table 7. Variables of social vulnerability and their contributions to vulnerability level.
Variables of Social Vulnerability and Their Effect on Vulnerability Level
Social Vulnerability VariablesPercentage (%)Contribution to Vulnerability Level
Age: person over 4561.08+
Sex: Head women household29.69
Household size: Households of more than 4 people70.54+
Level to agricultural formation: No access to farmer extension73.04+
Level and access to agricultural extension information: No access to farmer extension10.38
Access to indigenous early warning information: Having no access18.90
Farming experience: Lack of farming experience of <15 years32.54
Agricultural network: no member of institutions or associations57.27+
Social network: Who has access at least to the internet, radio, or television32.78
Variables of economic vulnerability and their effect on vulnerability level
Economic Vulnerability VariablesPercentage (%)Contribution to vulnerability level
Non-farm or sometime income, diversity of income sources: Have no non-farm income or sometime74.54+
Ownership of livestock: Own less than 3 units of tropical livestock47.82
Land status: FVI < 50%40
Land under irrigation: No access to irrigation at all74.18+
Land cultivated with commercial fertilizer: Having no access to fertilizer at all34.36
Insecticide and pesticide supply: Having no access to use insecticide and pesticide supply34.36
Access to credit: Having no access to credit79.28+
Farm tools: Own more than 5 farm tools33.64
Crop assurance: Having access to crop assurance88.55+
Commercialization circuit: At least part of the product is sold on the local market26.91
Environmental vulnerability indicators and their effect on vulnerability level
Environmental vulnerability variables (measures of sensitivity and exposure)PercentageContribution to vulnerability level
Rainfall: People facing exposure to a moderate and high rainfall variability93.64+
High temperature: People facing exposure to a moderate and high temperature variability91.28+
Land topography: Slope > 25%26.91
Crop diversity: Less than 50% of the 2 main crops grown in the area63.09+
Fertility level: Low fertility (cannot produce without using much fertilizer)25.09
Frequency of hazards teluric: People facing less than 2 natural hazards per year16.18
Frequency of cyclones: People facing less than 2 natural hazards per year69.46+
Frequency of drought: People facing a high and moderate sensibility per year98.91+
Frequency of flood: People facing a high and moderate sensibility per year66.36+
Altitude: People with plots at high altitude36.36
Source: Computed from HH survey of 2023.
Table 8. Classification of the farmers by the range of their vulnerability index.
CountryVulnerability IndexVulnerability LevelNumber Farmers of the Vulnerability LevelPercentage of HHs (%)
Haïti<33e percentileHighly vulnerable15836,74
>33e <66e percentilesVulnerable15736,51
>66e percentileLess vulnerable11526,75
Total 430100
Dominican Republic<33e percentileHighly vulnerable2420
>33e <66e percentilesVulnerable2420
>66e percentileLess vulnerable7260
Total 120100
Source: Computed survey of 2023.
Table 9. Results of the logistic regression model.
VariablesVariable LevelOdds_RatioLower_CIUpper_CIp_Value
Level of vulnerabilityLess vulnerable|Very vulnerable0.440.230.81p < 0.05
Level of vulnerabilityVery vulnerable|Vulnerable1.991.083.66p < 0.05
CountryHaiti9.494.3020.93p < 0.001
Level of educationSecondary0.370.160.86p < 0.05
Level of educationUniversity0.050.010.17p < 0.001
Farm sizeOperator Medium11.354.1630.93p < 0.001
Farm sizeSmall operator8.383.3121.18p < 0.001
Access to creditVery accessible0.150.050.45p < 0.001
Country: Level of educationHaïti: University10.963.0439.44p < 0.001
Country: Farm sizeHaïti: Operator Medium0.130.040.40p < 0.001
Country: Farm sizeHaïti: Small operator0.160.050.47p < 0.001
Source: Computed from HH survey of 2023. Odds Ratio: A measure of the association between an exposure and an outcome, indicating the odds of the outcome occurring with the exposure compared to without; Lower CI: Lower bound of the 95% Confidence Interval, indicating the lower limit within which the true odds ratio is expected to fall with 95% confidence; Upper CI: Upper bound of the 95% Confidence Interval, indicating the upper limit within which the true odds ratio is expected to fall with 95% confidence; p-value: A measure of the statistical significance of the results, indicating the probability that the observed association occurred by chance.
Disclaimer/Publisher’s Note: The statements, opinions and data contained in all publications are solely those of the individual author(s) and contributor(s) and not of MDPI and/or the editor(s). MDPI and/or the editor(s) disclaim responsibility for any injury to people or property resulting from any ideas, methods, instructions or products referred to in the content.

