Abstract
The Darfur conflict, which emerged in the early 21st century, represents a multifaceted crisis driven by socio-political and environmental factors, with resource scarcity, exacerbated by climate change, playing a pivotal role in intensifying tensions between agricultural and pastoral communities. While climate change is typically associated with adverse environmental outcomes, an analysis of data spanning four decades (1980–2023) reveals a contrasting trend of increased precipitation, enhanced vegetation, and decreased drought frequency in recent years. This research explores the potential of these positive environmental changes to mitigate resource-based conflicts and foster political stability in Darfur as improved environmental conditions are posited to create a foundation for conflict resolution and sustainable peacebuilding. The present study integrates trends in the Enhanced Vegetation Index (EVI) and the Standardized Precipitation Evapotranspiration Index (SPEI) to examine these shifts. EVI data, derived from the Moderate Resolution Imaging Spectroradiometer (MODIS) at a 250 m resolution, was used to assess large-scale vegetation patterns in arid and semi-arid landscapes. The Autoregressive Integrated Moving Average (ARIMA) model was employed to forecast future precipitation scenarios up to the year 2034, enhancing the understanding of long-term climatic trends. Data processing and analysis utilized advanced tools, including Google Earth Engine (GEE), ArcGIS Pro (version 3.4), and R software (version 4.3.2). The findings reveal a significant (33.19%) improvement in natural vegetation cover between 2000 and 2023, with degraded and unchanged areas accounting for 1.95% and 64.86%, respectively. This finding aligns with a marked increase in annual precipitation and a reduction in drought intensity over the study period. Historical SPEI analysis showed persistent drought events between 1980 and 2012, followed by a notable decline in drought frequency and severity from 2013 to 2024. Precipitation projections suggest a stable trend, potentially supporting further vegetation recovery in the region. These environmental improvements are preliminarily linked to climate-change-induced increases in precipitation and reductions in drought severity. This study’s findings contribute to a nuanced understanding of the interplay between environmental dynamics and socio-political stability in Darfur, offering actionable insights for policy interventions aimed at fostering sustainable peace and resilience in the region.
1. Introduction
Global climate change has emerged as a significant force reshaping natural and social systems worldwide, manifesting through intensified droughts, floods, famine, political instability, and disease outbreaks [1,2,3,4]. These challenges underscore the critical need for targeted interventions to support the nations which are most vulnerable to climate-induced crises, as emphasized during the 27th Conference of the Parties to the United Nations Framework Convention on Climate Change (COP27) [5]. Africa, identified as one of the most climate-vulnerable continents, faces pronounced risks in regions mapped by climate security models like those in [6]; these models highlight nations such as Sudan, South Sudan, Chad, Somalia, Congo, and Niger, along with localized hotspots in Ethiopia, Mauritania, Sierra Leone, Guinea, and Burkina Faso, as acutely susceptible to climate-related threats due to factors such as physical exposure, population density, community resilience, and political violence [7].
Sudan, characterized by its rapid climate variability [8,9], serves as a case study in the interconnectedness of environmental degradation and socio-political challenges. The accurate monitoring of deforestation and land degradation is a key component of global initiatives like the Reducing Emissions from Deforestation and Forest Degradation (UN REDD+) program and the United Nations Convention to Combat Desertification (UNCCD) “Zero Net Land Degradation” strategy, which is critical for mitigating these challenges [10]. Persistent monitoring in regions like Sudan is essential to inform effective interventions aimed at reducing environmental deterioration.
Sudan stands out as particularly susceptible to climate stressors, with internally displaced persons (IDPs) experiencing compounded vulnerabilities due to armed conflict, food insecurity, and extreme weather events [7,11]. Over the past two decades, Sudan has recorded the world’s highest IDP numbers, with figures surpassing 10.4 million by late 2024 owing to escalating conflict and environmental degradation.
Darfur exemplifies the compounded effects of climate stressors and socio-political instability. Geographical and historical factors contribute to Darfur’s susceptibility to intermittent conflicts, stemming from its incorporation into Sudan in 1917 by the British Empire, transforming it from a sultanate into a marginalized region largely overlooked by Sudan’s central powers in Khartoum [12]. The conflict’s root cause, as pointed out by, extends beyond historical marginalization and includes struggles over control of an environment strained by severe water and food shortages due to climatic changes, leading to displacement [13,14]. Most of Darfur’s population resides in the south due to the arid conditions in the north [15]. As of 2024, Sudan has one of the highest numbers of internally displaced persons (IDPs) globally, surpassing 10.4 million due to escalating conflict and environmental challenges [16,17]. This displacement crisis, which has claimed over 5000 lives, is further exacerbated by the degradation of the environment surrounding IDP camps [18]. High population concentrations in these camps intensify anthropogenic impacts on local vegetation, further straining the livelihoods of displaced communities reliant on natural resources. The interplay of persistent drought, rainfall variability, and socio-economic instability has established Darfur as a critical hotspot for land degradation and environmental vulnerability [2,19,20,21,22,23]. These environmental challenges intersect with socio-political dynamics, amplifying vulnerabilities and increasing conflict risks as communities compete for dwindling natural resources [24,25,26]. Addressing these issues requires a comprehensive understanding of vegetation dynamics, climate variability, and their interactions with conflict-induced displacement.
Remote sensing has proven indispensable for monitoring degradation and desertification, particularly in data-scarce regions [27,28]. This technology enables the retrospective and near-real-time analysis of environmental trends, offering critical insights into vegetation changes and their correlation with climatic drivers [29]. Satellite-derived vegetation indices, such as the Enhanced Vegetation Index (EVI), combined with climate metrics like the Standardized Precipitation Evapotranspiration Index (SPEI), are instrumental in linking vegetation dynamics with precipitation patterns [30,31]. These tools are essential for assessing vegetation coverage, monitoring drought, and informing strategies for sustainable land management [32,33].
Drought commonly originates from a deficiency of precipitation, and, as a result, most meteorological drought indices rely primarily on precipitation data [34]. Many of these indices, including the SPI, are widely used in drought assessments due to their simplicity and standardized nature [35,36,37]. However, the SPI does not account for temperature effects on drought, despite growing evidence of the significant role temperature plays in exacerbating drought conditions [38,39]. To address this limitation, ref. [40] developed the SPEI, which integrates Potential Evapotranspiration (PET) and provides a more comprehensive measure of drought severity. Compared to the SPI, the SPEI retains the multi-temporal flexibility of the SPI while improving drought monitoring capabilities by incorporating temperature-driven atmospheric demand for moisture [41]. Comparative performance studies [42,43] indicate that the SPEI is generally more effective than the SPI in detecting drought in regions with high temperature variability, such as Darfur. Given these advantages, the SPEI was selected as the primary drought index for this study. However, future research should consider integrating complementary indices such as the Evaporative Stress Index (ESI) and the Flash Drought Index (FDI) to enhance the detection of extreme climate events, particularly flash droughts.
In this study, we applied non-stationary and nonlinear approaches to analyze drought trends using the Breaks For Additive Seasonal and Trend (BFAST) method [44]. BFAST enables the simultaneous detection of non-stationary trends and breakpoints in drought time series, providing insights into long-term variability and structural changes. While other methods, such as DBEST, can efficiently detect breakpoints and estimate the timing and magnitude of changes, they do not account for seasonal variations in time series data [45]. In contrast, BFAST not only identifies long-term trends and breakpoints, but also effectively captures seasonal components, making it a robust tool for analyzing climatic and environmental changes. In recent years, BFAST has been widely used to assess drought dynamics, vegetation trends, phenological shifts, and ecosystem disturbances [46,47]
In the broader context of environmental peacebuilding, the relationship between resource availability, conflict, and cooperation has been extensively studied. Scholars such as [48] highlight the role of social institutions in regulating natural resource use in conflict-affected regions, while [49] emphasizes the importance of integrating diverse stakeholder perspectives into sustainable development strategies. This research builds upon these frameworks by exploring the potential of climate-change-induced environmental improvements to foster peacebuilding in Darfur. It addresses a critical gap in the literature by examining how long-term environmental trends, driven by increased precipitation and reduced drought intensity, can influence conflict dynamics and promote sustainable peace.
Through a multidisciplinary approach integrating remote sensing and climate analysis, this research aims to contribute to a nuanced understanding of the interconnected factors shaping peace and stability in Darfur. By analyzing vegetation trends and their implications for resource dynamics, this study provides actionable insights into the role of environmental restoration in mitigating resource-based conflicts and fostering resilience in vulnerable regions.
2. Materials and Methods
2.1. Study Area
Darfur is an expansive region in western Sudan, situated between 9°0′–18°56′ north and 23°54′–27°2′ east, sharing borders with Chad, Libya, and the Central African Republic (Figure 1) [50]. Darfur has a total area of approximately 531,304.25 km2, comparable to the size of Thailand. Darfur is divided into five administrative states, namely North Darfur, West Darfur, Central Darfur, South Darfur, and East Darfur (Figure 1).
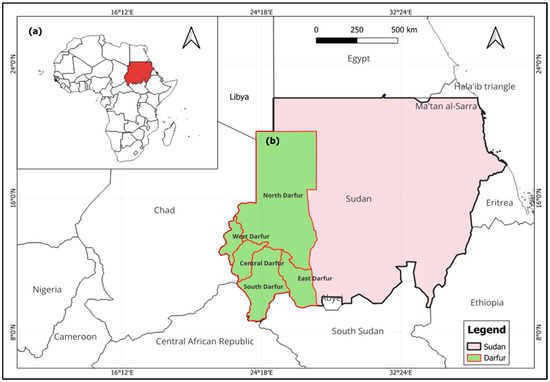
Figure 1.
Map of the study area. (a) Location of Sudan in Africa. (b) Location of Darfur in Sudan and the states of Darfur.
Darfur has a highly variable climate, transitioning from an arid desert climate in the north to a semi-arid and tropical savannah climate in the south. The region experiences a seasonal climate, with the rainy season typically occurring from June to September, peaking between August and September [51]. Rainfall patterns vary significantly across Darfur, with the northern areas receiving considerably less precipitation compared to the southern parts [52]. This variation is strongly influenced by the region’s diverse topography and climate zones. The region is also characterized by high temperatures, often exceeding 40 °C in the dry season, with substantial seasonal and diurnal variations. The elevation of Darfur is diverse, with the Jebel Marra volcanic massif reaching elevations of over 3000 m above sea level (asl) serving as the dominant topographical feature, while the southeastern parts have a low elevation of about 394 m asl (Figure 2b). This mountainous region acts as an important climatic divide, influencing local precipitation patterns. The northern part of Darfur consists of vast desert plains, while the central and southern areas are characterized by rolling savannah landscapes. The soil composition varies across the region, ranging from sandy and nutrient-poor desert soils in the north to more fertile clay and loamy soils in the central and southern areas (Figure 2a). In the Jebel Marra region, volcanic-derived soils are found, which support relatively higher agricultural productivity. However, soil degradation, erosion, and desertification pose significant challenges across the region, particularly in areas with intense land use pressures. The vegetation cover in Darfur reflects the climatic gradient, with sparse desert vegetation in the north, transitioning into acacia woodlands and mixed shrublands in the central region [53]. The southern parts, receiving more rainfall, support savannah grasslands and scattered forests, which play a crucial role in local livelihoods [54,55]. The Jebel Marra highlands host unique montane vegetation, including evergreen forests and high-altitude grasslands, contributing to regional biodiversity [56,57].
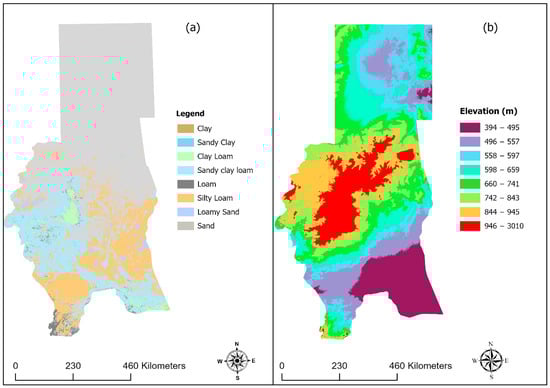
Figure 2.
(a) Soil map and (b) elevation map of Darfur.
Darfur is home to an estimated 7.5 million people residing across the five states. The population is highly diverse, comprising over 160 tribes, each with distinct languages, cultures, and traditions. The Fur, Masaalit, and Zaghawa are among the largest ethnic groups [58]. The region has a long history of conflict, often driven by competition over scarce resources such as land and water. These challenges are exacerbated by political marginalization, weak governance, and environmental pressures, including desertification and recurring droughts [59]. This interplay of factors has led to significant population displacement and humanitarian crises [60].
Despite these adversities, the people of Darfur have demonstrated remarkable resilience, adapting to harsh environmental conditions and striving to build sustainable livelihoods [61]. The economy of Darfur is primarily dependent on agriculture and livestock rearing. Rain-fed agriculture dominates, with key crops including millet, sorghum, and groundnuts [62].
2.2. Data Source and Preprocessing
2.2.1. Vegetation Index
This study utilized the MOD13Q1 (V6.1) vegetation index product, accessed via the Google Earth Engine (GEE) platform (Google LLC, Mountain View, CA, USA) [63]. This product, derived from the Terra Moderate Resolution Imaging Spectroradiometer (MODIS) (NASA, Washington, DC, USA), offers a spatial resolution of 250 m and a temporal resolution of 16 days. The dataset spans the years 2000–2023, with 2000 chosen as the starting year due to the launch of MODIS-EVI, and 2023 as the endpoint due to the availability of the most recent data [64]. The MODIS data includes two bands: Normalized Difference Vegetation Index (NDVI) and Enhanced Vegetation Index (EVI). The EVI band, which minimizes canopy background variations and maintains sensitivity in dense vegetation conditions, was extracted and analyzed to build a mean annual time series using ArcGIS Pro 3.4 (Esri, Redlands, CA, USA). EVI also incorporates the blue band to reduce atmospheric contamination caused by smoke and sub-pixel-thin clouds. The data, atmospherically corrected for bi-directional surface reflectance and masked for water, clouds, heavy aerosols, and shadows, provided a reliable dataset for assessing vegetation dynamics [65]. Elevation data were obtained from the United States Geological Survey (USGS) Earth Explorer (SRTM 30 m resolution) https://earthexplorer.usgs.gov/ (accessed on 10 December 2024), while soil data were sourced from the ISRIC-World Soil Information Database https://www.isric.org/ (accessed on 10 December 2024). Both datasets were processed and analyzed using ArcGIS Pro for spatial assessment and mapping.
2.2.2. Vegetation Trend Analysis
To monitor vegetation health and ecosystem dynamics [66], EVI values were classified into defined ranges: <0 (no vegetation), 0–0.2 (low vegetation), 0.2–0.4 (moderate vegetation), and 0.4–0.5 (high vegetation), based on established NDVI and EVI classification frameworks [67]. Considering the previous studies in Darfur [21,23,68,69], the analysis used mean EVI values from 2000 to 2023 to identify vegetation patterns and health across the study area.
2.2.3. Rainfall and Temperature Dataset
Rainfall data were sourced from the Climate Hazards Group Infra-Red Precipitation with Station (CHIRPS) data, a quasi-global dataset integrating 0.05° resolution satellite imagery with in situ station data for the period 1980–2024 [70]. CHIRPS data enabled the trend analysis and seasonal monitoring of rainfall anomalies.
Temperature data were obtained from the MERRA-2 reanalysis dataset of NASA’s POWER project, which provides 0.5° × 0.625° grid resolution data at 2 m height [71,72]. Covering the years 2000, 2005, 2010, 2015, 2020, and 2024, MERRA-2 integrates modern hyperspectral radiance, GPS radio occultation, and aerosol interaction observations. The dataset facilitated comprehensive assessments of surface air temperature trends, contributing to the analysis of climatic conditions in the study area [73,74].
2.2.4. Drought Analysis
This study utilized the Global 0.5° gridded SPEI database (SPEI-base), which offers a robust measure of drought conditions by combining precipitation and PET data calculated using the FAO-56 Penman–Monteith method [75]. SPEI datasets, accessed via the GEE platform, allowed for the quantification of precipitation deficits at various timescales (monthly to 48 months). The datasets were processed and analyzed using R software to evaluate historical and recent drought patterns in the study area. To capture diverse drought characteristics, this study employed three SPEI timescales. SPEI-6 (Six-Month Scale) represents short- to medium-term droughts, primarily affecting agricultural activities, crop yields, and pastoral systems; SPEI-9 (Nine-Month Scale) reflects prolonged dry periods, influencing groundwater recharge, soil moisture availability, and overall hydrological conditions; and SPEI-12 (Twelve-Month Scale) captures long-term climatic drought trends and their cumulative impacts on ecosystems, resource availability, and socio-economic conditions, including conflict dynamics. Drought frequency, in this study, is defined as the number of drought occurrences over a given period, determined by instances where SPEI values fall below a threshold of −1.0 (moderate drought threshold). This study focuses on moderate-to-extreme droughts and the SPEI index scale is categorized as extreme drought (>−2.0), severe drought (−2.0 to −1.5), and moderate drought (−1.5 to −1.0), as shown in Table 1. A drought event is considered to be ended once SPEI values return to zero or transition into positive territory. The duration of drought is measured by the number of consecutive months in which SPEI remains below the threshold, while the magnitude of SPEI values indicates the severity of the drought event [76,77,78].

Table 1.
Classification of drought intensity based on the SPEI drought index.
2.2.5. Innovative Trend Analysis (ITA)
The Innovative Trend Analysis (ITA) technique [79] was employed to characterize trends in precipitation data without assumptions of normality or serial correlation. Precipitation time series data were divided into two halves (first half = 1980–2022, second half 2002–2024), sorted in ascending order, and plotted on x- and y-axes to assess trend directions. Data aligning along the 1:1 line indicated no trend, while deviations signified upward or downward trends. The ITA calculations were conducted using R software 4.3.2, providing a non-monotonic approach suited to complex climate change contexts [80,81].
2.2.6. Rainfall Time Series Forecasting
Time series forecasting involves analyzing a sequence of observations recorded at consistent intervals to develop models that effectively represent the data’s underlying structure. These models enable accurate predictions, monitoring, and control of the observed phenomena [82]. Various methodologies exist for modeling time series with single seasonal patterns, including ETS (Winters, 1960), ARIMA [83], state-space models [84], and innovation state-space models [85]. The ARIMA model is particularly notable for its ability to forecast time series by utilizing a combination of its past values, previous errors, and, where applicable, current and past values of related variables. It is designed to explain autocorrelation within the data and can be applied to both stationary and non-stationary time series [86].
In this study, ARIMA models were applied using R Statistical Software to predict rainfall patterns in the study area up to the year 2034. ARIMA combines three mathematical components: autoregressive, integrated, and moving-average processes, allowing it to capture complex temporal dependencies [83]. This model provided a robust forecast, supporting the analysis of future climatic conditions in the region.
2.2.7. Breaks for Additive Seasonal and Trend (BFAST) Method
The BFAST method decomposes time series data into three components: seasonality, trend, and residuals, iteratively identifying breakpoints that indicate significant shifts in the data [44]. This approach is widely used to detect long-term trends and structural changes in time series data. The BFAST model is represented in Equation (1):
where t is the observation time. Yt is the observation value at time t. St is a seasonal component, which can be used to monitor the periodic variation of the time series on the annual time scale. Tt is a long-term trend component, which is generally used to detect the gradual change in time series data for more than one year, and there may be some discontinuities in the change process. et denotes the residual component, accounting for random variability due to observation methods and environmental factors. In this study, BFAST analysis was performed using R software to evaluate the SPEI-12 index trends and identify key breakpoints indicating significant shifts in drought conditions in Darfur.
3. Results
3.1. Rainfall
3.1.1. Rainfall Distribution
Figure 3 illustrates the spatial distribution of precipitation across Darfur, classified into three distinct rainfall zones (North, Center, and South) based on the CHIRPS dataset. The North Zone is characterized by low annual rainfall (11–103 mm), the Central Zone receives moderate rainfall (103–220 mm), and the South Zone experiences the highest precipitation amounts (220–650 mm).
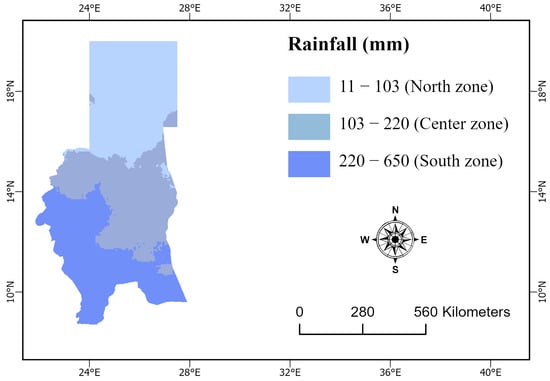
Figure 3.
Rainfall zones of Darfur.
3.1.2. Rainfall Trends
Figure 4 shows the rainfall trends across the three study area zones from 1980 to 2024. The mean annual rainfall in the North Zone shows a gradual increase over the observed period (1980–2024), as evidenced by the positive slope of the trend line (Figure 4). Inter-annual variability is high, with significant peaks in rainfall observed around 1988, 1996, 2002, and 2023. Notably, recent years (post 2015) show more frequent occurrences of above-average rainfall, suggesting an intensification of rainfall events in this region. Rainfall in the Center Zone demonstrates a clear upward trend over the study period, with the trend line showing a steady increase. Like the North Zone, this region also exhibits significant inter-annual variability, with pronounced peaks in rainfall during the early 2000s and 2015. This trend suggests a gradual increase in average rainfall, indicating a shift in precipitation patterns in this zone. The South Zone shows a less pronounced increase in rainfall compared to the North and Center Zones. While the trend line indicates a slight upward slope, the inter-annual variability is substantial, with several years experiencing extreme rainfall events (1988 and 2002). Unlike the North and Center Zones, the South Zone appears to have more stable rainfall levels, with fewer noticeable changes in the magnitude of peaks and troughs over time (Figure 4).
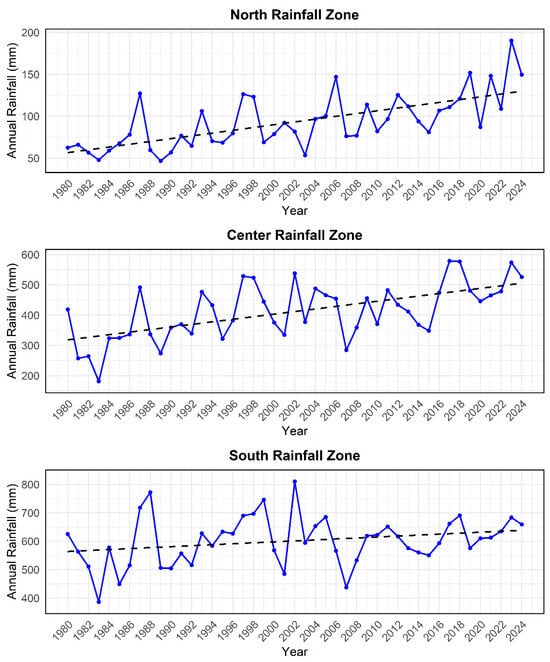
Figure 4.
Rainfall trends across the three zones of Darfur (1980–2024). The solid blue lines represent the actual mean annual rainfall trends while the dashed black lines indicate the linear trend in annual rainfall over the study period.
The increasing trends in all three zones highlight a regional rise in annual rainfall. However, the degree of variability and the steepness of the trend differ across zones, with the North and Center Zones showing more pronounced upward trends compared to the South Zone.
3.1.3. Spatio-Temporal Variability in Rainfall Pattern
The spatial variability in rainfall patterns for the first half of the study period (1980–2002) and the second half (2002–2024) in Darfur were performed using the ITA method for the three rainfall zones, and are displayed in Figure 5. Both the North and Center rainfall zones show a stronger increasing trend in rainfall in the second half of the study period (2002–2024), with a noticeable shift away from balanced distributions over time. On the other hand, the South Zone’s rainfall distribution appears to be more stable across the first and second half of the study years, showing an increasing trend in low rainfall amount (400–600 mm) in both halves, with only a slight decrease in high rainfall amount (700–750 mm) (Figure 5).
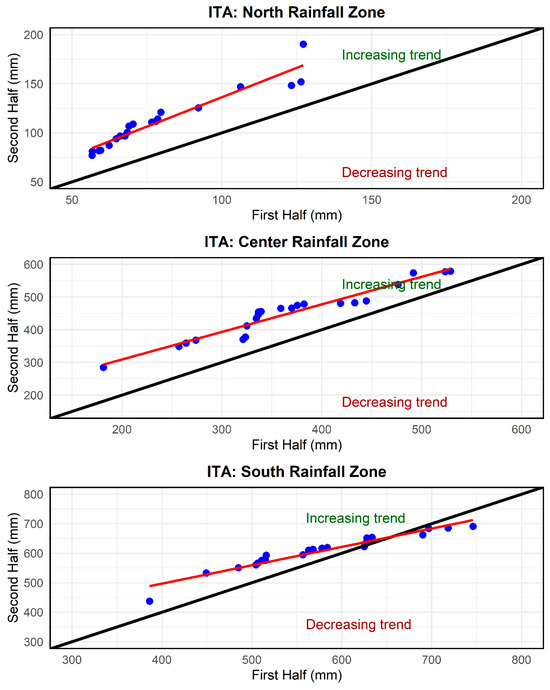
Figure 5.
Spatio-temporal analysis of rainfall patterns in Darfur (1980–2002; 2002–2024). The blue dots represent annual rainfall values, black diagonal line represents the 1:1 line while the red trend lines show the overall trend in rainfall changes across the study period.
3.1.4. Rainfall Forecast
The rainfall forecast for 2025–2034 reveals distinct trends across the North, Center, and South rainfall zones (Figure 6). In the North Zone, rainfall is projected to stabilize around 130–140 mm annually, with moderate uncertainty suggesting potential variations between 110 mm and 175 mm. This aligns with the observed historical upward trend, highlighting sustained high rainfall levels. The Center Zone forecast indicates a more predictable pattern, with annual rainfall stabilizing near 500 mm and a narrower uncertainty range of 400–700 mm. In contrast, the South Zone is characterized by significant variability, with projected averages around 650 mm, but a wide uncertainty interval ranging from 500 mm to 750 mm. Across all zones, rainfall averages appear to stabilize near recent historical peaks, though extreme events remain a concern, particularly in the North and South Zones (Figure 6).
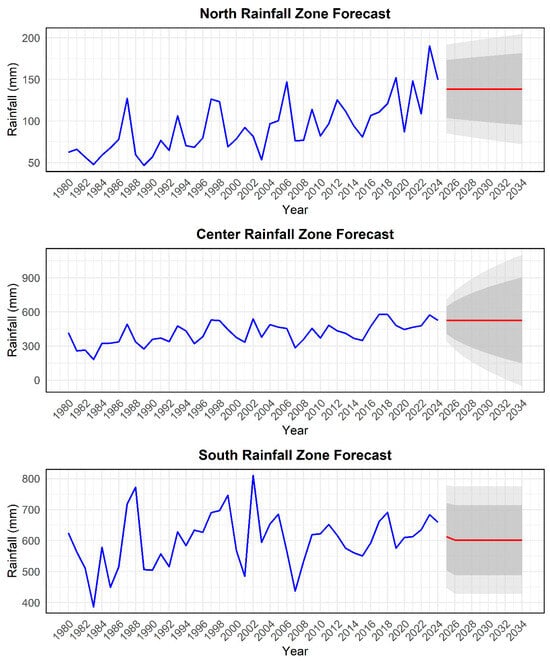
Figure 6.
Rainfall forecasts (2025–2034) in the three zones of Darfur. The blue line represents historical annual rainfall trends from 1980 to 2024, the red line indicates the predicted mean rainfall for the period 2025–2034 and the shaded grey area represents the forecast uncertainty intervals, with darker grey indicating higher confidence and lighter grey showing wider uncertainty ranges.
3.2. Temperature Trends
Analysis of temperature trends across the North, Center, and South Zones of Darfur from 1980 to 2024 reveals distinct but consistent warming patterns (Figure 7). In all three zones, maximum temperatures (red line) exhibit a gradually increasing trend, with the highest values recorded in the South Zone, reaching approximately 45 °C in recent years (2024). The Center Zone follows closely with a maximum temperature of around 43 °C, while the North Zone records slightly lower peak temperatures, hovering around 42 °C.
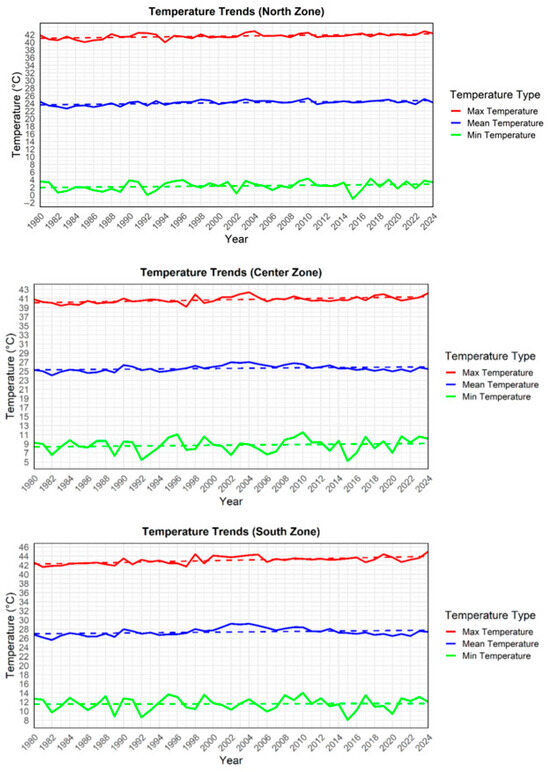
Figure 7.
Temperature trends in the North, Center, and South Zones of Darfur from 1980 to 2024. The dotted lines indicate the overall trend for each temperature type, showing long-term changes in temperature patterns.
Mean temperature trends (blue line) display a relatively stable pattern across all zones, with minor fluctuations over the years. However, a slight warming trend is observed, particularly in the South Zone, where mean temperatures approached 30 °C. The Center and North Zones follow a similar trend, with mean temperatures remaining between 24 °C and 27 °C.
Minimum temperatures (green line) vary significantly across the zones, but also indicate a gradual warming trend. The North Zone experiences the lowest minimum temperatures, occasionally dropping below 0 °C, particularly in 2015. The Center and South Zones show relatively higher minimum temperatures, with the South Zone exhibiting the least variability. Notably, the trend suggests a general reduction in extreme cold events, particularly after 2010, aligning with broader regional warming trends.
Overall, temperature trends indicate a warming climate across all zones, with maximum temperatures rising steadily, mean temperatures showing moderate increases, and minimum temperatures experiencing fewer extreme cold events (Figure 7).
3.3. Drought Analysis Results
Figure 8 illustrates the SPEI values over 6-month, 9-month, and 12-month timescales, highlighting patterns of drought and wet conditions in the study region from 1980 to 2024. SPEI is a measure used to assess drought conditions, with positive values (blue bars) indicating wetter-than-average conditions and negative values (red bars) indicating drier-than-average conditions. The SPEI analysis reveals a pronounced alternation between periods of drought and wet conditions across all three timescales, with some key patterns emerging over the decades. From 1980 to the early 2000s, negative SPEI values (red bars) dominated the study area, indicating persistent and severe drought conditions, especially during the 1980s and 1990s.
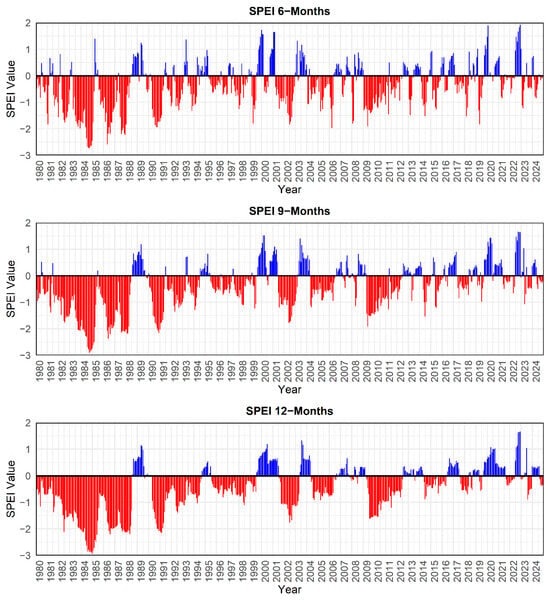
Figure 8.
SPEI trends over 6-month, 9-month, and 12-month timescales in Darfur showing variation in duration, severity, and intensity of dry and wet conditions. The red bars represent negative SPEI values (drought periods) while the blue bars represent positive SPEI values, indicating wet conditions (above-average moisture availability). The variations in bar length and frequency across different timescales illustrate fluctuations in drought and wet periods over time.
Post 2000, there is a visible increase in positive SPEI values (blue bars), reflecting a shift toward wetter conditions. However, this recovery is intermittent, with drought episodes continuing to recur (2002, 2009), albeit less intensely than in earlier decades. The frequency and magnitude of wet events become more pronounced in the later years, particularly from 2010 onward, suggesting a potential trend of climatic variability leaning toward more balanced or wetter conditions.
The consistency of these patterns across the 6-month, 9-month, and 12-month timescales indicates the robustness of the findings. The longer timescale (12-month SPEI) captures more prolonged trends, reinforcing the observation of a gradual decrease in drought severity over recent decades.
3.3.1. Drought Intensity
Drought intensity in the study area was classified into five categories based on the SPEI values: no drought, mild drought, moderate drought, severe drought, and extreme drought. Analysis using the SPEI index revealed that mild drought was the most prevalent drought category on both an annual and seasonal basis. This was followed by normal conditions, with recent years showing a reduction in drought severity. The most intense drought events occurred between 1982 and 1993, with frequent occurrences of severe and moderate droughts. These dry periods were intermittently interrupted by wet conditions, particularly in 1989, as shown in Figure 9.
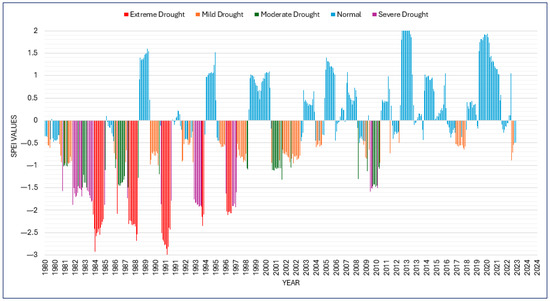
Figure 9.
Intensity of drought events in Darfur (1980–2024).
3.3.2. Temporal Variation of Drought
The BFAST decomposition of the SPEI-12 index identified four significant breakpoints in the Darfur drought time series, occurring in 1987, 2002, 2009, and 2017 (Figure 10). This indicates that drought conditions in the region are non-stationary. Between 1980 and 1987, a downward trend in SPEI values was observed, indicating an intensification of drought conditions. From 1987 to 2002, a substantial increase in SPEI values was noted, suggesting a gradual weakening of drought intensity and improved moisture availability. Between 2002 and 2009, there was a slight increase in SPEI values, indicating a transition toward relatively humid conditions, but with sudden drought events in 2002 and 2009. From 2009 to 2017, there was a substantial increase in SPEI values, reaching the highest levels recorded, indicating a long-term trend toward reduced drought severity and a shift toward stable climatic conditions. Overall, the SPEI breakpoints reveal a general increase in moisture availability over time, except for the initial period (1980–1987), which exhibited an intensification of drought. However, sudden drought events in 2002 and 2009 indicate the influence of climate variability, requiring further investigation into short-term climatic drivers.
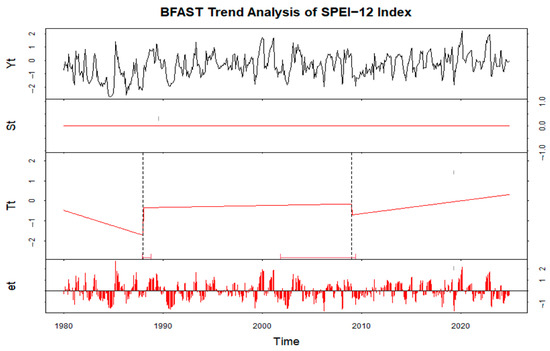
Figure 10.
BFAST analysis results of drought in Darfur from 1980 to 2024. Yt (top panel, black line) = The original time series of the SPEI-12 index, showing overall drought variability; St (Second panel, red line) = seasonal component, which appears constant, indicating no significant seasonal pattern in the data; Tt (third panel, red line with dashed vertical lines) = the trend component, capturing long-term changes. The dashed vertical lines indicate breakpoints, where significant shifts in the trend occurred; et (bottom panel, red bars) = The residual component, representing unexplained variations or noise in the data.
3.4. Vegetation Cover
3.4.1. EVI Classification Statistics and Maps
Table 2 shows the EVI statistics for the different vegetation classes over the study years (2000–2023). The EVI classification results revealed notable temporal changes in vegetation cover over the 23 years. The no-vegetation class exhibited a substantial decline in area, reducing from 262,131.31 km2 (49.34%) in 2000 to 205,242.44 km2 (38.63%) in 2023. Areas with low vegetation fluctuated over the study years, starting at 147,671.25 km2 (27.79%) in 2000 and decreasing to 132,593.88 km2 (24.96%) in 2023. Conversely, moderate vegetation showed a marked increase from 95,478.63 km2 (17.97%) in 2000 to 133,160.88 km2 (25.06%) in 2023, while high-vegetation areas similarly expanded from 26,023.06 km2 (4.90%) in 2000 to 60,307.06 km2 (11.35%) in 2023. Between 2000 and 2010, the proportion of moderate and high vegetation fluctuated, with noticeable increases by 2023. The most pronounced improvements in vegetation occurred between 2015 and 2023, coinciding with a consistent reduction in no-vegetation and low-vegetation areas (Table 2).
Table 2.
EVI statistics for the different vegetation classes in Darfur from 2000 to 2023.
Figure 11 illustrates the spatial distribution of EVI classes across Darfur for the years 2000, 2005, 2010, 2015, 2020, and 2023. It provides a visual representation of the temporal changes in vegetation cover in Darfur over the study period. The no-vegetation class predominates across northern Darfur, but its extent visibly decreases over time. Low vegetation is concentrated in transitional zones, with a mixed pattern of stability and slight reductions by 2023 (Figure 11). Moderate vegetation showed a noticeable expansion, particularly in southern Darfur and the eastern parts of Darfur, indicating progressive recovery in vegetation cover, while high vegetation is primarily found in the southern regions, with marked growth over time, reflecting improvements in dense vegetation. Overall, the visual patterns corroborate the quantitative findings of this study (Table 2), emphasizing a clear greening trend in Darfur over the past two decades.
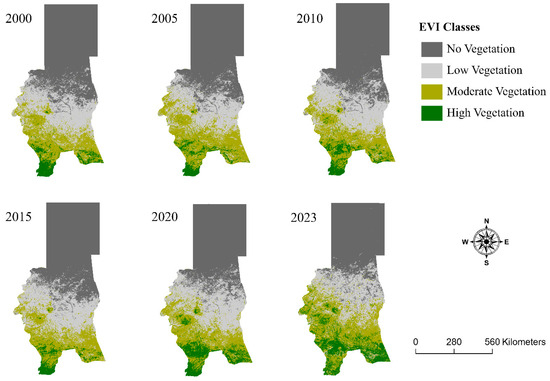
Figure 11.
Spatial distribution of vegetation cover classes across Darfur from 2000 to 2023.
3.4.2. Spatial Distribution of Vegetation Cover Change
Figure 12 visualizes the spatial patterns of vegetation change in Darfur from 2000 to 2023. It categorizes the study area into three distinct classes based on vegetation changes: improved areas (green), degraded areas (red), and unchanged areas (blue). These classifications reflect the dynamics of vegetation cover over the 23 years. Improved areas, which account for 33.19% of the total land area, are predominantly concentrated in southern Darfur. These regions exhibit significant recovery in vegetation, attributed to increased precipitation and reduced drought severity during the study period. The observed greening aligns with the EVI trends, indicating enhanced vegetation health and density. In contrast, degradation areas represent 1.95% of the total area and are mainly scattered across the southwestern and localized northern parts of Darfur. These regions are characterized by reduced vegetation cover, likely driven by persistent anthropogenic pressures, such as overgrazing, land mismanagement, and localized climatic stressors. Unchanged areas constitute the majority, covering 64.86% of the study area, primarily in the central and northern regions of Darfur (Figure 12). These areas exhibit minimal to no significant changes in vegetation over the two decades, reflecting relatively stable environmental conditions or limited human activity.
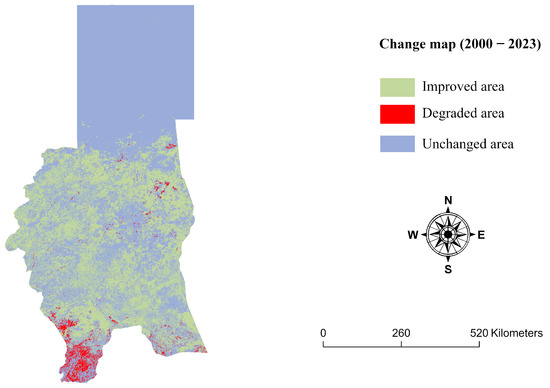
Figure 12.
Spatial patterns of vegetation cover change in Darfur from 2000 to 2023.
4. Discussion
4.1. Climate Change in Darfur
Different trends in climatic conditions were observed in Darfur in the present study. There was varied rainfall distribution with an increasing trend from the north to the south in the study area. This finding is in line with earlier findings by [52], who noted significant variations in precipitation across Darfur, with the northern areas receiving considerably less precipitation compared to the southern parts. Low rainfall in the North Zone aligns with arid desert landscapes and is predominantly unsuitable for significant crop and vegetation growth. The Center Zone transitions into semi-arid conditions due to moderate rains supporting sparse vegetation and pastoral activities, while the South Zone fosters relatively dense vegetation cover and agricultural activities because of the high rainfall. The spatial variability of rainfall highlights the critical role of precipitation in shaping land cover and ecological processes in Darfur’s arid and semi-arid environments.
The CHIRPS data facilitated trend analysis and the seasonal monitoring of rainfall anomalies, providing critical insights into precipitation patterns influencing vegetation dynamics and drought severity. The increasing rainfall trends in all three zones highlight a regional rise in annual rainfall amounts, consistent with broader climatic shifts in the study region. Significant variations in the rainfall patterns in some parts of Darfur and Sudan have previously been reported by earlier researchers [23,87].
The ITA analysis showed an increasing rainfall trend in the second half of the study period compared to the first half. These findings corroborate with the SPEI drought analysis results, which depicted severe droughts between 1980 and 2002. The first-half period corresponds to known historical drought events in the region, which likely had significant socio-economic and ecological impacts. A decrease in the frequency and severity of drought episodes since 2011 has been similarly noted in other studies. For instance, ref. [88] documented a reduction in drought severity and frequency in recent years, consistent with the observed trends in the current study. These findings collectively underscore the interconnected nature of precipitation patterns, vegetation recovery, and broader environmental and socio-economic dynamics in Sudan.
Although drought is not a direct cause of conflict, its impact on resource availability, particularly water and arable land, can intensify tensions among competing groups. Historical evidence and previous studies on Darfur’s conflict dynamics related to drought severity indicated that the moderate drought events tend to cause localized resource scarcity, but are often managed through traditional coping mechanisms [20,89]. Severe drought events have been associated with increased migration, heightened tensions between farmers and pastoralists, and growing pressure on IDPs [90,91,92]. Extreme drought events correlate with large-scale displacement, intensified competition over resources, and an increased risk of violent conflict, as witnessed in previous drought-induced crises [93,94,95]. These findings align with [96], who conducted a study on drought patterns in Sudan and South Sudan using the SPEI. Their research identified mild drought as the dominant drought category, like our findings. They also reported that, while Sudan has experienced rising temperatures and decreasing precipitation, the frequency of drought events has declined in recent years. Additionally, ref [9] used the SPI to assess drought characteristics and vegetation dynamics in arid and semi-arid regions of Sudan. Their study highlighted that dry periods were most frequent in the 1980s, with extreme droughts occurring between 1982 and 1987. In contrast, wetter conditions became more prevalent after the mid-1990s, which aligns with the decreasing drought severity observed in our study. These findings reinforce the need for long-term monitoring and adaptive management strategies to mitigate the socio-economic impacts of drought and minimize its potential role in exacerbating resource-based conflicts in Darfur. Long-term trends in SPEI indicate prolonged periods of drought or wet conditions, leading to delayed responses in vegetation growth, soil health, and water resources. Different regions experience varying trends in SPEI, with some areas becoming drier, while others become wetter. These shifts influence local ecosystems differently, resulting in diverse lag effects based on specific environmental conditions [97].
The temperatures in Darfur showed a region-wide warming trend, consistent with regional and global climate change projections. Previous research [23] reported a steady increase in temperature in the Zalingei and Zam Zam regions of Darfur over the past three decades, with an estimated 0.4 °C temperature rise per decade. The observed temperature increases may impact agricultural productivity and vegetation growth, and influence regional hydrology, especially when combined with rainfall variability.
As for the vegetation cover in Darfur, there was an observed reduction in the no-vegetation and low-vegetation classes in Darfur. This reduction suggests a gradual transition from sparse to denser vegetation classes in parts of the study area. The sharp growth in areas under high vegetation cover further underscores substantial ecological recovery and vegetation densification in some regions of Darfur. The rainfall forecast suggests sustained high rainfall levels in the study area, which can further improve the vegetation cover in the study area.
The existing literature provides valuable context for understanding the interplay between environmental changes and socio-economic factors in Sudan. Ref. [98] explored land rehabilitation efforts across various regions of Sudan, offering comparative insights into vegetation recovery. Similarly, ref. [5] identified climate-induced security vulnerabilities across Africa, highlighting how environmental shifts interact with socio-political factors to exacerbate overall vulnerability. Ref. [49] provided a relevant perspective on the transition from fragility to sustainable development in Darfur, emphasizing the socio-economic implications of environmental recovery.
This study’s findings were further corroborated by [99], who examined interdecadal variations in precipitation and their influence on vegetation recovery in agricultural zones, demonstrating a strong correlation between rainfall distribution and vegetation indices. Similarly, ref. [100] assessed the long-term effects of climate variability, revealing positive NDVI–precipitation correlations in arid and semi-arid regions, consistent with the results of this research. Observed temperature distribution patterns in the study area also align with [101], further substantiating the identified climatic trends.
Darfur’s climatic variability is not solely driven by temperature and precipitation influences, but is also shaped by its topography and geomorphology. Variations in elevation and landform structure influence orographic rainfall, with higher elevations like the Jebel Marra volcanic mountain receiving more precipitation, supporting greater vegetation cover and diversity compared to the lower elevations [53]. Additionally, soil types and drainage patterns impact water retention, affecting drought severity [102]. The presence of sandy soils in the north versus clayey soils in the south of Darfur, for instance, determines groundwater recharge rates and vegetation resilience. These localized factors further help to explain spatial differences in vegetation recovery and drought persistence within the study area.
4.2. The Potential of Climate-Change-Induced Environmental Recovery in Mitigating Resource-Based Conflict in Darfur
The findings of this study illuminate the intricate relationship between climate change, environmental conditions, and conflict dynamics in Darfur. The observed trend of increased vegetation, coupled with reduced drought intensity and higher precipitation levels, offers a promising avenue for mitigating resource-based conflicts. By alleviating resource scarcity, a primary driver of tension between agricultural and pastoral communities, these environmental improvements may contribute to reducing the pressures that often escalate into violence. However, while these positive environmental shifts provide opportunities, they are not a standalone solution to achieving peace in Darfur. The region’s conflict is deeply rooted in socio-political factors, such as historical grievances, political marginalization, and weak governance [103,104]. Addressing these underlying causes is essential for ensuring that environmental improvements translate into sustainable peace. Environmental changes, if not managed equitably, could introduce new challenges. For instance, shifts in land use patterns arising from increased vegetation might lead to new sources of conflict if access to these resources is not distributed fairly. Climate variability directly impacts agro-pastoral livelihoods, shaping resource availability, migration patterns, and intercommunal relations [105]. Increased precipitation in recent years has led to improved pasture conditions and water access, reducing pressure on pastoralist migration routes and potentially mitigating resource-based conflicts. However, some historical drought periods (2002, 2009) coincided with intensified competition over land and water, highlighting the fragile balance between environmental recovery and conflict recurrence. Favorable climatic conditions may encourage cropland expansion into traditional grazing zones, leading to renewed disputes between farmers and herders [106]. Enhanced vegetation cover could alter traditional migratory routes, creating new patterns of land use tension. Climate recovery alone therefore does not guarantee stability; government policies on land tenure and resource management will determine whether these changes reduce or exacerbate conflicts.
The sustainability of these positive environmental trends is also uncertain. Continued monitoring and adaptive management are vital to prevent the reversal of gains made in vegetation recovery and precipitation levels [48]. Policymakers must prioritize integrating environmental considerations into peacebuilding efforts, which include promoting sustainable land management practices, equitable resource distribution, and robust local institutions for conflict resolution [49].
The results align with the existing literature emphasizing the critical role of environmental factors in exacerbating resource-based conflicts in Darfur. Numerous studies highlight the impact of climate change on desertification, declining rainfall, and increased resource competition, all of which have fueled instability and tension. Climate-induced resource scarcity disrupts traditional coexistence between sedentary farmers and nomadic tribes, increasing tensions and competition over arable land and water [107]. Drought and desertification exacerbate vulnerabilities, intensifying ethnic tensions and fueling political instability. Erratic rainfall and prolonged droughts reduce agricultural productivity, undermining societal resilience and heightening the risk of armed conflict [108]. Economic shocks and forced displacement due to climate-induced food and water insecurity further destabilize the region [26,109]. Resource scarcity undermines cooperative trade and fosters competition over dwindling resources, particularly between farmers and herders [110]. These studies collectively underscore the importance of addressing climate change as a critical driver of conflict while recognizing its intersection with socio-political vulnerabilities.
Global climate scenarios such as Shared Socioeconomic Pathways (SSPs) [111] and Representative Concentration Pathways (RCPs) [112] offer critical insights into potential future climate trajectories and their implications for vegetation dynamics in arid regions such as Darfur. Under low-emission scenarios (SSP1-2.6 and SSP2-4.5), climate projections suggest stable or slightly increasing precipitation patterns, which could support and further enhance the observed vegetation recovery. Conversely, under high-emission scenarios (SSP3-7.0 and SSP5-8.5), rising temperatures, increased evapotranspiration, and shifting precipitation regimes may counteract recent vegetation gains, accelerate land degradation, and intensify resource competition. While ARIMA-based forecasting effectively captures short-term and medium-term precipitation trends, long-term climate projections indicate the need for continuous monitoring and adaptive management to mitigate the potential adverse effects of climate variability on Darfur’s ecosystems. This underscores the importance of integrating climate scenario analyses into future research to develop targeted strategies for sustaining vegetation recovery and enhancing climate resilience in the region.
5. Conclusions
This study provides critical insights into the complex interrelationship between environmental changes, climate dynamics, and conflicts in Darfur. The observed trends of increased vegetation, higher precipitation, and reduced drought intensity present an opportunity to address the region’s longstanding resource-based conflicts. These positive environmental shifts hold the potential to alleviate resource scarcity, a significant driver of tensions between agricultural and pastoral communities. However, the findings also emphasize that environmental improvements alone cannot resolve Darfur’s deep-rooted socio-political challenges, including historical grievances, political marginalization, and weak governance. To build sustainable peace in Darfur, an integrated approach is required, one that combines environmental restoration with socio-political reforms. Policy interventions must prioritize sustainable land management and equitable access to resources, and strengthen local institutions to mediate conflicts. Addressing underlying socio-political issues, such as inclusive governance and equitable development, is equally vital.
By highlighting the intricate interplay between environmental changes and conflict, this research contributes to a nuanced understanding of the pathways to resilience and stability in Darfur. It provides a foundation for policymakers and stakeholders to develop comprehensive strategies that address both the immediate and systemic drivers of instability, fostering sustainable peace in the region. This study also underscores the importance of adaptive management and continuous monitoring to sustain environmental gains and respond effectively to emerging challenges.
Future research should focus on understanding the long-term impacts of climate-induced environmental changes, tailoring interventions to the diverse needs of Darfur’s communities, and exploring the role of international cooperation in addressing interconnected environmental and socio-political challenges. Future studies should consider integrating Sentinel-2 NDVI/EVI to enhance the spatial resolution of vegetation analysis while maintaining MODIS EVI for long-term trend continuity. Additionally, incorporating NASA POWER climate data alongside existing datasets could improve the precision of climate assessments, providing finer-scale insights into temperature and precipitation variability. This multi-source approach would enhance the accuracy of environmental monitoring and support more detailed analyses of vegetation–climate interactions in arid and semi-arid regions.
Author Contributions
Conceptualization, A.A.; Methodology, A.A. and B.R.; Formal analysis, A.A.; Visualization, A.A. and B.R.; Writing—original draft, A.A. and B.R.; Writing—review and editing, B.R, A.A. and K.C.; Supervision, K.C. All authors have read and agreed to the published version of the manuscript.
Funding
This research received funds from “the project TKP2021-NVA-13 which has been implemented with the support provided by the Ministry of Culture and Innovation of Hungary from the National Research, Development and Innovation Fund, financed under the TKP2021-NVA funding scheme”.
Data Availability Statement
Data are contained within the article.
Acknowledgments
We extend our heartfelt gratitude to the Sudanese Ministry of Higher Education and Scientific Research for their academic support. Additionally, we thank the Tempus Public Foundation and the University of Sopron for awarding a PhD scholarship to the first author.
Conflicts of Interest
The authors declare no conflicts of interest regarding this article.
References
- Marou, V.; Vardavas, C.I.; Aslanoglou, K.; Nikitara, K.; Plyta, Z.; Leonardi-Bee, J.; Atkins, K.; Condell, O.; Lamb, F.; Suk, J.E. The Impact of Conflict on Infectious Disease: A Systematic Literature Review. Confl. Health 2024, 18, 27. [Google Scholar] [CrossRef]
- Almulhim, A.I.; Alverio, G.N.; Sharifi, A.; Shaw, R.; Huq, S.; Mahmud, J.; Ahmad, S.; Rimi Abubakar, I. Climate-Induced Migration in the Global South: An in Depth Analysis. Npj Clim. Action 2024, 3, 47. [Google Scholar] [CrossRef]
- Xu, L.; Famiglietti, J.S.; Li Xu, C.; Mirumachi, N.; Editor, A.; Jepson, W.; Seibert, J. Global Patterns of Water-driven Human Migration. Wiley Interdiscip. Rev. Water 2023, 10, e1647. [Google Scholar] [CrossRef]
- Palinkas, L.A. Fleeing Drought: The Great Migration to Europe. In Global Climate Change, Population Displacement, and Public Health; Springer: Berlin, Germany, 2020; pp. 71–98. [Google Scholar] [CrossRef]
- Arora, P.; Arora, N.K. COP27: A Summit of More Misses than Hits. Environ. Sustain. 2023, 6, 99–105. [Google Scholar] [CrossRef]
- Busby, J.W.; Cook, K.H.; Vizy, E.K.; Smith, T.G.; Bekalo, M. Identifying Hot Spots of Security Vulnerability Associated with Climate Change in Africa. Clim. Change 2014, 124, 717–731. [Google Scholar] [CrossRef]
- Basheer, M.; Elagib, N.A. Armed Conflict as a Catalyst for Increasing Flood Risk. Environ. Res. Lett. 2024, 19, 104034. [Google Scholar] [CrossRef]
- Trummer, U.; Ali, T.; Mosca, D.; Mukuruva, B.; Mwenyango, H.; Novak-Zezula, S. Climate Change Aggravating Migration and Health Issues in the African Context: The Views and Direct Experiences of a Community of Interest in the Field. J. Migr. Health 2023, 7, 100151. [Google Scholar] [CrossRef] [PubMed]
- Alriah, M.A.A.; Bi, S.; Nkunzimana, A.; Elameen, A.M.; Sarfo, I.; Ayugi, B. Assessment of Observed Changes in Drought Characteristics and Recent Vegetation Dynamics over Arid and Semiarid Areas in Sudan. Theor. Appl. Climatol. 2024, 155, 3541–3561. [Google Scholar] [CrossRef]
- Ferrari, G.; Ai, P.; Alengebawy, A.; Marinello, F.; Pezzuolo, A. An Assessment of Nitrogen Loading and Biogas Production from Italian Livestock: A Multilevel and Spatial Analysis. J. Clean. Prod. 2021, 317, 128388. [Google Scholar] [CrossRef]
- Abugabr Elhag, H.E.E.; Baleela, R.M.H. Preliminary Investigation and Analysis of the Impact of the Sudan War on Higher Education and Scientific Research Sectors. Int. J. Educ. Dev. 2024, 112, 103190. [Google Scholar] [CrossRef]
- Robyn, S. The Water Scarcity-Conflict Nexus: The Case of Darfur. Ph.D. Thesis, Stellenbosch University, Stellenbosch, South Africa, 2017; pp. 1–146. [Google Scholar]
- Bromwich, B. Power, Contested Institutions and Land: Repoliticising Analysis of Natural Resources and Conflict in Darfur. J. East. Afr. Stud. 2018, 12, 1–21. [Google Scholar] [CrossRef]
- Mirumachi, N.; Sawas, A.; Workman, M. Unveiling the Security Concerns of Low Carbon Development: Climate Security Analysis of the Undesirable and Unintended Effects of Mitigation and Adaptation. Clim. Dev. 2020, 12, 97–109. [Google Scholar] [CrossRef]
- Linke, J. Women in Peace and Transition Processes. Sudan, Darfur (2009–2017). Inclusive Peace & Transition Initiatives 2018. pp. 1–16. Available online: https://repository.graduateinstitute.ch/record/296601?v=pdf (accessed on 7 January 2025).
- ACAP. Thematic Report: Sudan’s Impact of the Current Conflict on WASH Needs. In ACAPS Analysis Hub. 2023. Available online: https://www.Acaps.Org/Fileadmin/Data_Product/Main_media/20230911_ACAPS_thematic_report_Sudan_impact_of_current_conflict_on_WASH_needs.pdf (accessed on 19 December 2024).
- OCHA Sudan Humanitarian Update (29 July 2024) [EN/AR]|OCHA. Available online: https://www.unocha.org/publications/report/sudan/sudan-humanitarian-update-29-july-2024 (accessed on 17 November 2024).
- Hagenlocher, M.; Lang, S.; Tiede, D. Integrated Assessment of the Environmental Impact of an IDP Camp in Sudan Based on Very High Resolution Multi-Temporal Satellite Imagery. Remote Sens. Environ. 2012, 126, 27–38. [Google Scholar] [CrossRef]
- Hardt, J.N.; Scheffran, J. Environmental Peacebuilding and Climate Change: Peace and Conflict Studies at the Edge of Transformation. Policy Brief 2019, 68, 1–20. [Google Scholar]
- Akasha, M. Darfur: A Tragedy of Climate Change; Anchor Academic Publishing: Hamburg, Germany, 2013. [Google Scholar]
- Ahmed, A.; Rotich, B.; Czimber, K. Assessment of the Environmental Impacts of Conflict-Driven Internally Displaced Persons: A Sentinel-2 Satellite Based Analysis of Land Use/Cover Changes in the Kas Locality, Darfur, Sudan. PLoS ONE 2024, 19, e0304034. [Google Scholar] [CrossRef]
- Younis, A.Y.I.; Jonathan, B.N.; Togun, A.O.; Yasin, E.H.E.; Omer, S.O.; Hamad, G.E.A.I.; Aïssata, S.D. Assessment of Land Use and Land Cover Change on Gum Talha (Acacia Seyal Var. Seyal) Forest in Bahar Alarab, Sudan. Biodiversitas 2022, 23, 4549–4560. [Google Scholar] [CrossRef]
- Kranz, O.; Sachs, A.; Lang, S. Assessment of Environmental Changes Induced by Internally Displaced Person (IDP) Camps in the Darfur Region, Sudan, Based on Multitemporal MODIS Data. Int. J. Remote Sens. 2015, 36, 190–210. [Google Scholar] [CrossRef]
- OCHA Sudan OCHA: The Sudan Humanitarian Fund. Available online: https://www.unocha.org/sudan (accessed on 17 November 2024).
- Solomon, N.; Birhane, E.; Gordon, C.; Haile, M.; Taheri, F.; Azadi, H.; Scheffran, J. Environmental Impacts and Causes of Conflict in the Horn of Africa: A Review. Earth Sci. Rev. 2018, 177, 284–290. [Google Scholar] [CrossRef]
- Xie, X.; Hao, M.; Ding, F.; Scheffran, J.; Ide, T.; Maystadt, J.F.; Qian, Y.; Wang, Q.; Chen, S.; Wu, J.; et al. The Impacts of Climate Change on Violent Conflict Risk: A Review of Causal Pathways. Environ. Res. Commun. 2024, 6, 112002. [Google Scholar] [CrossRef]
- AbdelRahman, M.A.E. An Overview of Land Degradation, Desertification and Sustainable Land Management Using GIS and Remote Sensing Applications. Rend. Lincei. Sci. Fis. Nat. 2023, 34, 767–808. [Google Scholar] [CrossRef]
- D’Acunto, F.; Marinello, F.; Pezzuolo, A. Rural Land Degradation Assessment through Remote Sensing: Current Technologies, Models, and Applications. Remote Sens. 2024, 16, 3059. [Google Scholar] [CrossRef]
- Dubovyk, O. The Role of Remote Sensing in Land Degradation Assessments: Opportunities and Challenges. Eur. J. Remote Sens. 2017, 50, 601–613. [Google Scholar] [CrossRef]
- Ahmed, T.; Singh, D. Probability Density Functions Based Classification of MODIS NDVI Time Series Data and Monitoring of Vegetation Growth Cycle. Adv. Space Res. 2020, 66, 873–886. [Google Scholar] [CrossRef]
- Majdaldin, A.R.; Osunmadewa, B.A.; Csaplovics, E.; Aralova, D. Remote Sensing-Based Vegetation Indices for Monitoring Vegetation Change in the Semi-Arid Region of Sudan. In Remote Sensing for Agriculture, Ecosystems, and Hydrology XVIII; SPIE: Bellingham, WA, USA, 2016; Volume 9998, pp. 609–617. [Google Scholar] [CrossRef]
- Camps-Valls, G.; Campos-Taberner, M.; Moreno-Martínez, Á.; Walther, S.; Duveiller, G.; Cescatti, A.; Mahecha, M.D.; Muñoz-Marí, J.; García-Haro, F.J.; Guanter, L.; et al. A Unified Vegetation Index for Quantifying the Terrestrial Biosphere. Sci. Adv. 2021, 7, eabc7447. [Google Scholar] [CrossRef] [PubMed]
- Villarroya-Carpio, A.; Lopez-Sanchez, J.M.; Engdahl, M.E. Sentinel-1 Interferometric Coherence as a Vegetation Index for Agriculture. Remote Sens. Environ. 2022, 280, 113208. [Google Scholar] [CrossRef]
- Schyns, J.F.; Hoekstra, A.Y.; Booij, M.J. Review and Classification of Indicators of Green Water Availability and Scarcity. Hydrol. Earth Syst. Sci. 2015, 19, 4581–4608. [Google Scholar] [CrossRef]
- Lee, S.; Moriasi, D.N.; Danandeh Mehr, A.; Mirchi, A. Sensitivity of Standardized Precipitation and Evapotranspiration Index (SPEI) to the Choice of SPEI Probability Distribution and Evapotranspiration Method. J. Hydrol. Reg. Stud. 2024, 53, 101761. [Google Scholar] [CrossRef]
- Meresa, H.; Zhang, Y.; Tian, J.; Abrar Faiz, M. Understanding the Role of Catchment and Climate Characteristics in the Propagation of Meteorological to Hydrological Drought. J. Hydrol. 2023, 617, 128967. [Google Scholar] [CrossRef]
- McKee, T.B.; Doesken, N.J.; Kleist, J. The Relationship of Drought Frequency and Duration to Time Scales. In Proceedings of the 8th Conference on Applied Climatology, Anaheim, CA, USA, 17–22 January 1993; pp. 17–22. [Google Scholar]
- Ahmadalipour, A.; Moradkhani, H.; Demirel, M.C. A Comparative Assessment of Projected Meteorological and Hydrological Droughts: Elucidating the Role of Temperature. J. Hydrol. 2017, 553, 785–797. [Google Scholar] [CrossRef]
- Diffenbaugh, N.S.; Swain, D.L.; Touma, D. Anthropogenic Warming Has Increased Drought Risk in California. Proc. Natl. Acad. Sci. USA 2015, 112, 3931–3936. [Google Scholar] [CrossRef]
- Vicente-Serrano, S.M.; Beguería, S.; López-Moreno, J.I. A Multiscalar Drought Index Sensitive to Global Warming: The Standardized Precipitation Evapotranspiration Index. J. Clim. 2010, 23, 1696–1718. [Google Scholar] [CrossRef]
- Library, W.O.; Stagge, J.H.; Tallaksen, L.M.; Gudmundsson, L.; Van Loon, A.F.; Stahl, K. Candidate Distributions for Climatological Drought Indices (SPI and SPEI). Int. J. Climatol. 2015, 35, 4027–4040. [Google Scholar] [CrossRef]
- Gurrapu, S.; Chipanshi, A.; Sauchyn, D.; Howard, A. Comparison of the SPI and SPEI on Predicting Drought Conditions and Streamflow in the Canadian Prairies. In Proceedings of the 28th Conference on Hydrology, Atlanta, GA, USA, 2–6 February 2014. [Google Scholar]
- Vicente-Serrano, S.M.; Beguería, S.; Lorenzo-Lacruz, J.; Julio Camarero, J.; López-Moreno, J.I.; Azorin-Molina, C.; Revuelto, J.; Morán-Tejeda, E.; Sanchez-Lorenzo, A.; Pirenaico de Ecología, I. Performance of Drought Indices for Ecological, Agricultural, and Hydrological Applications. Earth Interact. 2012, 16, 1–27. [Google Scholar] [CrossRef]
- Verbesselt, J.; Hyndman, R.; Zeileis, A.; Culvenor, D. Phenological Change Detection While Accounting for Abrupt and Gradual Trends in Satellite Image Time Series. Remote Sens. Environ. 2010, 114, 2970–2980. [Google Scholar] [CrossRef]
- Fang, X.; Zhu, Q.; Ren, L.; Chen, H.; Wang, K.; Peng, C. Large-Scale Detection of Vegetation Dynamics and Their Potential Drivers Using MODIS Images and BFAST: A Case Study in Quebec, Canada. Remote Sens. Environ. 2018, 206, 391–402. [Google Scholar] [CrossRef]
- Wang, Y.; Liu, G.; Guo, E. Spatial Distribution and Temporal Variation of Drought in Inner Mongolia during 1901–2014 Using Standardized Precipitation Evapotranspiration Index. Sci. Total Environ. 2019, 654, 850–862. [Google Scholar] [CrossRef]
- He, B.; Chang, J.; Wang, Y.; Wang, Y.; Zhou, S.; Chen, C. Spatio-Temporal Evolution and Non-Stationary Characteristics of Meteorological Drought in Inland Arid Areas. Ecol. Indic. 2021, 126, 107644. [Google Scholar] [CrossRef]
- Young, B.H.; Fitzpatrick, M.; Marshak, A.; Radday, A. Lessons for Taadoud II: Improving Natural Resource Management; Feinstein International Center: Boston, MA, USA, 2019. [Google Scholar]
- Nweke, A.C. Transition From Fragility to Sustainable Development: Case Study of Darfur in Sudan. Ph.D. Thesis, Walden University, Minneapolis, MN, USA, 2021. [Google Scholar]
- Vehnämäki, M. Darfur Scorched: Looming Genocide in Western Sudan1. J. Genocide Res. 2006, 8, 51–82. [Google Scholar] [CrossRef]
- Osman, M.A.A.; Abdel-Rahman, E.M.; Onono, J.O.; Olaka, L.A.; Elhag, M.M.; Adan, M.; Tonnang, H.E.Z. Mapping, Intensities and Future Prediction of Land Use/Land Cover Dynamics Using Google Earth Engine and CA- Artificial Neural Network Model. PLoS ONE 2023, 18, e0288694. [Google Scholar] [CrossRef]
- Jakata, C. Mapping and Monitoring the Impacts of Climate Variabilities on Rangelands in North Darfur, Sudan. Master’s Thesis, University of the Witwatersrand, Johannesburg, South Africa, 2021. [Google Scholar]
- Hegazy, A.K.; Hosni, H.A.; El-Sheikh, M.A.R.; Abo-El-Kassem, A.; Badawi, E.S.M.; Lovett-Doust, L. Plant Biodiversity and Soils in the Jebel Marra Region of Darfur, Sudan. Arid Land Res. Manag. 2021, 35, 127–161. [Google Scholar] [CrossRef]
- Wickens, G.E.; Collier, F.W. Some Vegetation Patterns in the Republic of the Sudan. Geoderma 1971, 6, 43–59. [Google Scholar] [CrossRef]
- Al-Amin, H.A. Trees and Shrubs of the Sudan. Ithaca Press, 484p.—References—Scientific Research Publishing. 1990. Available online: https://www.scirp.org/reference/referencespapers?referenceid=1805810 (accessed on 24 February 2025).
- Ahmed, A.I.A.; Eldoma, I.M.; Elaagip, E.E.M.A.H.; Hou, F. Effects of Indigenous Cultivation Practices on Soil Conservation in the Hilly Semiarid Areas of Western Sudan. Water 2020, 12, 1554. [Google Scholar] [CrossRef]
- Hegazy, A.K.; Hosni, H.A.; Kabiel, H.F.; Badawi, E.S.M.; Emam, M.H.; Lovett-Doust, L. Population Ecology of Some Keystone Tree Species in the Jebel Marra Region of Darfur. Rend. Lincei. Sci. Fis. Nat. 2018, 29, 659–673. [Google Scholar] [CrossRef]
- Nagmeldin, K.-G.; Hanna, R.-A. Ethnic Diversity and Its Impact on Group Identification in Darfur. Stud. Afr. Lang. Cult. 2023, 57, 2023. [Google Scholar] [CrossRef]
- Atta Al-Mannan, A.Y. Attaalmannan Traditional Tribal Conflicts in Darfur Reasons and Seasons. J. Educ. Pract. 2019, 10, 95–110. [Google Scholar] [CrossRef]
- Schimmer, R. Tracking the Genocide in Darfur: Population Displacement as Recorded by Remote Sensing; Yale Center for International and Area Studies: New Haven, CT, USA, 2007. [Google Scholar]
- Nugent, B.; Zambakides, S.; Abaker, M.; Adam, A.; Gutbi, O.; Eltigani, E. Profile of Nyala Town and Adjacent IDP Camps Darfur. Available online: https://unhabitat.org/sites/default/files/download-manager-files/Nyala%20and%20Adjacent%20IDP%20Camps%20Profile.pdf (accessed on 22 December 2024).
- Elamin, E.M. Assessment of Sustainable Production of Stable Food Crops in Southern Darfur State, Sudan. Curr. Investig. Agric. Curr. Res. 2018, 5, 609–611. [Google Scholar] [CrossRef]
- Didan, K.; Munoz, A.B.; Solano, R.; Huete, A. MODIS Vegetation Index User’s Guide (MOD13 Series); University of Arizona, Vegetation Index and Phenology Lab: Tucson, AZ, USA, 2015; pp. 1–33. [Google Scholar]
- LP DAAC Global 250 m SIN Grid V006. NASA Land Data Products and Services. 2015. Available online: https://lpdaac.usgs.gov/products/mod13q1v006/ (accessed on 23 January 2025).
- Sur, K.; Verma, V.K.; Panwar, P.; Shukla, G.; Chakravarty, S.; Nath, A.J. Monitoring Vegetation Degradation Using Remote Sensing and Machine Learning over India—A Multi-Sensor, Multi-Temporal and Multi-Scale Approach. Front. For. Glob. Change 2024, 7, 1382557. [Google Scholar] [CrossRef]
- Zhang, H.; Chang, J.; Zhang, L.; Wang, Y.; Li, Y.; Wang, X. NDVI Dynamic Changes and Their Relationship with Meteorological Factors and Soil Moisture. Environ. Earth Sci. 2018, 77, 582. [Google Scholar] [CrossRef]
- Liu, Z.; Chen, Y.; Chen, C. Analysis of the Spatiotemporal Characteristics and Influencing Factors of the NDVI Based on the GEE Cloud Platform and Landsat Images. Remote Sens. 2023, 15, 4980. [Google Scholar] [CrossRef]
- Olaf, K.; Gunter, Z.; Dirk, T.; Stephen, C.; Denis, B.; Thomas, K.; Stefan, L.; Mathidlde, C. Monitoring Refugee IDP Camps to Support International Relief Action. 2016. Available online: https://elib.dlr.de/68874/1/KRANZetal_2010_UNBOOKLET.pdf (accessed on 8 March 2024).
- Lang, S.; Tiede, D.; Hölbling, D.; Füreder, P.; Zeil, P. Earth Observation (EO)-Based Ex Post Assessment of Internally Displaced Person (IDP) Camp Evolution and Population Dynamics in Zam Zam, Darfur. Int. J. Remote Sens. 2010, 31, 5709–5731. [Google Scholar] [CrossRef]
- Funk, C.; Michaelsen, J.; Marshall, M.T. Mapping Recent Decadal Climate Variations in Precipitation and Temperature Across Eastern Africa and the Sahel. 2012. Available online: https://digitalcommons.unl.edu/usgsstaffpub/977/ (accessed on 22 September 2024).
- Gupta, P.; Verma, S.; Bhatla, R.; Chandel, A.S.; Singh, J.; Payra, S. Validation of Surface Temperature Derived From MERRA-2 Reanalysis Against IMD Gridded Data Set Over India. Earth Space Sci. 2020, 7, e2019EA000910. [Google Scholar] [CrossRef]
- Westberg, D.J.; Stackhouse, P.; Crawley, D.B.; Hoell, J.M.; Chandler, W.S.; Zhang, T. An Analysis of NASA&39;s MERRA Meteorological Data to Supplement Observational Data for Calculation of Climatic Design Conditions|SG Publications. Available online: https://esdpubs.nasa.gov/sgpubs/content/An_Analysis_of_NASAs_MERRA_Meteorological_Data_to_Supplement_Observational_Data_for (accessed on 22 December 2024).
- Kleist, D.T.; Parrish, D.F.; Derber, J.C.; Treadon, R.; Errico, R.M.; Yang, R. Improving Incremental Balance in the GSI 3DVAR Analysis System. Mon. Weather Rev. 2009, 137, 1046–1060. [Google Scholar] [CrossRef]
- Molod, A.; Takacs, L.; Suarez, M.; Bacmeister, J. Development of the GEOS-5 Atmospheric General Circulation Model: Evolution from MERRA to MERRA2. Geosci. Model Dev. 2015, 8, 1339–1356. [Google Scholar] [CrossRef]
- Vicente-Serrano, S.M.; Lopez-Moreno, J.I.; Beguería, S.; Lorenzo-Lacruz, J.; Sanchez-Lorenzo, A.; García-Ruiz, J.M.; Azorin-Molina, C.; Morán-Tejeda, E.; Revuelto, J.; Trigo, R.; et al. Evidence of Increasing Drought Severity Caused by Temperature Rise in Southern Europe. Environ. Res. Lett. 2014, 9, 044001. [Google Scholar] [CrossRef]
- Bae, S.; Lee, S.H.; Yoo, S.H.; Kim, T. Analysis of Drought Intensity and Trends Using the Modified SPEI in South Korea from 1981 to 2010. Water 2018, 10, 327. [Google Scholar] [CrossRef]
- Tirivarombo, S.O.D.E.; Osupile, D.; Eliasson, P. Drought Monitoring and Analysis: Standardised Precipitation Evapotranspiration Index (SPEI) and Standardised Precipitation Index (SPI); Elsevier: Amsterdam, The Netherlands, 2018. [Google Scholar]
- Serkendiz, H.; Tatli, H.; Kılıç, A.; Çetin, M.; Sungur, A. Analysis of Drought Intensity, Frequency and Trends Using the SPEI in Turkey. Theor. Appl. Climatol. 2024, 155, 2997–3012. [Google Scholar] [CrossRef]
- Şen, Z. Innovative Trend Analysis Methodology. J. Hydrol. Eng. 2012, 17, 1042–1046. [Google Scholar] [CrossRef]
- Kessabi, R.; Hanchane, M.; Ait Brahim, Y.; El Khazzan, B.; Addou, R.; Belmahi, M. Characterization of Annual and Seasonal Rainfall Trend Using Innovative Trend Analysis (ITA) and Classical Methods: The Case of Wadi Sebou Basin (WSB) Morocco. Euro-Mediterr. J. Environ. Integr. 2024, 1–19. [Google Scholar] [CrossRef]
- Zittis, G. Observed Rainfall Trends and Precipitation Uncertainty in the Vicinity of the Mediterranean, Middle East and North Africa. Theor. Appl. Climatol. 2018, 134, 1207–1230. [Google Scholar] [CrossRef]
- Murat, M.; Malinowska, I.; Gos, M.; Krzyszczak, J. Forecasting Daily Meteorological Time Series Using ARIMA and Regression Models. Int. Agrophys. 2018, 32, 253–264. [Google Scholar] [CrossRef]
- Box, G.E.P.; Jenkins, G.M.; Reinsel, G.C.; Ljung, G.M. Time Series Analysis: Forecasting and Control. In Time Series Analysis: Forecasting and Control; John Wiley & Sons: Hoboken, NJ, USA, 2016. [Google Scholar]
- Harvey, A.C. Forecasting, Structural Time Series Models and the Kalman Filter; Cambridge University Press: Cambridge, UK, 1994; p. 554. [Google Scholar]
- Hyndman, R.; Koehler, A.B.; Ord, J.K.; Snyder, R.D. Forecasting with Exponential Smoothing: The State Space Approach—Rob Hyndman. Available online: https://books.google.ro/books?hl=en&lr=&id=GSyzox8Lu9YC&oi=fnd&pg=PA3&dq=Snyder+Forecasting+with+Exponential+Smoothing:+The+State+Space+Approach%E2%80%94Rob+Hyndman&ots=1s6pEJlFt3&sig=ookFHv7Jwlw8kP-H0Viics6nZxI&redir_esc=y#v=onepage&q=Snyder%20Forecasting%20with%20Exponential%20Smoothing%3A%20The%20State%20Space%20Approach%E2%80%94Rob%20Hyndman&f=false (accessed on 17 October 2024).
- Agaj, T.; Budka, A.; Janicka, E.; Bytyqi, V. Using ARIMA and ETS Models for Forecasting Water Level Changes for Sustainable Environmental Management. Sci. Rep. 2024, 14, 22444. [Google Scholar] [CrossRef]
- Siddig, K.; Stepanyan, D.; Wiebelt, M.; Grethe, H.; Zhu, T. Climate Change and Agriculture in the Sudan: Impact Pathways beyond Changes in Mean Rainfall and Temperature. Ecol. Econ. 2020, 169, 106566. [Google Scholar] [CrossRef]
- Nwayor, I.J.; Robeson, S.M. Exploring the Relationship between SPI and SPEI in a Warming World. Theor. Appl. Climatol. 2024, 155, 2559–2569. [Google Scholar] [CrossRef]
- Onyango, D.O. Climate Change and Conflict: A Case Study of Darfur Conflict. Ph.D. Thesis, University of Nairobi, Nairobi, Kenya, 2013. [Google Scholar]
- Sax, N.; Hassan, G.; Abdi, A.; Madurga-Lopez, I. How Does Climate Exacerbate Root Causes of Conflict in Sudan. 2023. Available online: https://cgspace.cgiar.org/server/api/core/bitstreams/12f43867-fb02-4f3a-ae4e-1599ef6d713b/content (accessed on 14 January 2025).
- Scholarworks, U.; Smith, E.G. Climate Change and Conflict: The Darfur Conflict and Syrian Civil War; The University of Vermont: Burlington, VT, USA, 2020. [Google Scholar]
- Scholarworks, U.; Smith, E.G. Climate Change and Darfur: A Holistic Security Approach. Master’s Thesis, American University in Cairo, New Cairo, Egypt, 2023. [Google Scholar]
- Naz, U.; Saleem, M.S. Climate-Induced Vulnerabilities: Conflict and Migration Patterns in the Sahel Region of Africa. Pak. Lang. Humanit. Rev. 2024, 8, 295–311. [Google Scholar]
- Macauley, T. Darfur, Conflict and Climate Change. Master’s Thesis, Duke University, Durham, NC, USA, 2008. [Google Scholar]
- Macauley, T. Climate and Crisis: Environmental Degradation and Humanitarian Disaster in Darfur. Master’s Thesis, Fordham University, Bronx, NY, USA, 2016. [Google Scholar]
- Elnour Yagoub, Y.; Li, Z.; Said Musa, O.; Wang, F.; Naveed Anjum, M.; Bo, Z.; Ding-min, J. Detection of Drought Pattern in Sudan Using Standardized Precipitation-Evapotranspiration Index (SPEI). Int. J. Recent Adv. Multidiscip. Res. 2017, 4, 2546–2554. [Google Scholar]
- Marvel, K.; Su, W.; Delgado, R.; Aarons, S.; Chatterjee, A.; Garcia, M.E.; Hausfather, Z.; Hayhoe, K.; Hence, D.A.; Jewett, E.B.; et al. Chapter 2: Climate Trends. In Fifth National Climate Assessment; U.S. Global Change Research Program: Washington, DC, USA, 2023; pp. 2–17. [Google Scholar] [CrossRef]
- Hemida, M. The Potentiality of Agroforestry Practices as Essential Land Use Option for Forest Rehabilitation and Livelihood Improvement, Case Study of Nabag Forest. Ph.D. Thesis, University of Sopron, Sopron, Hungary, 2023. [Google Scholar]
- Mbuqwa, P.; Magagula, H.B.; Kalumba, A.M.; Afuye, G.A. Interdecadal Variations in Agricultural Drought Monitoring Using Land Surface Temperature and Vegetation Indices: A Case of the Amahlathi Local Municipality in South Africa. Sustainability 2024, 16, 8125. [Google Scholar] [CrossRef]
- Keria, H.; Bensaci, E.; Zoubiri, A. Assessment of the Long-Term Effects of Climate on Vegetation in 25 Watersheds in Dry and Semi-Dry Areas, Algeria. Nat. Hazards 2024, 120, 7575–7596. [Google Scholar] [CrossRef]
- Mwabumba, M.; Yadav, B.K.; Rwiza, M.J.; Larbi, I.; Dotse, S.Q.; Limantol, A.M.; Sarpong, S.; Kwawuvi, D. Rainfall and Temperature Changes under Different Climate Scenarios at the Watersheds Surrounding the Ngorongoro Conservation Area in Tanzania. Environ. Chall. 2022, 7, 100446. [Google Scholar] [CrossRef]
- Van Lanen, H.A.J.; Wanders, N.; Tallaksen, L.M.; Van Loon, A.F. Hydrological Drought across the World: Impact of Climate and Physical Catchment Structure. Hydrol. Earth Syst. Sci. 2013, 17, 1715–1732. [Google Scholar] [CrossRef]
- Shai, K.B.; Vunza, M. Gender Mainstreaming in Peacebuilding and Localised Human Security in the Context of the Darfur Genocide: An Africentric Rhetorical Analysis. J. Lit. Stud. 2021, 37, 69–84. [Google Scholar] [CrossRef]
- Papa, M.J.; Papa, W.H. The Crisis in Darfur and the Social Structure of Global Climate Change, race, and gender. Stud. Symb. Interact. 2019, 51, 43–70. [Google Scholar] [CrossRef]
- Adaawen, S.; Rademacher-Schulz, C.; Schraven, B.; Segadlo, N. Drought, Migration, and Conflict in Sub-Saharan Africa: What Are the Links and Policy Options? Curr. Dir. Water Scarcity Res. 2019, 2, 15–31. [Google Scholar] [CrossRef]
- Adams, E.A.; Thill, A.; Kuusaana, E.D.; Mittag, A. Farmer–Herder Conflicts in Sub-Saharan Africa: Drivers, Impacts, and Resolution and Peacebuilding Strategies. Environ. Res. Lett. 2023, 18, 123001. [Google Scholar] [CrossRef]
- Hakim, S. The Role of Climate Change in the Darfur Crisis. Clim. Change Manag. 2011, 815–823. [Google Scholar] [CrossRef]
- Mazo, J. Chapter Four: Conflict, Instability and State Failure: The Climate Factor. Adelphi Pap. 2009, 49, 87–118. [Google Scholar] [CrossRef]
- Levy, B.S. Increasing Risks for Armed Conflict: Climate Change, Food and Water Insecurity, and Forced Displacement. Int. J. Health Serv. 2019, 49, 682–691. [Google Scholar] [CrossRef] [PubMed]
- Olsson, O. Resource Conflict in Vulnerable Environments: Three Models Applied to Darfur. Work. Pap. Econ. 2008, 325, 16–41. [Google Scholar]
- Ebi, K.L.; Hallegatte, S.; Kram, T.; Arnell, N.W.; Carter, T.R.; Edmonds, J.; Kriegler, E.; Mathur, R.; O’Neill, B.C.; Riahi, K.; et al. A New Scenario Framework for Climate Change Research: Background, Process, and Future Directions. Clim. Change 2014, 122, 363–372. [Google Scholar] [CrossRef]
- van Vuuren, D.P.; Edmonds, J.; Kainuma, M.; Riahi, K.; Thomson, A.; Hibbard, K.; Hurtt, G.C.; Kram, T.; Krey, V.; Lamarque, J.-F.; et al. The Representative Concentration Pathways: An Overview. Clim. Change 2011, 109, 5–31. [Google Scholar] [CrossRef]

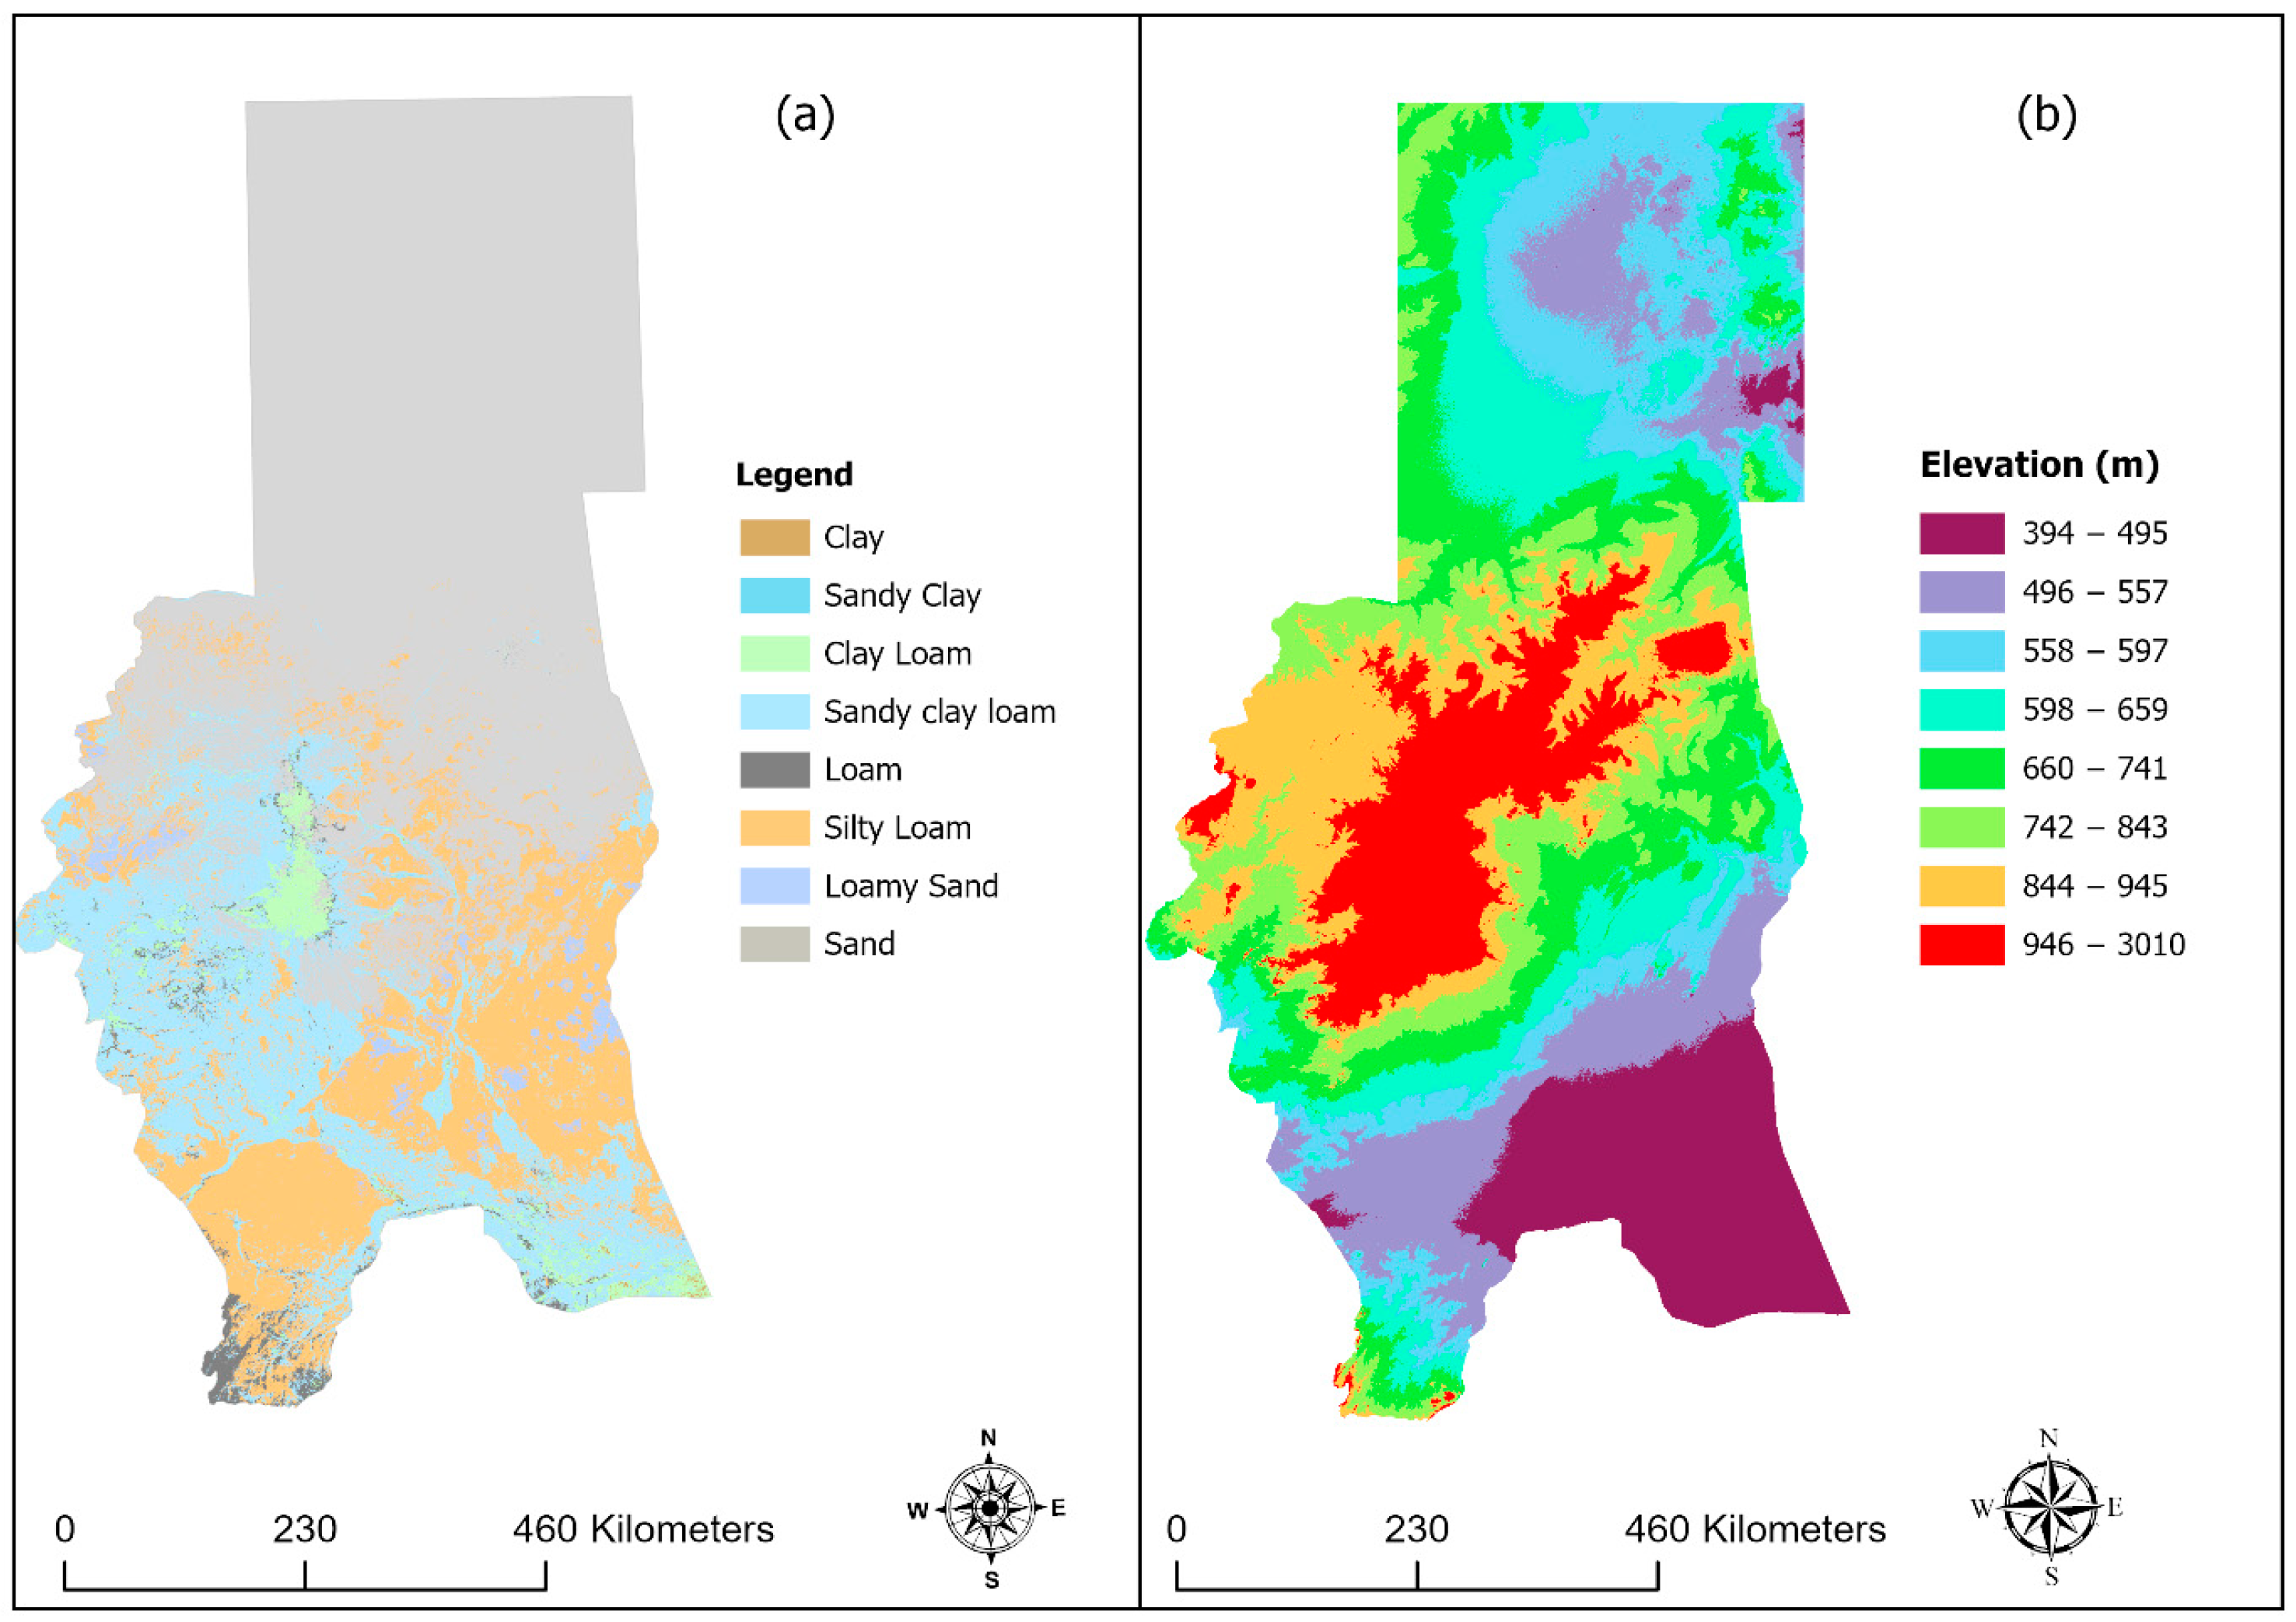
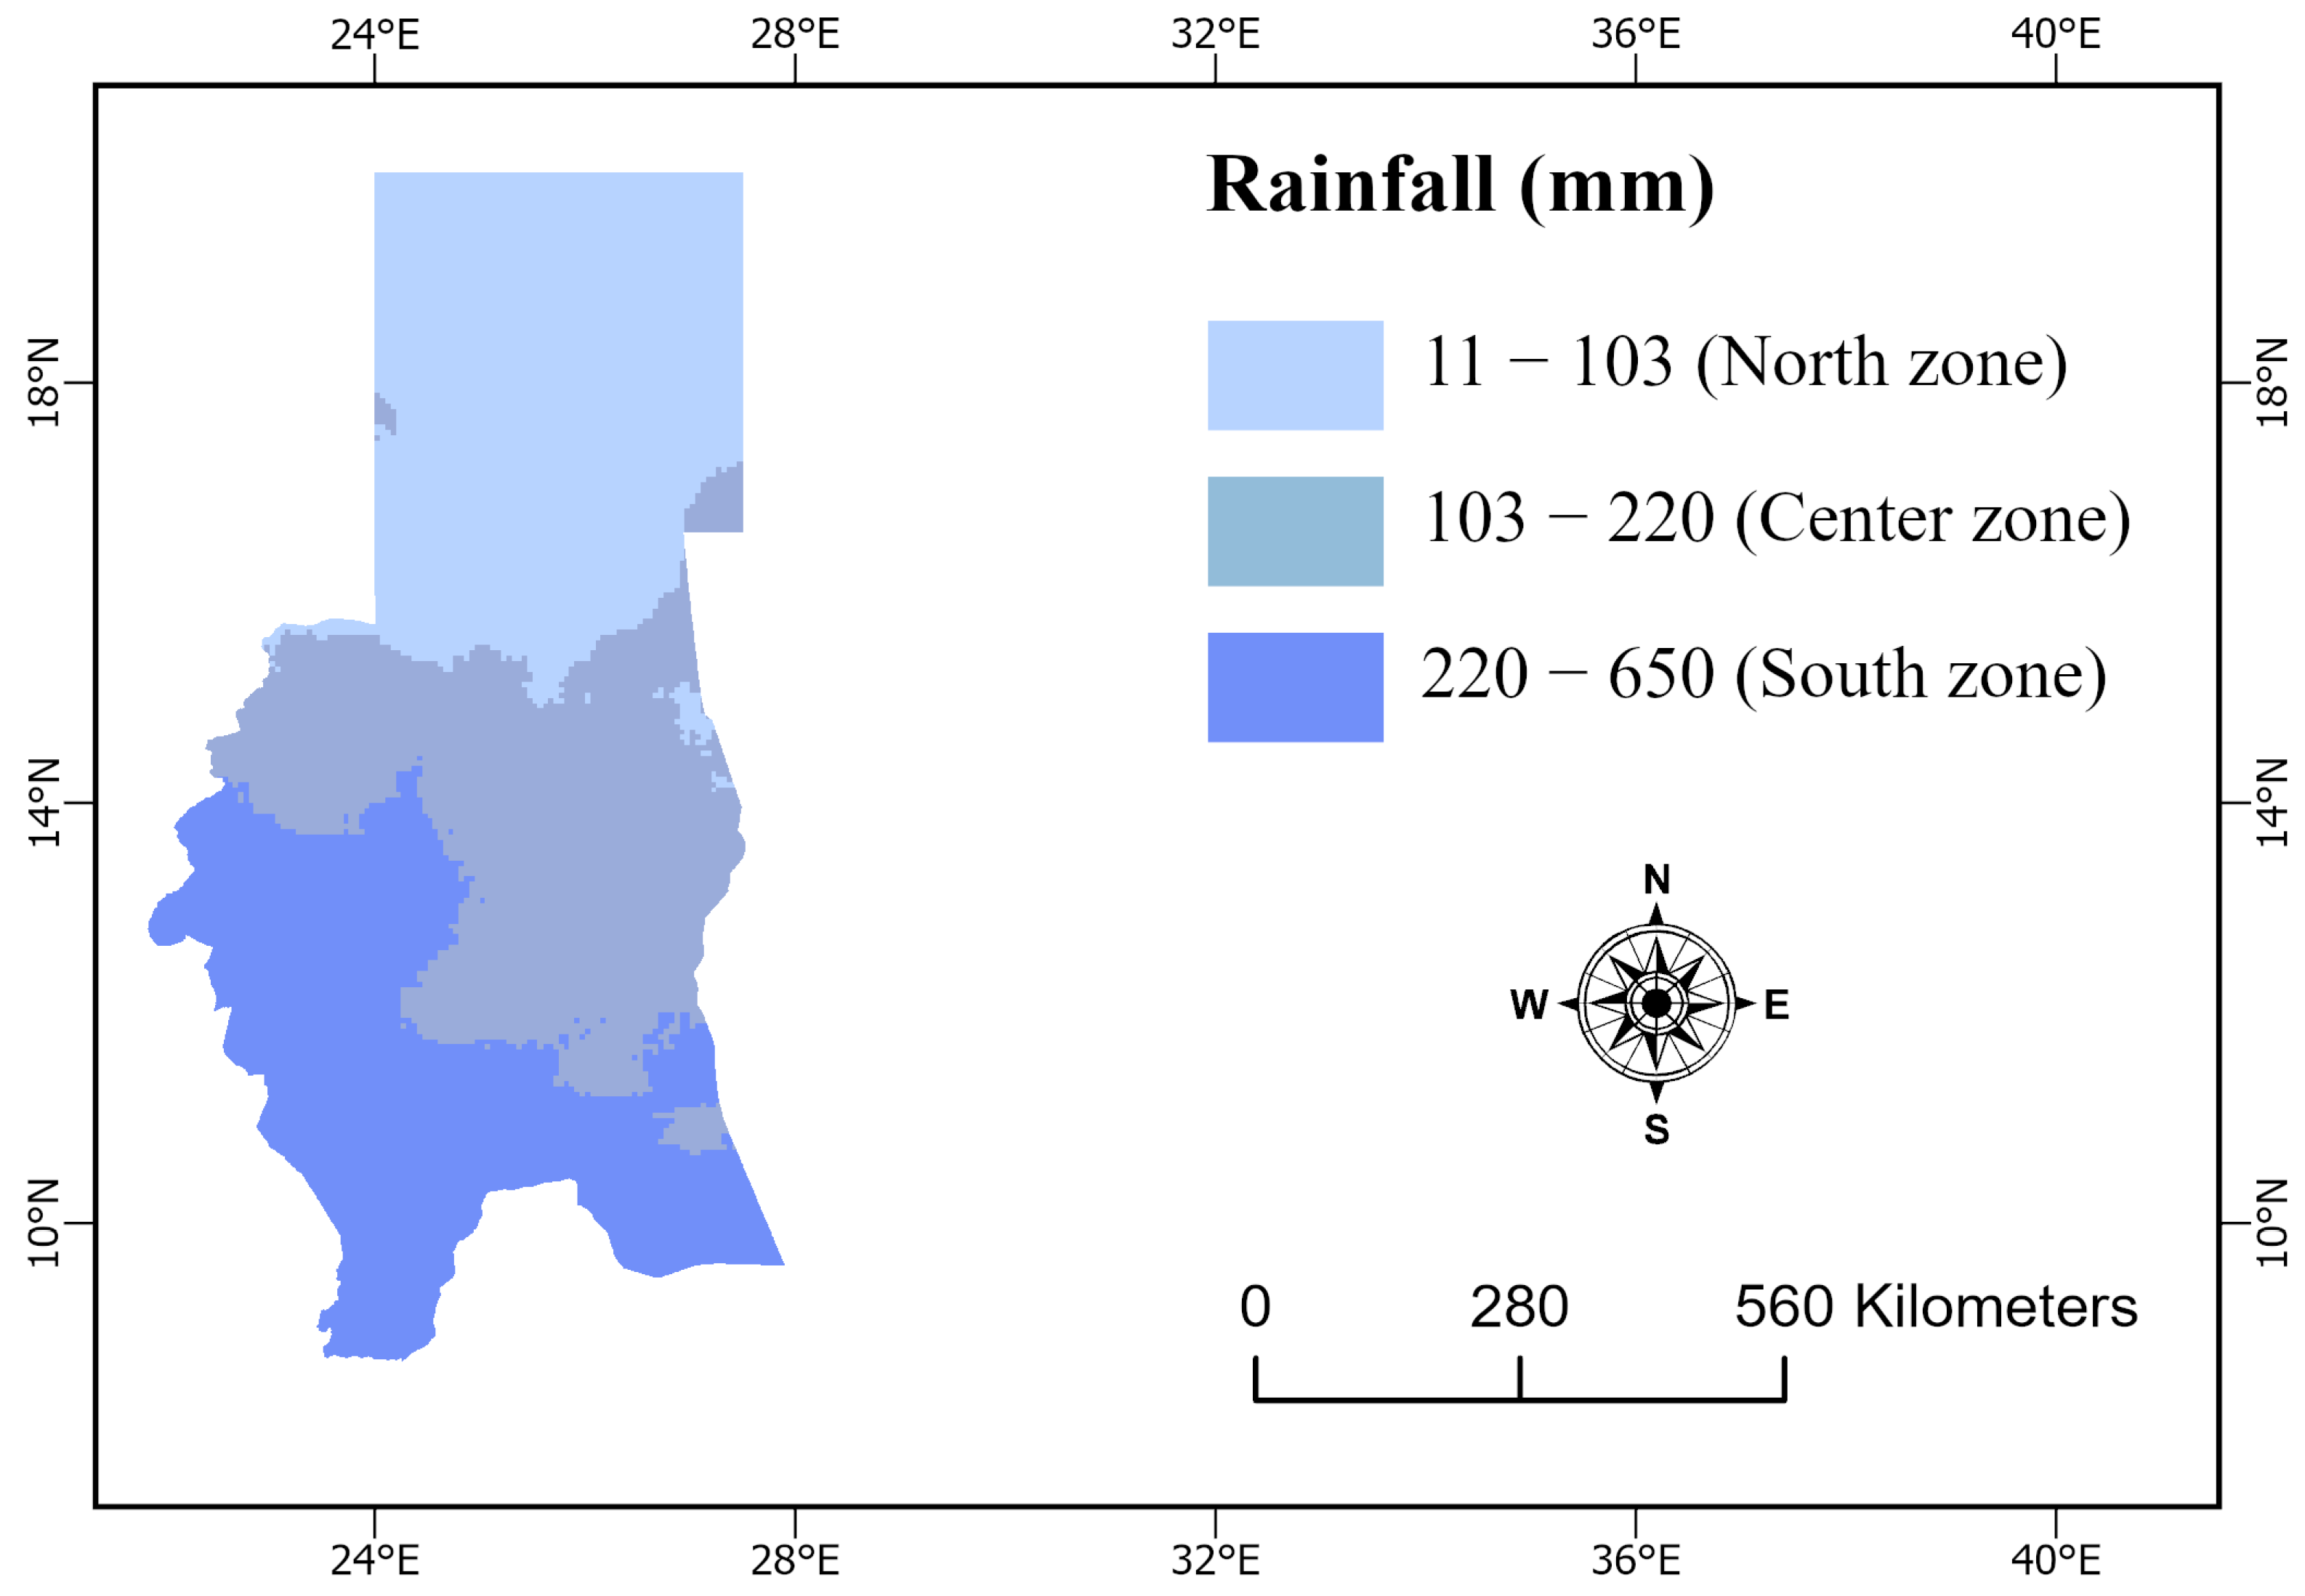
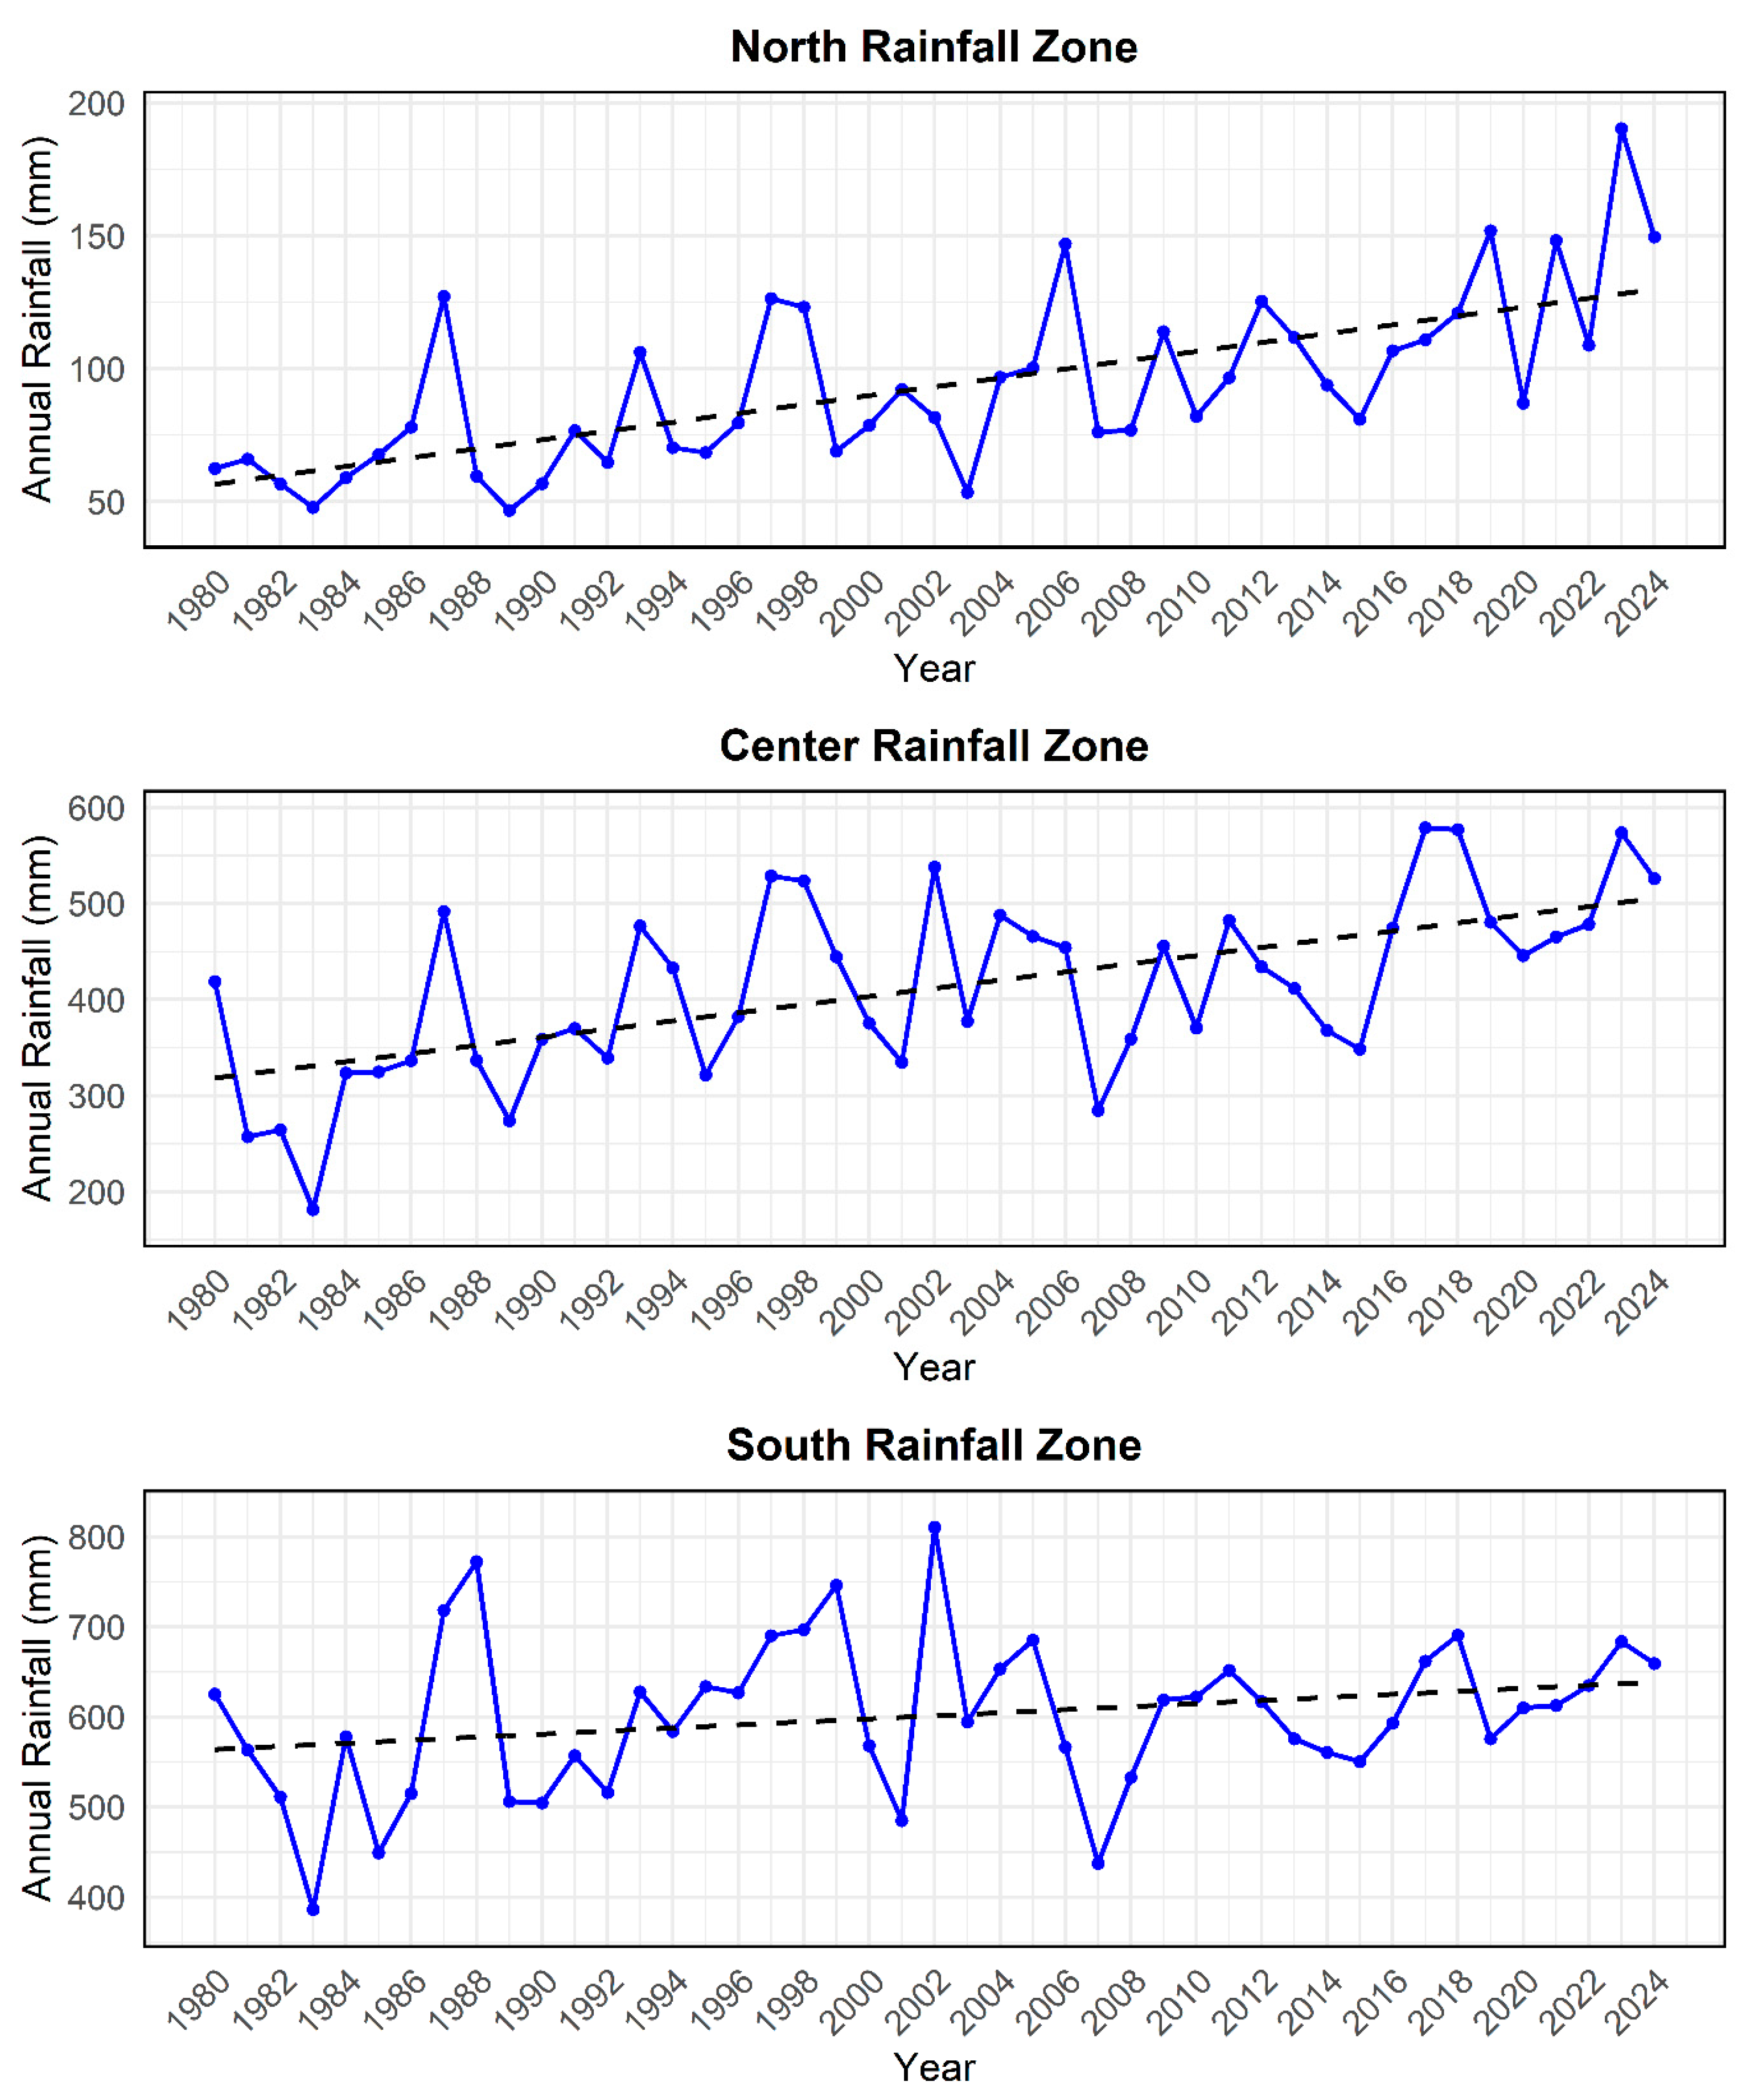
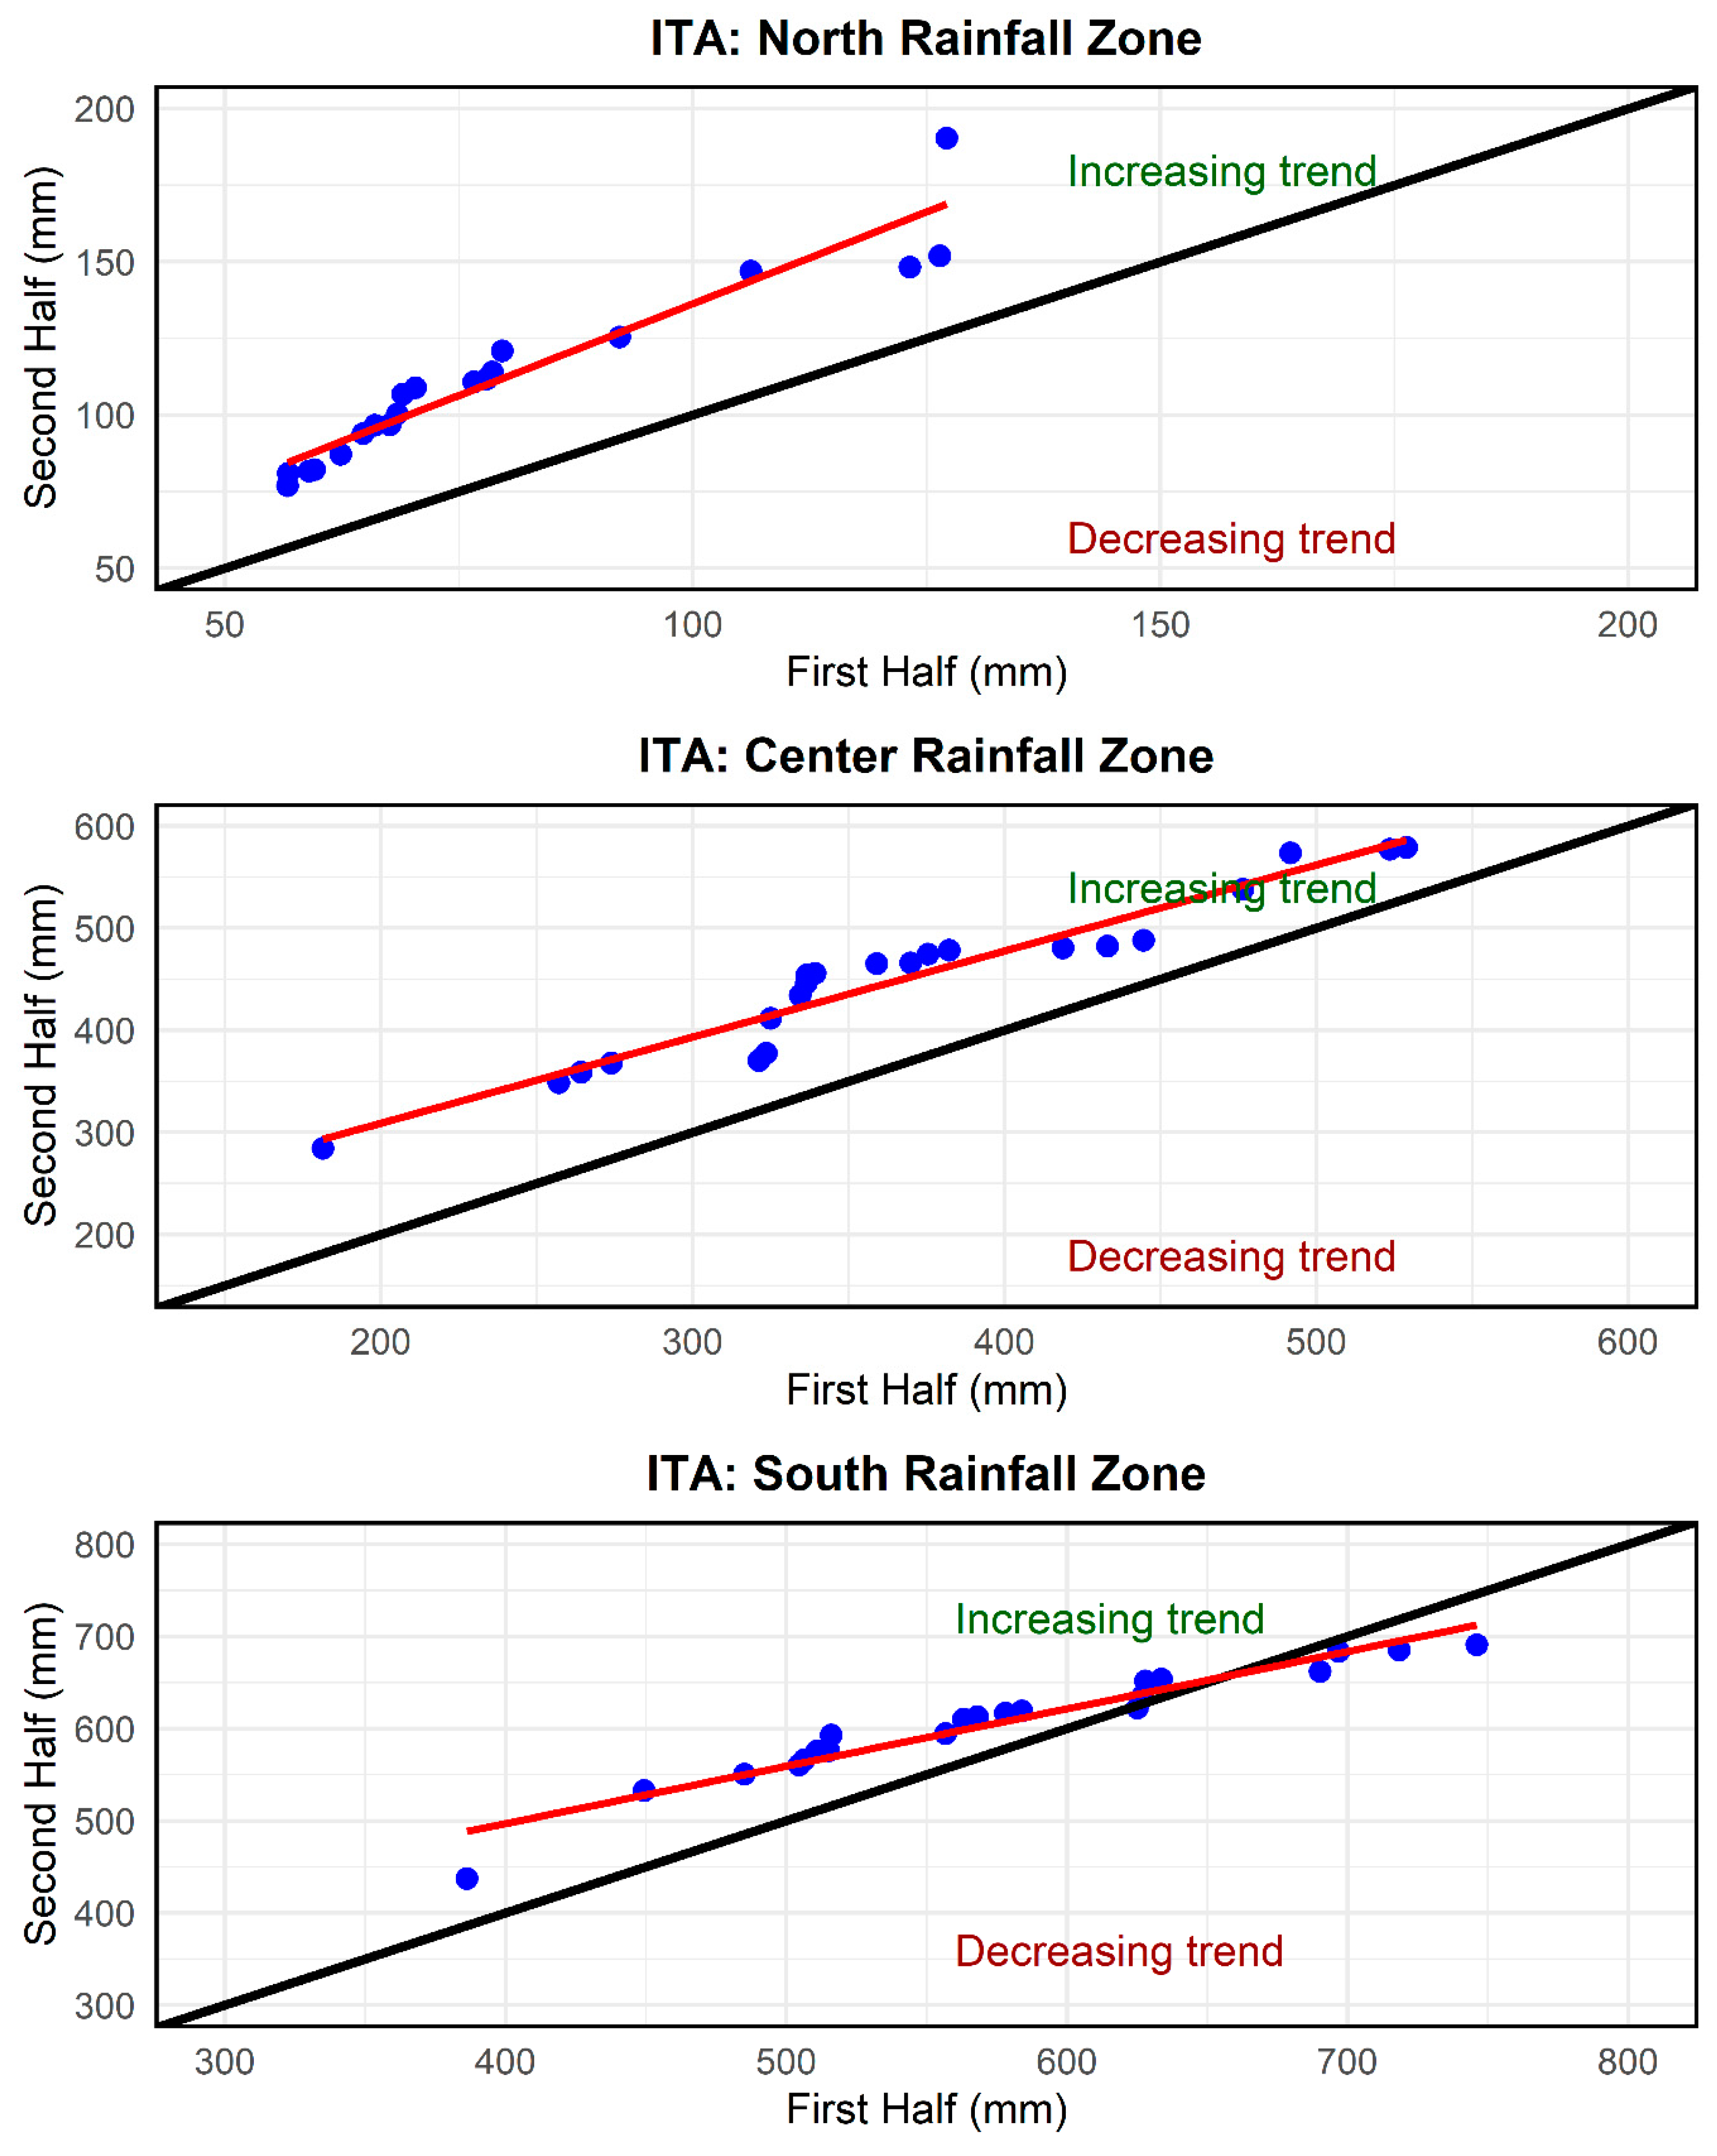
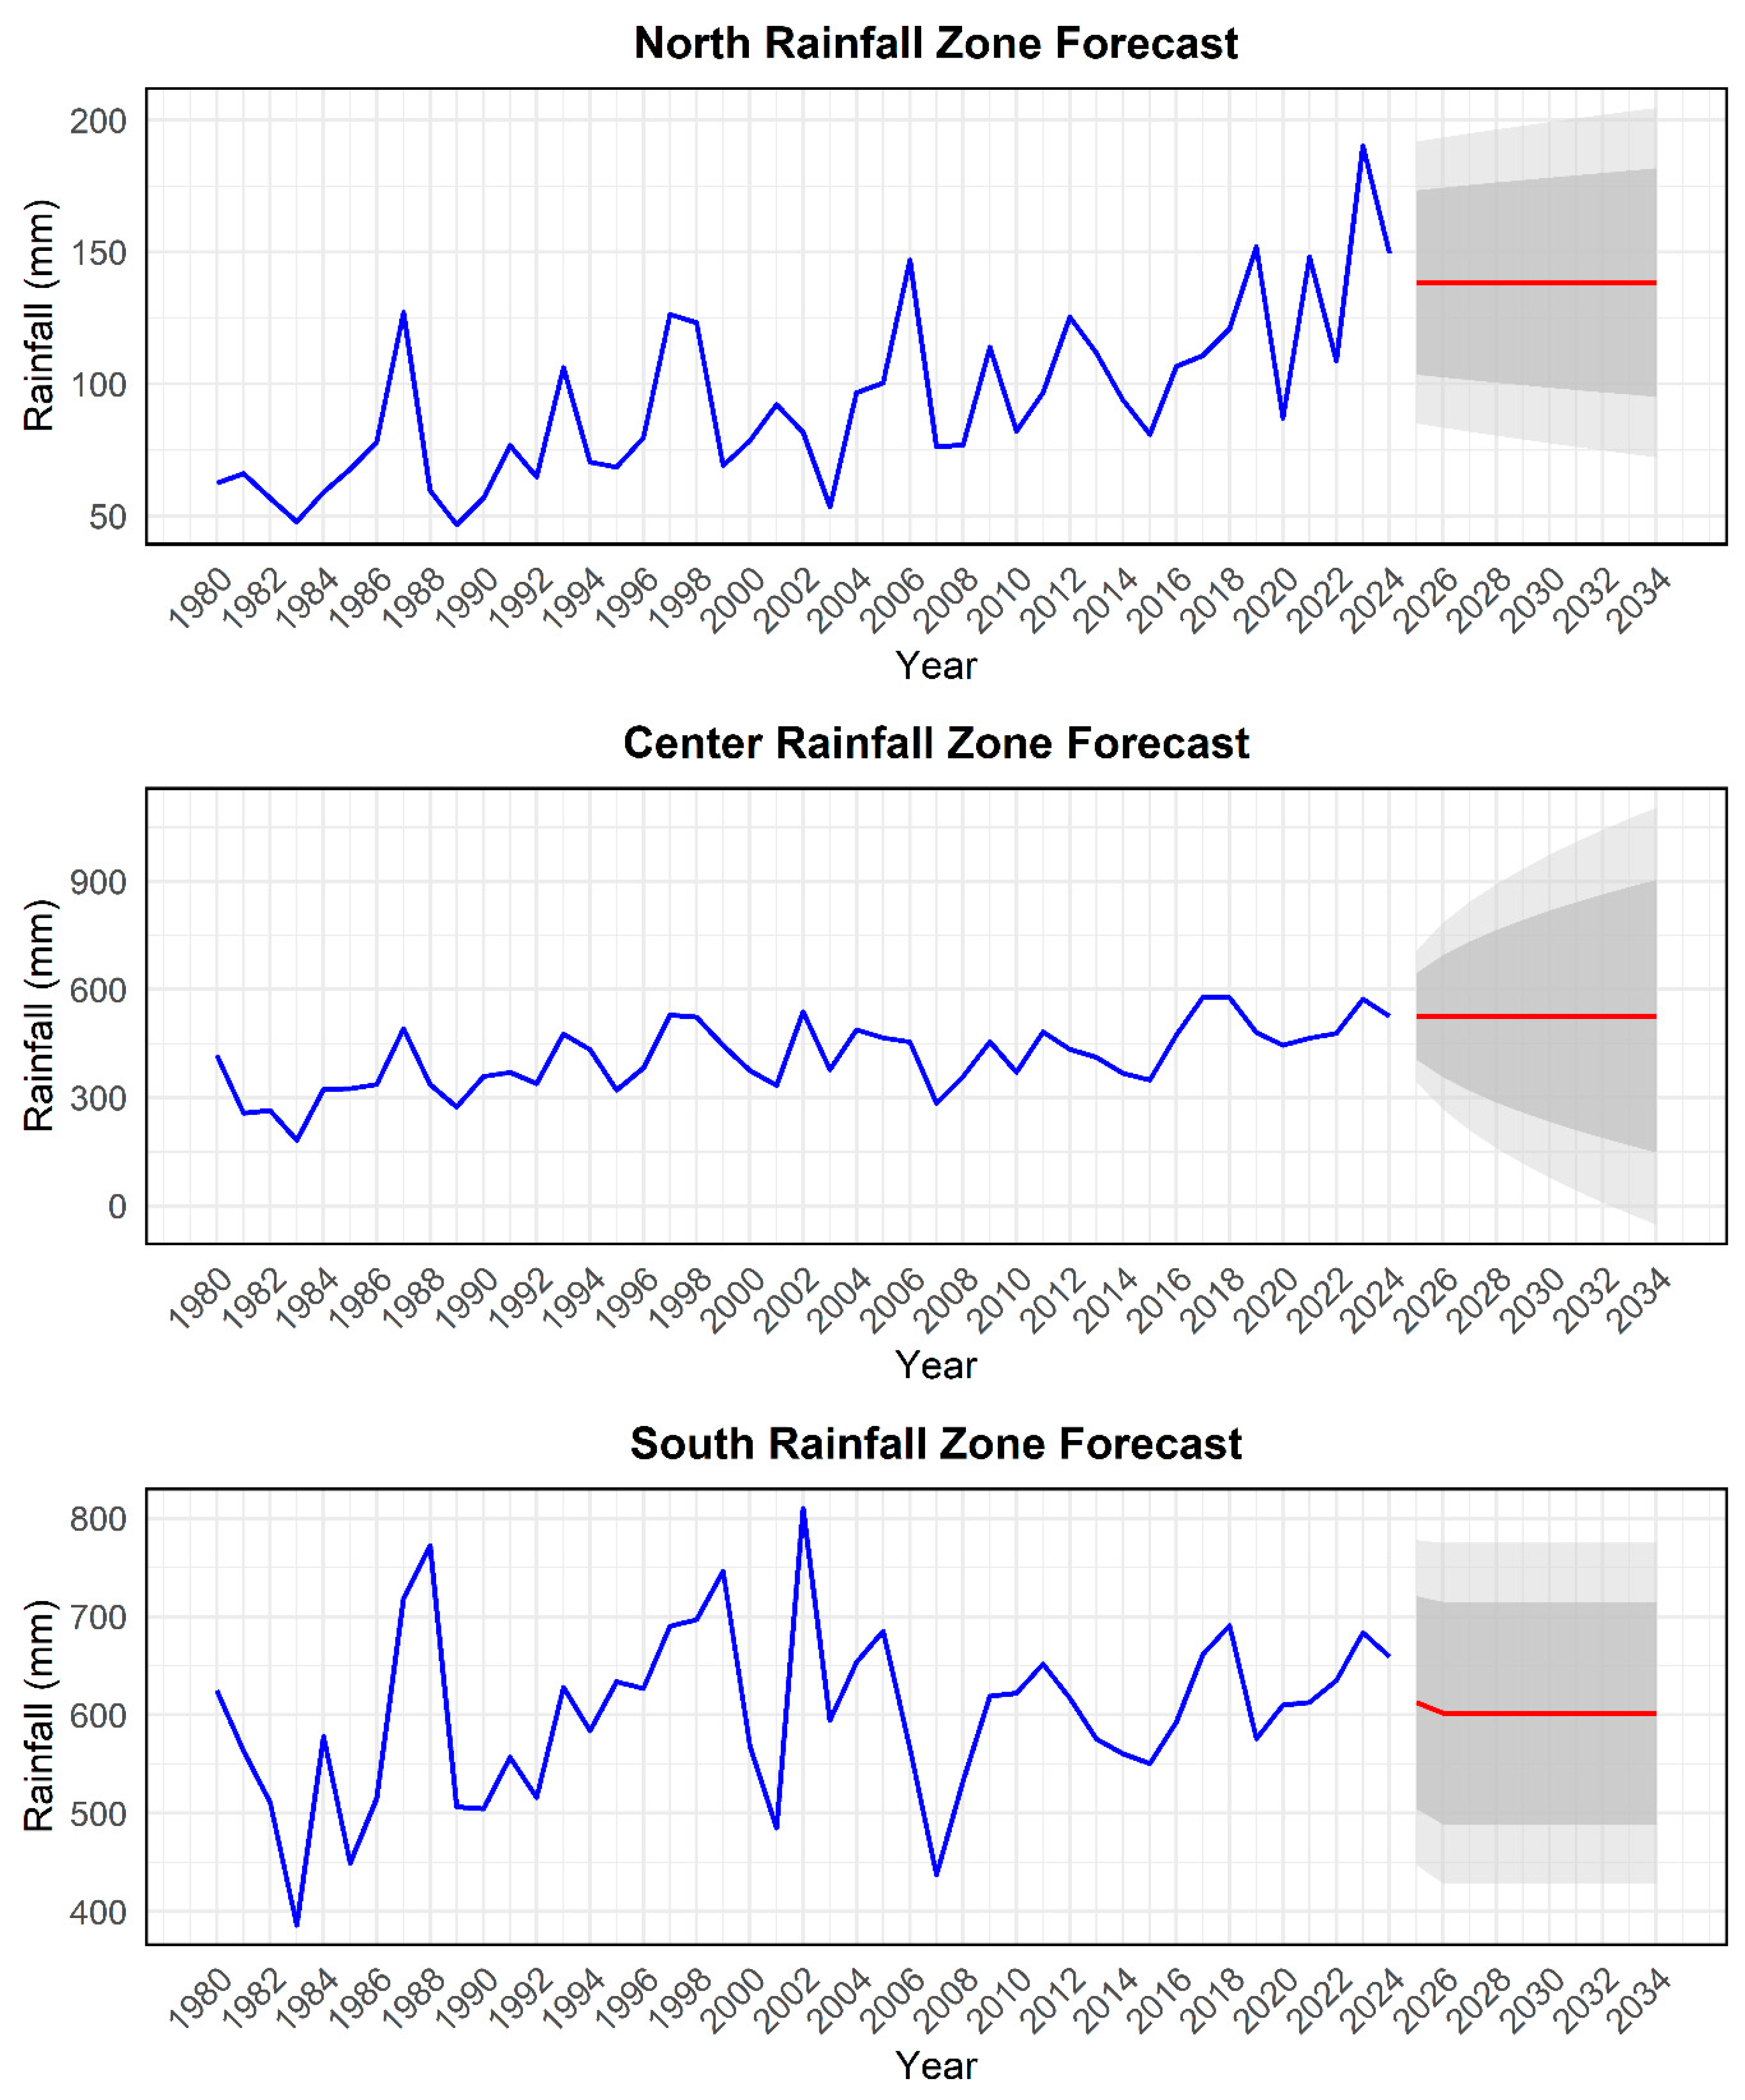
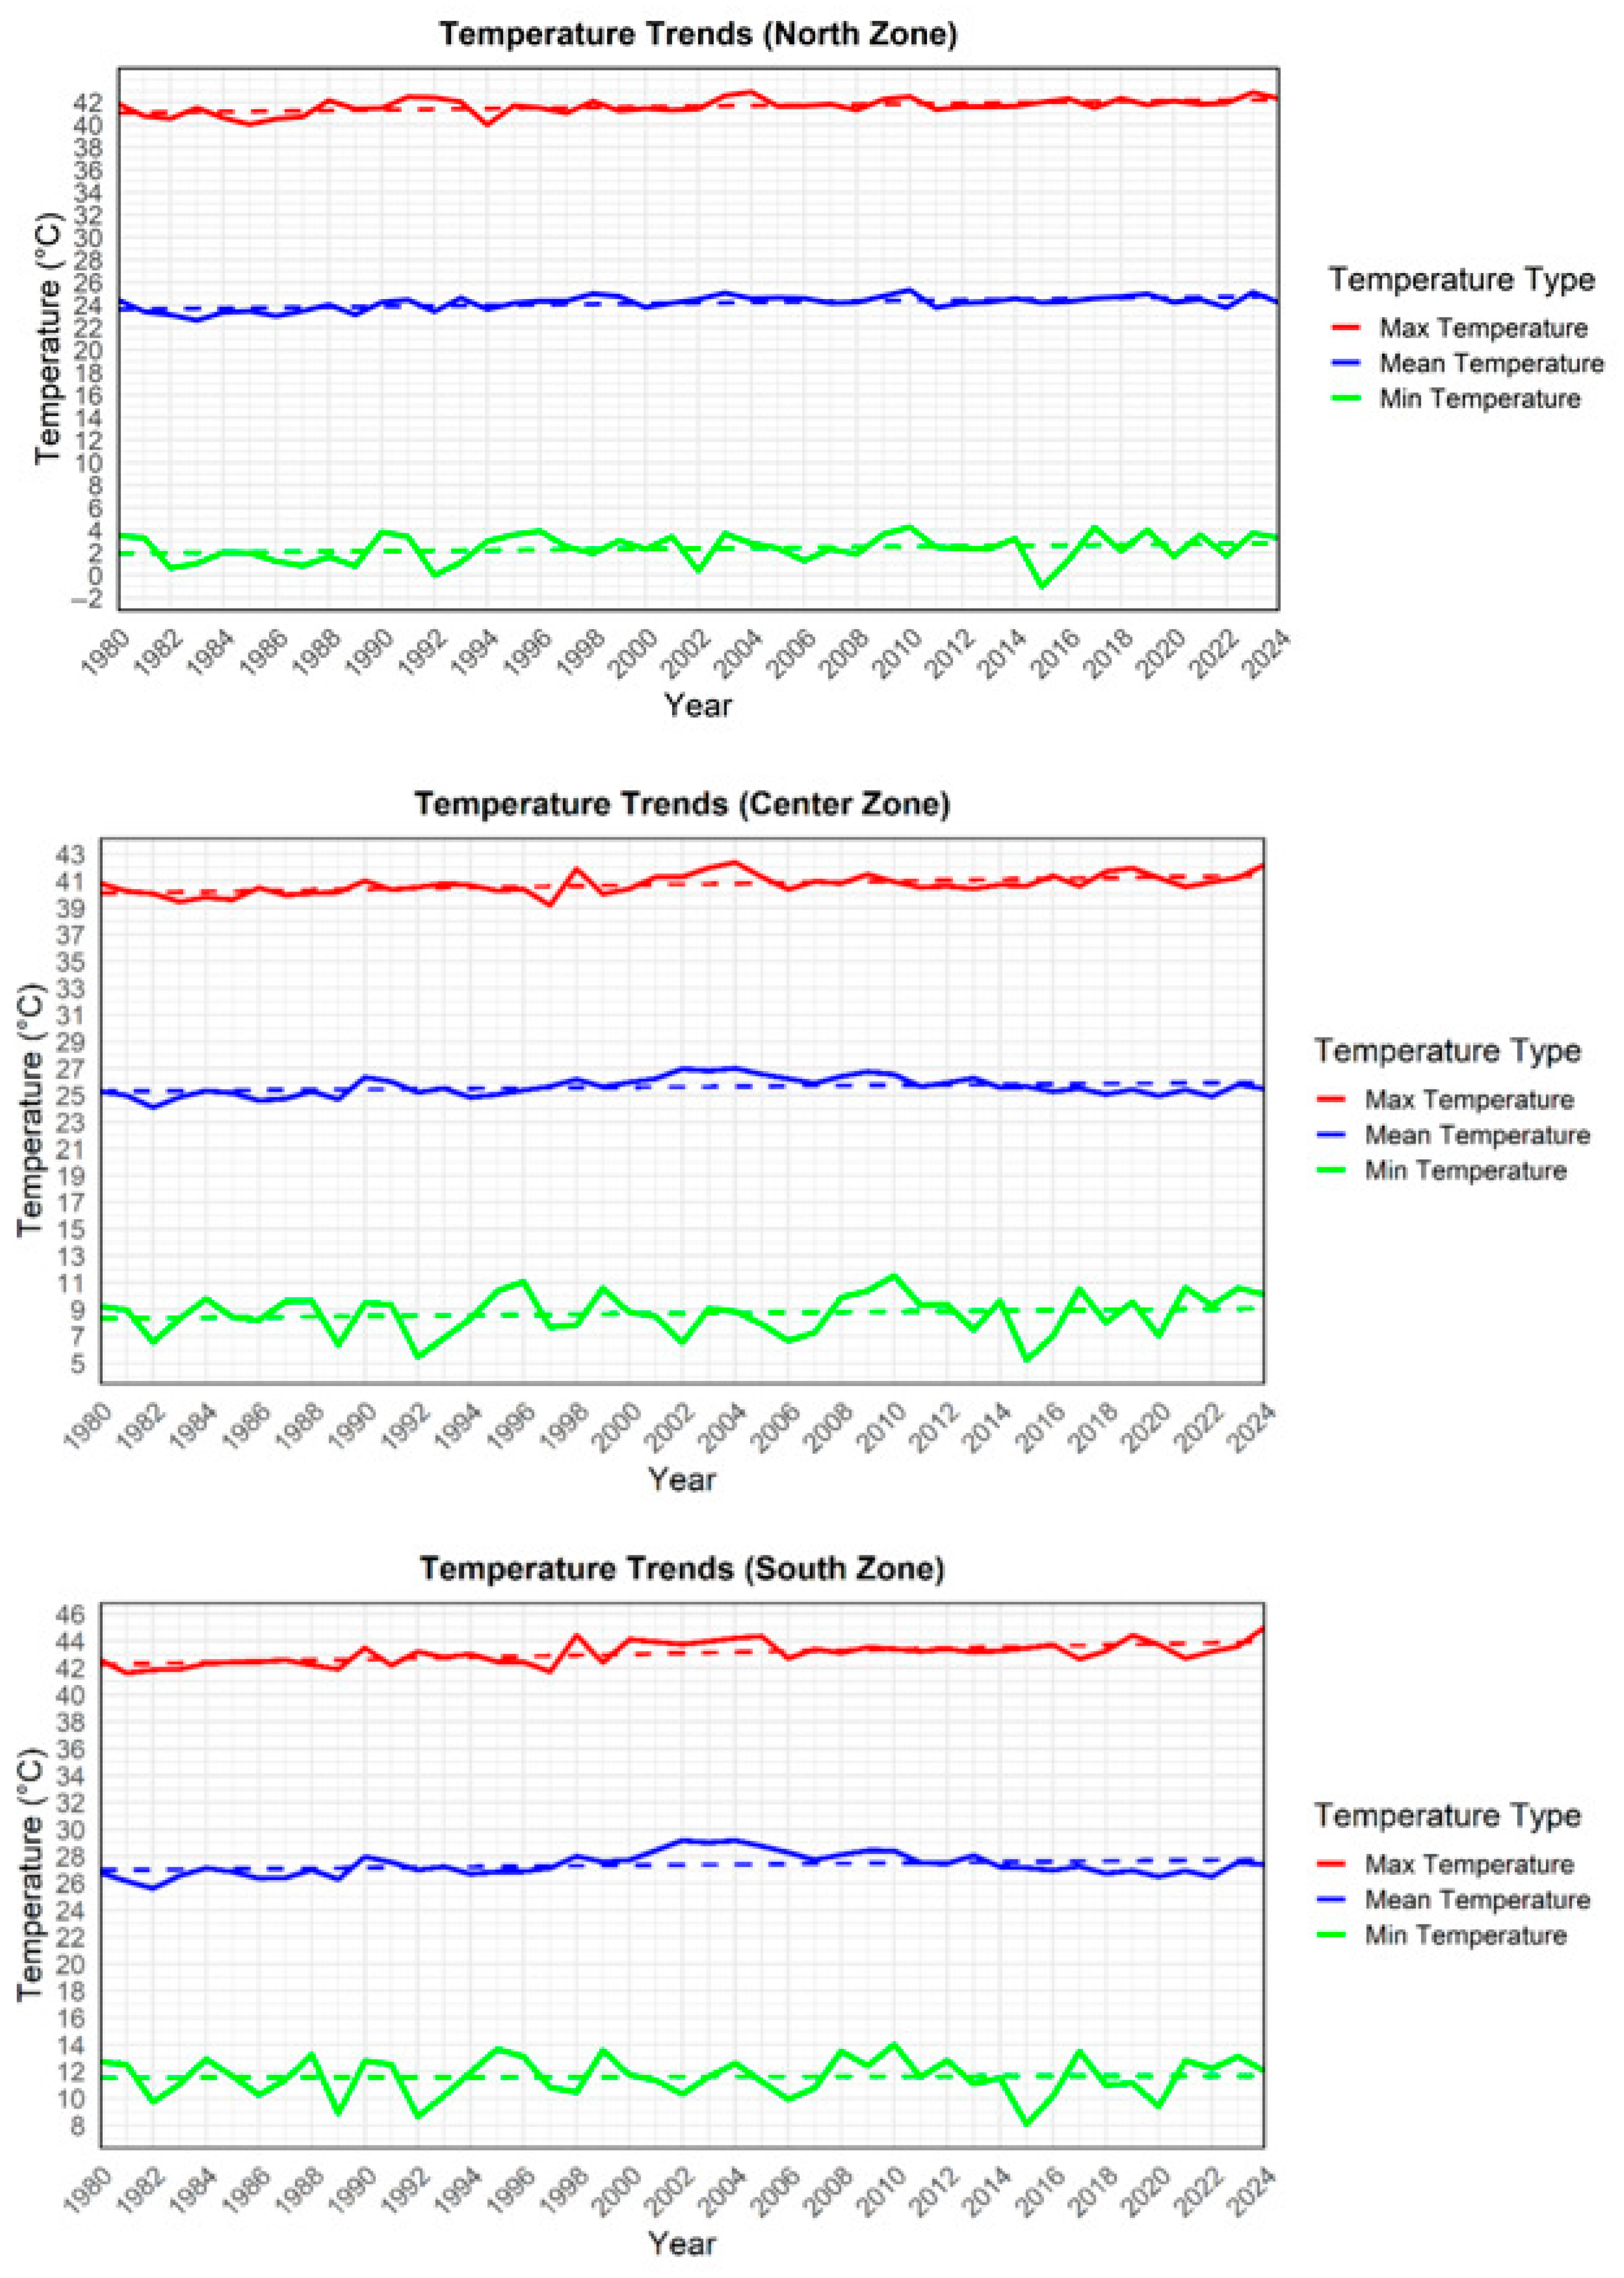
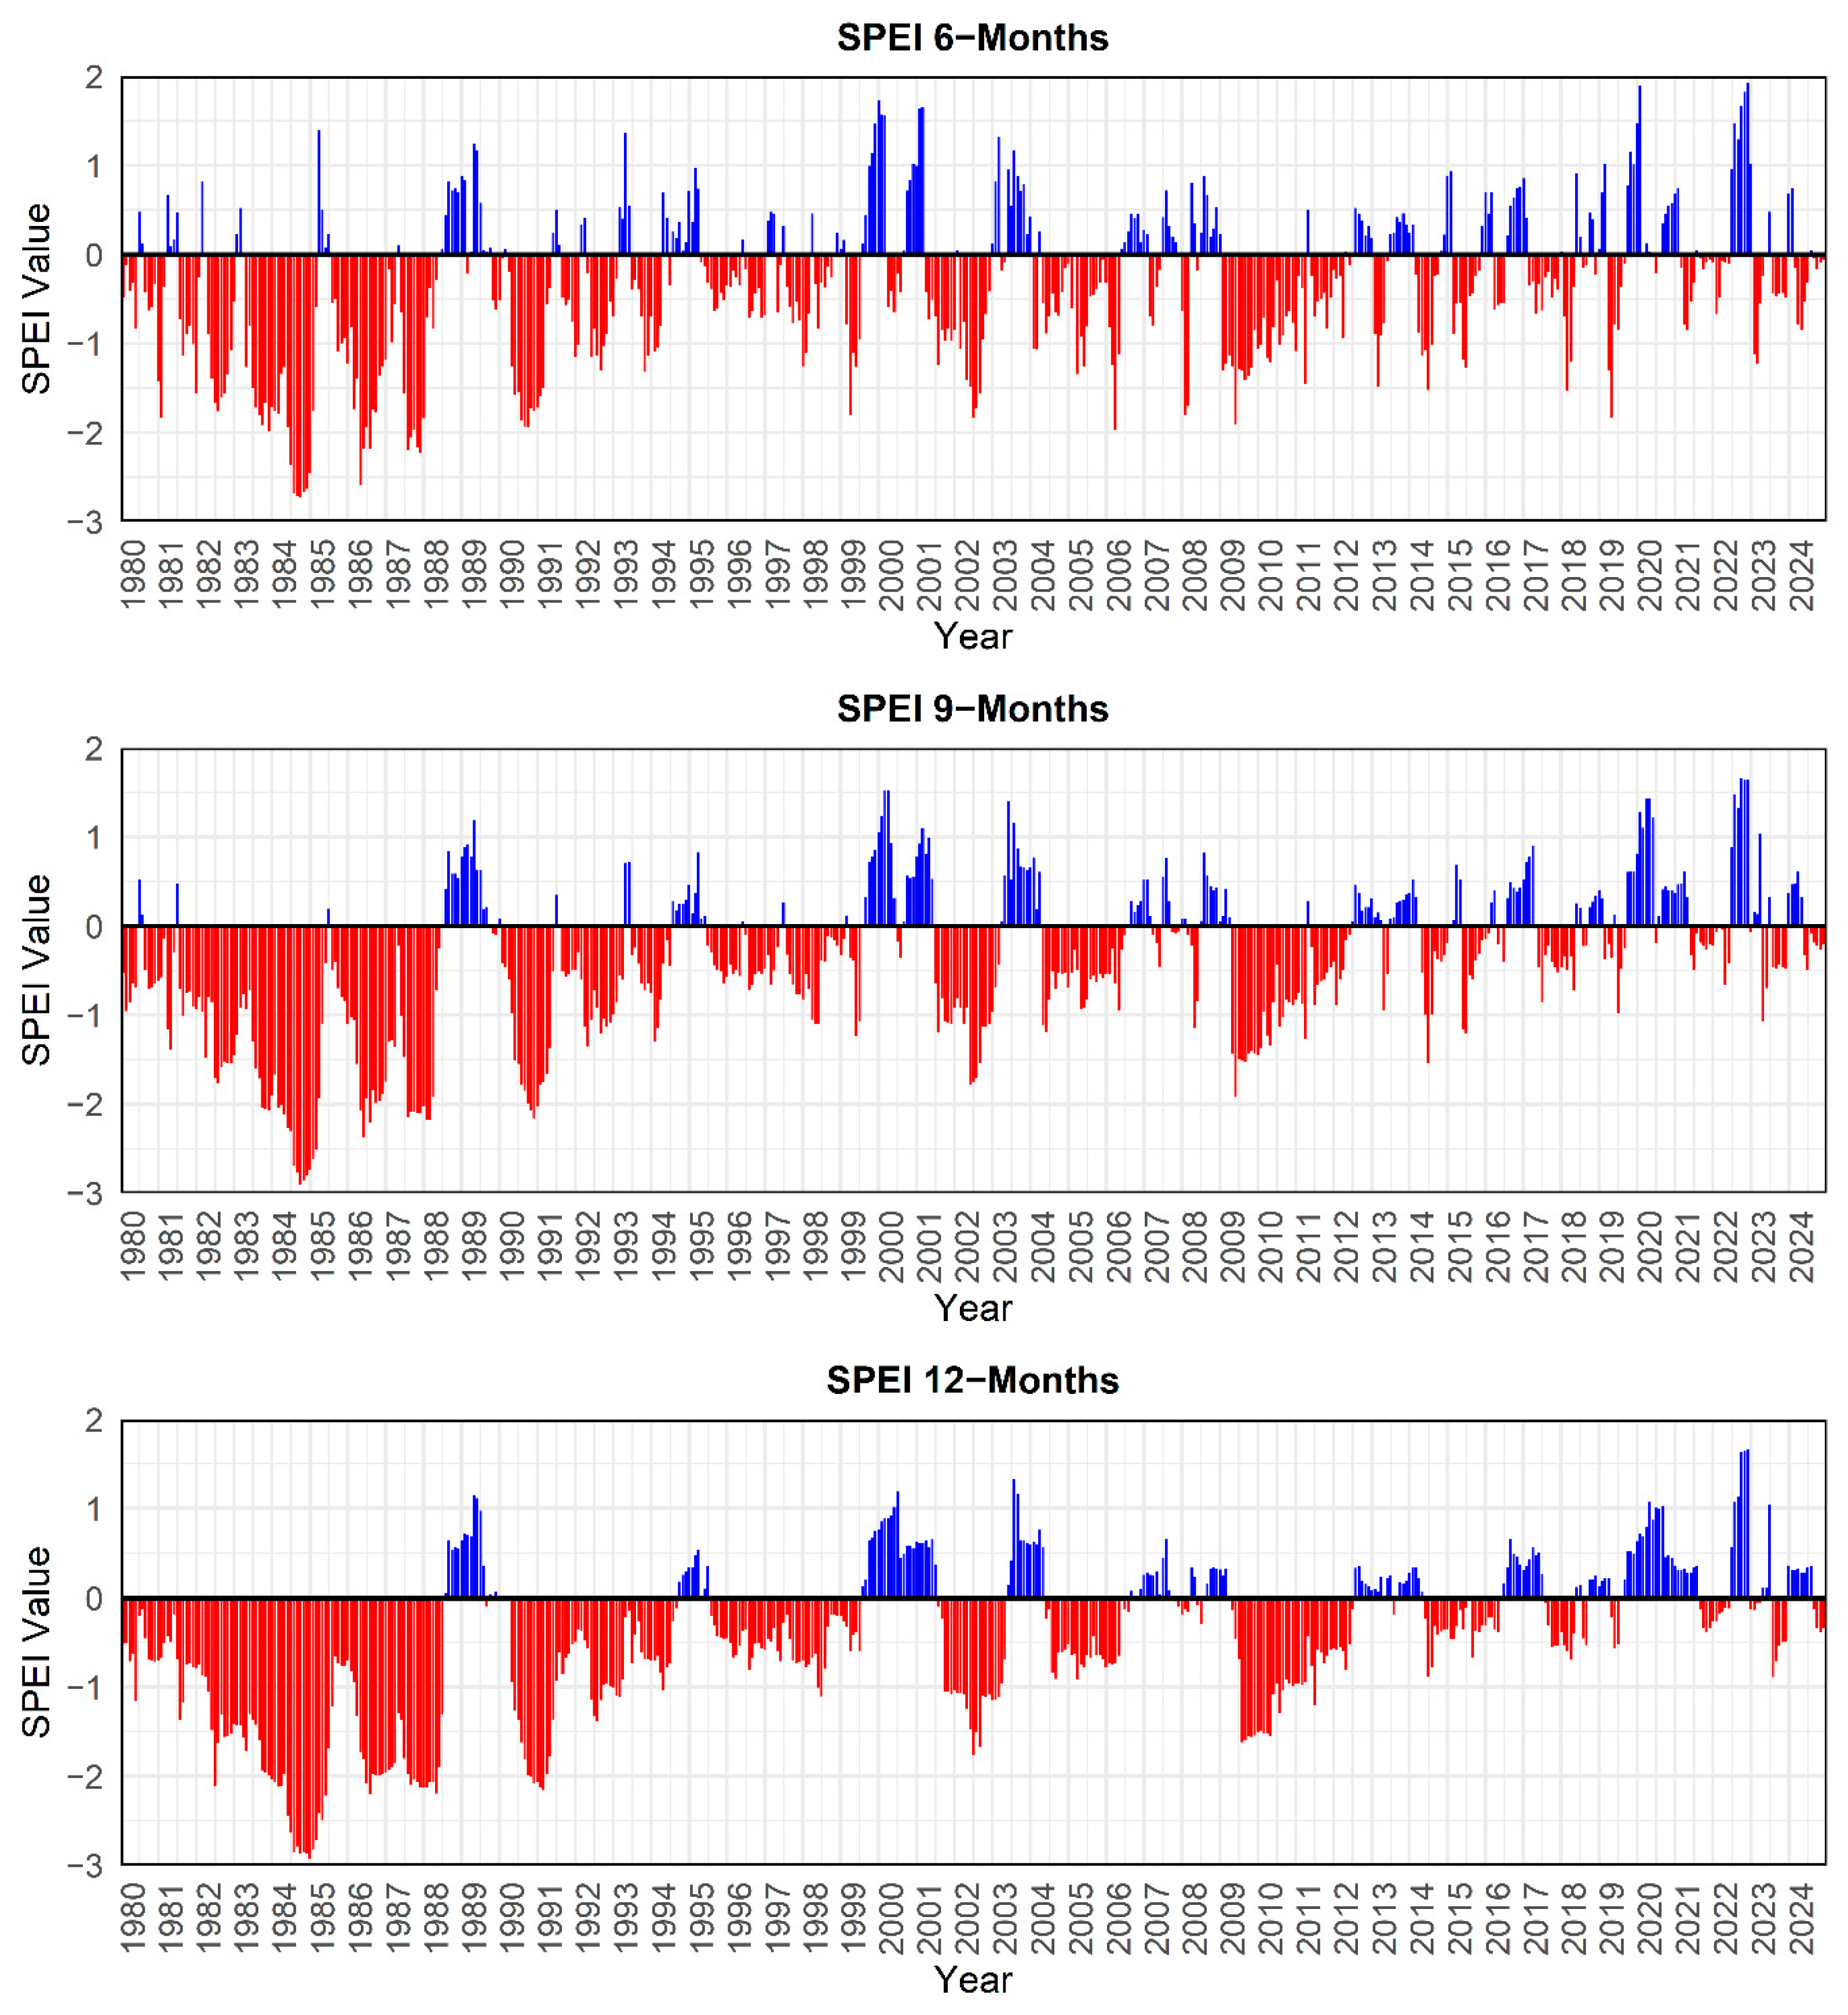

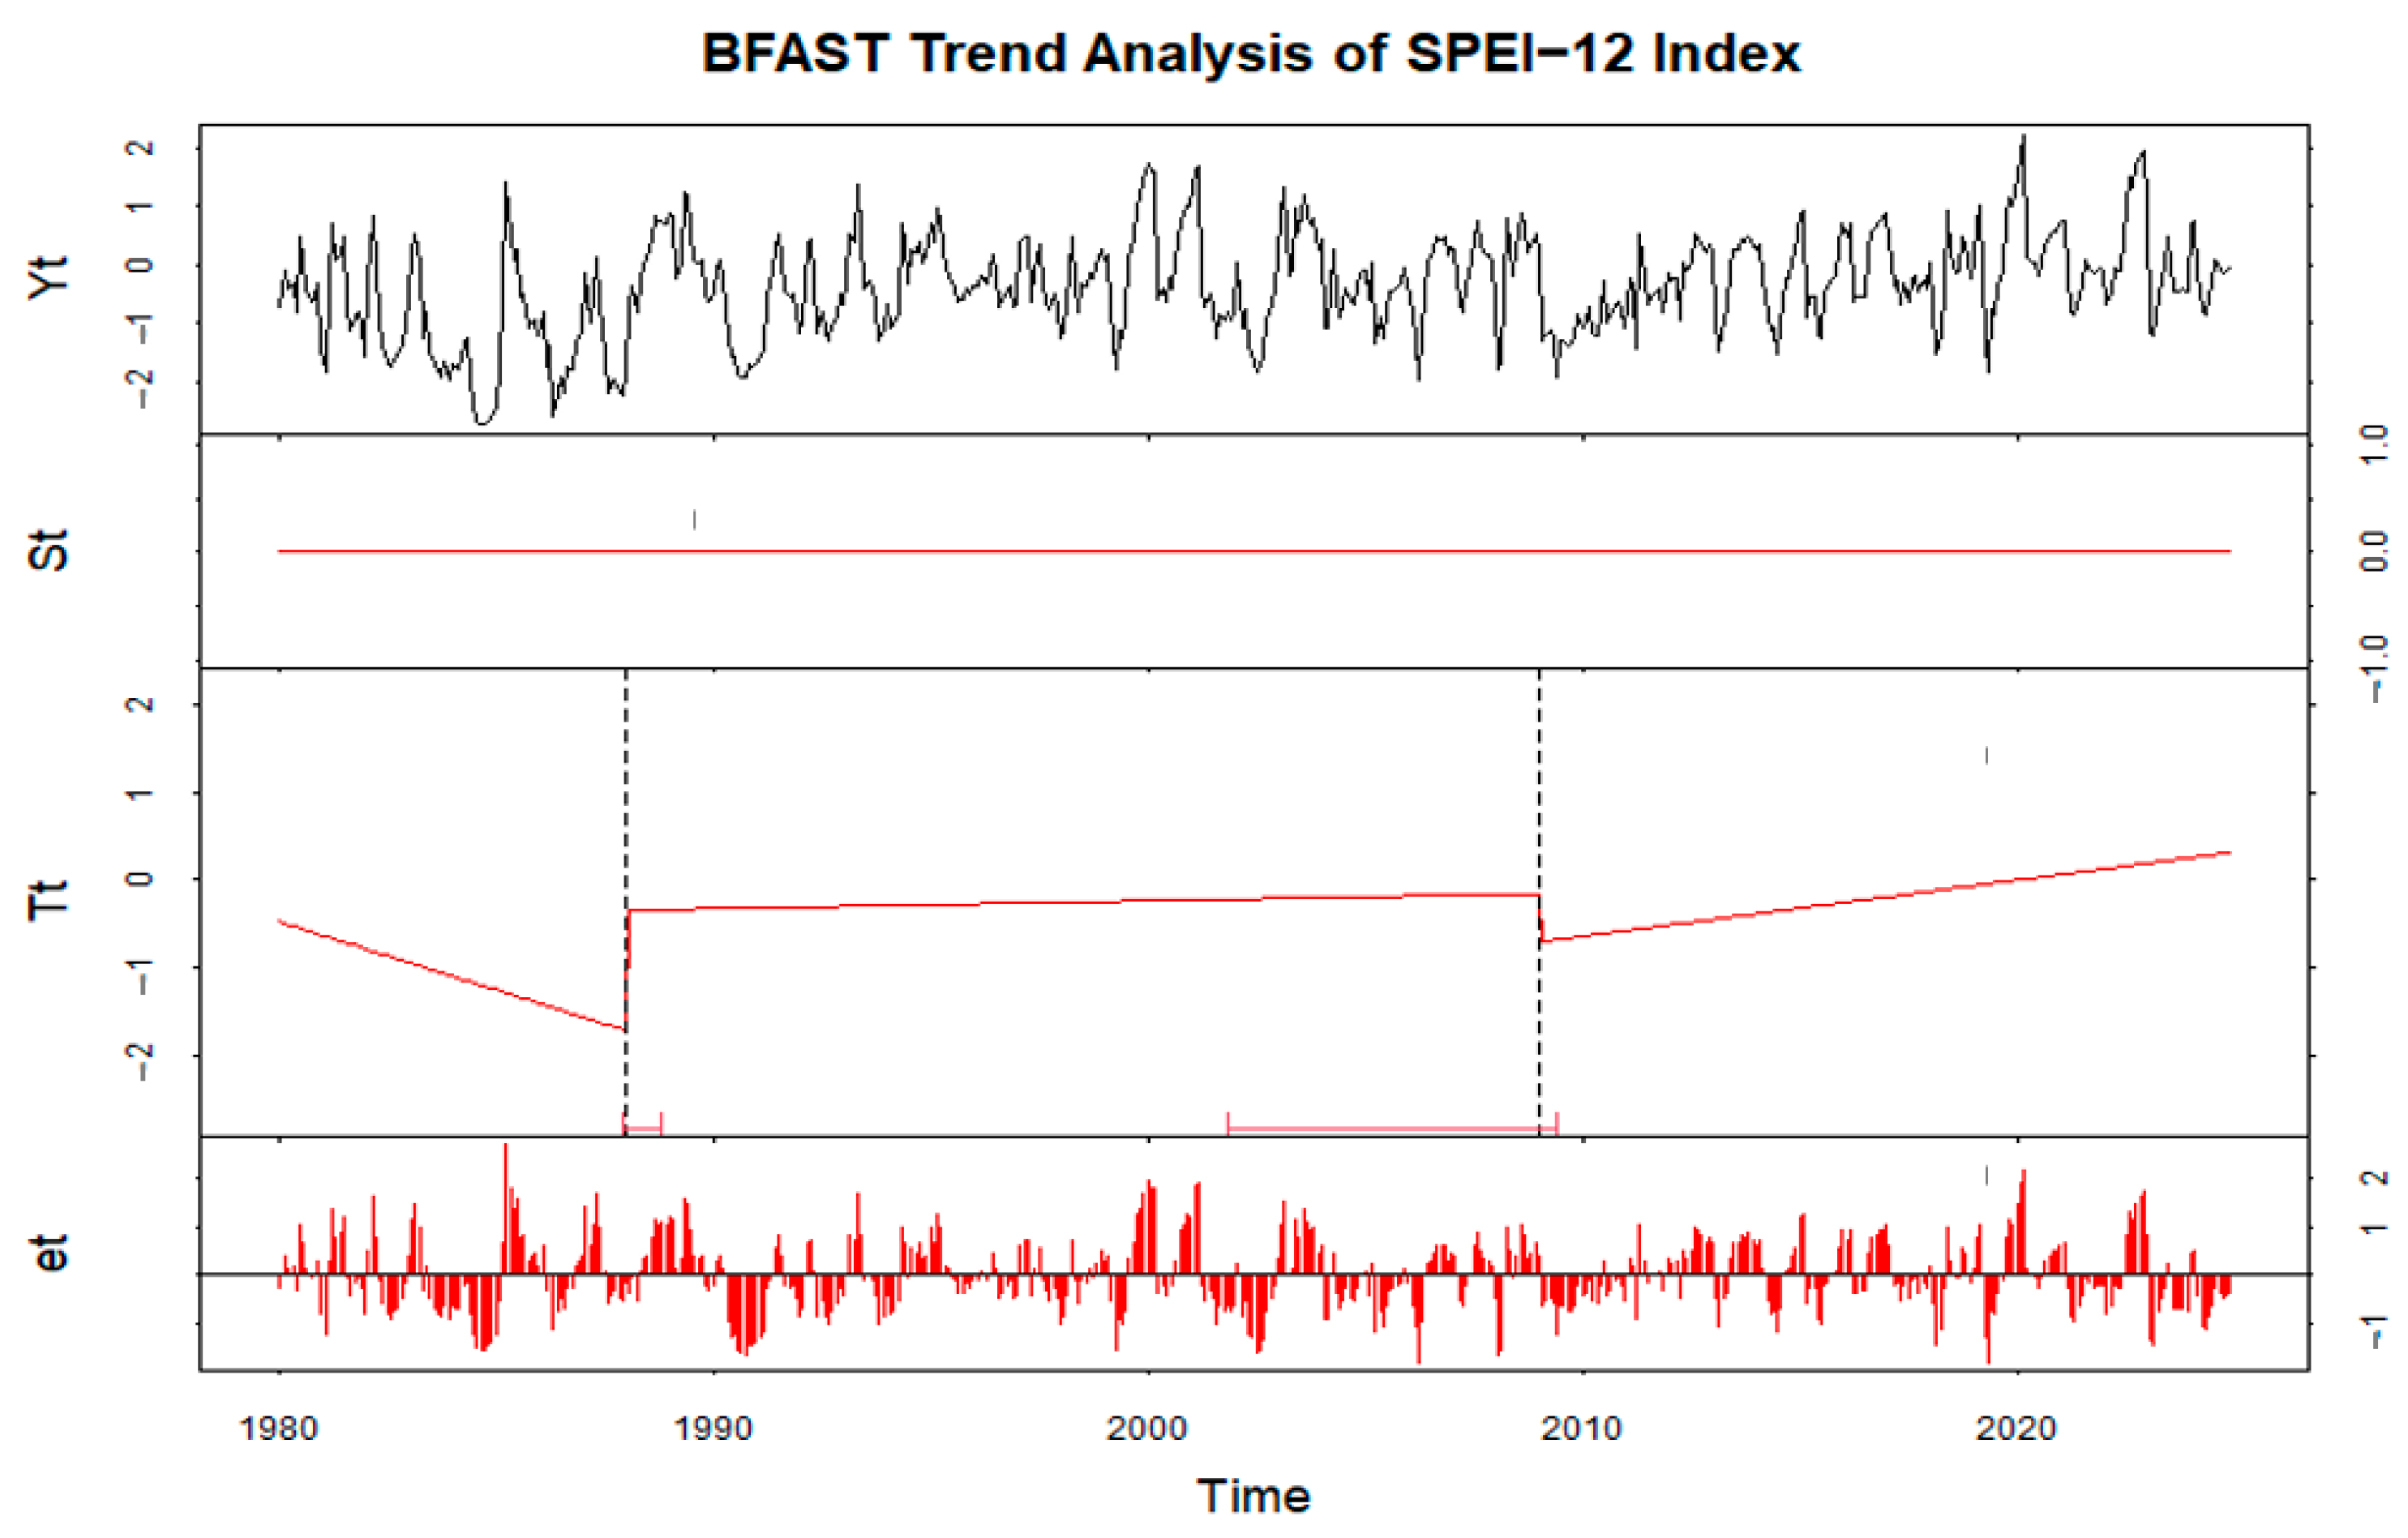


Disclaimer/Publisher’s Note: The statements, opinions and data contained in all publications are solely those of the individual author(s) and contributor(s) and not of MDPI and/or the editor(s). MDPI and/or the editor(s) disclaim responsibility for any injury to people or property resulting from any ideas, methods, instructions or products referred to in the content. |
© 2025 by the authors. Licensee MDPI, Basel, Switzerland. This article is an open access article distributed under the terms and conditions of the Creative Commons Attribution (CC BY) license (https://creativecommons.org/licenses/by/4.0/).