Article

Spatiotemporal Analysis of Land Use Change and Urban Heat Island Effects in Akure and Osogbo, Nigeria Between 2014 and 2023

by
Moruff Adetunji Oyeniyi
1,*,
Oluwafemi Michael Odunsi
1,2,
Andreas Rienow
1 and
Dennis Edler
1
1
Institute of Geography, Ruhr University Bochum, P.O. Box 44780 Bochum, Germany
2
Department of Urban and Regional Planning, Olabisi Onabanjo University, Ago-Iwoye P.M.B. 2002, Ogun State, Nigeria
*
Author to whom correspondence should be addressed.
Climate 2025, 13(4), 68; https://doi.org/10.3390/cli13040068
Submission received: 26 February 2025 / Revised: 14 March 2025 / Accepted: 25 March 2025 / Published: 26 March 2025
(This article belongs to the Section Climate and Environment)

Abstract

:
Rapid urbanization and climate impacts have raised concerns about the emergence and aggravation of urban heat island effects. In Africa, studies have focused more on big cities due to their growing populations and high climate impact, while mid-sized cities remain under-studied, with limited comparative insights into their distinct characteristics. This study therefore provided a spatiotemporal analysis of land use land cover change (LULCC) and surface urban heat islands (SUHI) effects in the Nigerian mid-sized cities of Akure and Osogbo from 2014 to 2023. This study used Landsat 8 and 9 imagery (2014 and 2023) and analyzed data via Google Earth Engine and ArcGIS Pro 3.4. Results showed that Akure’s built areas increased significantly from 164.026 km2 to 224.191 km2 while Osogbo witnessed a smaller expansion from 41.808 km2 to 58.315 km2 in built areas. This study identified Normalized Difference Vegetation Index (NDVI) and emissivity patterns associated with vegetation and thermal emissions and a positive association between LST and urbanization. The findings across Akure and Osogbo cities established that LULCC has different impacts on SUHI effects. As a result, evidence from a mid-sized city might not be extended to other cities of similar size and socioeconomic characteristics without caution.

1. Introduction

Urbanization has increased significantly globally since the mid-twentieth century due to increasing anthropogenic activities accompanied by exponential increases in population. The global population of 2.5 billion in 1950 and 6.1 billion in 2000 is anticipated to be more than 8 billion by the end of 2024 [1,2,3]. It is also estimated that 68 percent of the global population will reside in urban areas by 2050 [2,3,4]. This growth in the global and urban population is, however, unevenly distributed. While some countries in East Asia and Europe are experiencing low population growth, others in Sub-Saharan Africa and South Asia are inundated with increased growth [3,5,6]. In the case of Nigeria, 30, 35 and 43 percent of the population lived in urban areas in 1990, 2000 and 2010, respectively. However, 54 percent of the population were urban residents in 2023 [7].
The evidence of global, regional and local urbanization impacts is the manifestation of unplanned and informal development across cities [8]. Numerous studies [9,10,11,12,13] have shown that many natural landscapes in cities are converted into bare land and built-up surfaces as a result of increasing urbanization. This phenomenon concerns land use and land cover change (LULCC). On the one hand, land cover change refers to altering natural land features, and on the other hand, land use change refers to how humans use a piece of land [14,15]. LULCC, therefore, refers to the conversion, change, and transformation of the Earth’s natural landscape due to human actions and processes such as urbanization, deforestation, and agriculture. LULCC contributes significantly to increasing city temperature by modifying natural green areas with impervious surfaces [16,17]. The current concern for contemporary cities is the formation of surface urban heat islands (SUHI) and their effects on the urban population.
SUHI is the phenomenon in which urban regions exhibit higher surface temperatures than nearby rural areas due to heat-retaining materials, reduced vegetation, and limited evapotranspiration [12,18,19,20]. Many studies [12,21,22,23,24] have asserted that SUHI effects result from urbanization and industrialization based on increased energy use for cooling alongside higher emissions from transportation and industry, leading to increases in greenhouse gas production. Moreover, due to the development of heat-absorbing materials like asphalt, concrete, and resistant surfaces, as well as increasing vehicle emissions and concentrated energy use, an increase in urban population density exacerbates the SUHI effect. For example, major SUHI effects have been observed in Delhi, New York, and Tokyo, resulting in increased energy consumption for cooling, increased air pollution, and negative health effects [25,26,27]. Other scholars have also revealed that city areas can be several degrees warmer than their rural counterparts, considerably influencing local temperatures and contributing to global climatic shifts [4,12,22,28,29].
In Nigeria, several cities are experiencing rapid expansion driven by natural population growth, political influence, industrialization and rural-to-urban migration as people seek better economic opportunities and services [23,30]. This expansion of both metropolitan and mid-sized cities is creating problems of overburdened infrastructure, insufficient housing, increased bare land surfaces, and an increase in SUHI [31]. The issue of rapid urban growth, especially in mid-sized cities, creates a critical need for sustainable urban planning and climate mitigation strategies [21,32,33,34]. To provide information on mitigating temperature increases, public health consequences and climate change, as well as improving urban liveability and resilience, this study addresses the spatio-temporal context of LULCC and the SUHI effects in mid-sized cities, which are exemplified by Akure and Osogbo in Nigeria. The SUHI effect is defined as increased land surface temperatures (LST) in urban areas relative to adjacent rural regions, primarily caused by land use and land cover changes [12,24]. This study will examine SUHI in Akure and Osogbo from 2014 to 2023, using Landsat 8 and 9 TIRS satellite data to extract LST, normalized difference vegetation index (NDVI), emissivity, surface urban heat island (SUHI), and urban thermal field variance index (UTFVI) and quantify geographical and temporal fluctuations. LULCC will be categorized using supervised machine learning techniques (Random Forest), and the association between LULCC and SUHI will be investigated using zonal statistics in ArcGIS Pro, including correlation analysis.
Although several studies examined LULCC and SUHI effects in some cities in Nigeria, they mostly focused on primate cities, leaving mid-sized cities underexplored [35,36,37,38,39]. Consequently, findings from these big cities are not easily transferable to mid-sized cities due to their distinct attributes as lower hierarchical settlements. Furthermore, only limited studies [4,23,32,40,41,42] on mid-sized cities exist in the literature and often examine them in isolation, lacking comparative insights across different cities. Therefore, comparative studies on the spatiotemporal analysis of LULCC and its influence on SUHI in Nigeria’s rapidly growing mid-sized cities remain scarce. This study is significant for examining variations in LULCC and its influence on SUHI in two mid-sized Nigerian cities. This study will provide insights that are crucial for understanding distinct urbanization patterns and climate impacts, enabling decision-makers to assess whether mid-sized cities require similar or tailored resources for planning and management, particularly in resource-constrained developing nations. The continuous transformation of land for residential, commercial, and industrial activities contributes to climate change, particularly global warming, by intensifying SUHI effects. Therefore, this study is essential in effectively examining, analyzing, and comparing LULCC and SUHI effects in Akure and Osogbo, Nigeria.
The aim of this study is, therefore, to investigate the relationship between land use and land cover (LULC) change and SUHI effects in Akure and Osogbo between 2014 and 2023. This offers comparative results between two mid-sized cities, providing insights into city-specific SUHI reduction strategies based on distinct characteristics such as growth trends, socioeconomic variables, green infrastructure, etc. This study has three research questions, namely: (i) How has LULCC altered in Akure and Osogbo between 2014 and 2023? (ii) What are the spatial and temporal variations in the effects of SUHI on Akure and Osogbo from 2014 to 2023? (iii) What is the relationship between LULCC and SUHI effects in Akure and Osogbo during the study? The objectives of this study are to (i) assess the LULCC in Akure and Osogbo, (ii) estimate the SUHI effects in Akure and Osogbo, and (iii) examine the relationship between LULCC and SUHI effects in Akure and Osogbo between 2014 and 2023. The following sections will outline the materials and methods, including the study area, data acquisition, and data analysis. The study results will cover LULC changes in Akure and Osogbo from 2014 to 2023, the surface urban heat island (SUHI) effects in these cities during the same period, and the relationship between LULC changes and SUHI effects. Finally, the discussion and conclusion will be presented.

2. Materials and Methods
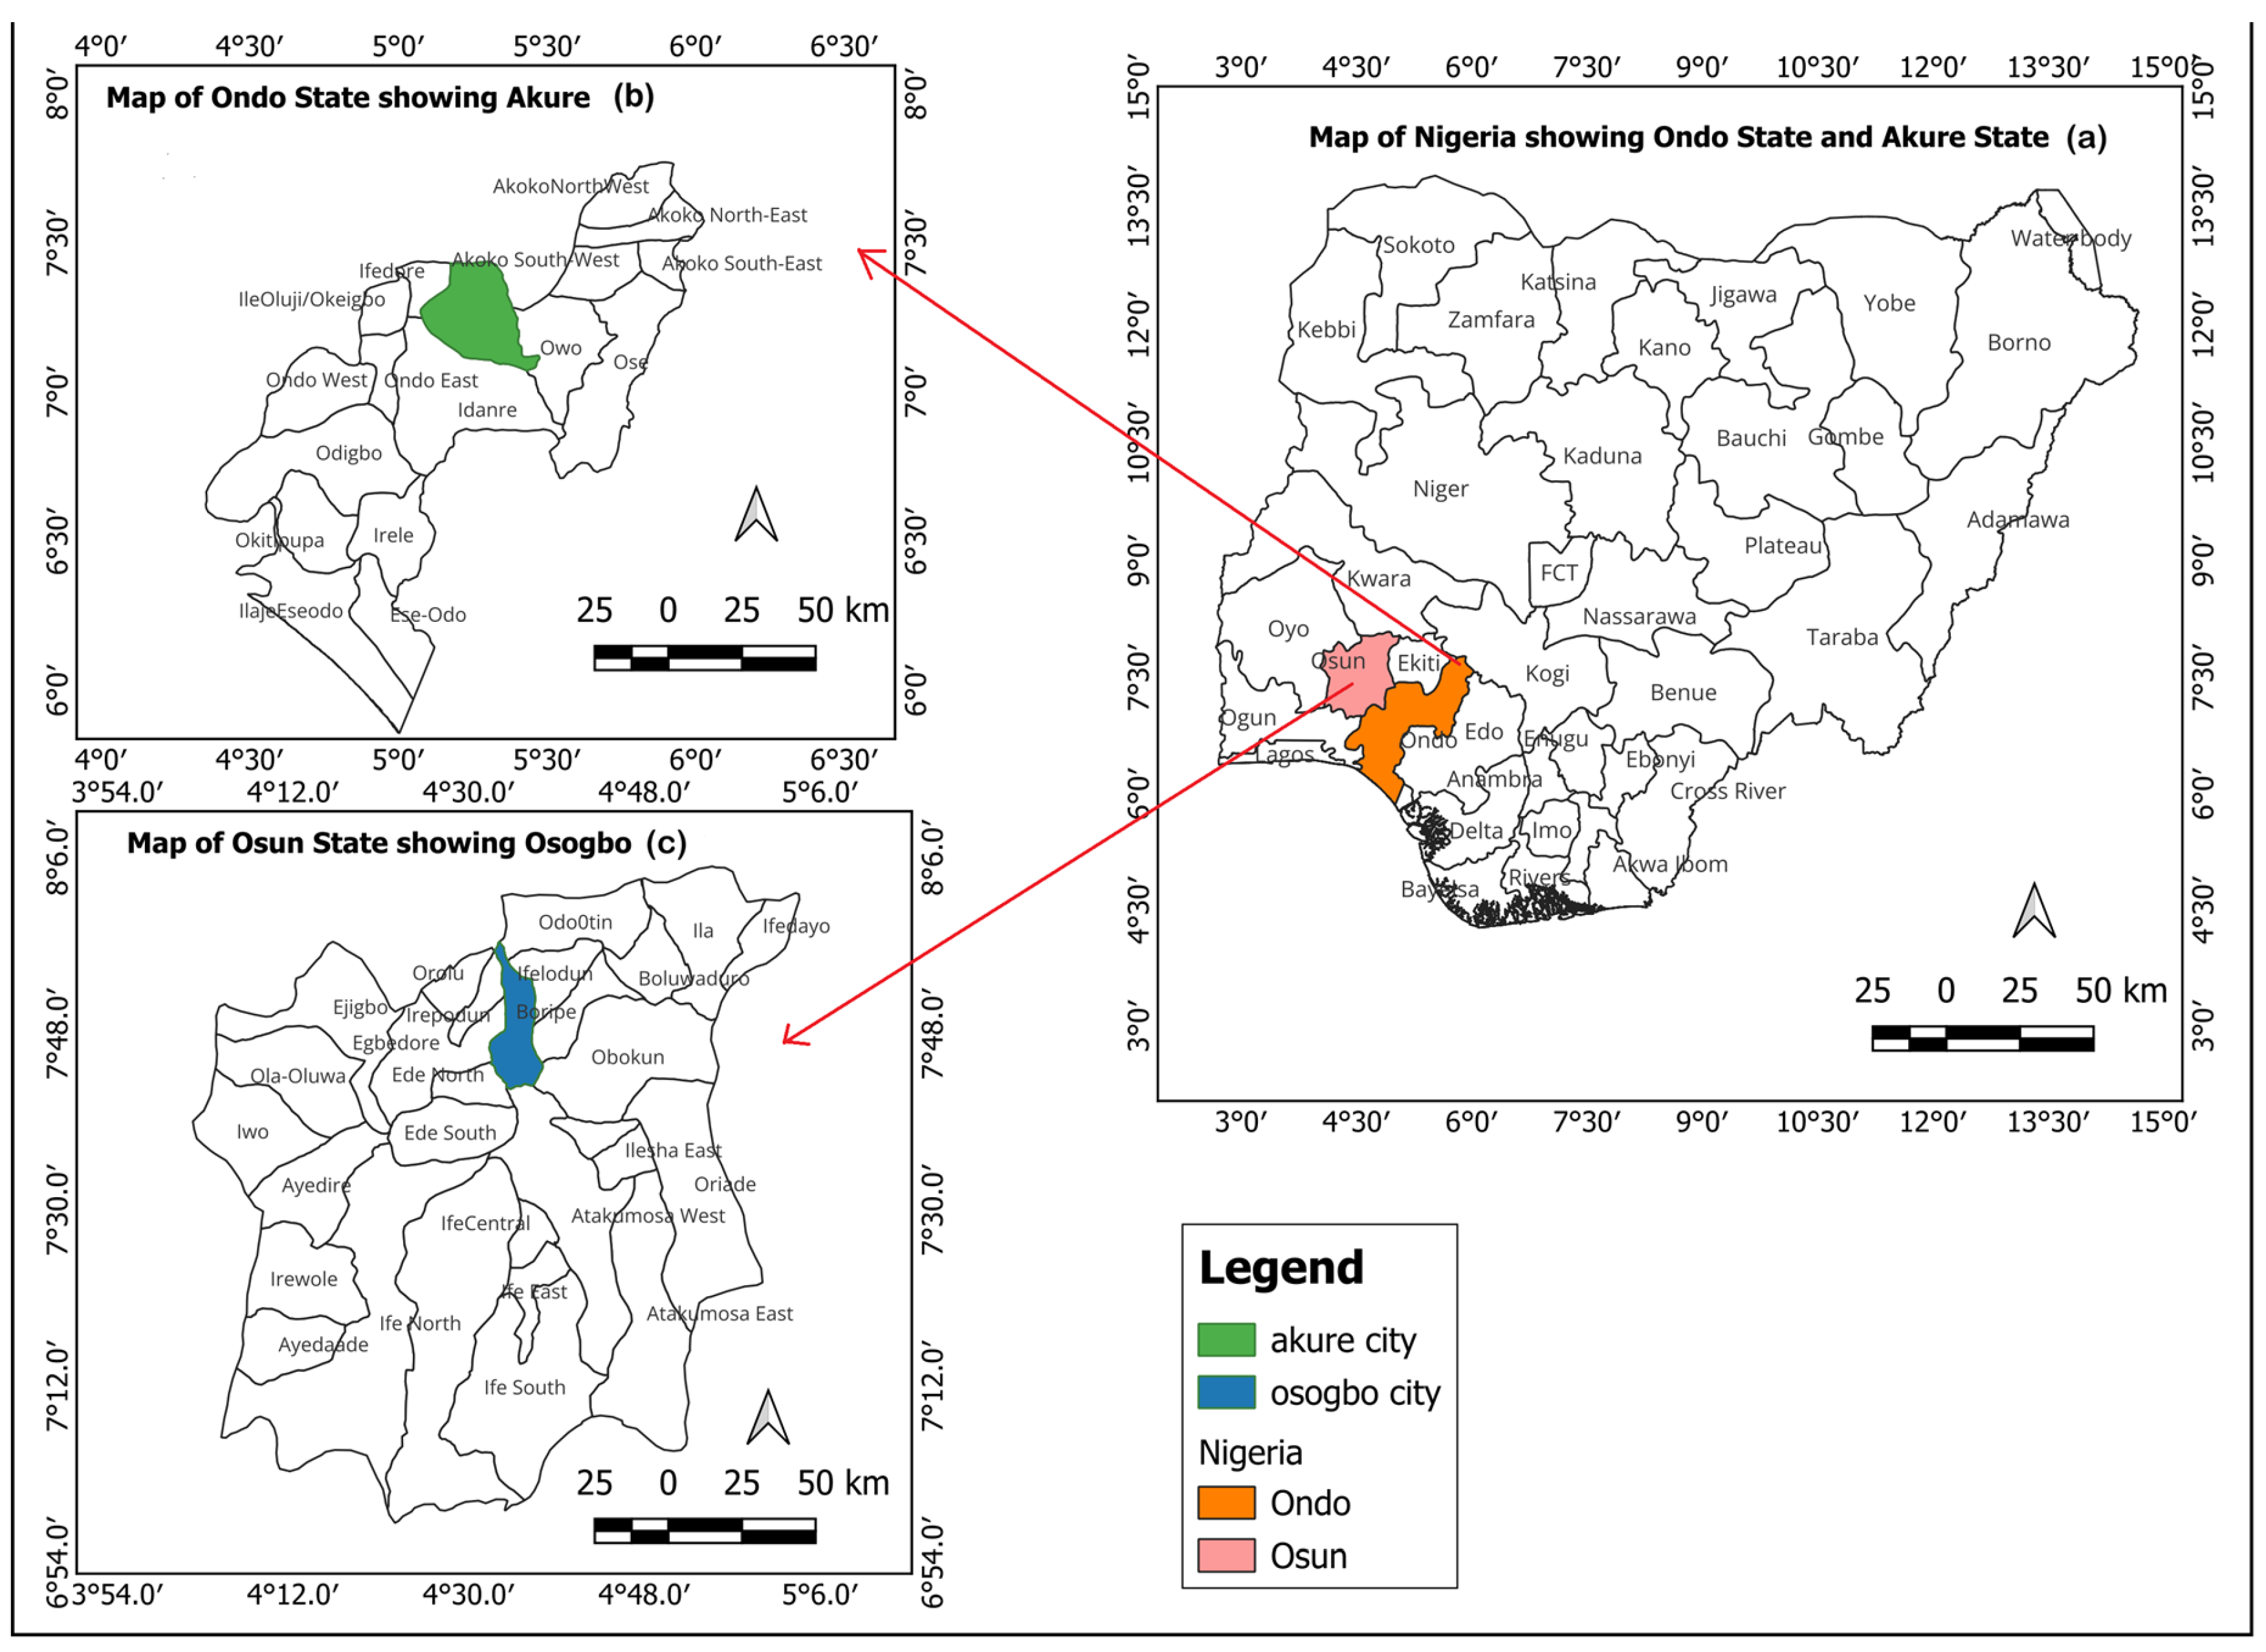
The study uses a geospatial research design that combines geographic information system (GIS) techniques with remote sensing. Both qualitative and quantitative analyses were performed on the collected spatial data. While quantitative analysis involved extracting statistical data for additional assessment, qualitative analysis involved processing satellite imagery to create maps of surface urban heat islands (SUHI) and land use/land cover (LULC). LULCC and surface urban heat island (SUHI) impacts in Akure and Osogbo, Nigeria, for 2014 and 2023 were evaluated using NASA/USGS Landsat 8 and 9 imagery that were viewed through Google Earth Engine (GEE). The Random Forest technique was used for supervised classification once the data had been quality-filtered. In order to investigate vegetation cover, surface urban heat intensity, and environmental stress, key indices such as the Urban Thermal Field Variance Index (UTFVI), emissivity, land surface temperature (LST), and NDVI were calculated. Python 3.13.2 was used for statistical analysis, including Spearman’s correlation, and QGIS and zonal statistics in ArcGIS Pro. The Sankey charts were used for processing and visualizing spatial data. The purpose of the study is to assess urban thermal comfort, LULCC trends, and their effects on SUHI. The below sub-sections contain the study area, data acquisition, data analysis and quantitative analysis.

2.1. Study Area

This study was conducted in Nigeria, a developing country in West Africa. It considers two mid-sized cities: Akure and Osogbo. Akure is in Ondo State, which is positioned in the southwestern part of Nigeria. The city is situated at 7.25° N latitude and 5.20° E longitude (Figure 1b). It is the major administrative and economic center of Ondo State. It comprises two local governments, namely Akure North and South [4]. According to the 2022 population census, the Akure North Local Government population was 200,900, while the Akure South Local Government population was 553,400 [43]. Akure has seen an influx of people from its hinterlands, including Ifedore and Idanre since it was designated as the capital of Ondo State in 1976. The authors of [44] found a correlation between this occurrence and the city’s physical alterations and increased urban development. The city spans a variety of environments, including tropical rainforests and savanna woodland. Akure’s economy is diverse, with agriculture (particularly cocoa, yam, and cassava farming), trade, industry, and services supporting a mix of traditional and modern residential and business sectors [45].
Osogbo is in Osun State, situated in the southwestern part of Nigeria. The city is located at 7.77° N latitude and 4.56° E longitude (Figure 1c). Osogbo is the capital city of Osun State with two local government councils, namely Olorunda and Osogbo local government areas. It is important to note that Osogbo has only two local government areas [46,47,48,49], in contrast to various examples in the literature portraying Osogbo with several local governments, which is frequently referred to as Osogbo and its environs in these articles [9,21,50]. These have caused general misunderstandings on a global scale regarding the correct geographical extent of Osogbo on the world map. Osogbo is an important administrative, cultural, and economic center. Since Osun State was established in 1991, the population has increased dramatically, which has increased urbanization and the influx of people into Osogbo and its suburbs. The population of Osogbo local government was 201,900 in 2022 and Olorunda local government’s population was 170,900 in 2022 [43]. As the State Capital, it houses government offices, educational institutions, and cultural landmarks, significantly contributing to regional governance and development.

2.2. Data Acquisition

This study used Landsat images produced by the National Aeronautics and Space Administration (NASA)/United States Geological Survey (USGS). The data were sourced from the Google Earth Engine (GEE) catalog, a cloud platform for environmental monitoring and research that provides massive satellite datasets, scalable computing power, and machine learning for geospatial analysis [51]. Specifically, data were obtained from two Landsat sensors. The first is Landsat 8 (acquired on 4 June 2024), the Ordinary Land Imager-1/Thermal Infrared Sensor-1 (OLI-1/TIRS-1). The second is Landsat 9 (acquired on 5 June 2024), the Ordinary Land Imager-2 and Thermal Infrared Sensor-2 (OLI-2/TIRS-2). Both sensors contain eleven (11) spectral bands (Table 1). The data required are for LULC classification and the analysis of vegetation, emissivity, and temperature for SUHI estimation. Hence, the bands with the spectral information needed for these data types were acquired. In GEE, satellite image collections were acquired from Landsat 8 for 2014, and those from Landsat 9 were acquired for 2023. See Figure 2 for the methodological framework. The dates were chosen based on the data available and the quality of the Landsat sensors. The polygon shapefiles of Nigeria and its states were acquired from DivaGIS. The boundaries of Akure and Osogbo were extracted from shapefiles in ArcGIS and used as the region of interest (AOI).

2.3. Data Analysis

2.3.1. Image Classification

The respective AOIs for Akure and Osogbo were imported into GEE to specify the boundary for the study. The image collections for Landsat 8 (“LANDSAT/LC08/C02/T1_L2”) and Landsat 9 (“LANDSAT/LC09/C02/T1_L2”) were obtained and filtered by dates (date range equals 1 January–31 December 2014; and 1 January–31 December 2023). We obtained the GEE catalog’s Level 2, Collection 2, and Tier 1 surface reflectance data. Since the data have been adjusted for geometrical, radiometric, and atmospheric errors and are currently offered and recommended by the service provider, they were utilized. The data were imported into GEE as image collections. The images were filtered for cloud cover at less than 30% (Akure 2014 cloud cover of less than 10%, Akure 2023 cloud cover of less than 20%, and both Osogbo 2014 and 2023 cloud cover of less than 30%) and subjected to the mask cloud function (bits 3 and 5 employed for cloud Bit Mask and shadow BitMask, respectively). The masked pixels were filled with annual median values. The median images of the image collections for 2014 and 2023 were derived. The spectral indices of NDVI complemented the median images to provide additional spectral information. The aggregated bands were subject to the Random Forest classifier for supervised classification. Before the classification, sample data were collected within the GEE classes for five identifiable Akure and Osogbo classes: built, bare land, light forest, thick forest, and water. Ground observation points were assembled with Google Earth Pro’s aid to evaluate the LULC maps’ correctness [52,53]. The random forest classifier was trained with 70% of the sample data and tested with 30% of the sample data. The accuracy of classification is also evaluated using the Kappa coefficient matrix. The overall accuracy and Kappa coefficient for model testing are also presented. The overall accuracies for Akure in 2014 and 2023 are 0.812 and 0.800, respectively, and for Osogbo are 0.834 and 0.816, respectively. The Kappa coefficients for Akure in 2014 and 2023 are 0.746 and 0.705, respectively, and for Osogbo in 2014 and 2023 are 0.791 and 0.738, respectively.

2.3.2. Random Forest

The author of [54] has created a new non-parametric ensemble machine-learning technique called Random Forest (RF). The RF algorithm is frequently used to address environmental issues, such as managing natural hazards and water resources. It can handle various data, including numerical and satellite imagery. It is a decision tree-based ensemble learning technique that combines huge ensemble regression and classification trees. We chose Random Forest for this study because of its durability, high accuracy, and ability to handle complicated datasets in remote sensing. RF is useful for organizing huge datasets, minimizing overfitting, and generating changeable significance estimates. The number of trees, described by “n-tree”, and the number of features in each split, justified by “hyperparameter tuning”, were the parameters needed to set up the RF model used. Classification trees allow each tree to make its own decisions and offer precise classification to control the majority vote among all the trees in the forest. In this study, we created LULCC maps of Akure and Osogbo using the Google Earth Engine’s “randomForest” package. The RF algorithms perform hyperparameter tuning with a testing range of 10, 100, and 10 sequences and with the smileRandomForest for nTrees. The hyperparameter tuning chart for trees and accuracies identified the best NTrees. The number of trees used for hyperparameter tuning was 80, 90, 90, and 50 for Akure 2014, Akure 2023, Osogbo 2014, and Osogbo 2023, respectively. The following parameters were utilized: var bands, var trees, var accuracies, var classifiers, classProperty, var validated, var confusionMatrix, and var accuracy. The RF classification was done with the best hyperparameter value, and the classes of LULC of Akure and Osogbo were merged and displayed. The use of RF allows correct LULC classification, which is critical for accurately estimating Surface Urban Heat Island (SUHI) effects and facilitating informed urban planning and environmental management.

2.3.3. Quantitative Analysis

This study employed quantitative methods to evaluate the accuracy and reliability of classification results. The key statistical tools involved include the Kappa coefficient, Normalized Difference Vegetation Index (NDVI), and Confusion Matrix. The Kappa coefficient, which ranges from −1 to 1, is an arithmetic measure used to estimate the accuracy of LULC classification by matching the observed classification with reference or ground truth data. It is more robust than simple accuracy because it considers the possibility that the agreement occurred by chance. Equation (1) shows the formula for calculating the Kappa coefficient. A score of 1 indicates perfect agreement, 0 indicates no agreement beyond chance, and negative values suggest agreement is worse than random [55]. The formula used for Kappa calculation is the following:
K = Po   -   Pe 1 -   Pe
where Po is the observed accuracy and Pe is the expected accuracy by chance.
The Normalized Difference Vegetation Index (NDVI) is a popularly used remote sensing indicator to measure vegetation health and cover [56]. It is determined using satellite imagery’s red and near-infrared (NIR) bands (Equation (2)).
NDVI = NIR   -   Red NIR + Red
NDVI values range from −1 to +1, where higher values specify compact vegetation, values close to zero indicate bare soil and negative values typically signify water or non-vegetative surfaces. In this study’s LULC analysis, NDVI helps distinguish between vegetated and non-vegetated areas and monitor changes over time.
A confusion matrix is one of the important parts of evaluating classification performance. It shows the number of accurate and inaccurate projections made by the model related to the actual classifications. The matrix helps calculate various accuracy metrics, such as overall accuracy (Equation (3)), producer’s accuracy, consumer’s accuracy and Kappa coefficient. The confusion matrix was used for testing, and the training matrix was used to analyze the actual and predicted classification [57]. This matrix is very important in validating and assessing LULC classifications, offering a demanding evaluation of the model’s performance, and other metrics such as precision, recall, and F1 score were calculated by the following equation:
Overall   Accuracy = Sum   of   Diagonal   Elements Total   Number   of   Samples
Emissivity (ε) is the energy discharged by a surface divided by the energy radiated by a blackbody at the same temperature [58]. The ε can be calculated with the NDVI threshold approach (Equation (4)). This method identifies land cover types (built, bare land, light forest, thick forest and water) with different emissivity values. Emissivity is then determined based on the percentage of vegetation and the type of land cover with the following equation:
ε = εv ⋅ Pv + εs ⋅ (1 − Pv) + C
where εv is the emissivity of thick vegetated surfaces (usual value of 0.985), Pv is the Proportion of Vegetation in the study area (usual range 0 to 1), εs is the emissivity of bare land (usual value of 0.960), and C is a correction factor for surface roughness, which can usually be set to zero except where specific roughness data are obtainable.
Land Surface Temperature (LST) is an important parameter for determining the surface energy balance, land cover types, and SUHI monitoring [59]. It requires three main stages, namely (i) converting digital numbers to TOA radiance (Equation (5)), (ii) converting radiance to brightness temperature (Equation (6)), and (iii) applying surface emissivity correction to get the actual LST (Equation (7)).
(i)
Convert Digital Numbers (DN) to TOA radiance. The Top of Atmosphere (TOA) radiance (Lλ) is estimated as follows:
L λ = M L × Q cal + A L
where M L = Radiance multiplicative scaling factor, A L = Radiance additive scaling factor, Q c a l = Digital number (DN) of the thermal band.
(ii)
Convert TOA radiance to brightness temperature. The Planck equation estimates the brightness temperature (TB) in Kelvin:
T B = K 2 ln K 1 L λ + 1
where K1 is thermal constant 1, K2 is thermal constant 2, and Lλ is the TOA radiance from stage (i).
(iii)
Correct for surface emissivity to calculate LST. The normalized land surface temperature (LST) is determined by adjusting the brightness temperature using surface emissivity (ε):
LST = T B 1 + λ T B ρ ln ε
where λ is the wavelength of emitted radiance (λ = 10.895 × 10⁻⁶ for Landsat 8 and 9), ρ is h ⋅ c/σ = 1.438 × 10⁻² m·K (Planck’s constant), and ε is the emissivity.
The SUHI effect is observed where built areas experience substantially higher temperatures than the surrounding rural areas [42]. It is calculated using LST, as given below (Equation (8)):
SUHI = LST LSTmean LST STD
where LST is the land surface temperature, LSTmean is the mean of the LST, and LSTSTD is the standard deviation of the LST.
The Urban Thermal Field Variance Index (UTFVI) quantifies the thermal comfort and environmental stress in the built areas based on the difference between the land surface temperature and the mean LST [60]. It is calculated by the equation given below (Equation (9)):
UTFVI = LST LSTmean LST
We calculated the UTFVI by entering the necessary parameters into GEE reducers. The authors of [61] define UTFVI ranges as follows: <0.000 (none), 0.000–0.005 (weak), 0.005–0.010 (moderate), 0.010–0.015 (strong), 0.015–0.020 (stronger), and ≥0.020 (the strongest). Based on these classifications, we divided the UTFVI in our study area into three categories: −0.225 to −0.031 (none), −0.030 to 0.070 (moderate), and 0.071 to 0.281 (strong). The SUHI effects are rated excellent, good, and poor within these categories.
The Nigeria shapefile was downloaded and processed in QGIS Desktop 3.36.0 to create the study area map (Figure 1a). Additionally, ArcGIS Pro 3.4 was used to map the LULC, NDVI, Emissivity, LST, SUHI, and UTFVI shapefiles. Statistical analysis, including Spearman’s correlation, was conducted using Python libraries to assess the correlation between NDVI and SUHI. The relationship between LULC and SUHI effects was analyzed through zonal statistics in ArcGIS Pro 3.4. LULC change classifications for Akure and Osogbo were further visualized with Sankey charts using Python libraries, illustrating land cover changes from 2014 to 2023. These shapefiles were then downloaded and pre-processed in ArcGIS Pro to generate all necessary study maps.

3. Results

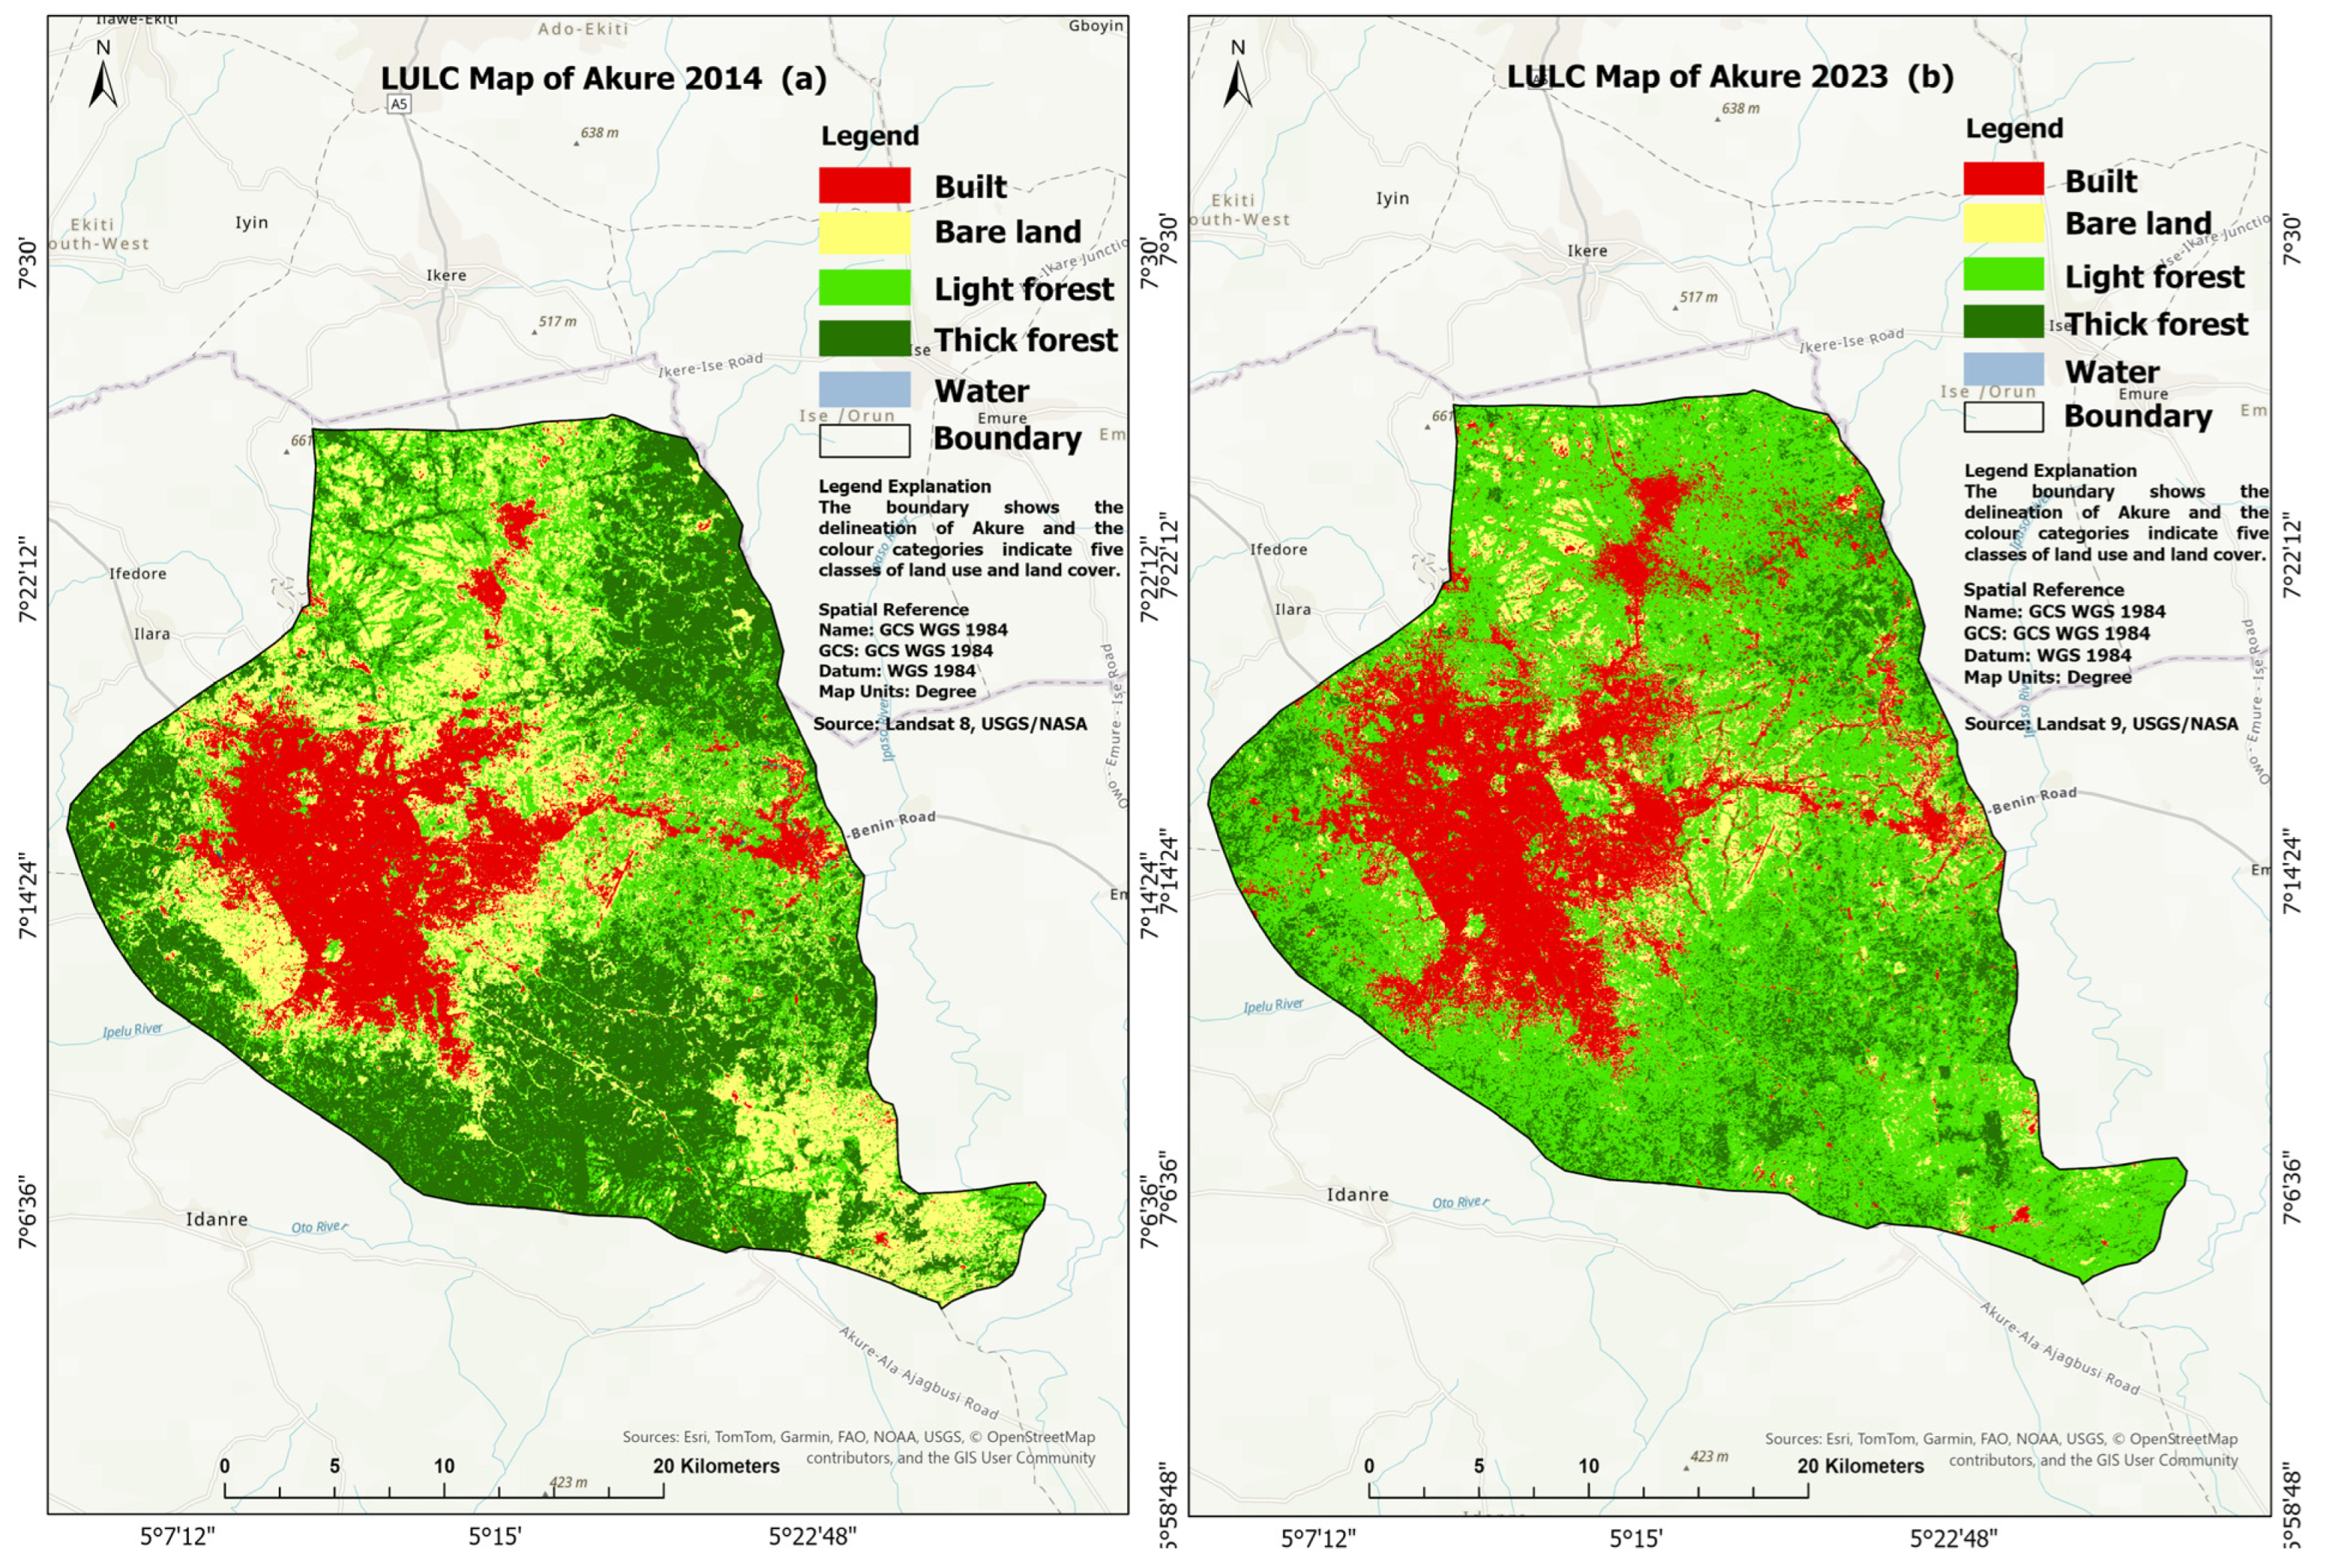
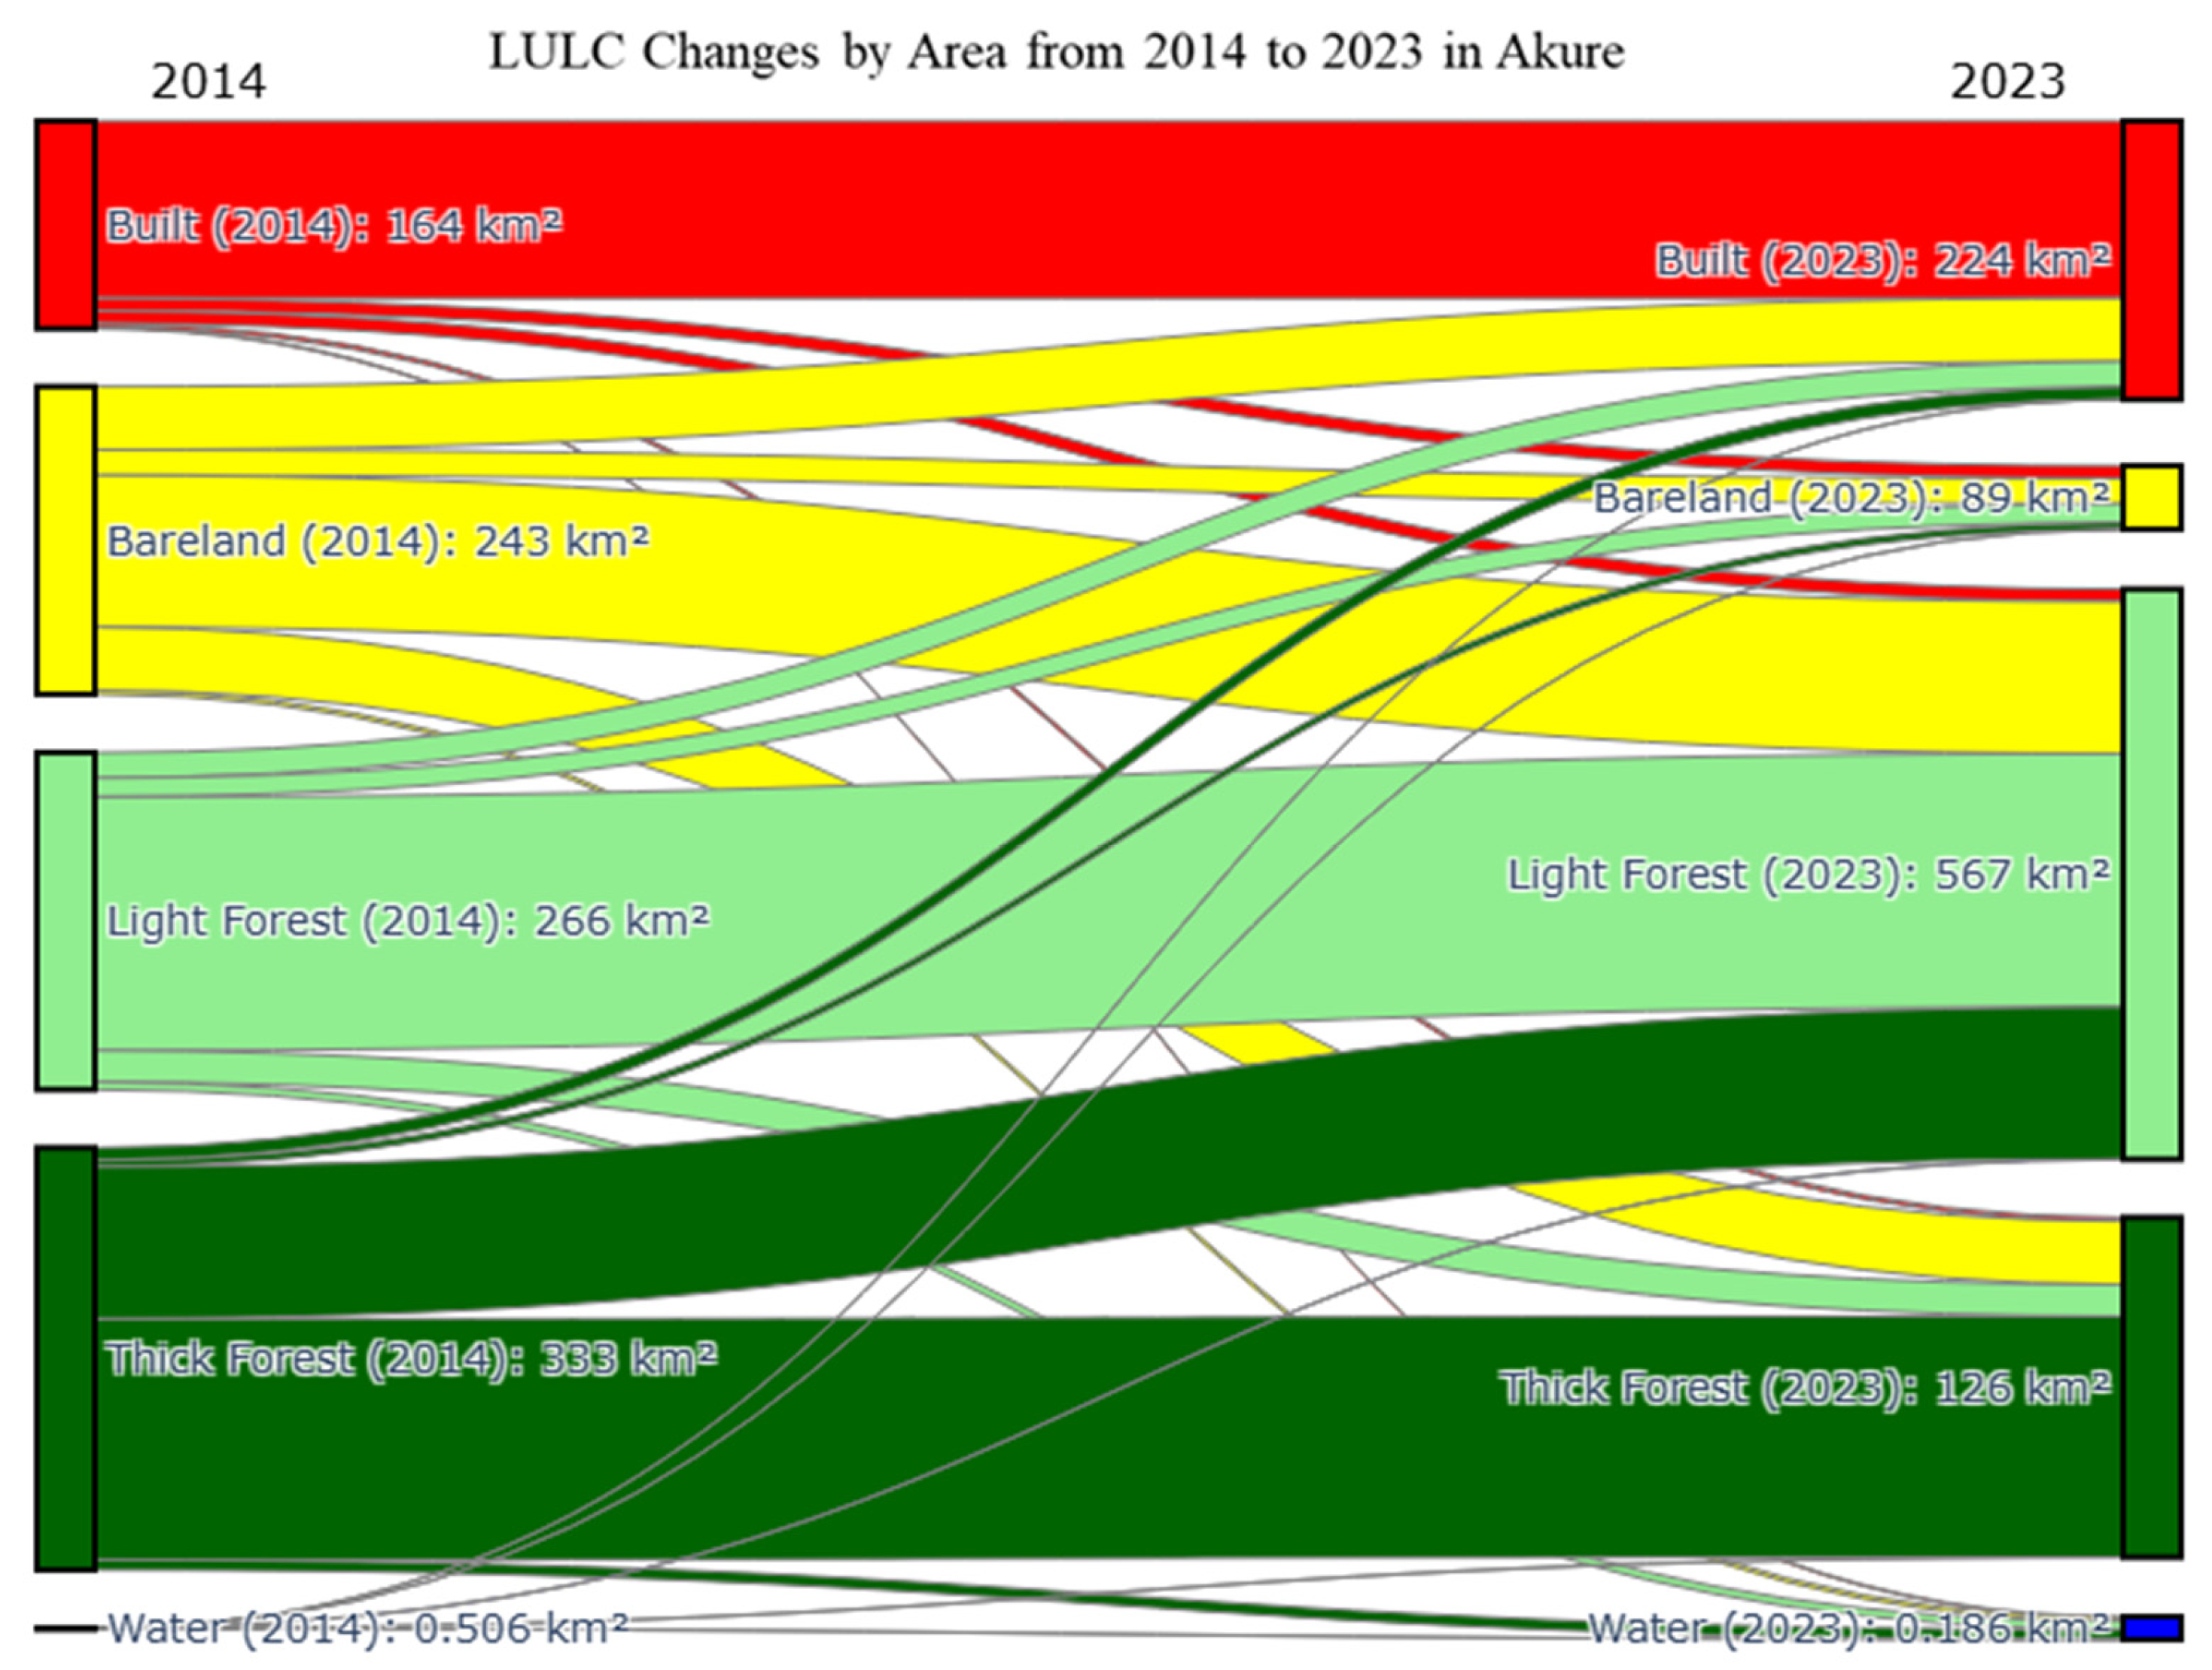
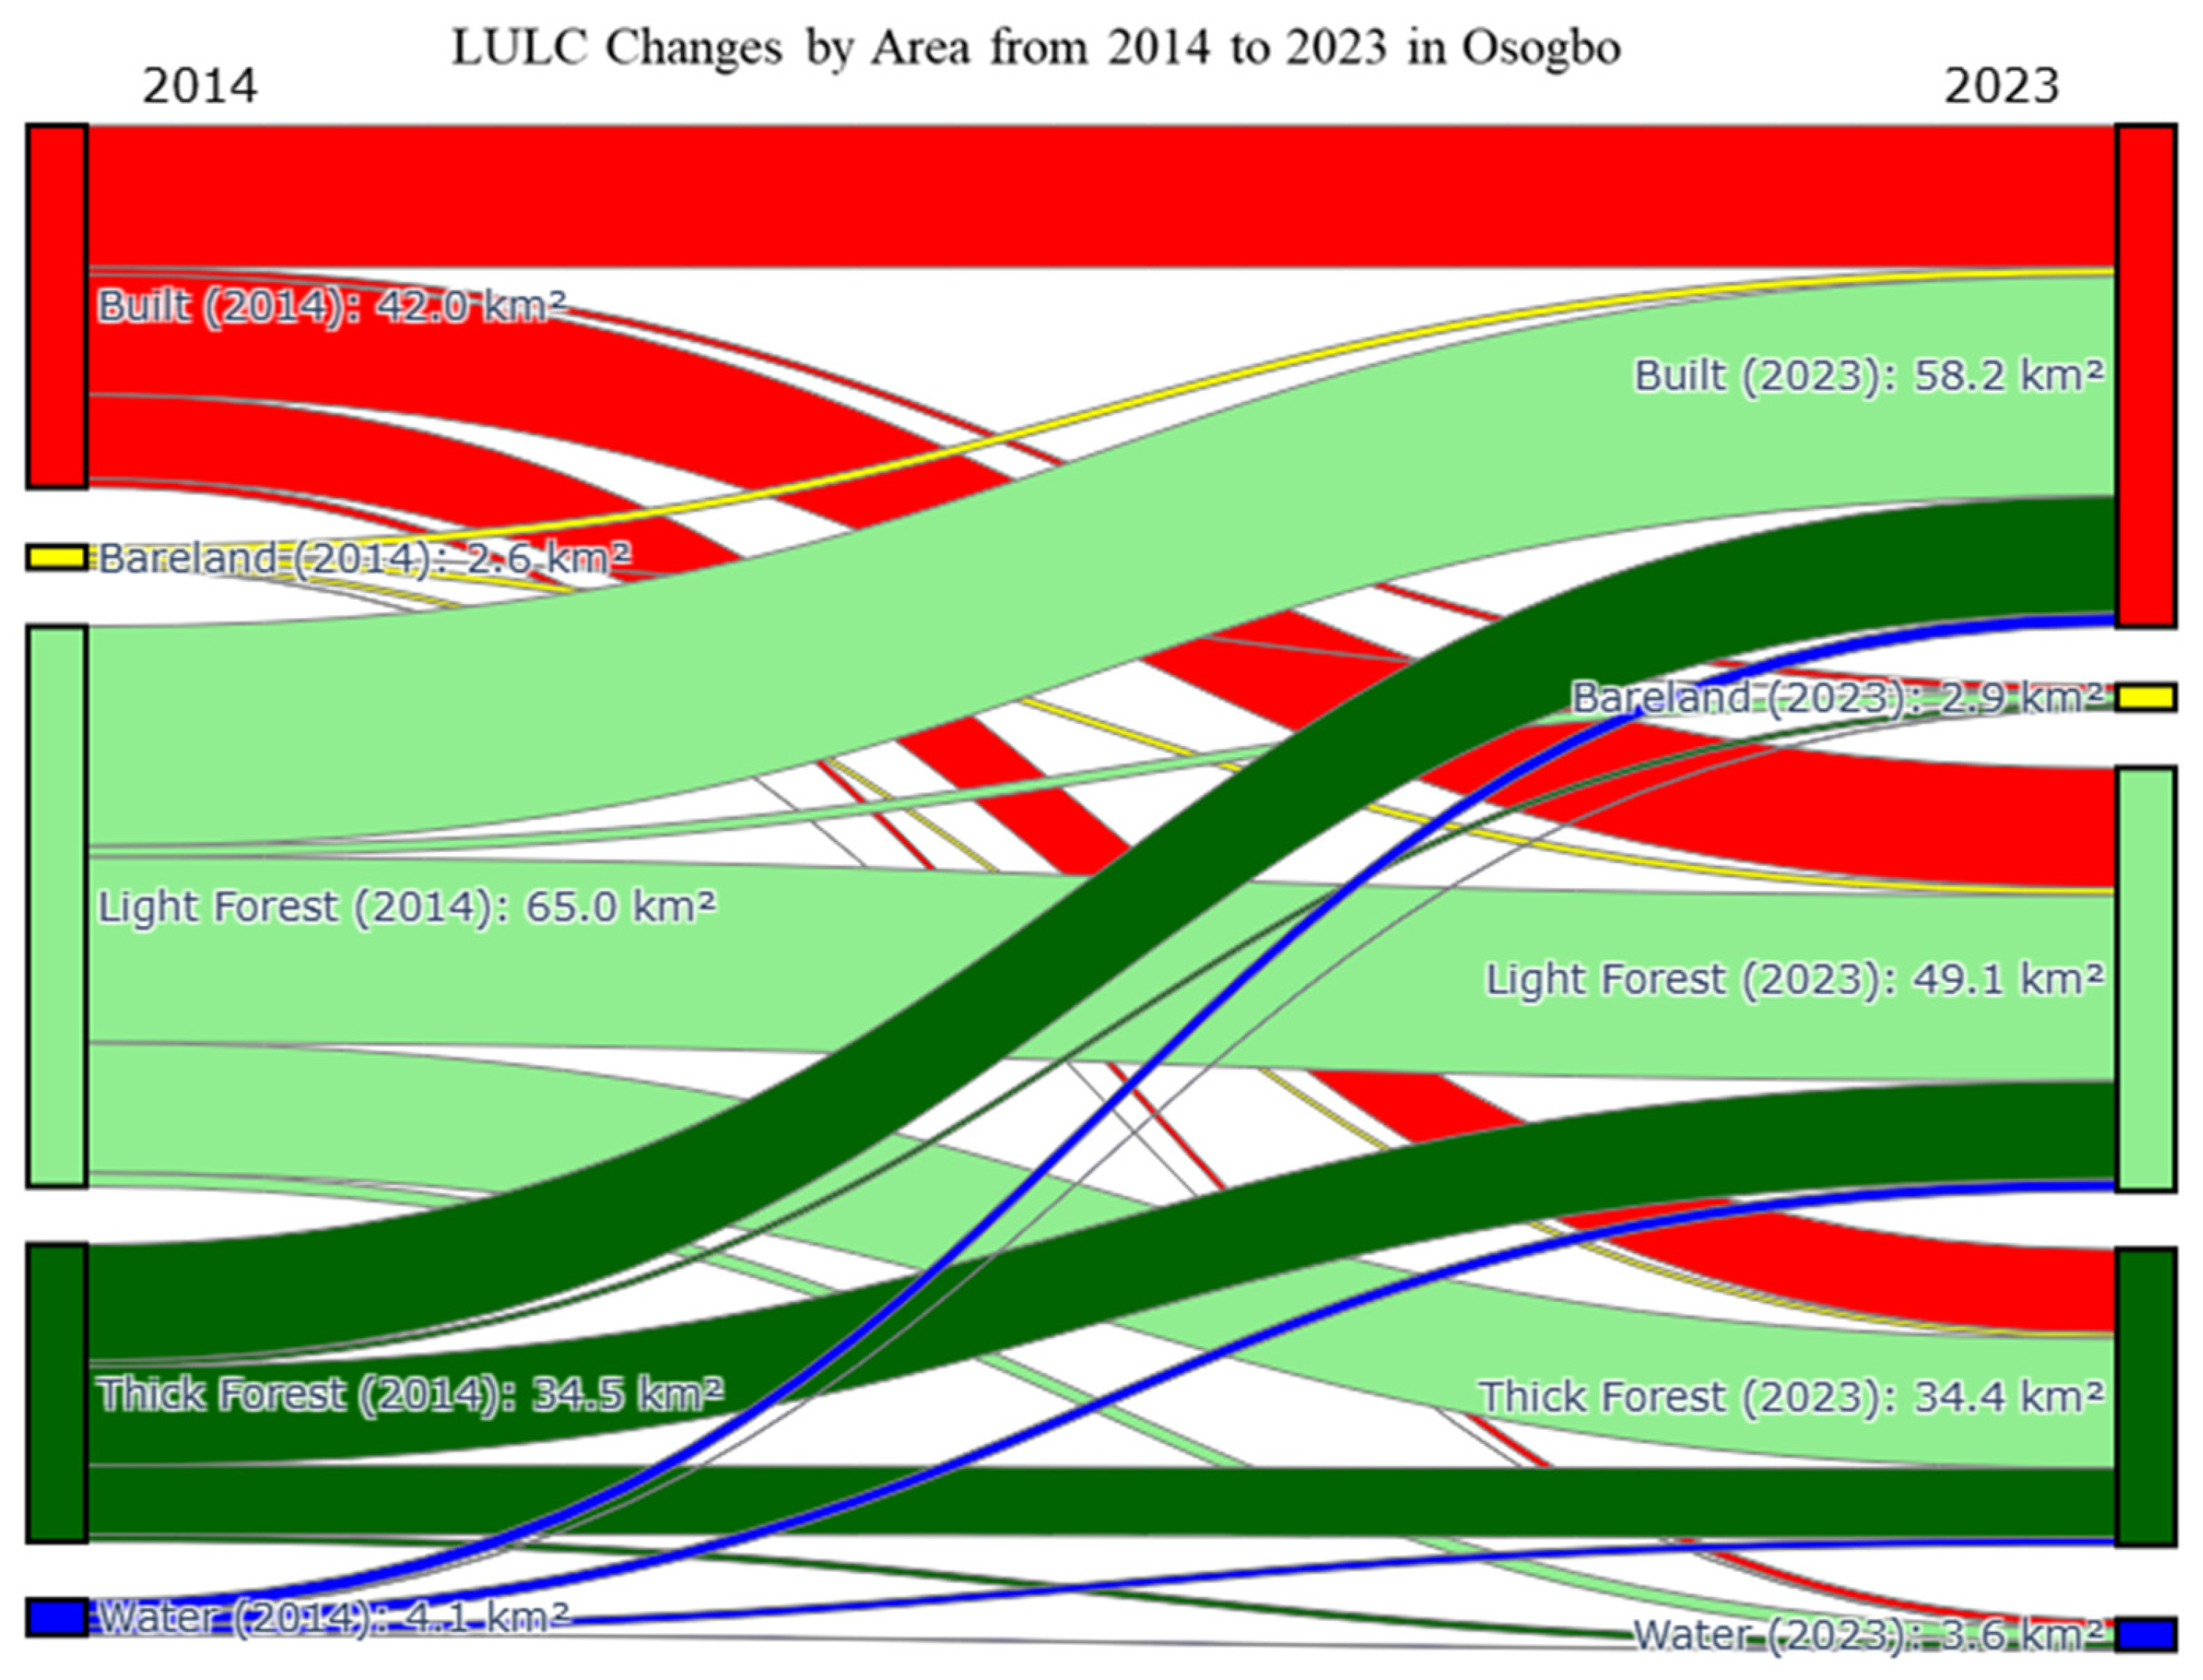
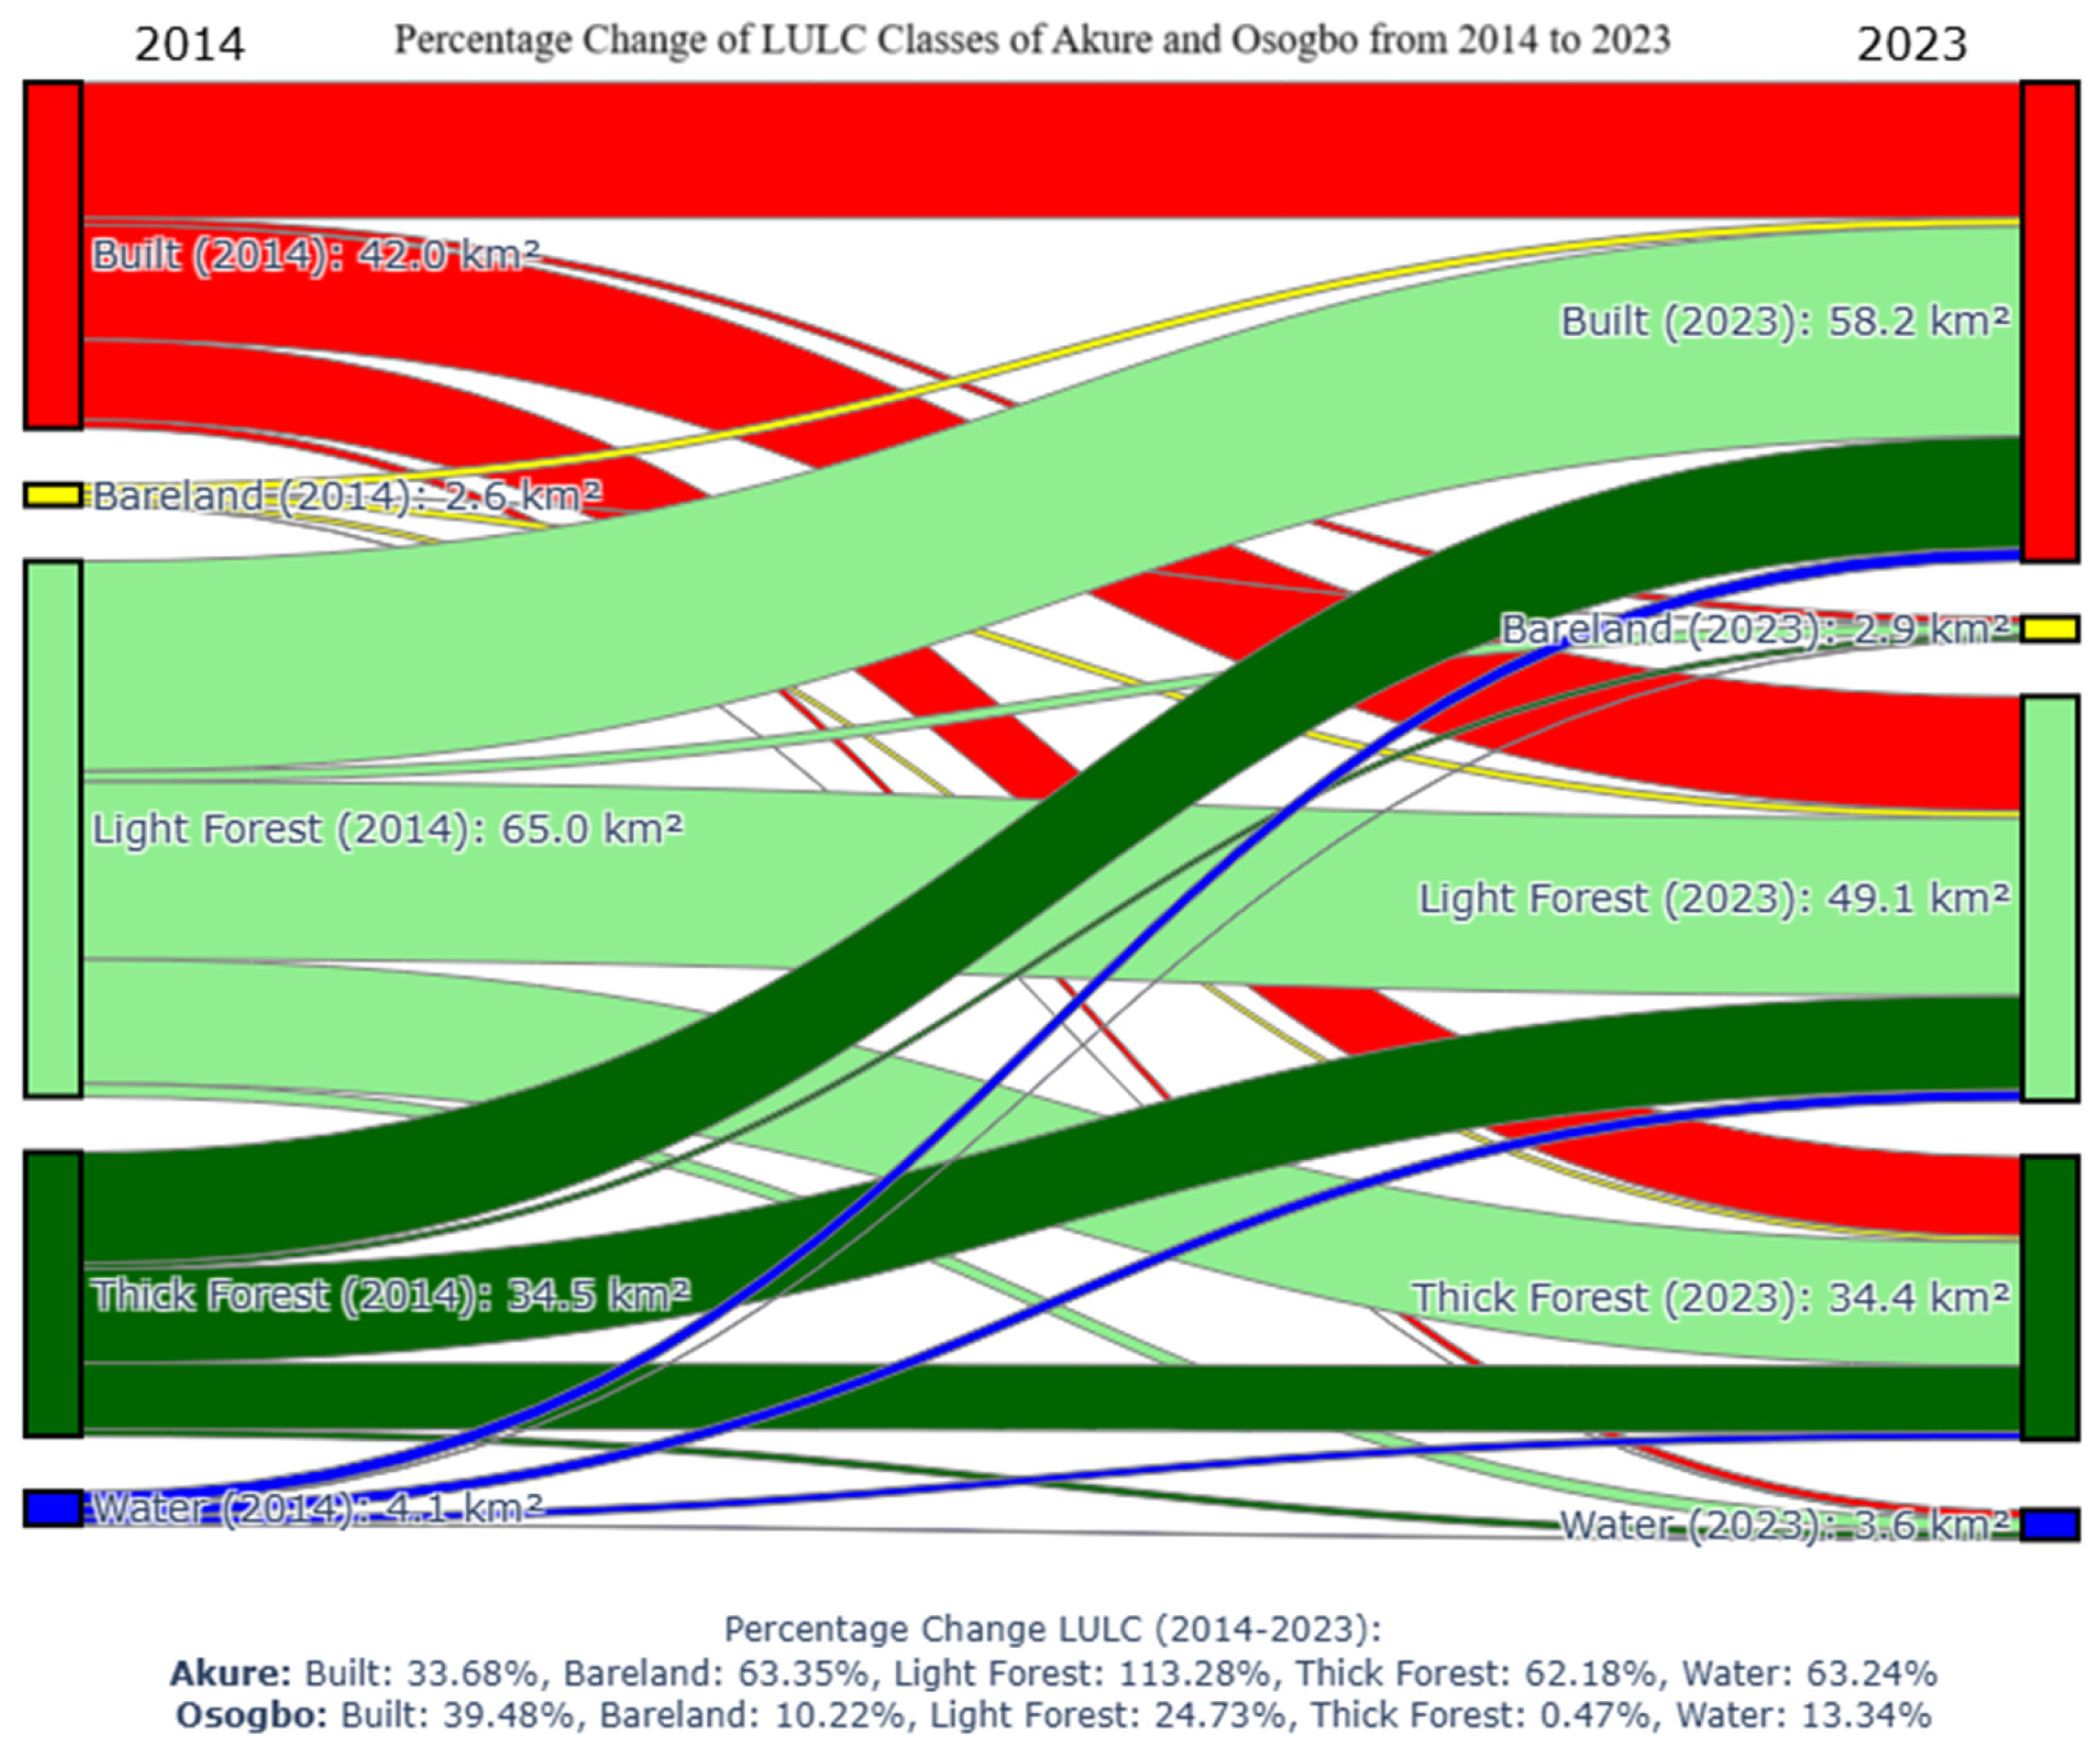
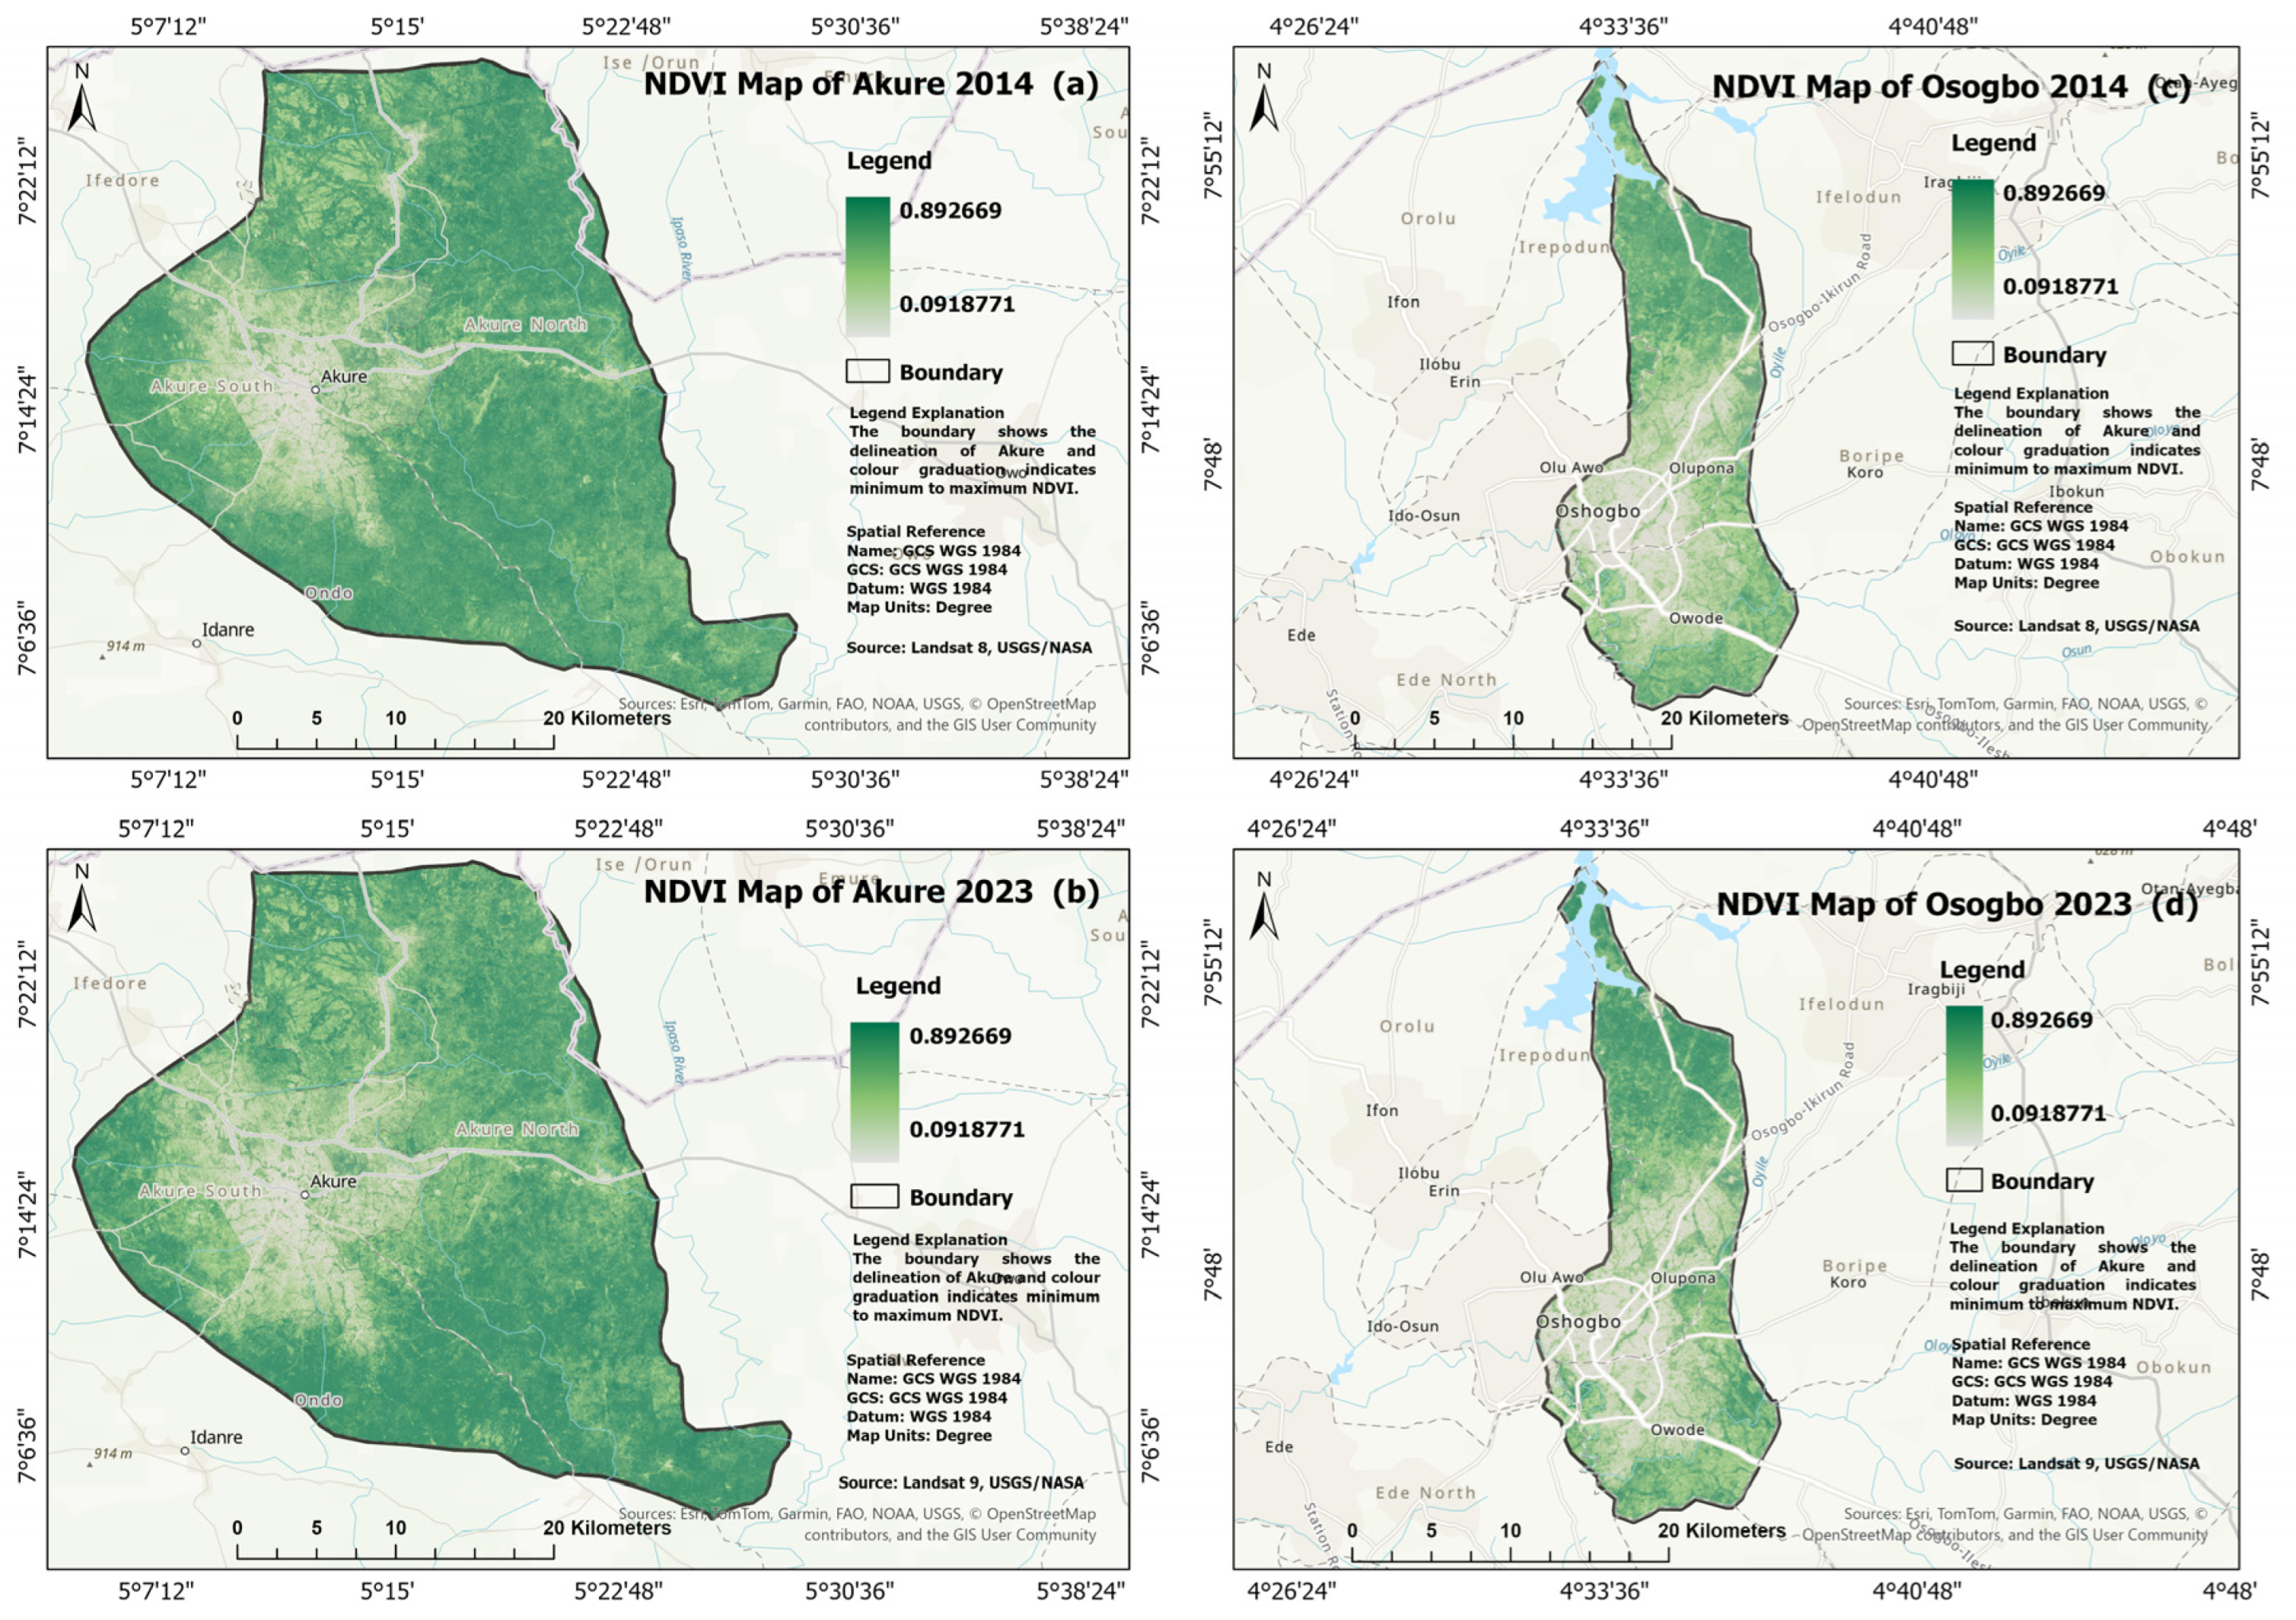
3.1. Land Use Land Cover Change in Akure and Osogbo Between 2014 and 2023

Random forest classification was employed to categorize land cover classes. There are five classes of land cover: built, bare land, light forest, thick forest, and water areas, which were observed and mapped. This classification thoroughly explains how various land cover types contribute to SUHI impacts in Akure and Osogbo since it catches the main landscape elements driving surface temperature dynamics. Figure 3 and Figure 4 present the LULC maps for Akure and Osogbo in 2014 and 2023, respectively. Figure 5 and Figure 6 show the Sankey charts visualizing the land area estimates and percentages of all LULC classes for both 2014 and 2023 for Akure and Osogbo. Figure 7 further shows the Sankey diagram revealing the percentage change in LULC classes for both 2014 and 2023 for Akure and Osogbo.
The built areas of Akure between 2014 and 2023 increased from 164.026 km2 to 224.191 km2 while the change in the built area of Osogbo between 2014 and 2023 was from 41.808 km2 to 58.315 km2 (Figure 5, Figure 6 and Figure 7). The light forest area in Akure also increased by 113% percent from 265.753 km2 to 566.801 km2 while the bare land area, thick forest area and water body cover of Akure region were on the decline from 2014 to 2023. On the other hand, there was a very slight expansion in the bare land area of Osogbo from 2.633 km2 to 2.902 km2 while light forest area, thick forest and water body cover of Osogbo were all on the decline during the study period.
The results of the accuracy assessments of the LULC classifications for Akure and Osogbo are presented in Table 2. The overall accuracy and Kappa coefficient for model testing are also presented. The overall accuracies for Akure in 2014 and 2023 are 0.812 and 0.800, respectively, and for Osogbo are 0.834 and 0.816, respectively. The Kappa coefficients for Akure in 2014 and 2023 are 0.746 and 0.705, respectively, and for Osogbo in 2014 and 2023 are 0.791 and 0.738, respectively.

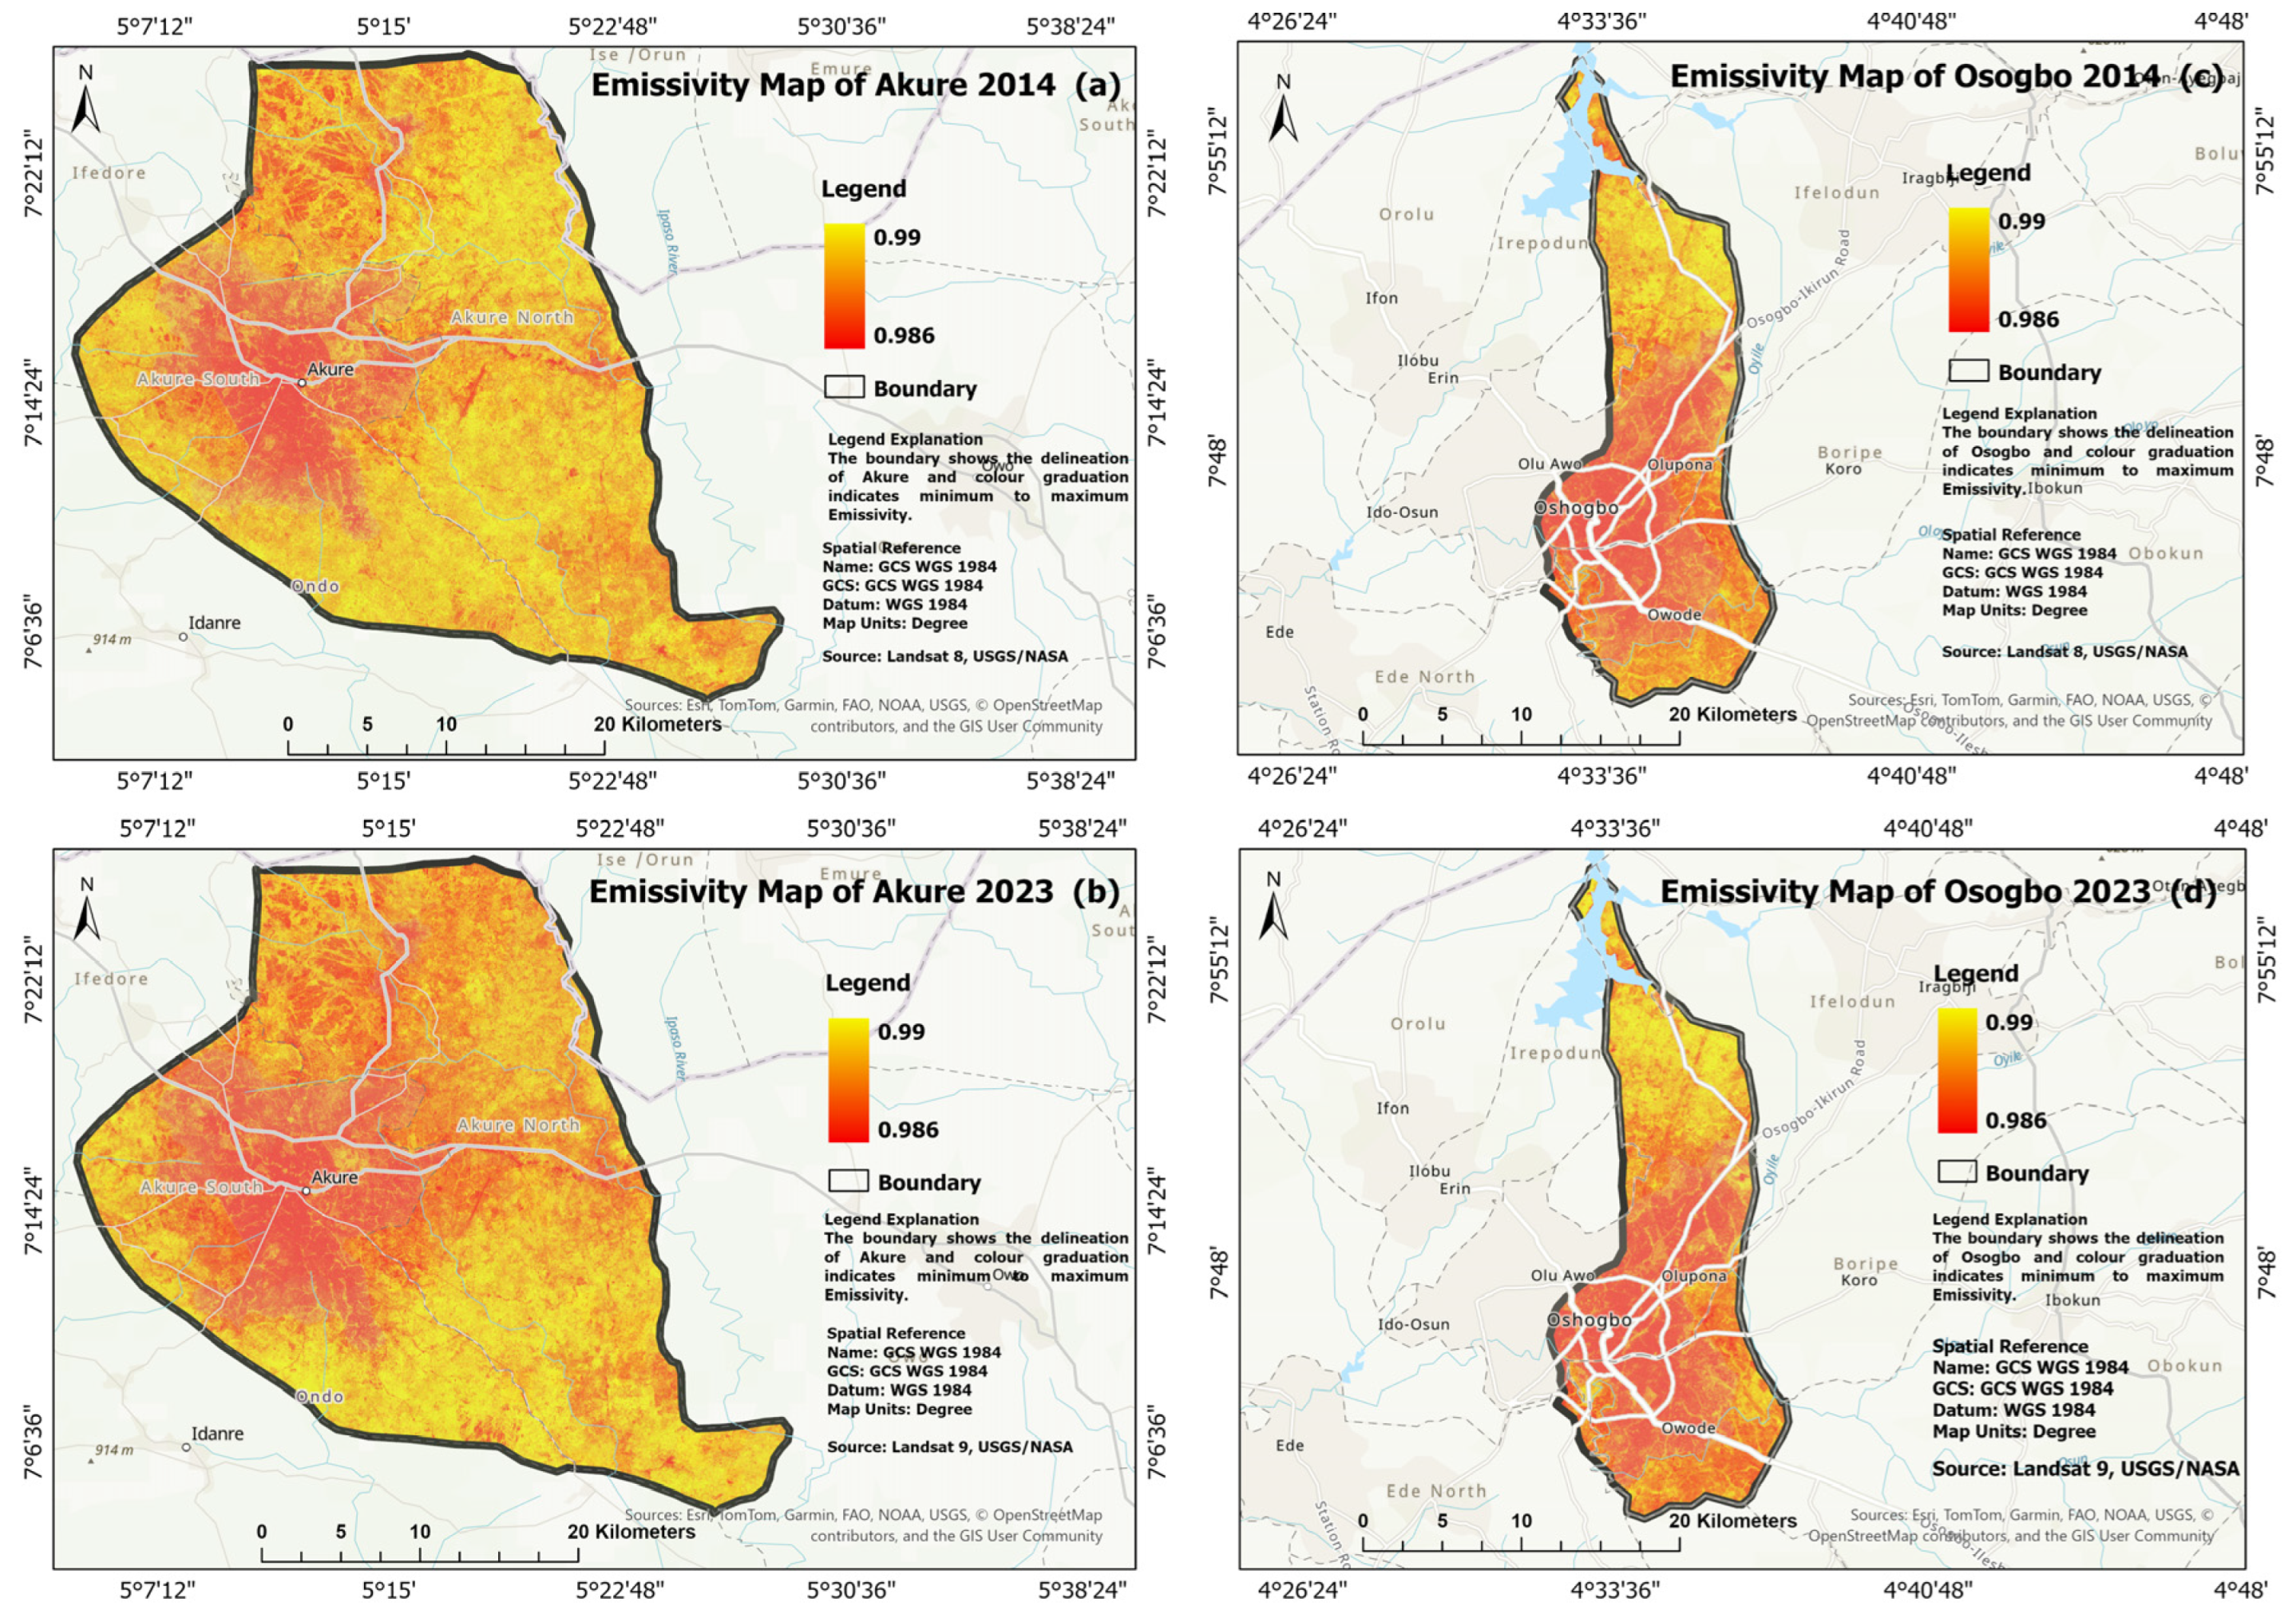
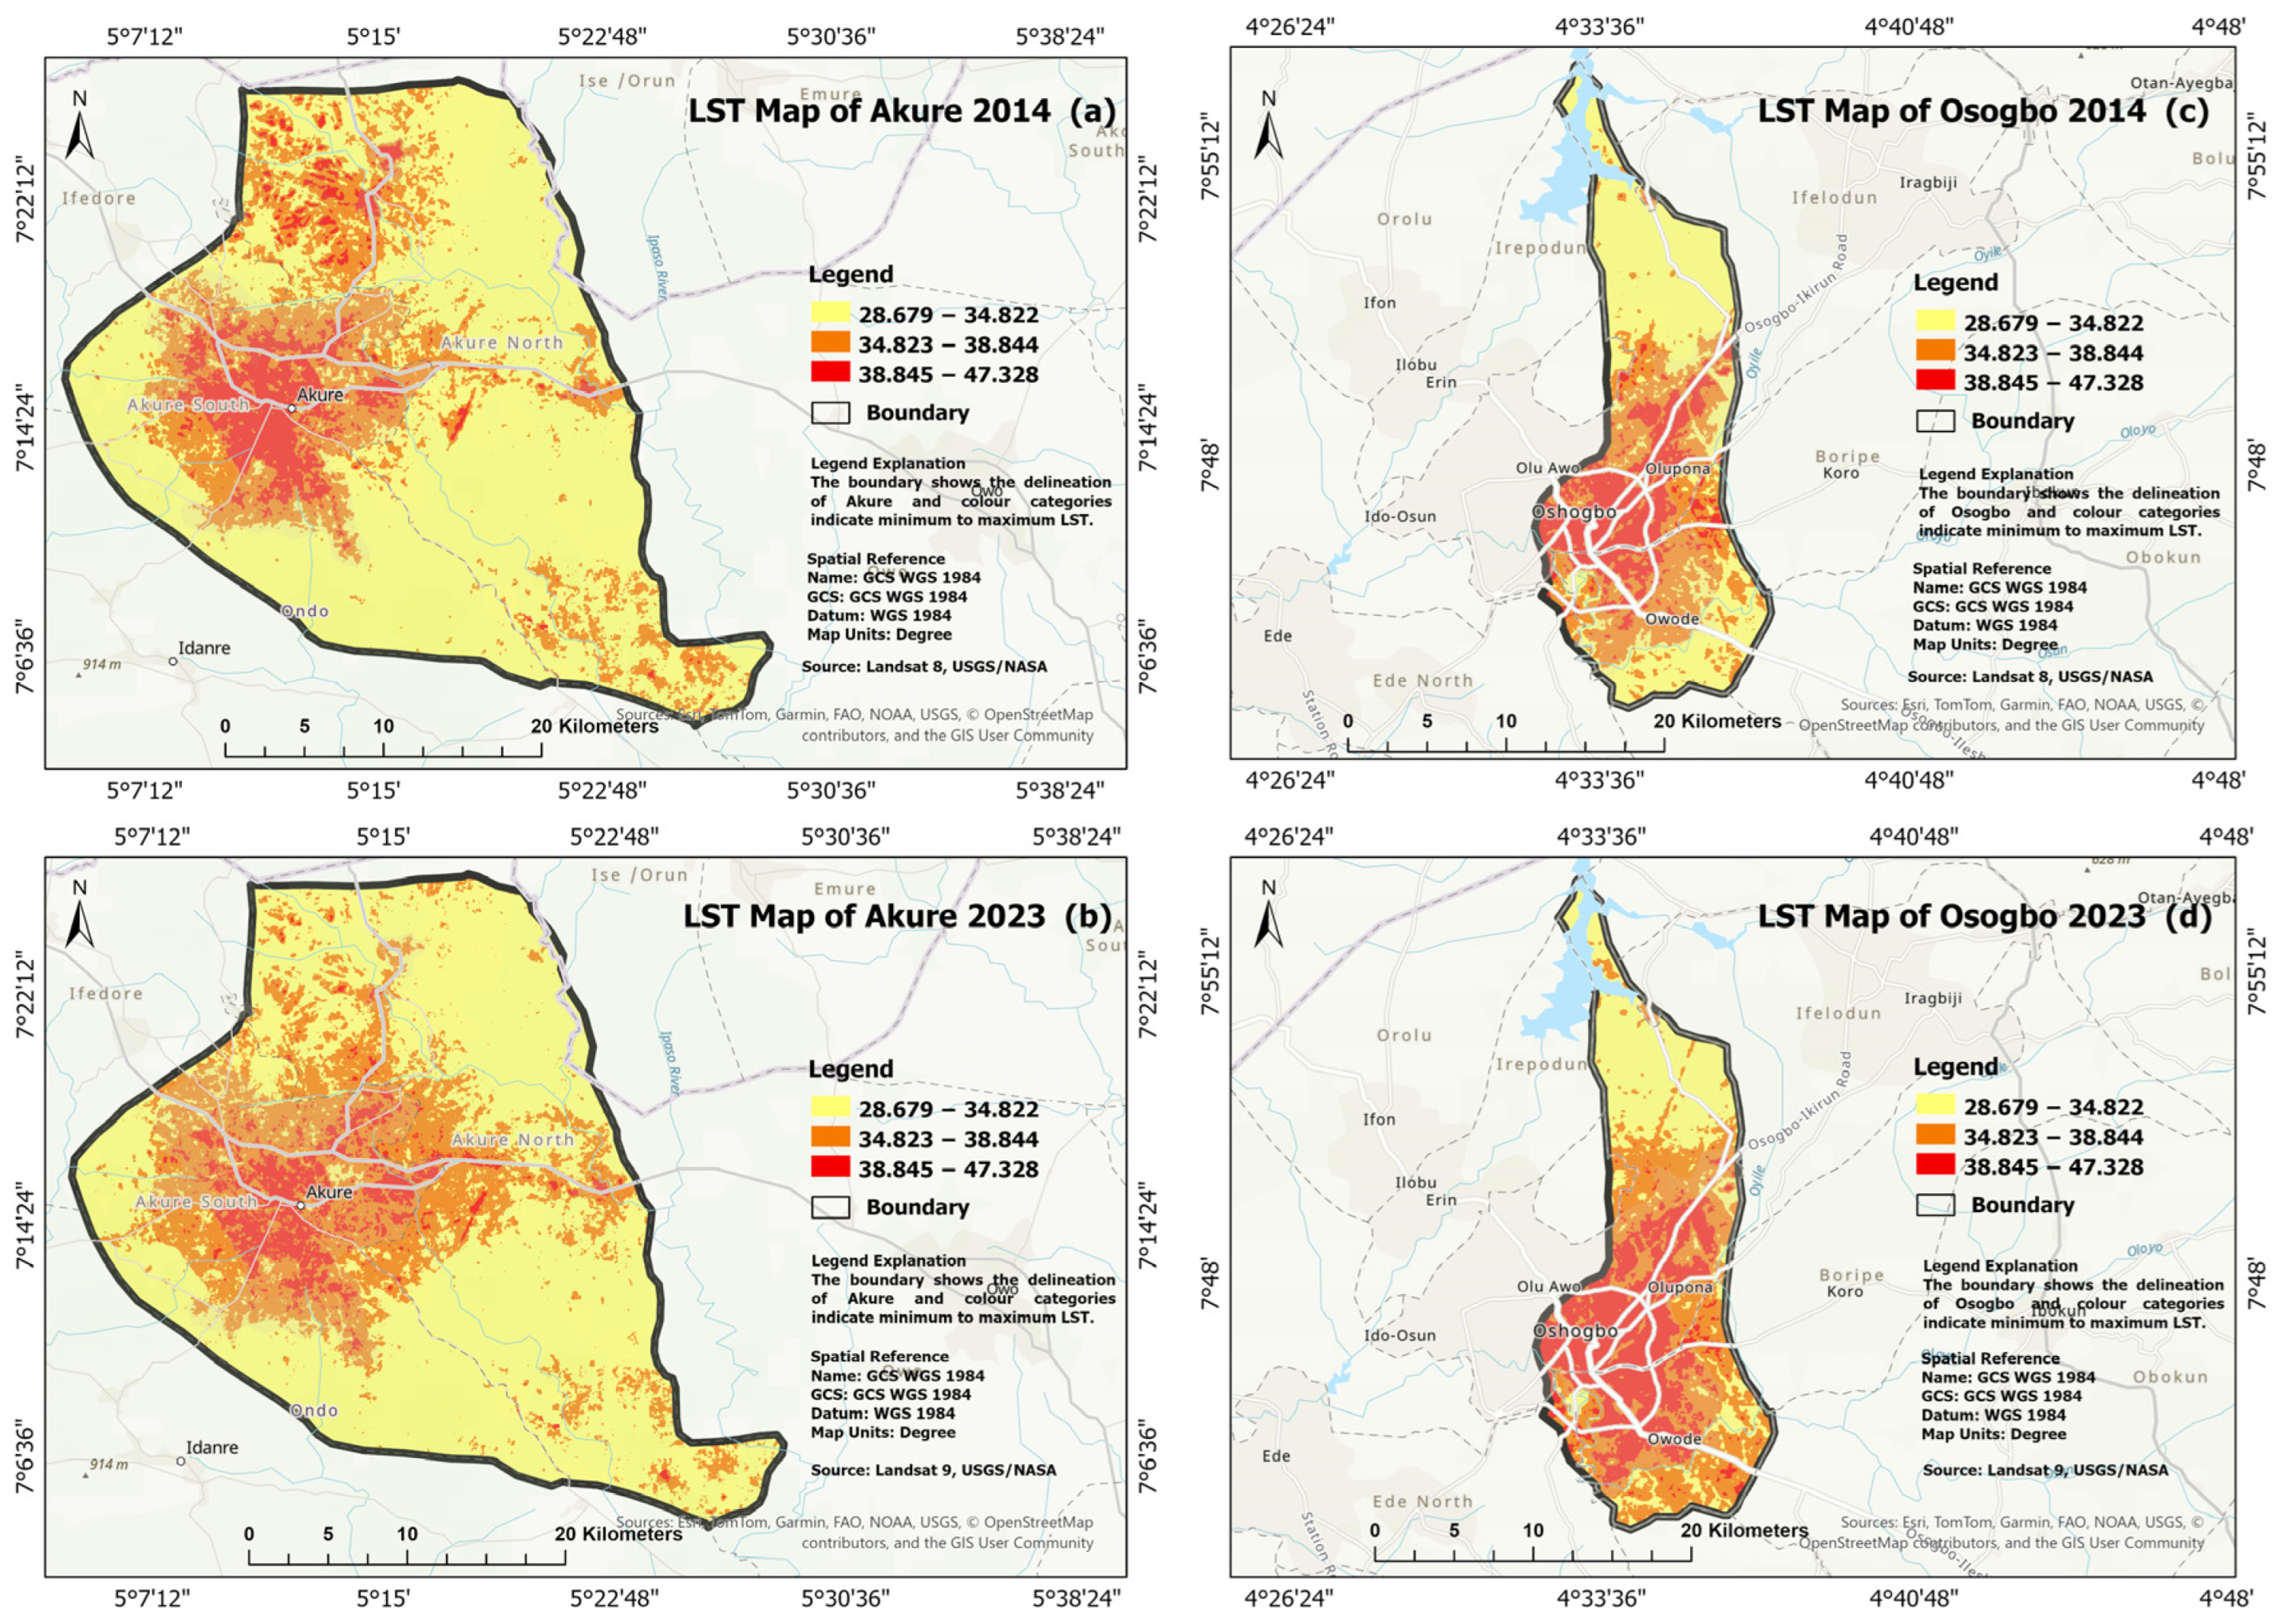
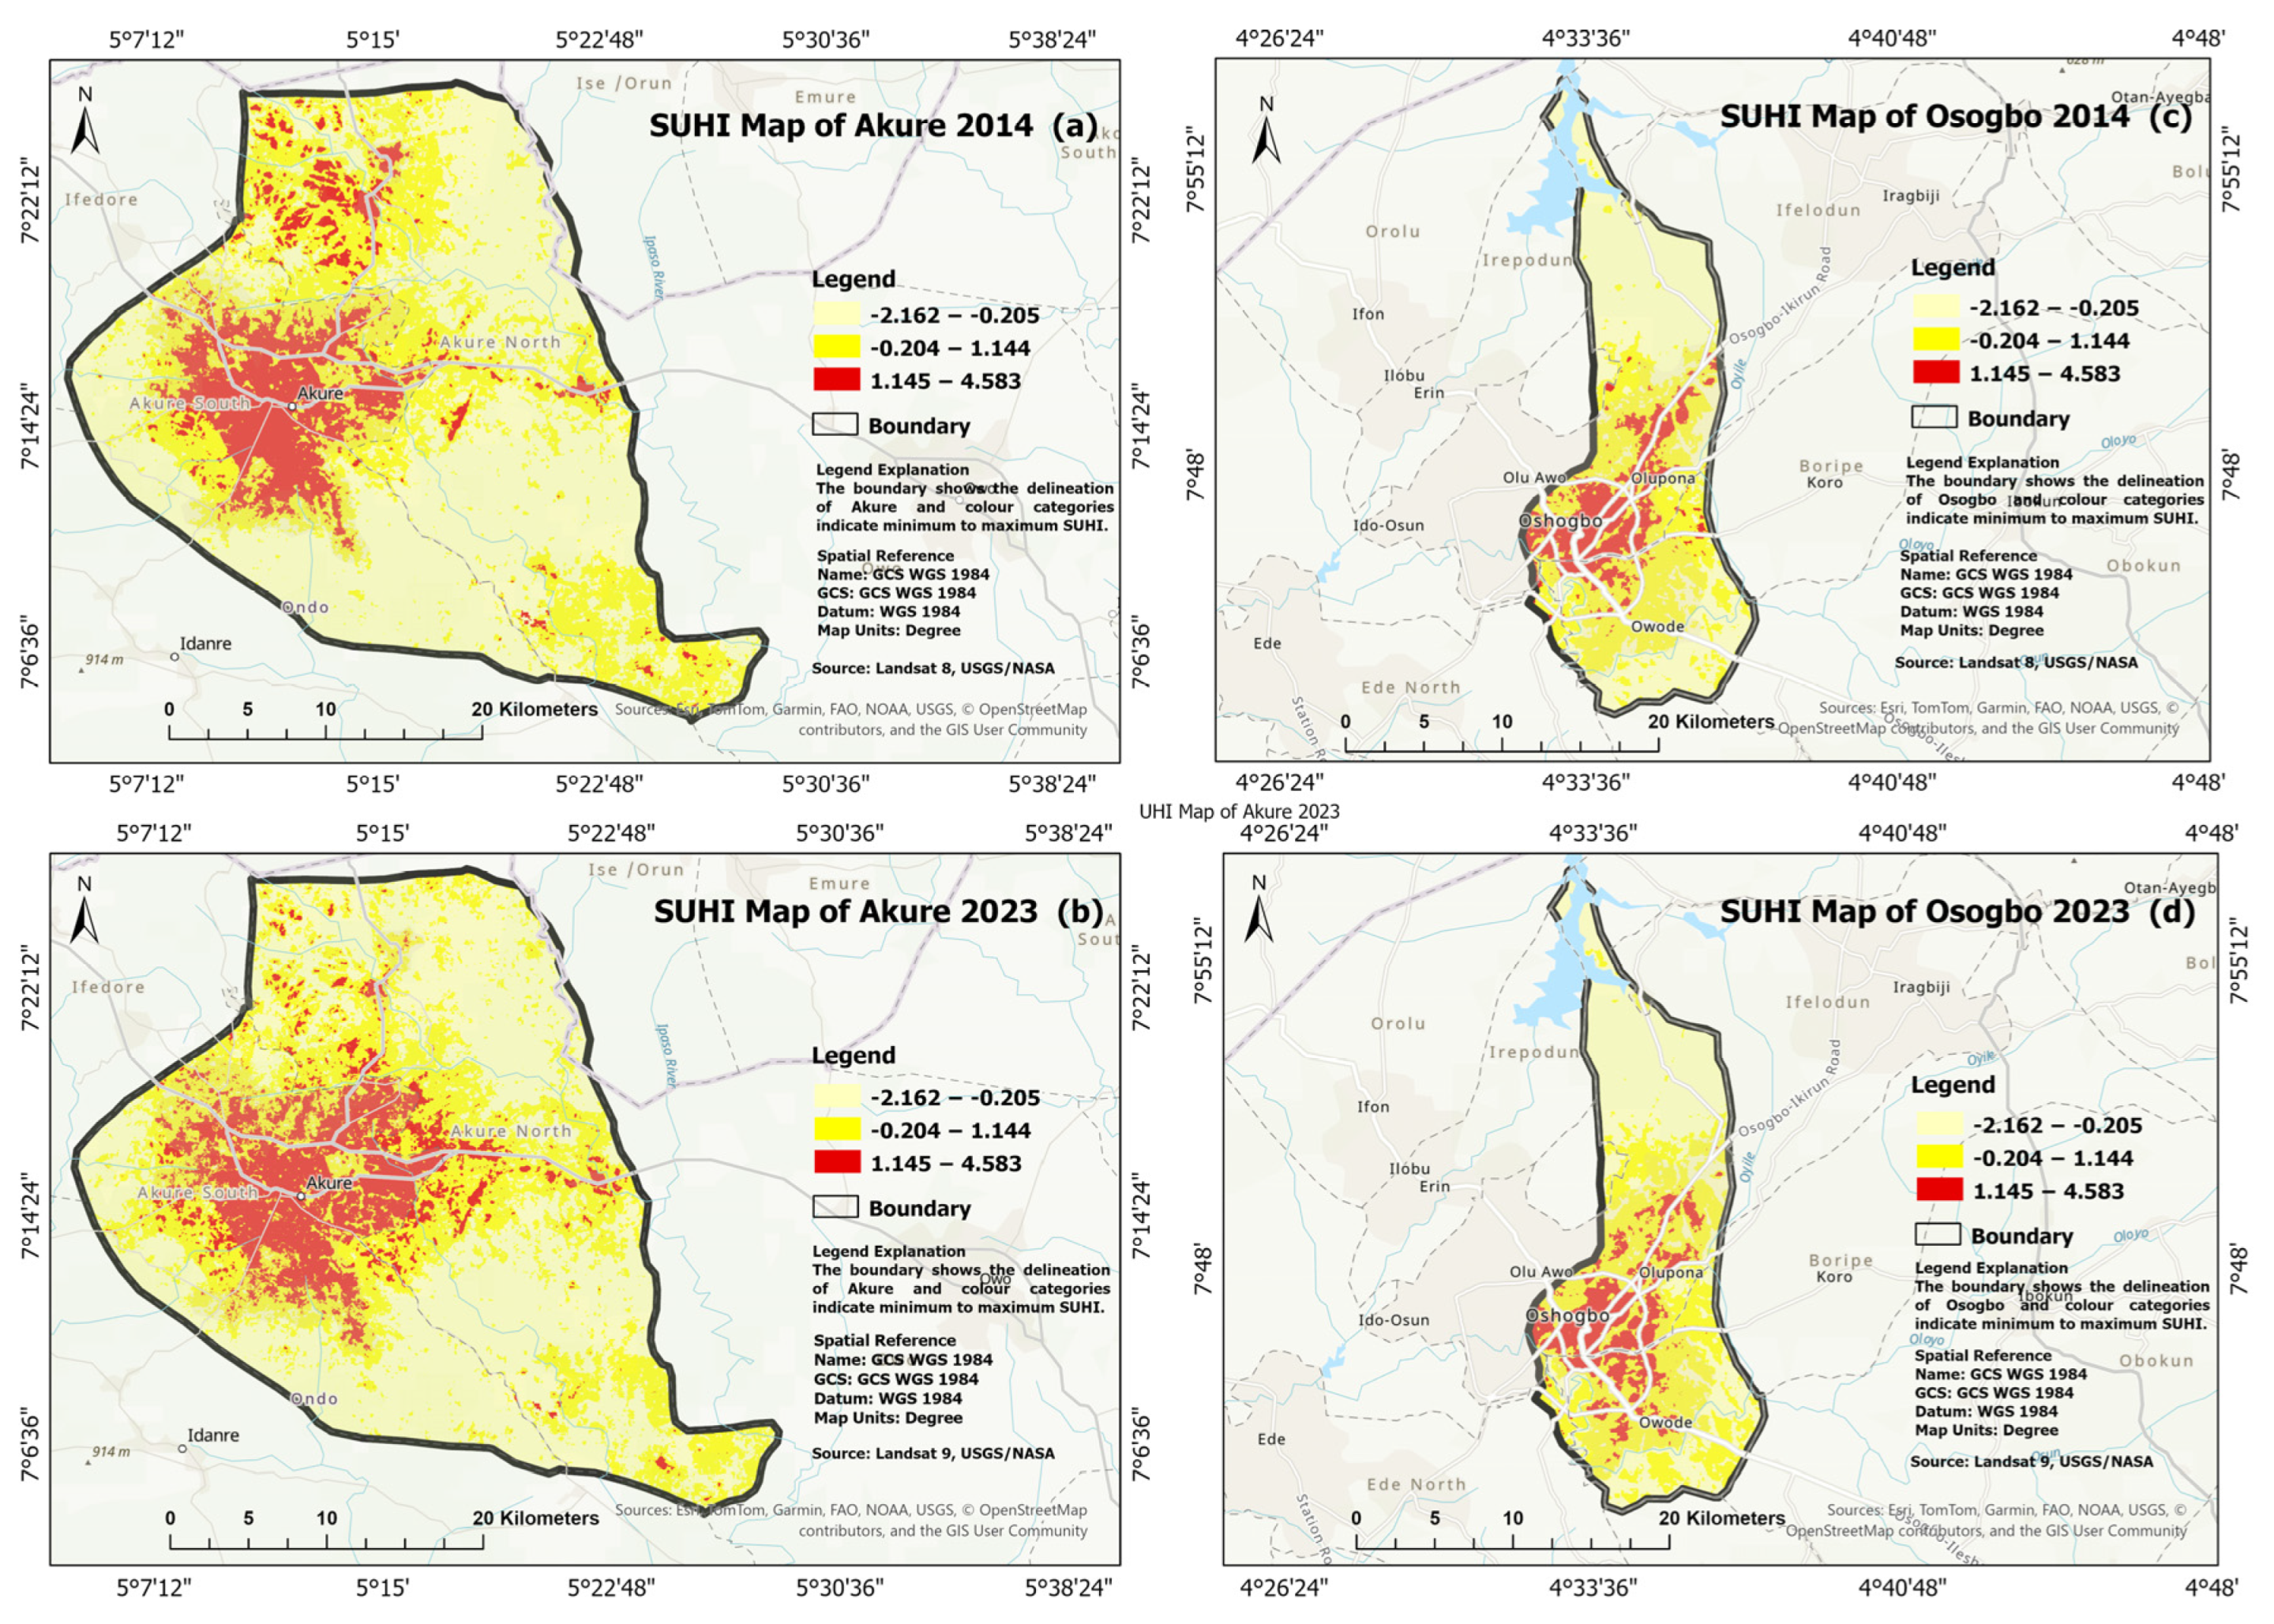
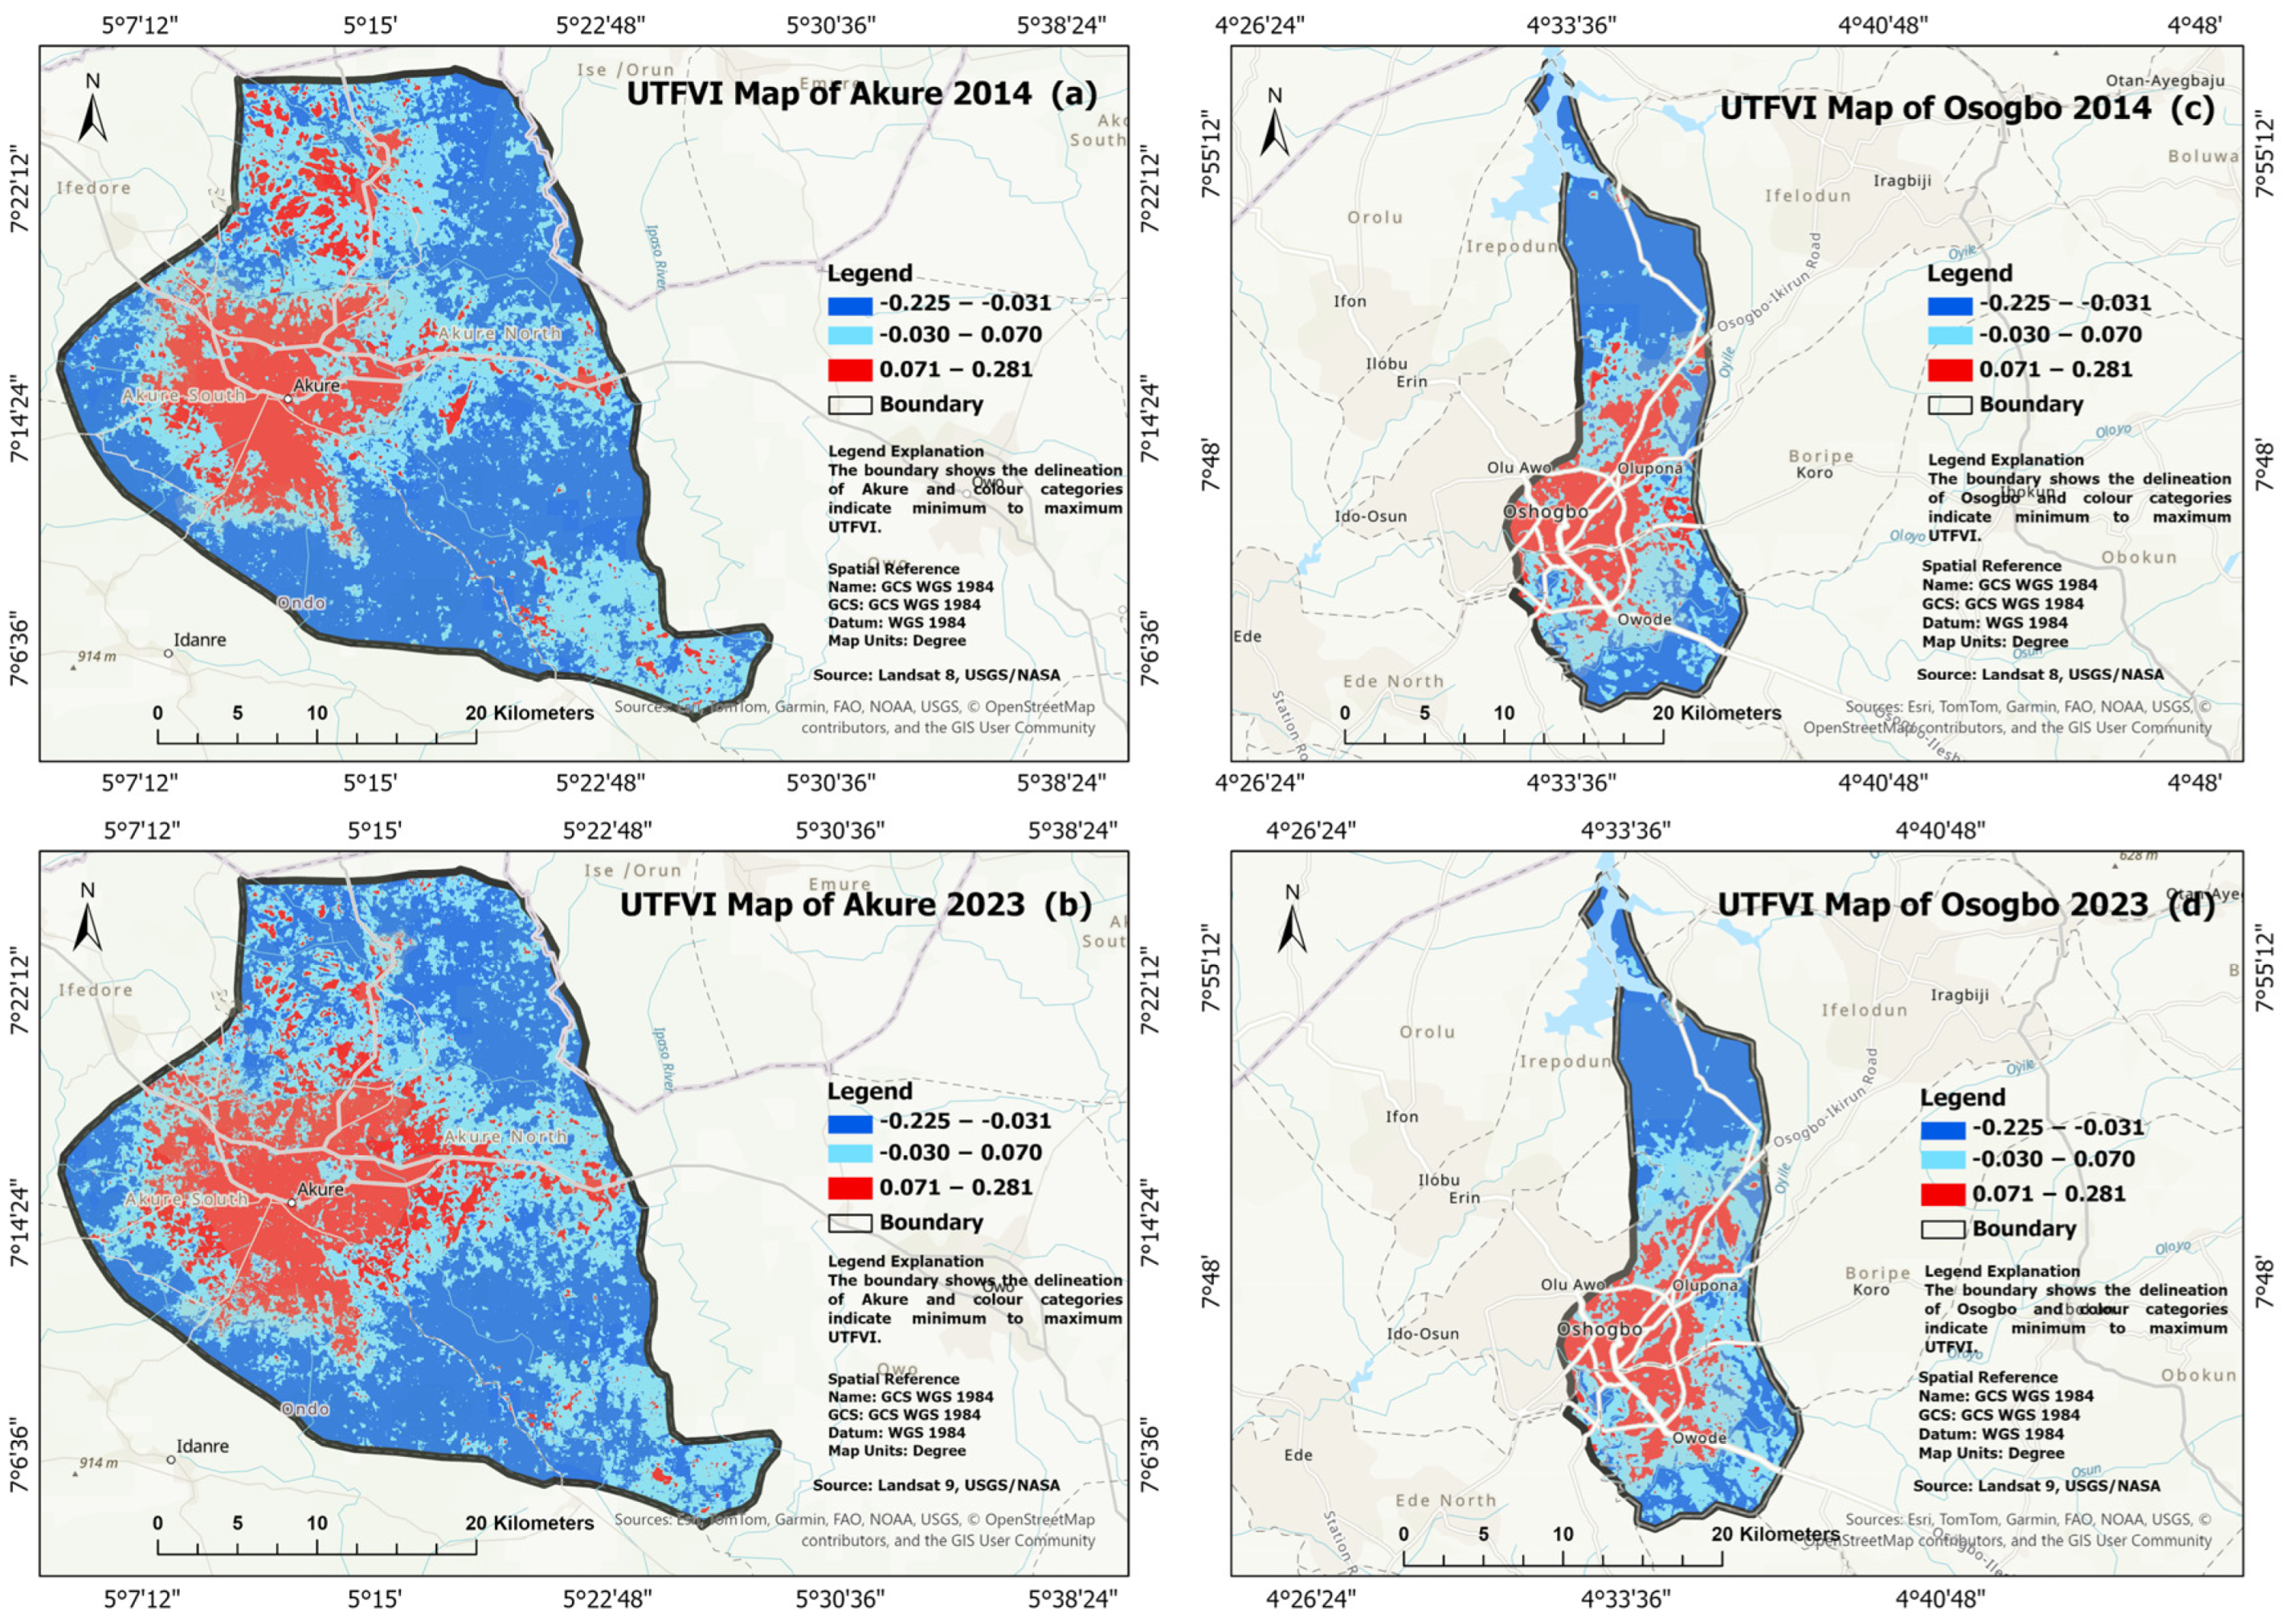
3.2. Surface Urban Heat Island Effects in Akure and Osogbo Between 2014 and 2023

This study identified some parameters that uncovered the effects of SUHI in Akure and Osogbo, as the two cities experienced significant changes in LULC between 2014 and 2023. Figure 8 shows spatial distributions of NDVI in the study area. The NDVI ranges from 0.893 to 0.092. The maximum indicates high vegetation regions while the minimum indicates low vegetation areas. Figure 9 reveals the emissivity in the study area, which has the same pattern as NDVI. The maximum emissivity rate is 0.990, which falls in the forest region and reflects higher emissivity, while the minimum value of 0.986 shows slightly lower emission and falls in the built area. Additionally, the Spearman analysis shows a positive relationship between SUHI and NDVI with the values of R = 0.873, 0.871, 0.998, and 0.989 for Akure 2014, Akure 2023, Osogbo 2014, and Osogbo 2023, respectively.
Evident patterns of LST are closely linked to the urban thermal characteristics of different LULC classifications. Figure 10, Figure 11 and Figure 12 show similar patterns of SUHI effects in the study area. Figure 10 shows the LST of the study area, which was classified into three different parts. The high temperate region is the built area with a temperature between 38.85 °C and 47.33 °C, the medium temperate region is the peri-urban area with a temperature between 34.82 °C and 38.84 °C, and the low temperate region is the thick and light forest areas with temperatures between 28.68 °C and 34.82 °C. Figure 11 reveals the SUHI of the study area, which follows the same pattern as LST. The three categories include the high thermal region (the built areas) between 1.15 °C and 4.58 °C, the medium thermal region (peri-urban areas) between −0.20 °C and 1.14 °C, and the low thermal region between −2.16 °C and −0.21 °C. Figure 12 illustrates UTFVI which is the effect of SUHI on the study area. The effects are further grouped into three categories, namely the high impact area (the built areas) between 0.07 °C and 0.28 °C, the medium region between −0.03 and 0.07 and the low or no impact region between −0.23 °C and −0.03 °C.

3.3. Relationship Between LULC Change and SUHI Effects in Akure and Osogbo Between 2014 and 2023

This study analyzes the relationship between change in LULC and the corresponding SUHI effects in Akure and Osogbo between 2014 and 2023 with the zonal statistics in ArcGIS Pro. Table 3 reveals that the built areas of Akure in 2014 experienced the highest temperature with a mean temperature of 0.114, while the thick forest areas had the lowest temperature effect of −0.072. The median effects were also at the peak in the built region with 0.114 and the lowest median effect of SUHI was felt in the thick forest region of Akure in 2014. In 2023, the same variation occurred in Akure as the built area has the most pronounced SUHI effects with the mean and median value of 0.083 and 0.093, respectively, while the least SUHI effects were experienced in the thick forest region with the mean and median value of −0.084 and −0.084, respectively.
On the other hand, the built region of Osogbo 2014 indicates the highest effect of SUHI with a mean and median value of 0.106 and 0.106, respectively, while the lowest effects were found in the thick region with a mean value of −0.127 and the lowest median value of −0.143 in the water region. The effect is quite similar in Osogbo 2023 as the built region experienced the highest impact with the mean and median values of 0.075 and 0.080, respectively, while the least effect was observed in the water region with the mean and median values of −0.163 and −0.156, respectively. This study affirmed that there is a strong relationship between the change in LULC and SUHI effects in Akure and Osogbo as the effects were more pronounced in the built region compared to the bare land region, to the water body, and very little in the light forest region and the thick forest region.

4. Discussion

This study examined variations in land use and land cover (LULC) and their impact on surface urban heat islands (SUHI) in Akure and Osogbo from 2014 to 2023. The results reveal distinct patterns of LULCC and SUHI effects between these two mid-sized cities. It highlights the uniquely varied urbanization processes shaping their thermal environments. First, the study assessed LULCC in Akure and Osogbo over the study period, revealing a significant increase in built-up areas in Akure. Development initiatives largely drive this. The Sankey charts show this expansion, aligning with previous findings [62,63,64]. For instance, the establishment of Federal University of Technology Akure (FUTA) in 1981 catalyzed urban growth, fueling demand for housing and infrastructure [65]. This corresponds with earlier studies [4], which also linked LULCC in Akure to tertiary institutions and housing developments. Between 2000 and 2018, built-up areas in Akure expanded by 8.78%, leading to higher SUHI intensities, a pattern also observed in this study. In contrast, Osogbo’s LULCC trends were modest, largely shaped by urban renewal programs between 2010 and 2018. These initiatives, such as the creation of Nelson Mandela Freedom Park and tree planting along major roads, promoted a more balanced urban expansion [66,67,68]. Unlike Akure, where rapid urbanization led to intensified SUHI effects, Osogbo’s urban planning strategies helped moderate temperature fluctuations. The variation between the two cities underlines the role of urban policies in mitigating LULCC-induced environmental changes.
Our findings also revealed forest cover dynamics in both cities. In Akure, light forest areas more than doubled, while thick forest areas declined by nearly two-thirds due to logging and agricultural expansion, particularly lumber production and cocoa farming. These findings align with [69], which documented deforestation trends in the Akure Forest Reserve since 1988. In contrast, Osogbo experienced a decline in light forests with only a minor reduction in dense forest areas, indicating a more gradual environmental transition. Previous studies [23,47] similarly reported reductions in agricultural land, reinforcing the need for integrating agricultural land preservation into urban planning. A further comparison of bare land and water area changes indicates contrasting trends between Akure and Osogbo. Akure experienced a 63% decrease in bare land, reflecting rapid urbanization, whereas Osogbo saw an 11% increase, indicating a slower but ongoing transformation. This outcome supports previous research [23], which reported an increase in Osogbo’s bare land and water area decline between 1984 and 2015. However, our findings differ from [70], which observed an increase in Akure’s bare surface between 1984 and 2016. These variations highlight spatial and temporal differences in land transition processes, emphasizing the need for location-specific urban planning.
Second, our study estimated SUHI effects in Akure and Osogbo between 2014 and 2023. It demonstrates that Akure experienced more intense temperature increases, while Osogbo exhibited more stable SUHI patterns. In addition, the Spearman correlation analysis revealed strong negative relationships between vegetation density (NDVI) in the horizontal axis and SUHI in the vertical axis. The Spearman correlation coefficients are R = 0.873 for Akure in 2014, 0.871 for Akure in 2023, 0.998 for Osogbo in 2014, and 0.989 for Osogbo in 2023. These findings build on earlier studies [71,72] that identified similar correlations. Furthermore, in Akure, high temperatures in 2014 were concentrated in the built-up and bare land areas but became more widespread by 2023 due to rapid LULCC, further increasing SUHI effects. Conversely, Osogbo exhibited similar SUHI patterns in both years, reflecting its more moderate urban transformation. The Urban Thermal Field Variance Index (UTFVI) classification confirmed that SUHI effects were strongest in densely built areas, while forest and water bodies provided cooling effects. These results align with earlier studies [9,40,73,74,75,76] that established a positive correlation between LST and SUHI in urban built areas. Also, a negative correlation between SUHI and forested regions reaffirms the role of vegetation in mitigating heat stress. The effects of SUHI are measured following [61] UTFVI ranges and further grouped into none, middle, and bad effects, respectively.
Third, this study revealed the relationship between change in LULC and SUHI effects in Akure and Osogbo between 2014 and 2023. Our findings confirm that built-up areas experienced the highest SUHI intensities, whereas thick forests and water bodies exhibited the lowest temperatures. These findings reinforce the well-documented link between urbanization and rising temperatures, consistent with [9,74,77], which demonstrated that LULC transformations significantly influence SUHI trends. However, this study’s findings provide a nuanced perspective, showing that SUHI effects in one mid-sized city (Akure) are not directly transferable to another (Osogbo). While existing studies have broadly established the urban heat island phenomenon, this study uniquely contrasts two mid-sized Nigerian cities to highlight how variations in urban growth, governance, and environmental policies shape SUHI differently. These findings emphasize that one-size-fits-all mitigation strategies may be ineffective, as cities exhibit distinct thermal behaviors based on localized land use patterns.
In summary, this study provides a comprehensive geospatial analysis of LULCC and SUHI trends in Akure and Osogbo, highlighting the complex relationship between urban expansion and temperature variations. The findings challenge the assumption that SUHI effects manifest uniformly across cities, demonstrating that urbanization-induced thermal impacts vary significantly even within mid-sized Nigerian cities. Unlike prior studies that focused on major urban centers, this research fills a critical gap by analyzing less-explored, mid-sized cities, offering city-specific insights that can inform localized urban sustainability policies. Furthermore, this study leverages advanced geospatial techniques, including Landsat 8 and 9 satellite imagery, supervised classification using Random Forest, and Google Earth Engine-based analysis, improving upon traditional SUHI estimation methods. By providing empirical, data-driven insights, this study offers valuable geospatial information to assist urban planners and policymakers in developing targeted interventions to mitigate surface urban heat island effects. The originality of this research lies in its comparative approach, methodological advancements, and emphasis on mid-sized urban areas, contributing both to the scholarly literature and practical climate adaptation strategies.

5. Limitations

This study has its limitations. First, the study is confined to two cities and a specific period (2014–2023) due to the unavailability of satellite data, consequently limiting its generalizability to other regions or longer-term climate trends. Second, the analysis was primarily based on data from the Landsat satellites with a decadal interval. The downside is that these data are of medium spatial resolution with inconsistent and coarse temporal resolution. The lack of higher spatial resolution data may have reduced the precision of land cover classification and surface temperature estimation, potentially resulting in the inequality of small-scale urban features and localized surface urban heat island variations. This inability to afford high-resolution satellite data, which is usually very expensive, also contributed to dependence on the Landsat images. Nevertheless, Landsat data have been largely used in spatiotemporal research with accurate results. Lastly, the study focused mainly on LST and SUHI. It did not consider any other types of urban heat islands. The study did not account for socioeconomic factors and urban green infrastructure, which could also impact SUHI effects. These restrictions emphasize integrating ground-based observations and broader temporal and geographic data for more comprehensive future studies.

6. Conclusions

This study analyzed the spatiotemporal relationship between LULC changes and SUHI effects in the cities of Akure and Osogbo, Nigeria, from 2014 to 2023. The study applied geospatial data involving satellite imagery, remote sensing techniques and machine learning to examine the dynamics of LULC transformation and its influence on SUHI in these mid-sized, rapidly urbanizing cities. The formation and impact of SUHI in mid-sized cities represent a complex issue that has received less attention globally. Hence, our study’s objectives responded to these complex issues of LULC dynamics and its impact on the formation of the SUHI effect, especially in the developing mid-sized cities in Nigeria. Addressing the first research objective, we observed notable LULCC in Akure, including a significant increase in built-up areas and more than a doubling of light forest area. In contrast, Osogbo witnessed more moderate changes, with modest expansion in built-up areas and a little rise in bare land between 2014 and 2023.
Regarding the second research objective, the findings demonstrated that Akure and Osogbo had significant changes in SUHI between 2014 and 2023. Akure experienced higher SUHI effects in 2014, particularly in the built-up and bare-land areas, and a more pronounced effect in 2023 as the city’s land use changed substantially. In contrast, Osogbo experienced modest changes at consistent SUHI patterns, with the highest SUHI effect in the built and bare-land regions in 2014 and nearly the same proportion in 2023 as the city’s LULC changed relatively between 2014 and 2023. Finally, our third research objective revealed a strong relationship between change in LULC and SUHI effects in Akure and Osogbo between 2014 and 2023. In both cities, the built areas experienced the highest SUHI effects, while thick forest and water regions had the lowest. This indicates a clear correlation between urbanization and increased temperatures.
It can be inferred from the results that the extent of LULCC impact on SUHI across mid-sized cities is not equal. As such, evidence from a mid-sized city might not be transferrable to other cities of similar size and socio-economic characteristics without caution. As comparable as Osogbo and Akure are within the southwestern region of Nigeria, the differences in population growth, socio-economic indicators, urban green infrastructure plans, and climate adaptation and mitigation programs could be the reasons behind the varying LULCC impacts on SUHI effects in the two cities. This study also emphasized the important role of vegetation in mitigating SUHI, as areas with dense green cover experienced cooler temperatures. To address these challenges, our findings recommended sustainable urban planning that integrates green infrastructure and monitors LULC changes as necessary for minimizing SUHI effects and encouraging climate resilience in the rapidly growing cities of Nigeria. This study also recommends the incorporation of green infrastructure, such as parks, urban forests, and vegetation corridors, to help lessen SUHI intensity and promote climate resilience in the study area, particularly in Akure, where SUHI effects are more pronounced. By recognizing the impact of LULC change on SUHI effects, city planners and policymakers in Nigeria can make informed decisions to supervise urban growth and retain environmental sustainability. Promoting public awareness about SUHI effects and incentivizing climate-adaptive building methods are vital for encouraging long-term resilience against increasing temperatures in these mid-sized growing cities.

Author Contributions

Conceptualization, M.A.O.; methodology, M.A.O., O.M.O. and D.E.; software, M.A.O. and O.M.O.; visualization, M.A.O., O.M.O., A.R. and D.E.; validation, M.A.O.; formal analysis, M.A.O.; writing—original draft, M.A.O.; writing—review and editing, M.A.O., O.M.O., A.R. and D.E.; investigation, M.A.O.; resources, M.A.O. and O.M.O.; data curation, M.A.O.; supervision, M.A.O., O.M.O., A.R. and D.E.; project administration, O.M.O. and D.E.; funding acquisition, D.E. All authors read, edited, and approved the final manuscript. All authors have read and agreed to the published version of the manuscript.

Funding

This research did not receive external funding.

Data Availability Statement

The data were sourced from secondary sources and are publicly accessible through the link: https://developers.google.com/earth-engine/datasets/catalog/landsat (accessed on 4 June 2024).

Acknowledgments

The authors thank the staff and students at the Institute of Geography, Ruhr University Bochum, Germany, for providing the enabling environment for the study.

Conflicts of Interest

The authors declare no conflicts of interest.

References

  1. Brenner, N.; Keil, R. From global cities to globalized urbanization. In The City Reader; Routledge: Oxfordshire, UK, 2011; pp. 667–684. [Google Scholar]
  2. Kundu, D.; Pandey, A.K. World urbanization: Trends and patterns. In Developing National Urban Policies: Ways Forward to Green and Smart Cities; Springer: Berlin/Heidelberg, Germany, 2020. [Google Scholar] [CrossRef]
  3. United Nations, Department of Economic and Social Affairs, Population Division. World Population Prospects 2022: Summary of Results; United Nations: New York, NY, USA, 2022; Available online: https://www.un.org/development/desa/pd/sites/www.un.org.development.desa.pd/files/wpp2022_summary_of_results.pdf (accessed on 14 July 2024).
  4. Popoola, O.; Durojaye, P.; Bayode, T.; Popoola, A.; Olanibi, J.; Aladetuyi, O. Spatio-temporal variance and urban heat island in Akure, Nigeria: A time-spaced analysis Using GIS Techniqu. S. Afr. J. Geomat. 2020, 9, 365–378. [Google Scholar] [CrossRef]
  5. Linard, C.; Tatem, A.J.; Gilbert, M. Modelling spatial patterns of urban growth in Africa. Appl. Geogr. 2013, 44, 23–32. [Google Scholar] [CrossRef]
  6. Chatterji, T. New urban worlds: Inhabiting dissonant times. Urban Policy Res. 2019, 37, 269–271. [Google Scholar] [CrossRef]
  7. World Bank. Urban Population (% of Total Population)—Nigeria Data World. 2018. Available online: https://data.worldbank.org/indicator/SP.URB.TOTL.IN.ZS?locations=NG (accessed on 14 July 2024).
  8. Sun, Y.; Jiao, L.; Guo, Y.; Xu, Z. Recognizing urban shrinkage and growth patterns from a global perspective. Appl. Geogr. 2024, 166, 103247. [Google Scholar] [CrossRef]
  9. Adewale, A.O.; Adepoju, K.A.; Awotoye, O.O. Mapping and assessing impervious surface areas and urban heat island in Osogbo, Nigeria. J. Earth Sci. Clim. Change 2017, 8, 1000424. [Google Scholar] [CrossRef]
  10. Leal Filho, W.; Icaza, L.E.; Neht, A.; Klavins, M.; Morgan, E.A. Coping with the impacts of urban heat islands. A literature based study on understanding urban heat vulnerability and the need for resilience in cities in a global climate change context. J. Clean. Prod. 2018, 171, 1140–1149. [Google Scholar] [CrossRef]
  11. Krajick, K. Exposure to deadly urban heat worldwide has tripled in recent decades. In State of the Planet; Earth Institute, Columbia University: New York, NY, USA, 2021; Available online: https://news.climate.columbia.edu/2021/10/04/exposure-to-deadly-urban-heat-worldwide-has-tripled-in-recent-decades/ (accessed on 10 August 2024).
  12. Ma, X.; Dong, L. Surface urban heat island effect and its spatiotemporal dynamics in metropolitan areas: A case study in the Zhengzhou metropolitan area, China. Front. Environ. Sci. 2023, 11, 1247046. [Google Scholar] [CrossRef]
  13. Badmos, O.S.; Callo-Concha, D.; Agbola, B.; Rienow, A.; Badmos, B.; Greve, K.; Jürgens, C. Determinants of residential location choices by slum dwellers in Lagos megacity. Cities 2020, 98, 102589. [Google Scholar] [CrossRef]
  14. Patel, S.K.; Verma, P.; Shankar Singh, G. Agricultural growth and land use land cover change in peri-urban India. Environ. Monit. Assess. 2019, 191, 600. [Google Scholar] [CrossRef]
  15. Verma, P.; Singh, R.; Singh, P.; Raghubanshi, A.S. Urban ecology–current state of research and concepts. In Urban Ecology; Elsevier: Amsterdam, The Netherlands, 2020; pp. 3–16. [Google Scholar] [CrossRef]
  16. Das, S.; Angadi, D.P. Land use-land cover (LULC) transformation and its relation with land surface temperature changes: A case study of Barrackpore Subdivision, West Bengal, India. Remote Sens. Appl. Soc. Environ. 2020, 19, 100322. [Google Scholar] [CrossRef]
  17. Demisse Negesse, M.; Hishe, S.; Getahun, K. LULC dynamics and the effects of urban green spaces in cooling and mitigating micro-climate change and urban heat island effects: A case study in Addis Ababa city, Ethiopia. J. Water Clim. Change 2024, 15, 3033–3055. [Google Scholar] [CrossRef]
  18. Du, Y.; Xie, J.; Xie, Z.; Wang, N.; Zhang, L. Spatiotemporal Footprints of Surface Urban Heat Islands in the Urban Agglomeration of Yangtze River Delta During 2000–2022. Remote Sens. 2025, 17, 892. [Google Scholar] [CrossRef]
  19. Kazemi, A.; Cirella, G.T.; Hedayatiaghmashhadi, A.; Gili, M. Temporal-spatial Distribution of Surface Urban Heat Island and Urban Pollution Island in an Industrial City: Seasonal Analysis. IEEE J. Sel. Top. Appl. Earth Obs. Remote Sens. 2025, 18, 7100. [Google Scholar] [CrossRef]
  20. Simwanda, M.; Ranagalage, M.; Estoque, R.C.; Murayama, Y. Spatial analysis of surface urban heat islands in four rapidly growing African cities. Remote Sens. 2019, 11, 1645. [Google Scholar] [CrossRef]
  21. Aguda, A.S.; Adegboyega, S.A. Evaluation of spatio-temporal dynamics of urban sprawl in Osogbo, Nigeria using satellite imagery & GIS techniques. Int. J. Multidiscip. Curr. Res. 2013, 1, 39–51. [Google Scholar]
  22. Jones, B.; Tebaldi, C.; O’Neill, B.C.; Oleson, K.; Gao, J. Avoiding population exposure to heat-related extremes: Demographic change vs climate change. Clim. Change 2018, 146, 423–437. [Google Scholar] [CrossRef]
  23. Eresanya, E.O.; Daramola, M.T.; Durowoju, O.S.; Awoyele, P. Investigation of the changing patterns of the land use land cover over Osogbo and its environs. R. Soc. Open Sci. 2019, 6, 191021. [Google Scholar] [CrossRef]
  24. Mekonnen, G.T.; Berlie, A.B.; Wubie, M.A.; Legesse, S.A. Drivers of surface urban heat island of Gondar City, Ethiopia: A comparative study. Cogent Soc. Sci. 2024, 10, 2354974. [Google Scholar] [CrossRef]
  25. Shao, H.; Kim, G. A comprehensive review of different types of green infrastructure to mitigate urban heat islands: Progress, functions, and benefits. Land 2022, 11, 1792. [Google Scholar] [CrossRef]
  26. Giorio, M.; Paparella, R. Climate Mitigation Strategies: The Use of Cool Pavements. Sustainability 2023, 15, 7641. [Google Scholar] [CrossRef]
  27. Vardhu VA, K.; Sharma, A. Classification, Mitigations and Methods to Detect UHI: A Review. Int. J. Sci. Res. Eng. Manag. 2023, 7, 2–3. [Google Scholar] [CrossRef]
  28. Chun, B.; Guldmann, J.M. Spatial statistical analysis and simulation of the urban heat island in high-density central cities. Landsc. Urban Plan. 2014, 125, 76–88. [Google Scholar] [CrossRef]
  29. Helbling, M.; Meierrieks, D. Global warming and urbanization. J. Popul. Econ. 2023, 36, 1187–1223. [Google Scholar] [CrossRef]
  30. Dissanayake, D.; Morimoto, T.; Murayama, Y.; Ranagalage, M. The impact of landscape composition for urban heat island intensity in Addis Ababa City using Landsat data (1986–2016). Abstr. ICA 2019, 1, 63. [Google Scholar] [CrossRef]
  31. Degefu, M.A.; Argaw, M.; Feyisa, G.L.; Degefa, S. Dynamics of green spaces-land surface temperature intensity nexus in cities of Ethiopia. Heliyon 2023, 9, e13274. [Google Scholar] [CrossRef]
  32. Owoeye, J.O.; Ibitoye, O.A. Analysis of Akure urban land use change detection from remote imagery perspective. Urban Stud. Res. 2016, 2016, 4673019. [Google Scholar] [CrossRef]
  33. Irfeey, A.M.M.; Chau, H.W.; Sumaiya, M.M.F.; Wai, C.Y.; Muttil, N.; Jamei, E. Sustainable mitigation strategies for urban heat island effects in urban areas. Sustainability 2023, 15, 10767. [Google Scholar] [CrossRef]
  34. Makvandi, M.; Li, W.; Ou, X.; Chai, H.; Khodabakhshi, Z.; Fu, J.; Yuan, P.F.; Horimbere, E.D.L.J. Urban heat mitigation towards climate change adaptation: An eco-sustainable design strategy to improve environmental performance under rapid urbanization. Atmosphere 2023, 14, 638. [Google Scholar] [CrossRef]
  35. Grace, U.M.; Sawa, B.A.; Jaiyeoba, I.A. Multi-temporal remote sensing of land-use dynamics in Zaria, Nigeria. J. Environ. Earth Sci. 2015, 5, 121–138. [Google Scholar]
  36. Wang, J.; Maduako, I.N. Spatio-temporal urban growth dynamics of Lagos Metropolitan Region of Nigeria based on Hybrid methods for LULC modeling and prediction. Eur. J. Remote Sens. 2018, 51, 251–265. [Google Scholar] [CrossRef]
  37. Mahmoud, M.I.; Duker, A.; Conrad, C.; Thiel, M.; Ahmad, H.S. Analysis of Settlement Expansion and Urban Growth Modelling Using Geoinformation for Assessing Potential Impacts of Urbanization on Climate in Abuja City, Nigeria. Remote Sens. 2016, 8, 220. [Google Scholar] [CrossRef]
  38. Koko, A.F.; Yue, W.; Abubakar, G.A.; Alabsi, A.A.N.; Hamed, R. Spatiotemporal influence of land use/land cover change dynamics on surface urban heat island: A case study of Abuja metropolis, Nigeria. ISPRS Int. J. Geo-Inf. 2021, 10, 272. [Google Scholar] [CrossRef]
  39. Eludoyin, A.O.; Omotoso, I.; Eludoyin, O.M.; Popoola, K.S. Remote sensing technology for evaluation of variations in land surface temperature, and case study analysis from Southwest Nigeria. In Geospatial Challenges in the 21st Century; Springer: Cham, Switzerland, 2019; pp. 151–170. [Google Scholar] [CrossRef]
  40. Makinde, E.O.; Agbor, C.F. Geoinformatic assessment of urban heat island and land use/cover processes: A case study from Akure. Environ. Earth Sci. 2019, 78, 483. [Google Scholar] [CrossRef]
  41. Ofordu, C.S.; Agbor, C.F.; Aigbokhan, O.J.; Audu, M.A.; Adedoyin, E.D.; Ogoliegbune, O.M. Urban Heat Island and Land Use/Cover Dynamics Evaluation in Enugu Urban, Nigeria. J. Geosci. Environ. Prot. 2022, 10, 354–372. [Google Scholar] [CrossRef]
  42. Odunsi, O.M.; Rienow, A. Estimating Surface Urban Heat Island Effects of Abeokuta Within the Context of Its Economic Development Cluster in Ogun State Nigeria: A Baseline Study Utilising Remote Sensing and Cloud-Based Computing Technologies. Climate 2024, 12, 198. [Google Scholar] [CrossRef]
  43. National Population Commission of Nigeria: National Bureau of Statistics—City Population. 2023. Available online: https://citypopulation.de/en/nigeria/admin/ondo/NGA029005__akure_north/ (accessed on 14 July 2024).
  44. Fasakin, J.; Basorun, J.; Bello, M.; Enisan, O.; Ojo, B.; Popoola, O. Effect of Land Pricing on Residential Density Patter in Akure Nigeria. Adv. Soc. Sci. Res. J. 2018, 5, 31–43. [Google Scholar] [CrossRef]
  45. Oduwaye, L.; Akinbile, C.; Oluwatobi, A. A GIS-based assessment of urban expansion and its environmental consequences in Akure, Nigeria. J. Environ. Plan. Manag. 2020, 63, 1407–1425. [Google Scholar]
  46. Adejuwon, J.O.; Adekitan, A.A.; Oladunmoye, S.L. Community awareness and evaluation of surface water bodies in Osogbo, Osun State, Nigeria. J. Appl. Sci. Environ. Manag. 2018, 22, 1567–1571. [Google Scholar] [CrossRef]
  47. Oladehinde, G.; Fatusin, A.F.; Ojo, V. Urban expansion and loss of agricultural land in Osogbo, Osun State Nigeria, using multi-temporal imageries. J. Afr. Real Estate Res. 2019, 4, 139–156. [Google Scholar] [CrossRef]
  48. Olayiwola, A.M.; Olaitan, A.A. Spatial preference of urban residential location in Osogbo, Nigeria. Ghana J. Geogr. 2019, 11, 140–158. [Google Scholar]
  49. Aluko, O.W.; Okhimamhe, A.; Abubaker, S. Towards Transforming Osogbo into a Sustainable City, The Remote Sensing Perspective. AlJR Prepr. 2022. [Google Scholar] [CrossRef]
  50. Alimi, S.A.; Andongma, T.W.; Ogungbade, O.; Senbore, S.S.; Alepa, V.C.; Akinlabi, O.J.; Olawale, L.; Muhammed, Q. Flood vulnerable zones mapping using geospatial techniques: Case study of Osogbo Metropolis, Nigeria. Egypt. J. Remote Sens. Space Sci. 2022, 25, 841–850. [Google Scholar] [CrossRef]
  51. Gorelick, N.; Hancher, M.; Dixon, M.; Ilyushchenko, S.; Thau, D.; Moore, R. Google Earth Engine: Planetary-scale geospatial analysis for everyone. Remote Sens. Environ. 2017, 202, 18–27. [Google Scholar] [CrossRef]
  52. Badmos, O.S.; Rienow, A.; Callo-Concha, D.; Greve, K.; Jürgens, C. Urban development in West Africa—Monitoring and intensity analysis of slum growth in Lagos: Linking pattern and process. Remote Sens. 2018, 10, 1044. [Google Scholar] [CrossRef]
  53. Badmos, O.S.; Rienow, A.; Callo-Concha, D.; Greve, K.; Jürgens, C. Simulating slum growth in Lagos: An integration of rule based and empirical based model. Comput. Environ. Urban Syst. 2019, 77, 101369. [Google Scholar] [CrossRef]
  54. Breiman, L. Random forests. Mach. Learn. 2001, 45, 5–32. [Google Scholar] [CrossRef]
  55. Franco, F.; Di Napoli, A. Reliability assessment of a measure: The kappa statistic. G. Tec. Nefrol. Dial. 2016, 28, 289–292. [Google Scholar] [CrossRef]
  56. Huang, S.; Tang, L.; Hupy, J.P.; Wang, Y.; Shao, G.F. A commentary review on the use of normalized difference vegetation index (NDVI) in the era of popular remote sensing. J. For. Res. 2021, 32, 1–6, Erratum in J. For. Res. 2021, 32, 2719. [Google Scholar]
  57. Heydarian, M.; Doyle, T.E.; Samavi, R. MLCM: Multi-label confusion matrix. IEEE Access 2022, 10, 19083–19095. [Google Scholar] [CrossRef]
  58. Norman, J.M.; Becker, F. Terminology in thermal infrared remote sensing of natural surfaces. Agric. For. Meteorol. 1995, 77, 153–166. [Google Scholar] [CrossRef]
  59. Li, Z.L.; Tang, B.H.; Wu, H.; Ren, H.; Yan, G.; Wan, Z.; Trigo, I.F.; Sobrino, J.A. Satellite-derived land surface temperature: Current status and perspectives. Remote Sens. Environ. 2013, 131, 14–37. [Google Scholar] [CrossRef]
  60. Waleed, M.; Sajjad, M.; Acheampong, A.O.; Alam, M.T. Towards sustainable and livable cities: Leveraging remote sensing, machine learning, and geo-information modelling to explore and predict thermal field variance in response to urban growth. Sustainability 2023, 15, 1416. [Google Scholar] [CrossRef]
  61. Moisa, M.B.; Gemeda, D.O. Assessment of urban thermal field variance index and thermal comfort level of Addis Ababa metropolitan city, Ethiopia. Heliyon 2022, 8, e10185. [Google Scholar] [CrossRef] [PubMed]
  62. Bytyqi, V.; Qevani, S.; Agaj, T. Quantifying and Visualizing Land Cover Changes. An Analysis from the Hasi Region (Kosovo). Folia Geogr. 2024, 66, 50–68. [Google Scholar]
  63. Ghazaryan, G.; Rienow, A.; Oldenburg, C.; Thonfeld, F.; Trampnau, B.; Sticksel, S.; Jürgens, C. Monitoring of urban sprawl and densification processes in western Germany in the light of SDG indicator 11.3.1 based on an automated retrospective classification approach. Remote Sens. 2021, 13, 1694. [Google Scholar] [CrossRef]
  64. Cuba, N. Research note: Sankey diagrams for visualizing land cover dynamics. Landsc. Urban Plan. 2015, 139, 163–167. [Google Scholar] [CrossRef]
  65. Balogun, I.A.; Adeyewa, D.Z.; Balogun, A.A.; Morakinyo, T.E. Analysis of urban expansion and land use changes in Akure, Nigeria, using remote sensing and geographic information system (GIS) techniques. J. Geogr. Reg. Plan. 2011, 4, 533. [Google Scholar]
  66. Ekemode, B.G. Impact of urban regeneration on commercial property values in Osogbo, Osun State, Nigeria. Smart Sustain. Built Environ. 2020, 9, 557–571. [Google Scholar] [CrossRef]
  67. Ismail, A.I.; Kehinde, O.J.; Adedayo, O.O.; Aderinola, O.F. Appraising the Performance of Urban Renewal Measures in Nigeria: A Case of Osogbo, Osun State. Int. J. Humanit. Soc. Sci. 2020, 10, 75. [Google Scholar] [CrossRef]
  68. Yoade, A.O.; Onifade, V.A.; Jimoh, H.O. Residents’ satisfaction with urban renewal projects in south-western Nigeria. J. Urban Regen. Renew. 2022, 16, 139–154. [Google Scholar] [CrossRef]
  69. Ojo, O.O.; Shittu, A.A.; Adebolu, T.J. Landuse Pattern and Landcover of Akure Forest Reserve and Its Environs. Int. J. Environ. Clim. Change 2019, 9, 852–861. [Google Scholar] [CrossRef]
  70. Ochei, M.C.; Ogunfuyi, S.O. Impact of Urbanization on Temperature Trend Using Geospatial Techniques in Ondo State, Nigeria. Remote Sens. Earth Syst. Sci. 2023, 6, 208–223. [Google Scholar] [CrossRef]
  71. Rauf, S.; Pasra, M.M. Analysis of correlation between urban heat islands (SUHI) with land-use using sentinel 2 time-series image in Makassar city. In IOP Conference Series: Earth and Environmental Science, Proceedings of the 3rd International Conference on Civil and Environmental Engineering (ICCEE 2019), Bali, Indonesia, 29–30 August 2019; IOP Publishing: Bristol, UK, 2020; Volume 419, p. 012088. [Google Scholar] [CrossRef]
  72. Patriota, E.G. Analysis of Patterns, Drivers, and Trends of Surface Urban Heat Islands (SSUHIS) in Brazil. 2024. Available online: https://repositorio.ufpb.br/jspui/handle/123456789/32140 (accessed on 16 January 2025).
  73. Singh, R.; Kalota, D. Urban sprawl and its impact on generation of urban heat island: A case study of Ludhiana city. J. Indian Soc. Remote Sens. 2019, 47, 1567–1576. [Google Scholar] [CrossRef]
  74. Kafy, A.A.; Rahman, M.S.; Hasan, M.M.; Islam, M. Modelling future land use land cover changes and their impacts on land surface temperatures in Rajshahi, Bangladesh. Remote Sens. Appl. Soc. Environ. 2020, 18, 100314. [Google Scholar] [CrossRef]
  75. Saleem, M.S.; Ahmad, S.R.; Javed, M.A. Impact assessment of urban development patterns on land surface temperature by using remote sensing techniques: A case study of Lahore, Faisalabad and Multan district. Environ. Sci. Pollut. Res. 2020, 27, 39865–39878. [Google Scholar] [CrossRef]
  76. Seun, A.I.; Ayodele, A.P.; Koji, D.; Akande, S.O. The potential impact of increased urbanization on land surface temperature over South-West Nigeria. Curr. Res. Environ. Sustain. 2022, 4, 100142. [Google Scholar] [CrossRef]
  77. Ma, X.; Peng, S. Research on the spatiotemporal coupling relationships between land use/land cover compositions or patterns and the surface urban heat island effect. Environ. Sci. Pollut. Res. 2022, 29, 39723–39742. [Google Scholar] [CrossRef]
Figure 1. Maps of the study area.
Climate 13 00068 g001
Figure 2. Methodological framework. (Keys: NDVI—Normalized Difference Vegetation Index, ε—Emissivity, LST—Land Surface Temperature, SUHI—Surface Urban Heat Island, UTFVI—Urban Thermal Field Variance Index, LULCC—Land Use Land Cover Change).
Climate 13 00068 g002
Figure 3. Land use land cover classification of Akure.
Climate 13 00068 g003
Figure 4. Land use land cover classification of Osogbo.
Climate 13 00068 g004
Figure 5. Sankey charts for land use and land cover changes in Akure from 2014 to 2023.
Climate 13 00068 g005
Figure 6. Sankey charts for land use and land cover changes in Osogbo from 2014 to 2023.
Climate 13 00068 g006
Figure 7. Sankey charts for percentage change of Akure and Osogbo (2014–2023).
Climate 13 00068 g007
Figure 8. NDVI of Akure and Osogbo 2014 and 2023.
Climate 13 00068 g008
Figure 9. Emissivity of Akure and Osogbo 2014 and 2023.
Climate 13 00068 g009
Figure 10. LST of Akure and Osogbo 2014 and 2023.
Climate 13 00068 g010
Figure 11. SUHI of Akure and Osogbo 2014 and 2023.
Climate 13 00068 g011
Figure 12. UTFVI of Akure and Osogbo 2014 and 2023.
Climate 13 00068 g012
Table 1. Landsat images (number of images per year, acquisition dates, satellite sensor, level of processing, and time of satellite passage).
YearSatellite & SensorNumber of ImagesAcquisition DatesImage LevelTime of Passage (Local Time)
2014Landsat 8 (OLI/TIRS)34 June 2024Level-2 (Surface Reflectance & Temperature)~10:00 AM
2023Landsat 9 (OLI-2/TIRS-2)35 June 2024Level-2 (Surface Reflectance & Temperature)~10:00 AM
Source: NASA/USGS (2019, 2022).
Table 2. Assessment of the accuracy of LULC in 2014 and 2023 for Akure and Osogbo.
SampleAssessmentAkure 2014Akure 2023Osogbo 2014Osogbo 2023
TrainingOverall Accuracy (OvA)0.9980.9980.9930.996
Kappa Coefficient (K)0.9980.9960.9910.995
TestingOverall Accuracy (OvA)0.8120.8000.8340.816
Kappa Coefficient (K)0.7460.7050.7910.738
Number of trees for hyperparameter tuning80909050
Table 3. Relationship between change in LULC and SUHI effects.
Study AreaClassMinMaxMeanSDMedian90th Percentile
Akure 2014Built−0.1150.2810.1140.0560.1140.189
Bare land−0.2190.2790.0230.0550.0200.091
Light forest−0.2260.223−0.0260.046−0.0290.035
Thick forest−0.2200.220−0.0720.036−0.076−0.028
Water−0.0980.1550.0130.0460.0080.072
Akure 2023Built−0.4350.2670.0830.0650.0930.157
Bare land−0.2500.2330.0520.0520.0560.115
Light forest−0.4790.227−0.0350.064−0.0380.051
Thick forest−0.4420.229−0.0840.048−0.084−0.027
Water−0.0980.1260.0090.0460.0120.069
Osogbo 2014Built−0.0940.2350.1060.0450.1060.166
Bare land−0.2000.163−0.0290.0720.0260.065
Light forest−0.2110.199−0.0160.062−0.0160.066
Thick forest−0.2370.151−0.1270.048−0.135−0.063
Water−0.2340.179−0.1150.073−0.1430.005
Osogbo 2023Built−0.1550.2210.0750.0470.0800.130
Bare land−0.1540.117−0.0170.048−0.0130.046
Light forest−0.2140.149−0.0210.054−0.0150.046
Thick forest−0.2440.135−0.1160.052−0.125−0.043
Water−0.2860.083−0.1630.045−0.156−0.117
Disclaimer/Publisher’s Note: The statements, opinions and data contained in all publications are solely those of the individual author(s) and contributor(s) and not of MDPI and/or the editor(s). MDPI and/or the editor(s) disclaim responsibility for any injury to people or property resulting from any ideas, methods, instructions or products referred to in the content.

