


A Pilot Study with Low-Cost Sensors: Seasonal Variation of Particulate Matter Ratios and Their Relationship with Meteorological Conditions in Rio Grande, Brazil
 , ,
, ,  , , , , , , ,
Abstract
1. Introduction
2. Materials and Methods
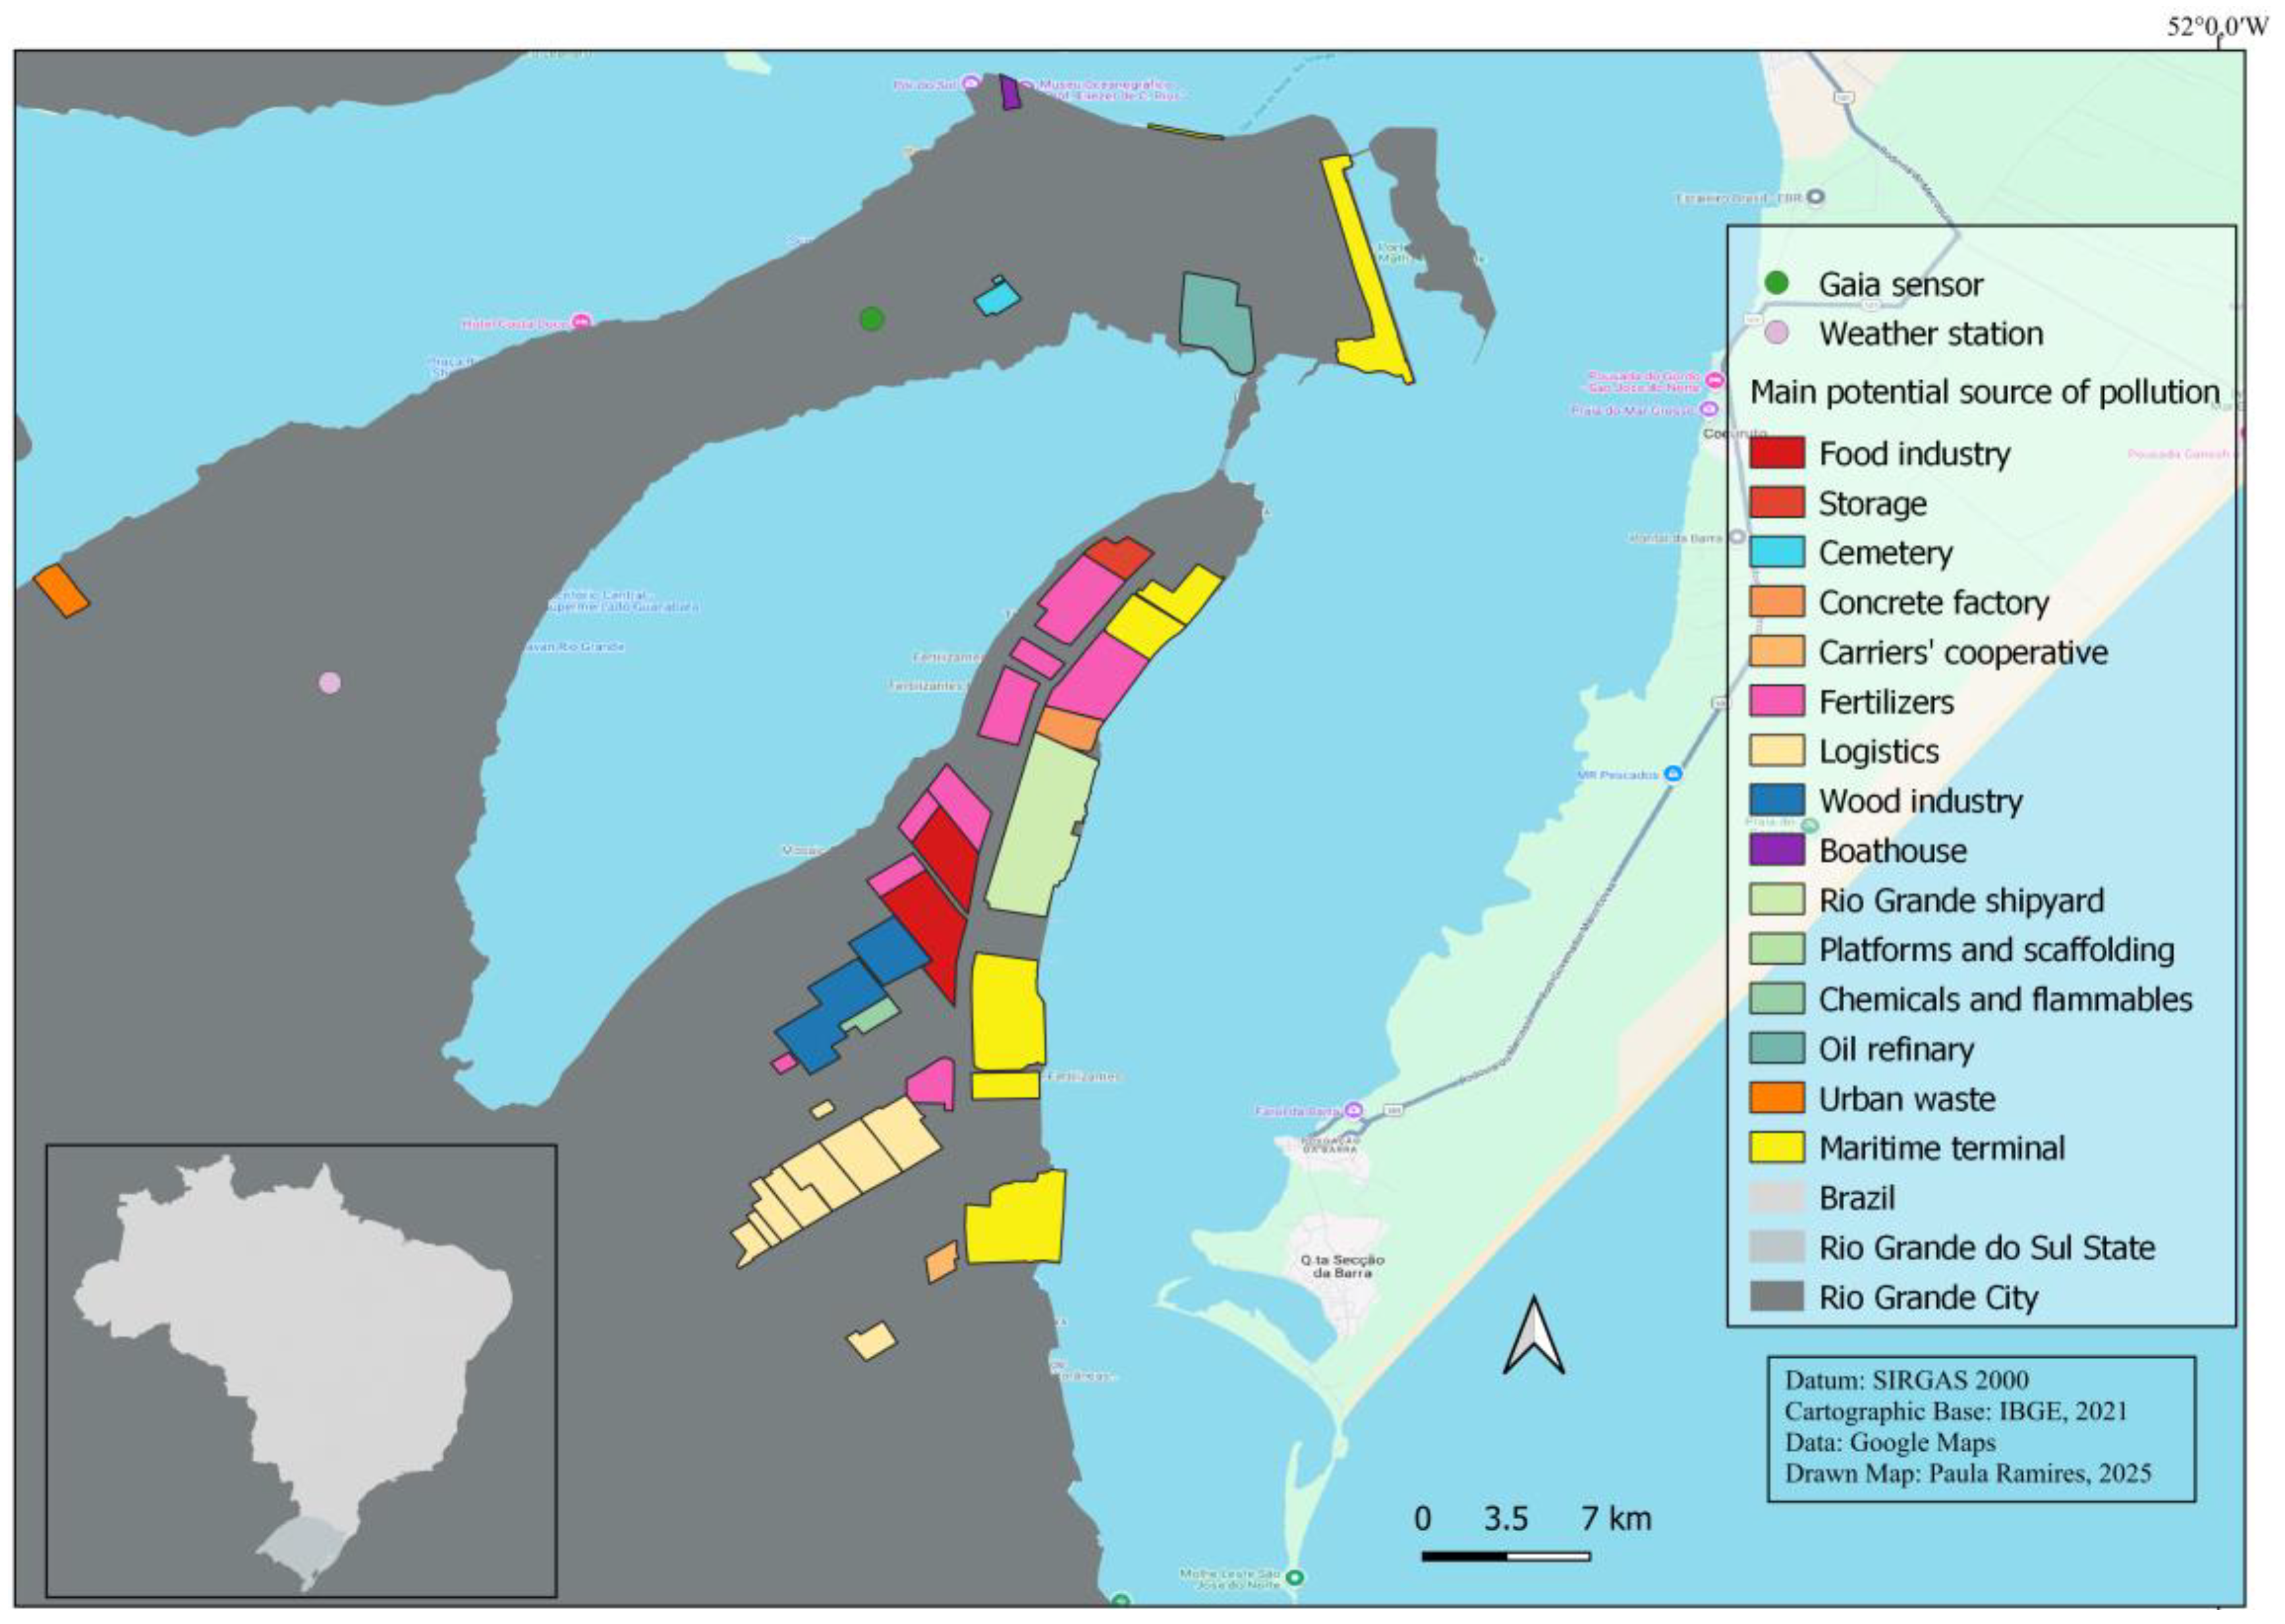
2.1. Study Area
2.2. Data Collection
2.3. Data Analysis
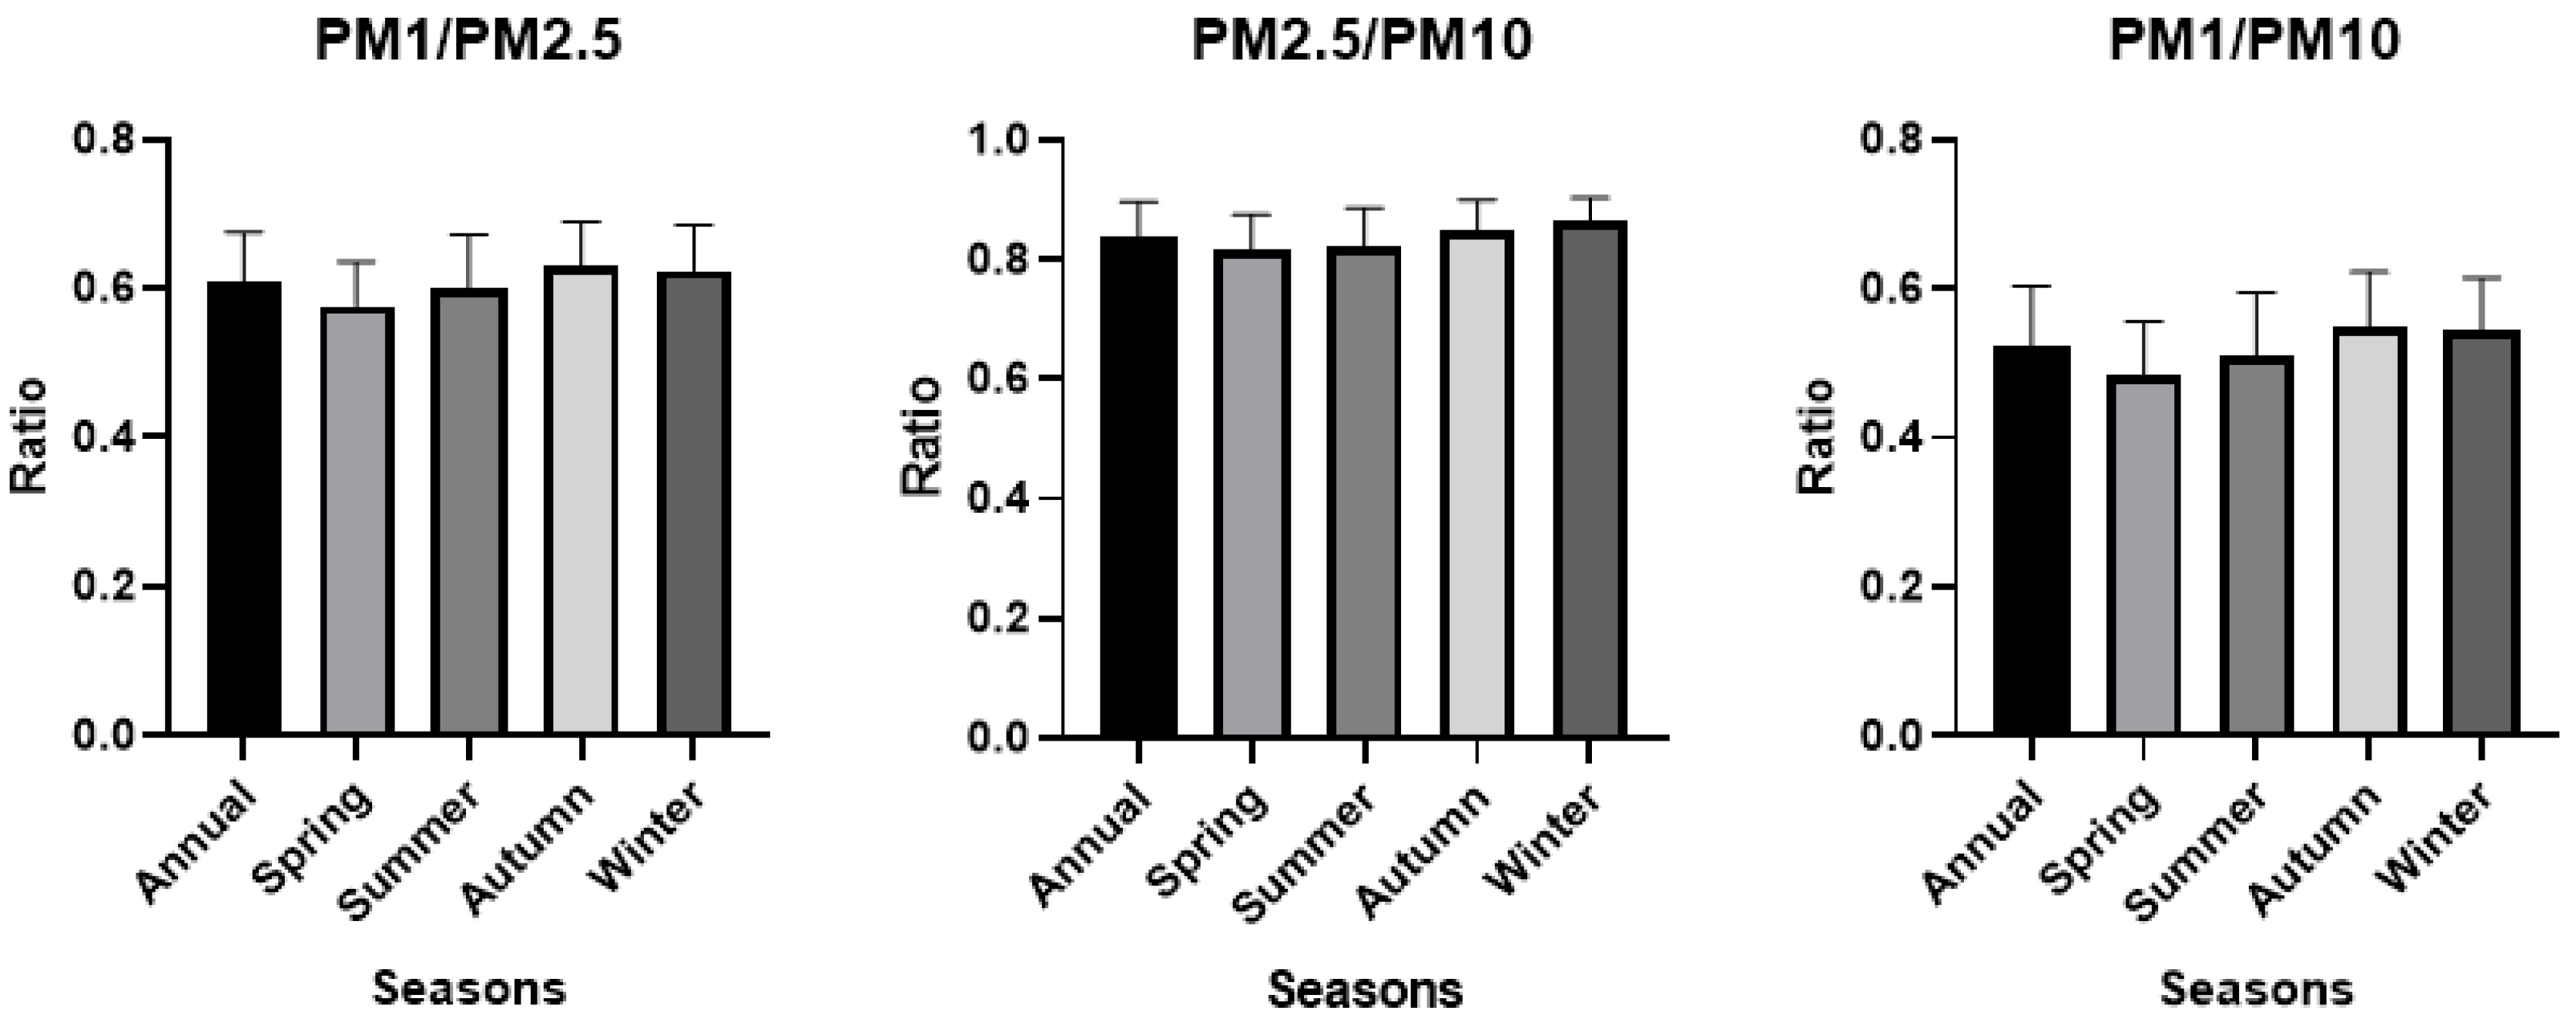
3. Results
4. Discussion
5. Conclusions
Author Contributions
Funding
Data Availability Statement
Acknowledgments
Conflicts of Interest
References
- World Health Organization (WHO). Ambient (Outdoor) Air Quality and Health. Available online: https://www.who.int/news-room/fact-sheets/detail/ambient-(outdoor)-air-quality-and-health (accessed on 24 June 2024).
- Bozigar, M.; Lawson, A.B.; Pearce, J.L.; Svendsen, E.R.; Vena, J.E. Using Bayesian time-stratified case-crossover models to examine associations between air pollution and “asthma seasons” in a low air pollution environment. PLoS ONE 2021, 16, e0260264. [Google Scholar] [CrossRef]
- Contiero, P.; Boffi, R.; Tagliabue, G.; Scaburri, A.; Tittarelli, A.; Bertoldi, M.; Borgini, A.; Favia, I.; Ruprecht, A.A.; Maiorino, A.; et al. A Case-Crossover Study to Investigate the Effects of Atmospheric Particulate Matter Concentrations, Season, and Air Temperature on Accident and Emergency Presentations for Cardiovascular Events in Northern Italy. Int. J. Environ. Res. Public Health 2019, 16, 4627. [Google Scholar] [CrossRef]
- Ministério do Meio Ambiente. Poluentes Atmosféricos. Available online: https://antigo.mma.gov.br/cidades-sustentaveis/qualidade-do-ar/poluentes-atmosf%C3%A9ricos.html#:~:text=Os%20principais%20PCVC%20s%C3%A3o%20o,s%C3%B3lidos%20(carv%C3%A3o%2C%20madeira) (accessed on 5 November 2024).
- United States Environmental Protection Agency (EPA). Particulate Matter (PM) Basics. Available online: https://www.epa.gov/pm-pollution/particulate-matter-pm-basics (accessed on 24 June 2024).
- Companhia Ambiental do Estado de São Paulo (CETESB). Qualidade do ar. Available online: https://cetesb.sp.gov.br/ar/poluentes/ (accessed on 1 February 2025).
- Kyung, S.Y.; Jeong, S.H. Particulate-Matter Related Respiratory Diseases. Tuberc. Respir. Dis. 2020, 83, 116–121. [Google Scholar] [CrossRef]
- Harrison, R.M. Airborne particulate matter. Philos. Trans. R. Soc. A. 2020, 378, 20190319. [Google Scholar] [CrossRef]
- Li, W.; Dorans, K.S.; Wilker, E.H.; Rice, M.B.; Kloog, I.; Schwartz, J.D.; Koutrakis, P.; Coull, B.A.; Gold, D.R.; Meigs, J.B.; et al. Ambient air pollution, adipokines, and glucose homeostasis: The Framingham Heart Study. Environ. Int. 2020, 111, 14–22. [Google Scholar] [CrossRef]
- Daiber, A.; Kuntic, M.; Hahad, O.; Delogu, L.G.; Rohrbach, S.; Di Lisa, F.; Schulz, R.; Münzel, T. Effects of air pollution particles (ultrafine and fine particulate matter) on mitochondrial function and oxidative stress—Implications for cardiovascular and neurodegenerative diseases. Arch. Biochem. Biophys. 2020, 696, 108662. [Google Scholar] [CrossRef]
- Mukherjee, A.; Agrawal, M. Matéria particulada do ar mundial: Fontes, distribuição e efeitos na saúde. Environ. Chem. Lett. 2017, 15, 283–309. [Google Scholar] [CrossRef]
- Schwarze, P.E.; Ovrevik, J.; Lag, M.; Refsnes, M.; Nafstad, P.; Hetland, R.B.; Dybing, E. Particulate matter properties and health effects: Consistency of epidemiological and toxicological studies. Hum. Exp. Toxicol. 2006, 25, 559–579. [Google Scholar] [CrossRef]
- Loxham, M.; Davies, D.E.; Holgate, S.T. The health effects of fine particulate air pollution. BMJ 2019, 367, l6609. [Google Scholar] [CrossRef]
- Garcia, A.; Santa-Helena, E.; De Falco, A.; Ribeiro, J.d.P.; Gioda, A.; Gioda, C.R. Toxicological Effects of Fine Particulate Matter (PM2.5): Health Risks and Associated Systemic Injuries-Systematic Review. Water Air Soil Pollut. 2023, 234, 346. [Google Scholar] [CrossRef]
- Prana Air. What Is Particulate Matter (PM). Available online: https://www.pranaair.com/pt-pt/what-is-particulate-matter-pm/ (accessed on 24 June 2024).
- Tavella, R.A.; Brum, R.d.L.; Silva, L.d.S.d.; Freitas, L.d.S.; Ramires, P.F.; They, N.H.; Coronas, M.V.; da Silva Júnior, F.M.R. Footprints of COVID-19 on PM2.5/PM10 Ratio in a Brazilian Tropical Metropolis. Aerosol. Sci. Eng. 2024, 8, 146–156. [Google Scholar] [CrossRef]
- Popescu, L.L.; Popescu, R.S.; Catalina, T. Indoor particle’s pollution in Bucharest, Romania. Toxics 2022, 10, 757. [Google Scholar] [CrossRef]
- Suriya; Natsagdorj, N.; Aorigele; Zhou, H.; Sachurila. Spatiotemporal Variation in Air Pollution Characteristics and Influencing Factors in Ulaanbaatar from 2016 to 2019. Atmosphere 2022, 13, 990. [Google Scholar] [CrossRef]
- Munir, S. Analysing Temporal Trends in the Ratios of PM2.5/PM10 in the UK. Aerosol Air Qual. Res. 2017, 17, 34–48. [Google Scholar] [CrossRef]
- Zhao, D.; Chen, H.; Yu, E.; Luo, T. PM2.5/PM10 ratios in eight economic regions and their relationship with meteorology in China. Adv. Meteorol. 2019, 2019, 5295726. [Google Scholar] [CrossRef]
- Xiong, J.; Li, J.; Wu, X.; Wolfson, J.M.; Lawrence, J.; Stern, R.A.; Koutrakis, P.; Wei, J.; Huang, S. The association between daily-diagnosed COVID-19 morbidity and short-term exposure to PM1 is larger than associations with PM2.5 and PM10. Environ. Res. 2022, 210, 113016. [Google Scholar] [CrossRef]
- Mahapatra, P.S.; Jain, S.; Shrestha, S.; Senapati, S.; Puppala, S.P. Ambient endotoxin in PM10 and association with inflammatory activity, air pollutants, and meteorology, in Chitwan, Nepal. Sci. Total Environ. 2018, 618, 1331–1342. [Google Scholar] [CrossRef]
- Bamola, S.; Goswami, G.; Dewan, S.; Goyal, I.; Agarwal, M.; Dhir, A.; Lakhani, A. Characterising temporal variability of PM2.5/PM10 ratio and its correlation with meteorological variables at a sub-urban site in the Taj City. Urban. Clim. 2024, 53, 101763. [Google Scholar] [CrossRef]
- Brasil. Casa Civil. Lançado o Programa AR Puro Para Monitorar a Qualidade do ar no Brasil. Available online: https://www.gov.br/casacivil/pt-br/assuntos/noticias/2021/agosto/lancado-o-programa-ar-puro-para-monitorar-a-qualidade-do-ar-no-brasil (accessed on 1 December 2024).
- Peng, Z.; Cao, S.; Du, M.; Yang, M.; Lu, L.; Cai, Y.; Mo, Y.; Zhao, W. Spatiotemporal Patterns and Dominant Factors of Urban Particulate Matter Islands: New Evidence from 240 Cities in China. Sustainability 2022, 14, 6117. [Google Scholar] [CrossRef]
- Sharma, D.; Thapar, S.; Jain, D.; Sachdeva, K. Mapping the Spatiotemporal Variability of Particulate Matter Pollution in Delhi: Insights from Land Use Regression Modelling. J. Indian Soc. Remote Sens. 2024, 52, 1329–1346. [Google Scholar] [CrossRef]
- Nguyen, N.H.; Nguyen, H.X.; Le, T.T.; Vu, C.D. Evaluating Low-Cost Commercially Available Sensors for Air Quality Monitoring and Application of Sensor Calibration Methods for Improving Accuracy. Open J. Air Pollut. 2021, 10, 1. [Google Scholar] [CrossRef]
- Cárcel-Carrasco, J.; Pascual-Guillamón, M.; Salas-Vicente, F. Analysis on the Effect of the Mobility of Combustion Vehicles in the Environment of Cities and the Improvement in Air Pollution in Europe: A Vision for the Awareness of Citizens and Policy Makers. Land 2021, 10, 184. [Google Scholar] [CrossRef]
- Cárcel-Carrasco, J.; Pascual-Guillamón, M.; Langa-Sanchis, J. Analysis of the Effect of COVID-19 on Air Pollution: Perspective of the Spanish Case. Environ. Sci. Pollut. Res. 2021, 28, 36880–36893. [Google Scholar] [CrossRef]
- Sun, W.; Li, R. Assessing the Impact of COVID-19 Lockdown on Fine-Scale Air Quality Across a Heavy-Pollution City Using Low-Cost Sensors. Atmos. Environ. 2024, 319, 120275. [Google Scholar] [CrossRef]
- Castell, N.; Dauge, F.R.; Schneider, P.; Vogt, M.; Lerner, U.; Fishbain, B.; Broday, D.; Bartonova, A. Can Commercial Low-Cost Sensor Platforms Contribute to Air Quality Monitoring and Exposure Estimates? Environ. Int. 2017, 99, 293–302. [Google Scholar] [CrossRef]
- Karagulian, F.; Barbiere, M.; Kotsev, A.; Spinelle, L.; Gerboles, M.; Lagler, F.; Redon, N.; Crunaire, S.; Borowiak, A. Review of the Performance of Low-Cost Sensors for Air Quality Monitoring. Atmosphere 2019, 10, 506. [Google Scholar] [CrossRef]
- Liu, X.; Jayaratne, R.; Thai, P.; Kuhn, T.; Zing, I.; Christensen, B.; Lamont, R.; Dunbabin, M.; Zhu, S.; Gao, J.; et al. Low-Cost Sensors as an Alternative for Long-Term Air Quality Monitoring. Environ. Res. 2020, 185, 109438. [Google Scholar] [CrossRef]
- Instituto Brasileiro de Geografia e Estatística. Rio Grande—Panorama. Available online: https://cidades.ibge.gov.br/brasil/rs/rio-grande/panorama (accessed on 17 July 2024).
- Bartz, M.L.; Halmenschlager, V.; Teixeira, G.S. Impactos socioeconômicos da expansão da indústria naval no Sul do Rio Grande do Sul. Planej. Polít. Públicas. 2021, 57, 11–38. [Google Scholar] [CrossRef]
- Ulguim, S.M.; Tavella, R.A.; Dias, D.; da Silva Júnior, F.M.R. Dinâmica dos poluentes atmosféricos e o modelo de distanciamento controlado do Rio Grande do Sul para controle da pandemia da COVID-19. Rev. Virtual Quimica 2021, 14, 136–141. [Google Scholar] [CrossRef]
- de Lima Brum, R.; Penteado, J.O.; Ramires, P.F.; Tavella, R.A.; Honscha, L.C.; da Silva Freitas, L.; de Moura, F.R.; da Silva Bonifácio, A.; da Silva, V.M.; da Silva, L.D.; et al. Southern Air Project-Scientific Efforts to Monitor and Measure the Impacts of Air Pollution in Southern Brazil. Soc. Impacts 2024, 4, 100074. [Google Scholar] [CrossRef]
- Cowell, N.; Chapman, L.; Bloss, W.; Pope, F. Field calibration and evaluation of an internetof-things-based particulate matter sensor. Front. Environ. Sci. 2022, 9, 798485. [Google Scholar] [CrossRef]
- Johnston, S.J.; Basford, P.J.; Bulot, F.M.J.; Apetroaie-Cristea, M.; Easton, N.H.C.; Davenport, C.; Foster, G.L.; Loxham, M.; Morris, A.K.R.; Cox, S.J. Monitoramento de material particulado em escala urbana usando dispositivos IoT de qualidade do ar baseados em LoRaWAN. Sensores 2019, 19, 209. [Google Scholar] [CrossRef]
- Waqi.info. “World’s Air Pollution: Real-Time Air Quality Index”. Waqui.info. Available online: https://waqi.info/#/c/4.113/8.206/2.2z (accessed on 25 January 2025).
- Jain, S.; Sharma, S.; Vijayan, N.; Mandal, T. Seasonal characteristics of aerosols (PM2.5 and PM10) and their source apportionment using PMF: A four year study over Delhi, India. Environ. Pollut. 2020, 262, 114337. [Google Scholar] [CrossRef] [PubMed]
- Gupta, L.; Bansal, M.; Nandi, P.; Habib, G.; Raman, R.S. Source apportionment and potential source regions of size-resolved particulate matter at a heavily polluted industrial city in the Indo-Gangetic Plain. Atmos. Environ. 2023, 298, 119614. [Google Scholar] [CrossRef]
- Mukherjee, A.; Agrawal, M. A Global Perspective of Fine Particulate Matter Pollution and Its Health Effects. Rev. Environ. Contam. Toxicol. 2018, 244, 5–51. [Google Scholar] [CrossRef]
- Kim, K.-H.; Kabir, E.; Kabir, S. A review on the human health impact of airborne particulate matter. Environ. Int. 2015, 74, 136–143. [Google Scholar] [CrossRef] [PubMed]
- Johnson, N.M.; Hoffmann, A.R.; Behlen, J.C.; Lau, C.; Pendleton, D.; Harvey, N.; Shore, R.; Li, Y.; Chen, J.; Tian, Y.; et al. Air pollution and children’s health-a review of adverse effects associated with prenatal exposure from fine to ultrafine particulate matter. Environ. Health Prev. Med. 2021, 26, 72. [Google Scholar] [CrossRef]
- Schraufnagel, D.E. The health effects of ultrafine particles. Exp. Mol. Med. 2020, 52, 311–317. [Google Scholar] [CrossRef]
- Chen, R.; Hu, B.; Liu, Y.; Xu, J.; Yang, G.; Xu, D.; Chen, C. Beyond PM2.5: The role of ultrafine particles on adverse health effects of air pollution. Biochim. Biophys. Acta 2016, 1860, 2844–2855. [Google Scholar] [CrossRef]
- Ohlwein, S.; Kappeler, R.; Joss, M.K.; Künzli, N.; Hoffmann, B. Health effects of ultrafine particles: A systematic literature review update of epidemiological evidence. Int. J. Public Health 2019, 64, 547–559. [Google Scholar] [CrossRef]
- Tavella, R.A.; Reis, F.O.; Bonifácio, A.d.S.; Moraes, N.G.d.R.; Aick, C.D.M.; Nadaleti, W.C.; Corrêa, É.K.; da Silva Júnior, F.M. Weekend Effect of Air Pollutants in a Tropical Brazilian Metropolis. Water Air Soil Pollut. 2023, 234, 1–13. [Google Scholar] [CrossRef]
- Espinoza-Guillen, J.A.; Alderete-Malpartida, M.B.; Navarro-Abarca, U.F.; Gómez-Muñoz, H.K. Temporal variation of the PM2.5/PM10 ratio and its association with meteorological factors in a South American megacity: Metropolitan Area of Lima-Callao, Peru. Environ. Monit. Assess 2024, 196, 1–24. [Google Scholar] [CrossRef]
- Theodosi, C.; Grivas, G.; Zarmpas, P.; Chaloulakou, A.; Mihalopoulos, N. Mass and chemical composition of size-segregated aerosols (PM1, PM2.5, PM10) over Athens, Greece: Local versus regional sources. Atmos. Chem. Phys. 2011, 11, 11895–11911. [Google Scholar] [CrossRef]
- Giuliano, M.; Lonati, G.; Butelli, P.; Romele, L.; Tardivo, R.; Grosso, M. Fine particulate (PM2.5–PM1) at urban sites with different traffic exposure. Atmos. Environ. 2005, 39, 2421–2431. [Google Scholar] [CrossRef]
- Fan, H.; Zhao, C.; Yang, Y.; Yang, X. Spatio-temporal variations of the PM2.5/PM10 ratios and its application to air pollution type classification in China. Front. Environ. Sci. 2021, 9, 692440. [Google Scholar] [CrossRef]
- Coskuner, G.; Jassim, M.S.; Munir, S. Characterizing temporal variability of PM2.5/PM10 ratio and its relationship with meteorological parameters in Bahrain. Environ. Forensics 2018, 19, 315–326. [Google Scholar] [CrossRef]
- Nejad, M.T.; Ghalehteimouri, K.J.; Talkhabi, H.; Dolatshahi, Z. The relationship between atmospheric temperature inversion and urban air pollution characteristics: A case study of Tehran, Iran. Discov. Environ. 2023, 1, 17. [Google Scholar] [CrossRef]
- Yang, J.X.; Lau, A.K.H.; Fung, J.C.H.; Zhou, W.; Wenig, M. An air pollution episode and its formation mechanism during the tropical cyclone Nuri’s landfall in a coastal city of south China. Atmos. Environ. 2012, 54, 746–753. [Google Scholar] [CrossRef]
- Pengjan, S.; Fan, C.; Bonnet, S.; Garivait, S. Assessment of the PM2.5/PM10 ratio in the Bangkok Metropolitan Region During 2011–2017. Int. J. Sustain. Energy Dev. 2020, 10, 75–84. [Google Scholar]
- Islam, N.; Saroar, G.; Ahmed, T. Meteorological Influences on Urban Air Quality Parameters in Dhaka City. J. Eng. Sci. 2021, 12, 1–8. [Google Scholar] [CrossRef]
- Zhang, R.; Wang, G.; Guo, S.; Zamora, M.L.; Ying, Q.; Lin, Y.; Wang, W.; Hu, M.; Wang, Y. Formation of urban fine particulate matter. Chem. Ver. 2015, 115, 3803–3855. [Google Scholar] [CrossRef]
- Boogaard, H.; Crouse, D.L.; Tanner, E.; Mantus, E.; van Erp, A.M.; Vedal, S.; Samet, J. Assessing adverse Health effects of Long-Term exposure to low levels of Ambient Air Pollution: The HEI experience and what’s Next? Environ. Sci. Technol. 2024, 58, 12767–12783. [Google Scholar] [CrossRef]
- Vecchi, R.; Marcazzan, G.; Valli, G.; Ceriani, M.; Antoniazzi, C. The role of atmospheric dispersion in the seasonal variation of PM1 and PM2.5 concentration and composition in the urban area of Milan (Italy). Atmos. Environ. 2004, 38, 4437–4446. [Google Scholar] [CrossRef]
- Chen, G.; Morawska, L.; Zhang, W.; Li, S.; Cao, W.; Ren, H.; Wang, B.; Wang, H.; Knibbs, L.D.; Williams, G.; et al. Spatiotemporal variation of PM1 pollution in China. Atmos. Environ. 2018, 178, 198–205. [Google Scholar] [CrossRef]
- Lee, S.C.; Cheng, Y.; Ho, K.F.; Cao, J.J.; Louie, P.K.K.; Chow, J.C.; Watson, J.G. PM1.0 and PM2.5 Characteristics in the Roadside Environment of Hong Kong. Aerosol. Sci. Technol. 2006, 40, 157–165. [Google Scholar] [CrossRef]
- Xu, R.; Wei, J.; Liu, T.; Li, Y.; Yang, C.; Shi, C.; Chen, G.; Zhou, Y.; Sun, H.; Liu, Y. Association of short-term exposure to ambient PM1 with total and cause-specific cardiovascular disease mortality. Environ. Int. 2022, 169, 107519. [Google Scholar] [CrossRef] [PubMed]
- Zong, Z.; Zhao, M.; Zhang, M.; Xu, K.; Zhang, Y.; Zhang, X.; Hu, C. Association between PM1 exposure and lung function in children and adolescents: A systematic review and meta-analysis. Int. J. Environ Res. Public Health 2022, 19, 15888. [Google Scholar] [CrossRef]
- Zhang, Y.; Wei, J.; Liu, C.; Cao, W.; Zhang, Z.; Li, Y.; Zeng, Q.; Sun, S. Association between ambient PM1 and semen quality: A cross-sectional study of 27,854 men in China. Environ Int. 2023, 175, 107919. [Google Scholar] [CrossRef]
- Garcia-Garza, L.A.; Tello-Leal, E.; Macías-Hernández, B.A.; Romero, G.; Hernandez-Resendiz, J.D. Particulate matter 1µm (PM1) dataset collected by low-cost sensors in residential and industrial areas at the neighborhood level. Data Br. 2024, 54, 110411. [Google Scholar] [CrossRef]
- Lung, S.C.; Tsou, M.M.; Hu, S.; Hsieh, Y.; Wang, W.V.; Shui, C.; Tan, C. Concurrent assessment of personal, indoor, and outdoor PM2.5 and PM1 levels and source contributions using novel low-cost sensing devices. Indoor Air 2020, 31, 755–768. [Google Scholar] [CrossRef]
- Schneider, I.L.; Teixeira, E.C.; Dotto, G.L.; Pinto, D.; Yang, C.-X.; Silva, L.F. Geochemical study of submicron particulate matter (PM1) in a metropolitan area. Geosci. Front. 2022, 13, 101130. [Google Scholar] [CrossRef]
- Xu, G.; Jiao, L.; Zhang, B.; Zhao, S.; Yuan, M.; Gu, Y.; Liu, J.; Tang, X. Spatial and Temporal Variability of the PM2.5/PM10 Ratio in Wuhan, Central China. Aerosol Air Qual. Res. 2017, 17, 741–751. [Google Scholar] [CrossRef]
- Spandana, B.; Rao, S.S.; Upadhya, A.R.; Kulkarni, P.; Sreekanth, V. PM2.5/PM10 ratio characteristics over urban sites of India. Adv. Space Res. 2021, 67, 3134–3146. [Google Scholar] [CrossRef]

| Season | Average (μg/m³) | Standard Deviation (μg/m³) | Maximum (μg/m³) |
|---|---|---|---|
| PM1 | |||
| Annual | 5.66 | 4.87 | 402.97 |
| Spring | 3.88 | 2.91 | 125.24 |
| Summer | 3.25 | 2.27 | 118.00 |
| Autumn | 6.14 | 4.81 | 239.29 |
| Winter | 8.79 | 5.99 | 402.97 |
| PM2.5 | |||
| Annual | 8.86 | 7.52 | 745.02 |
| Spring | 6.47 | 4.74 | 198.17 |
| Summer | 5.28 | 3.42 | 164.00 |
| Autumn | 9.17 | 7.24 | 400.69 |
| Winter | 13.70 | 9.47 | 745.02 |
| PM10 | |||
| Annual | 10.22 | 8.71 | 861.86 |
| Spring | 7.56 | 5.23 | 210.75 |
| Summer | 6.11 | 3.61 | 177.56 |
| Autumn | 10.46 | 8.31 | 459.24 |
| Winter | 15.82 | 11.27 | 861.86 |
| Parameter | Annual | Spring | Summer | Autumn | Winter |
|---|---|---|---|---|---|
| PM1/PM2.5 | |||||
| Total precipitation (mm) | b = −0.072 | b = 0.162 | b = 0.070 | b = −0.179 | b = −0.029 |
| p = 0.301 | p = 0.451 | p = 0.708 | p = 0.153 | p = 0.775 | |
| Average atmospheric pressure (Mb) | b = −0.334 | b = −0.173 | b = 0.015 | b = −0.465 | b = −0.296 |
| p = <0.0001 | p == 0.513 | p = 0.942 | p = 0.001 | p = 0.014 | |
| Average temperature (°C) | b = −2.125 | b = 0.859 | b = 0.853 | b = −3.933 | b = −3.368 |
| p = 0.142 | p = 0.659 | p = 0.783 | p = 0.163 | p = 0.286 | |
| Maximum temperature (AUT) (°C) | b = 0.488 | b = −0.231 | b = 0.401 | b = 0.432 | b = 0.696 |
| p = 0.085 | p = 0.757 | p = 0.381 | p = 0.223 | p = 0.032 | |
| Average relative humidity (%) | b = −0.540 | b = 0.434 | b = −0.244 | b = −1.294 | b = −1.500 |
| p = 0.290 | p = 0.688 | p = 0.922 | p = 0.268 | p = 0.263 | |
| Average wind speed (m/s) | b = −0.271 | b = 0.200 | b = −0.244 | b = −0.175 | b = −0.103 |
| p = 0.003 | p = 0.680 | p = 0.209 | p = 0.198 | p = 0.580 | |
| PM1/PM10 | |||||
| Total precipitation (mm) | b = −0.102 | b = 0.139 | b = −0.014 | b = −0.195 | b = −0.019 |
| p = 0.134 | p = 0.483 | p = 0.927 | p = 0.100 | p = 0.851 | |
| Average atmospheric pressure (Mb) | b = −0.404 | b = −0.173 | b = −0.074 | b = −0.553 | b = −0.338 |
| p = 0.0001 | p = 0.480 | p = 0.663 | p = <0.0001 | p = 0.006 | |
| Average temperature (°C) | b = −2.322 | b = 1.553 | b = 0.294 | b = −3.968 | b = −3.025 |
| p = 0.100 | p = 0.391 | p = 0.908 | p = 0.137 | p = 0.340 | |
| Maximum temperature (AUT) (°C) | b = 0.858 | b = 0.460 | b = 0.733 | b = 0.729 | b = 0.836 |
| p = 0.002 | p = 0.505 | p = 0.058 | p = 0.031 | p = 0.011 | |
| Average relative humidity (%) | b = −0.354 | b = 1.310 | b = 0.021 | b = −1.257 | b = −1.237 |
| p = 0.476 | p = 0.197 | p = 0.992 | p = 0.254 | p = 0.358 | |
| Average wind speed (m/s) | b = −0.271 | b = 0.000 | b = −0.581 | b = −0.190 | b = −0.073 |
| p = 0.002 | p = 0.999 | p = 0.004 | p = 0.139 | p = 0.696 | |
| PM2.5/PM10 | |||||
| Total precipitation (mm) | b = −0.138 | b = −0.004 | b = −0.197 | b = −0.211 | b = −0.014 |
| p = 0.036 | p = 0.975 | p = 0.222 | p = 0.065 | p = 0.907 | |
| Average atmospheric pressure (Mb) | b = −0.370 | b = −0.179 | b = −0.232 | b = −0.572 | b = −0.271 |
| p = <0.0001 | p = 0.295 | p = 0.195 | p = <0.0001 | p = 0.046 | |
| Average temperature (°C) | b = −1.473 | b = 2.143 | b = −0.385 | b = −1.893 | b = −0.885 |
| p = 0.278 | p = 0.097 | p = 0.883 | p = 0.456 | p = 0.804 | |
| Maximum temperature (AUT) (°C) | b = 1.534 | b = 1.801 | b = 0.941 | b = 1.403 | b = 0.957 |
| p = 0.0001 | p = 0.001 | p = 0.021 | p = <0.0001 | p = 0.010 | |
| Average relative humidity (%) | b = 0.495 | b = 2.580 | b = 0.752 | b = −0.215 | b = 0.140 |
| p = 0.302 | p = 0.001 | p = 0.723 | p = 0.838 | p = 0.926 | |
| Average wind speed (m/s) | b = −0.137 | b = −0.345 | b = −0.244 | b = −0.109 | b = 0.002 |
| p = 0.102 | p = 0.274 | p = 0.209 | p = 0.373 | p = 0.993 | |
Disclaimer/Publisher’s Note: The statements, opinions and data contained in all publications are solely those of the individual author(s) and contributor(s) and not of MDPI and/or the editor(s). MDPI and/or the editor(s) disclaim responsibility for any injury to people or property resulting from any ideas, methods, instructions or products referred to in the content. |
© 2025 by the authors. Licensee MDPI, Basel, Switzerland. This article is an open access article distributed under the terms and conditions of the Creative Commons Attribution (CC BY) license (https://creativecommons.org/licenses/by/4.0/).
Share and Cite
Silveira, G.d.O.; Azevedo, G.M.G.V.d.; Tavella, R.A.; Ramires, P.F.; Brum, R.d.L.; Bonifácio, A.d.S.; Machado, R.A.; Brum, L.W.; Buffarini, R.; Adamatti, D.F.; et al. A Pilot Study with Low-Cost Sensors: Seasonal Variation of Particulate Matter Ratios and Their Relationship with Meteorological Conditions in Rio Grande, Brazil. Climate 2025, 13, 71. https://doi.org/10.3390/cli13040071
Silveira GdO, Azevedo GMGVd, Tavella RA, Ramires PF, Brum RdL, Bonifácio AdS, Machado RA, Brum LW, Buffarini R, Adamatti DF, et al. A Pilot Study with Low-Cost Sensors: Seasonal Variation of Particulate Matter Ratios and Their Relationship with Meteorological Conditions in Rio Grande, Brazil. Climate. 2025; 13(4):71. https://doi.org/10.3390/cli13040071
Chicago/Turabian StyleSilveira, Gustavo de Oliveira, Gabriella Mello Gomes Vieira de Azevedo, Ronan Adler Tavella, Paula Florencio Ramires, Rodrigo de Lima Brum, Alicia da Silva Bonifácio, Ricardo Arend Machado, Letícia Willrich Brum, Romina Buffarini, Diana Francisca Adamatti, and et al. 2025. "A Pilot Study with Low-Cost Sensors: Seasonal Variation of Particulate Matter Ratios and Their Relationship with Meteorological Conditions in Rio Grande, Brazil" Climate 13, no. 4: 71. https://doi.org/10.3390/cli13040071
APA StyleSilveira, G. d. O., Azevedo, G. M. G. V. d., Tavella, R. A., Ramires, P. F., Brum, R. d. L., Bonifácio, A. d. S., Machado, R. A., Brum, L. W., Buffarini, R., Adamatti, D. F., & da Silva Júnior, F. M. R. (2025). A Pilot Study with Low-Cost Sensors: Seasonal Variation of Particulate Matter Ratios and Their Relationship with Meteorological Conditions in Rio Grande, Brazil. Climate, 13(4), 71. https://doi.org/10.3390/cli13040071