
Flood Damage Risk Mapping Along the River Niger: Ten Benefits of a Participated Approach

 ,
,  ,
,  ,
,  ,
,  , ,
, ,  , , and
Abstract
:1. Introduction
2. Materials and Methods
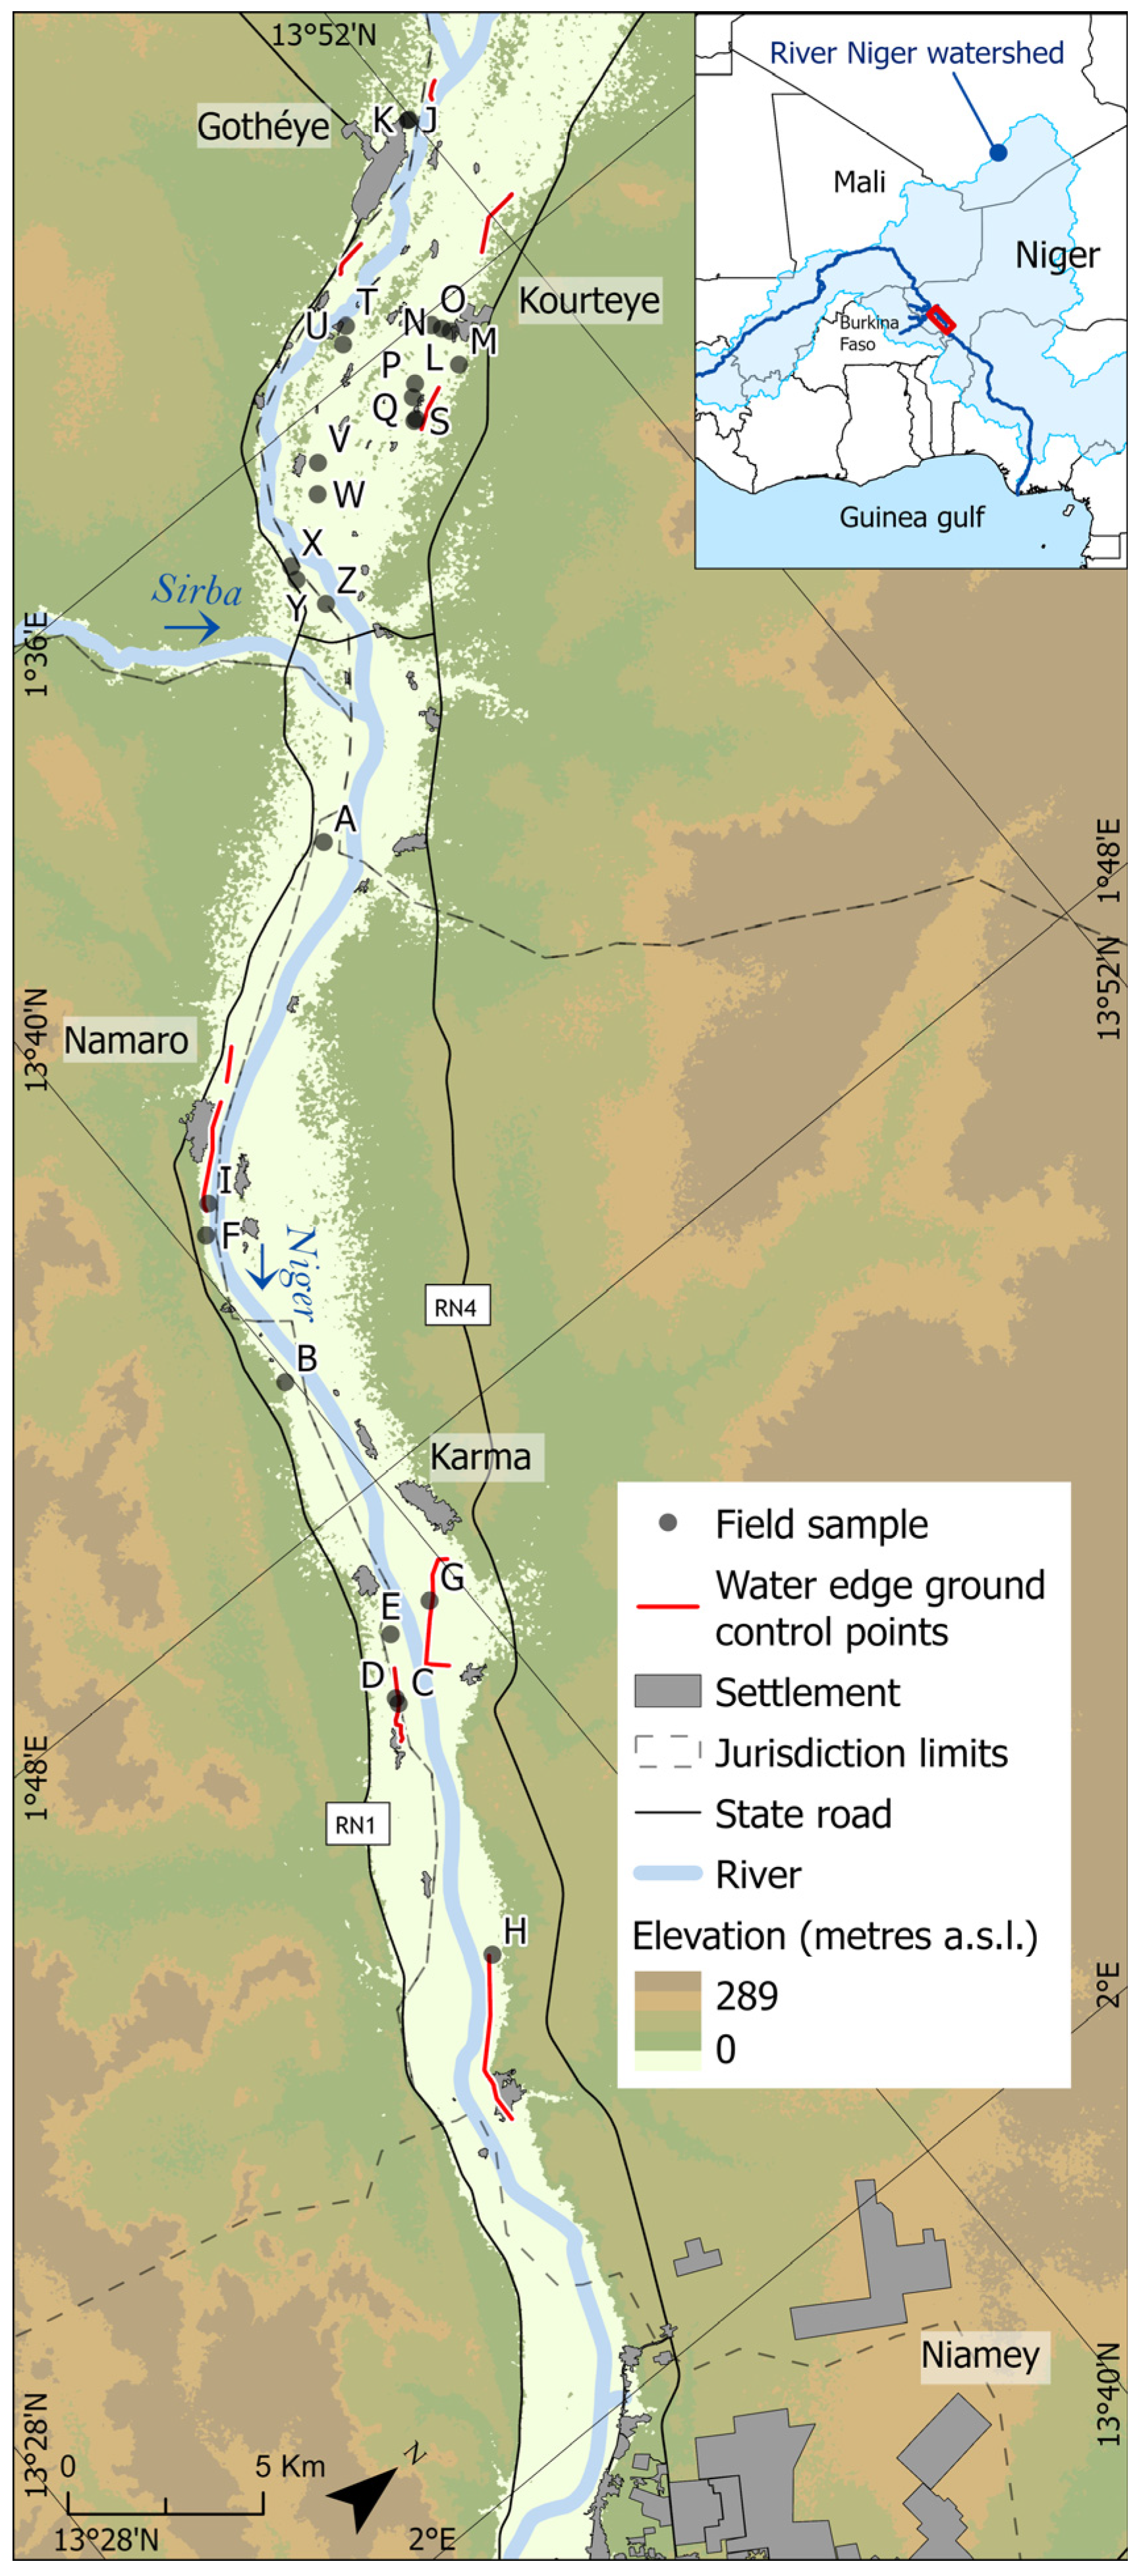
2.1. Study Area
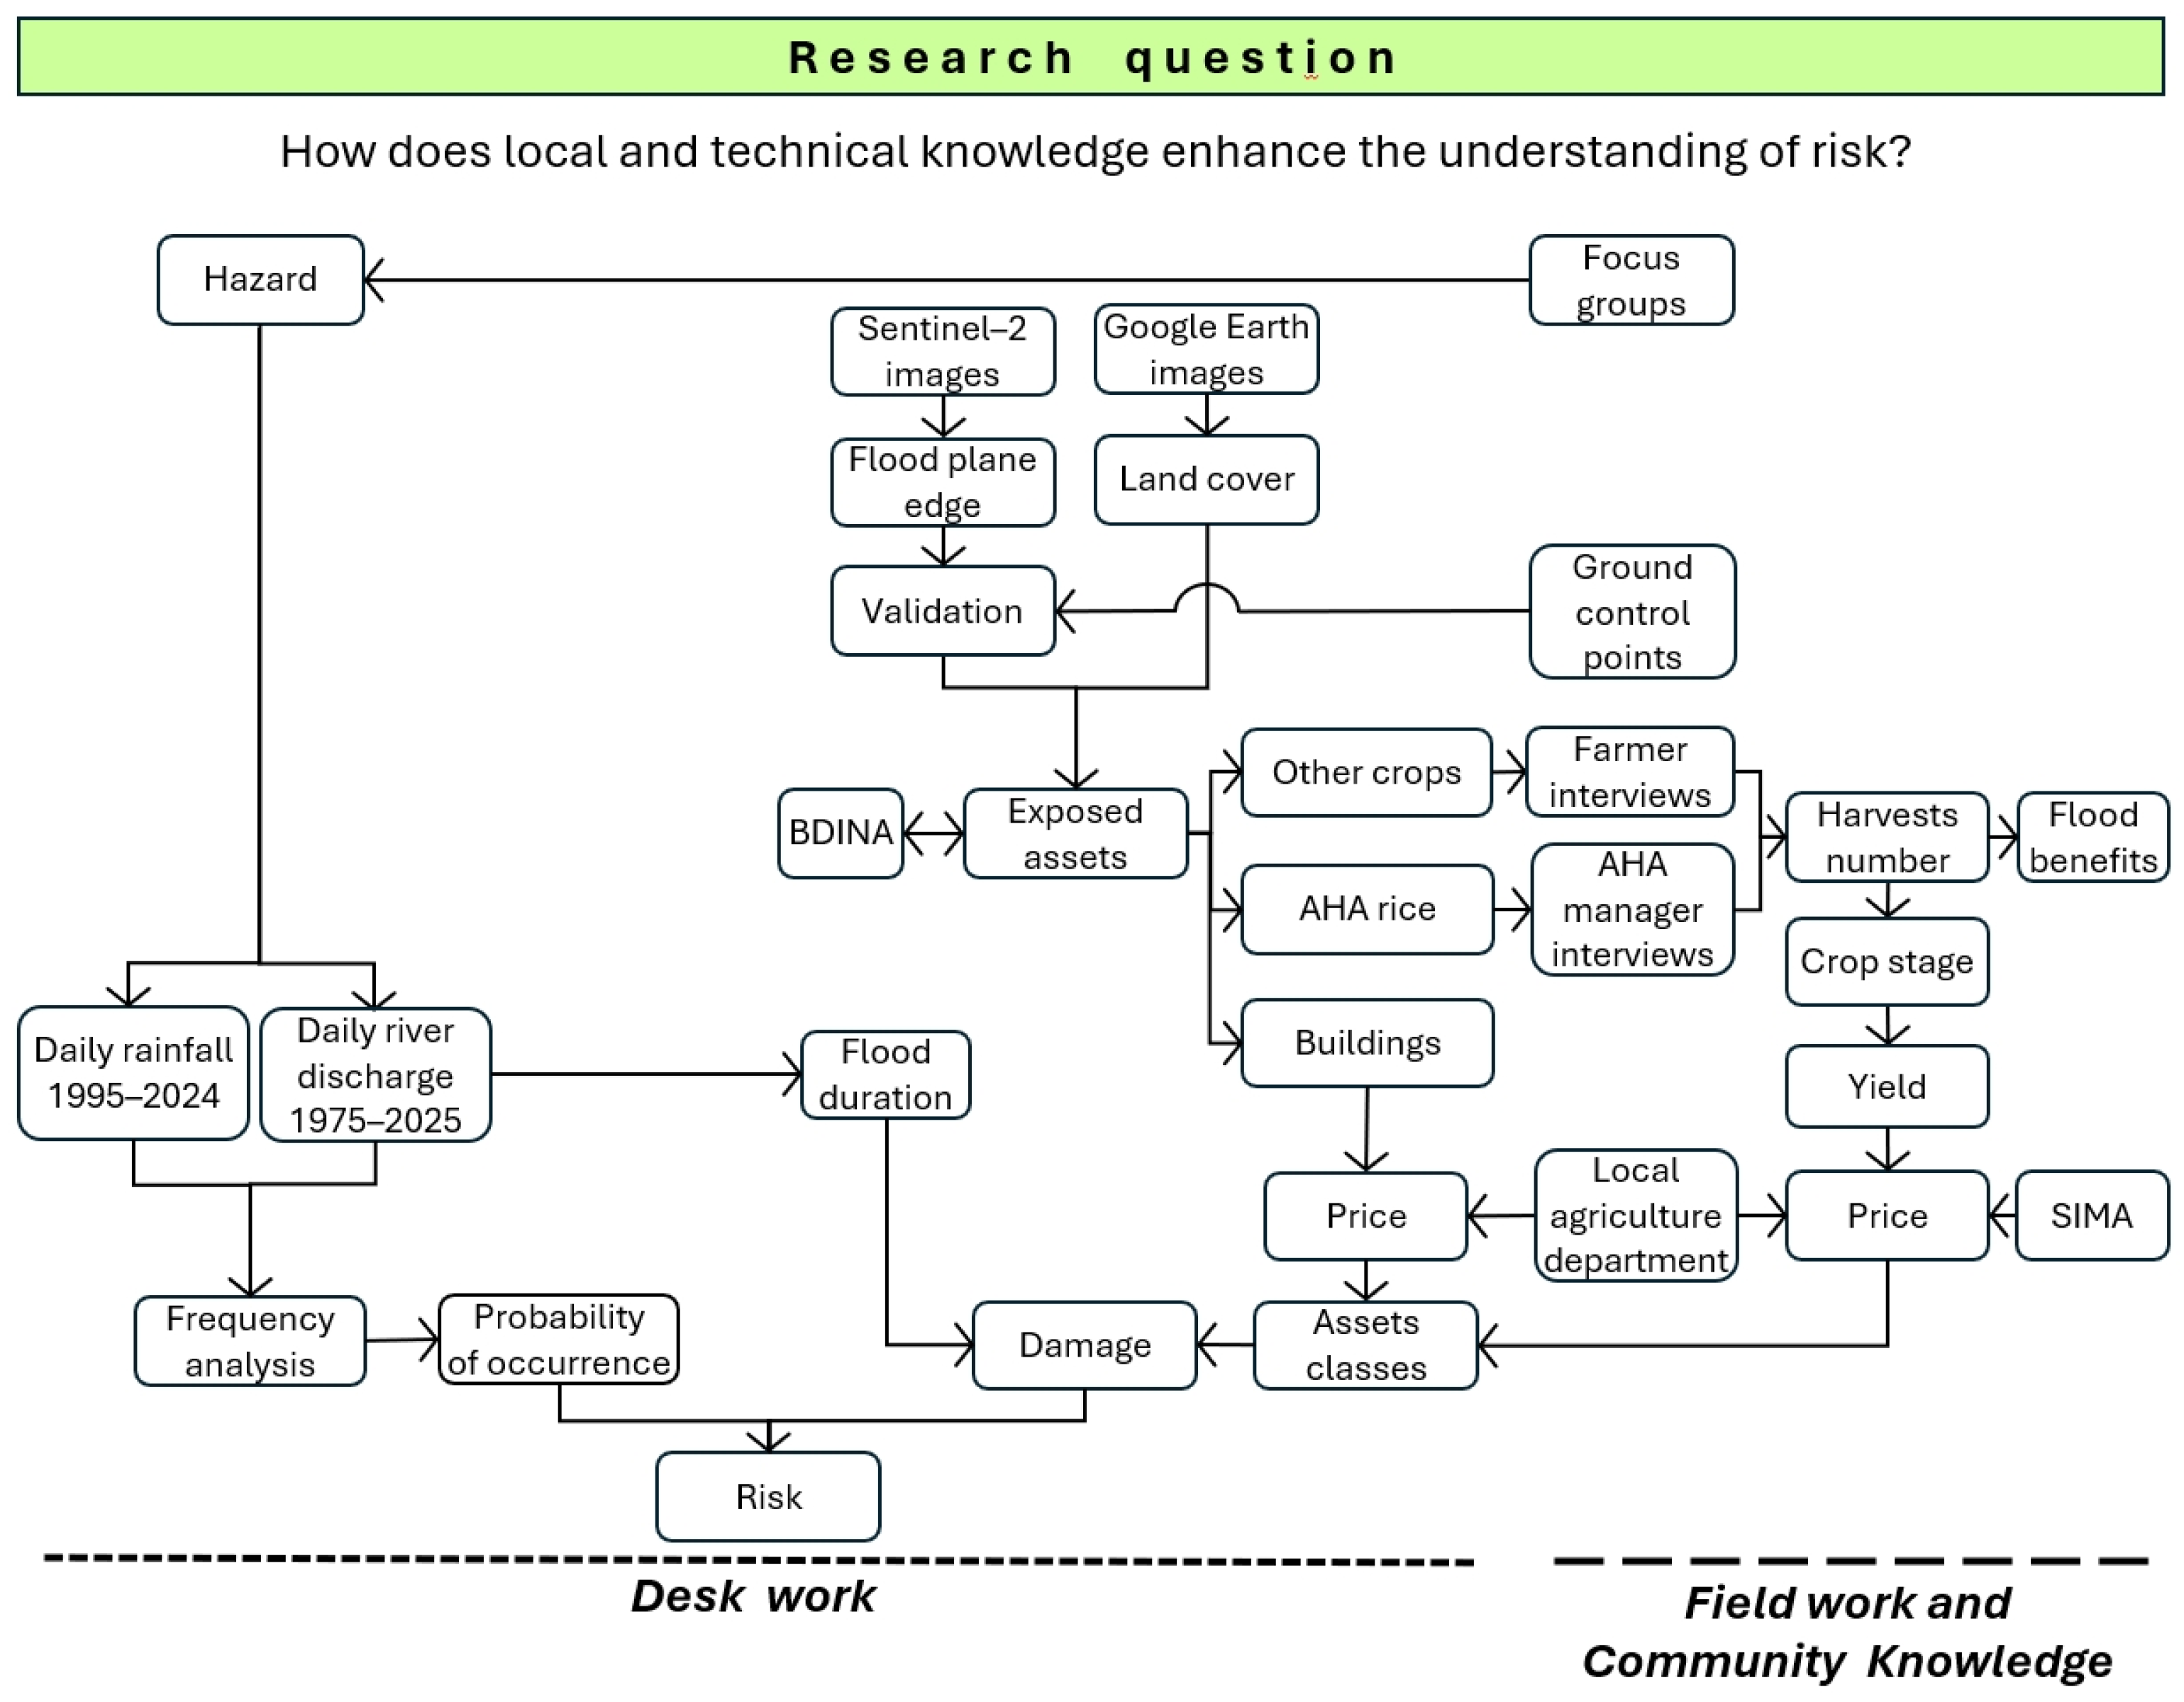
2.2. Conceptual Framework
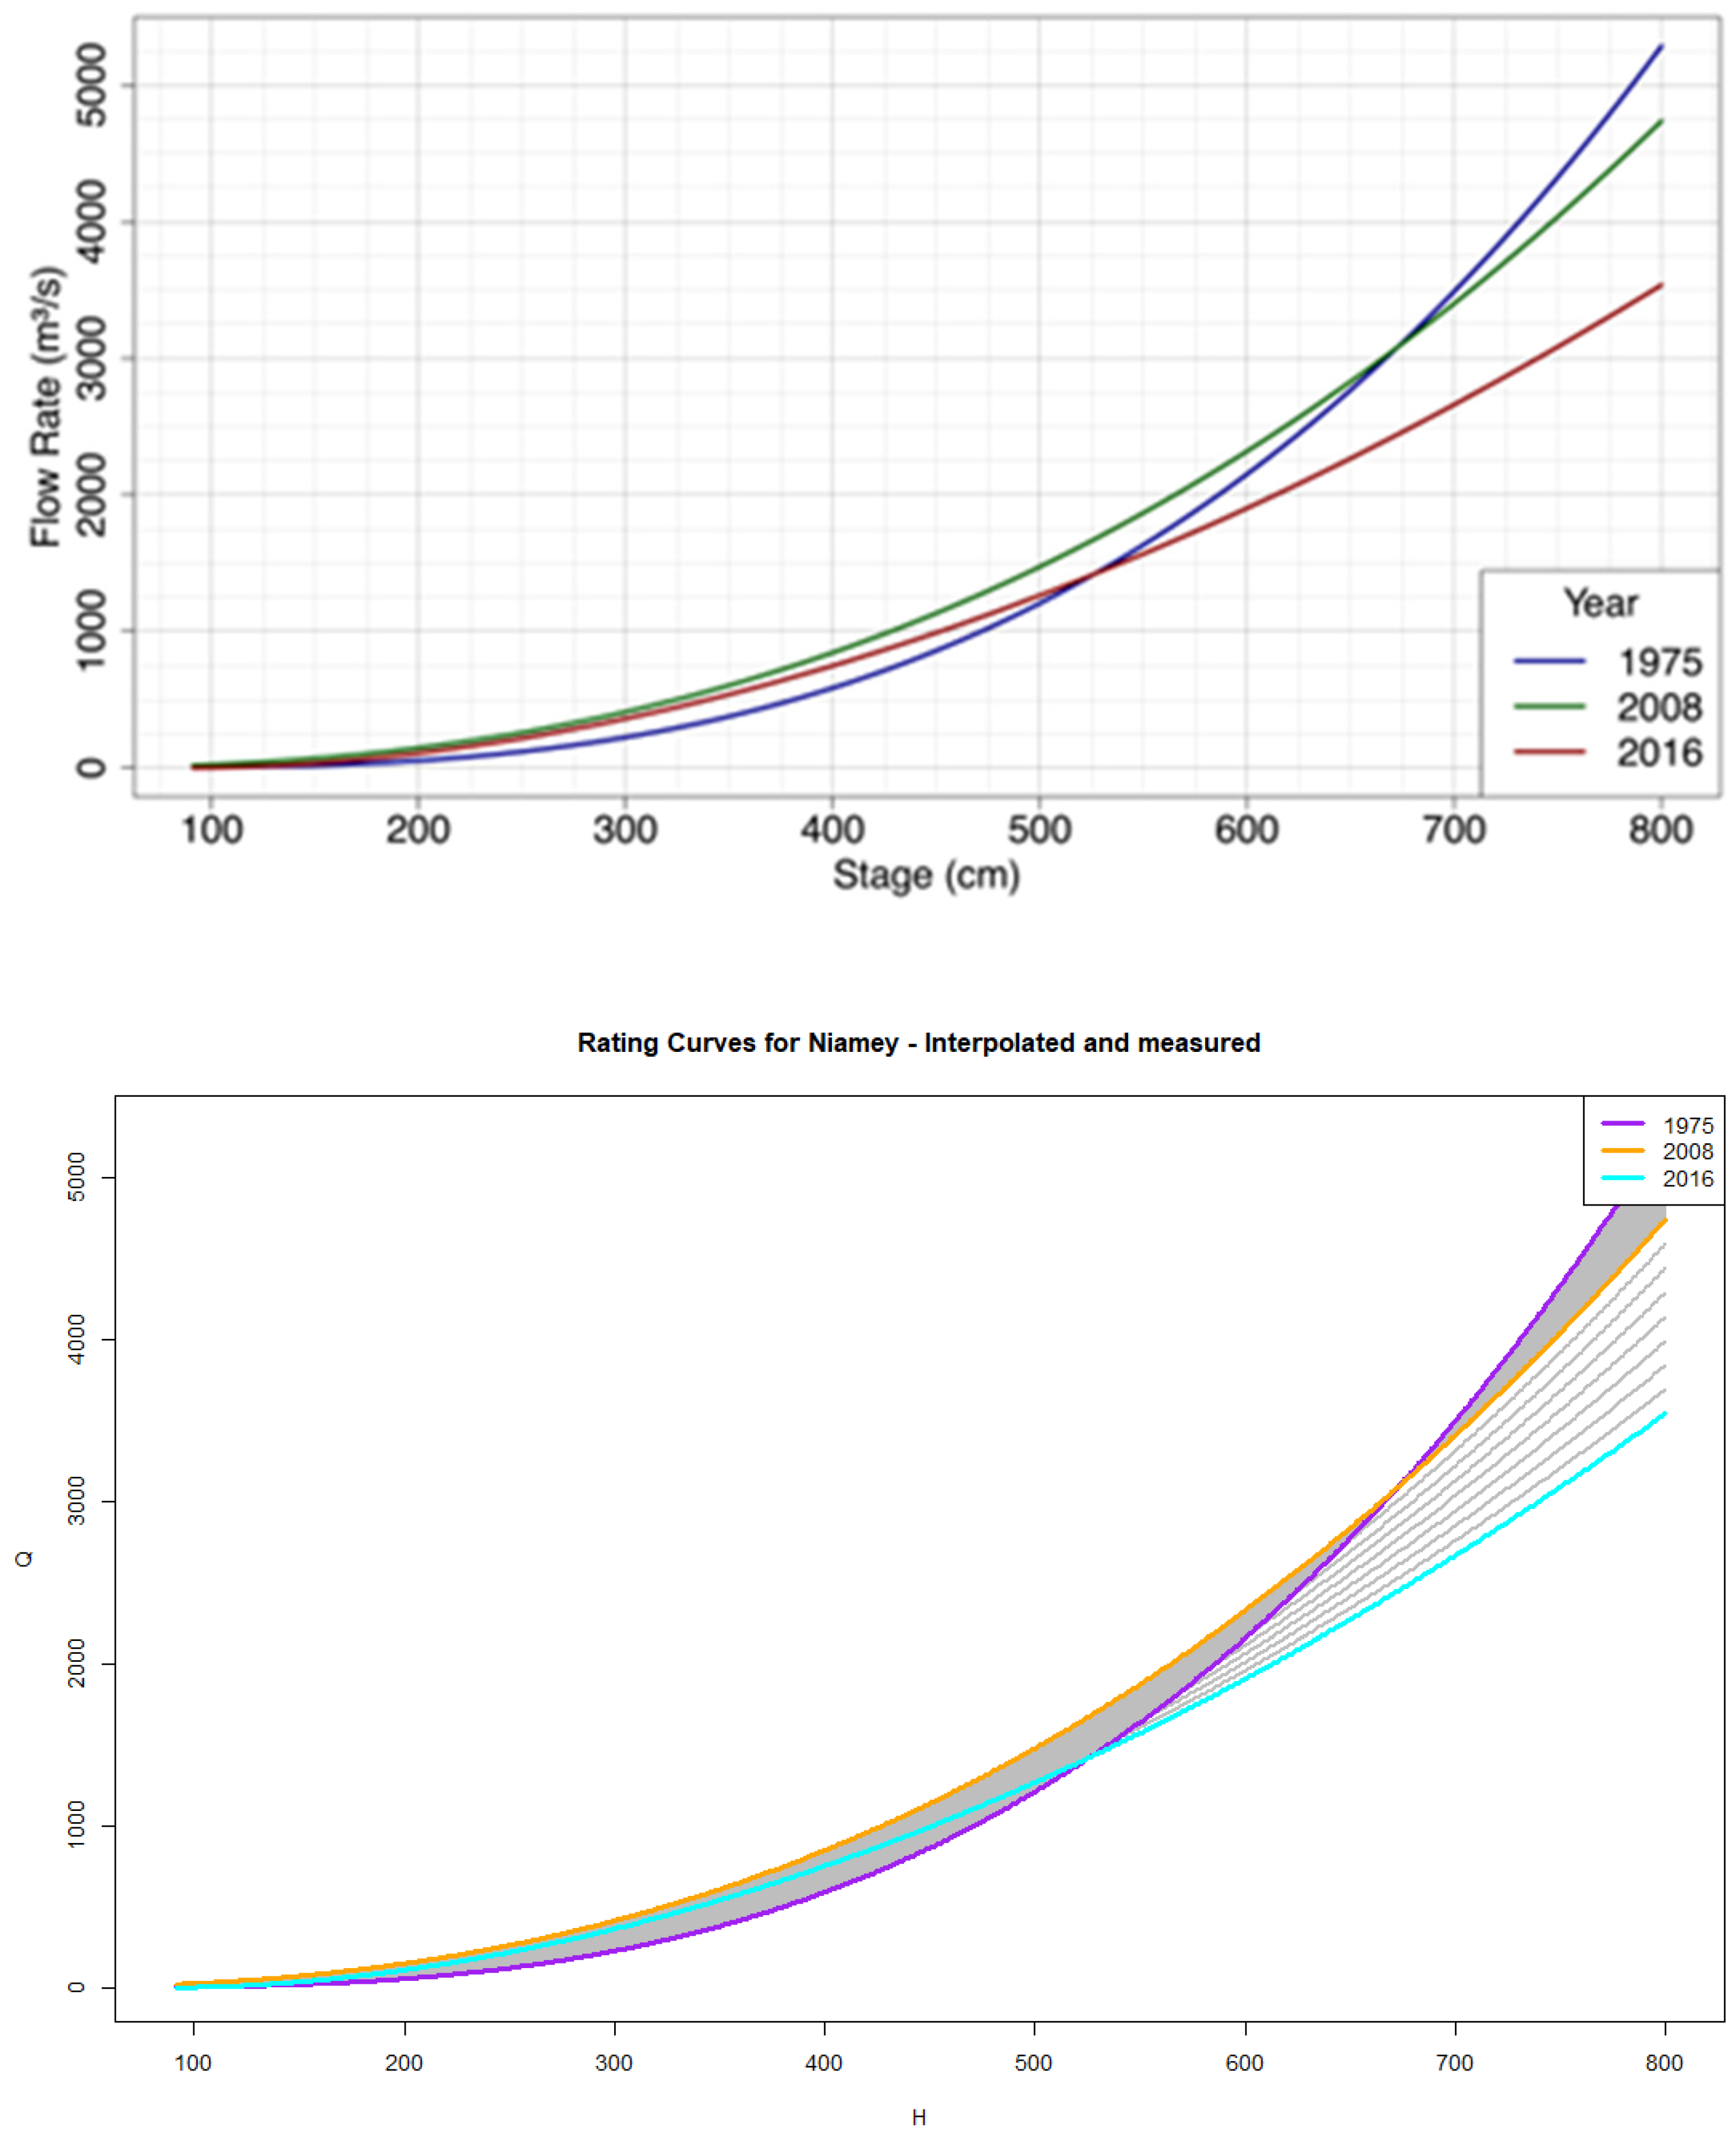
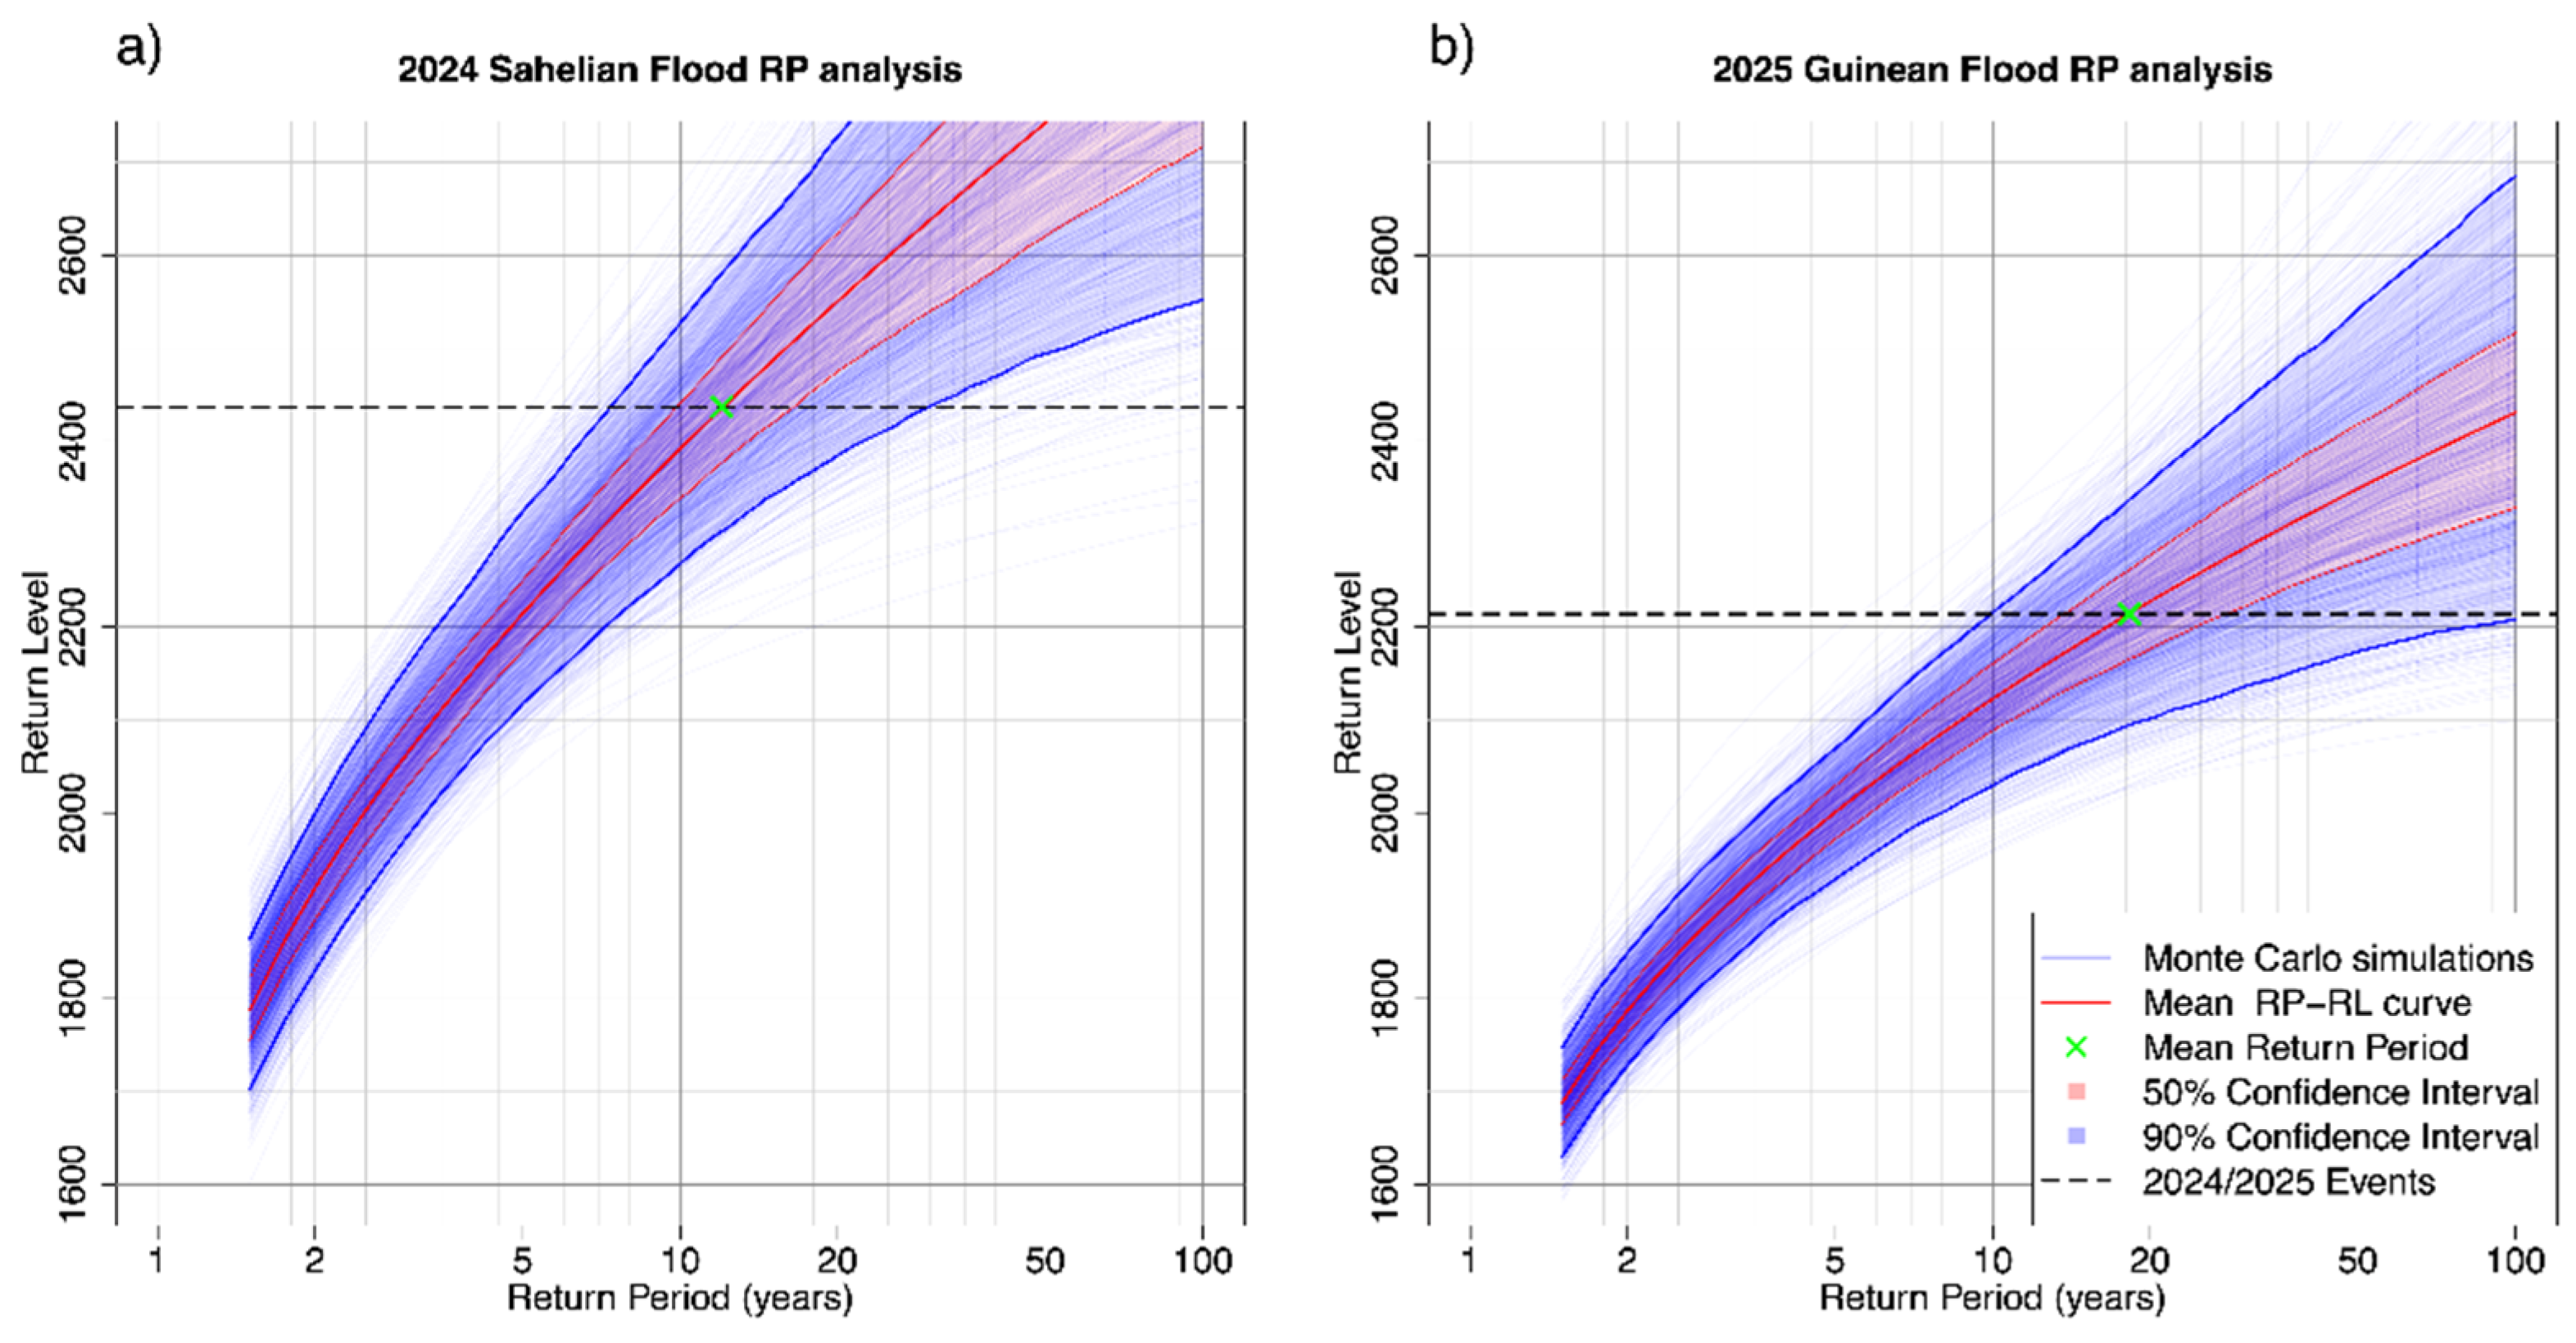
2.3. Hazard
2.4. Damage
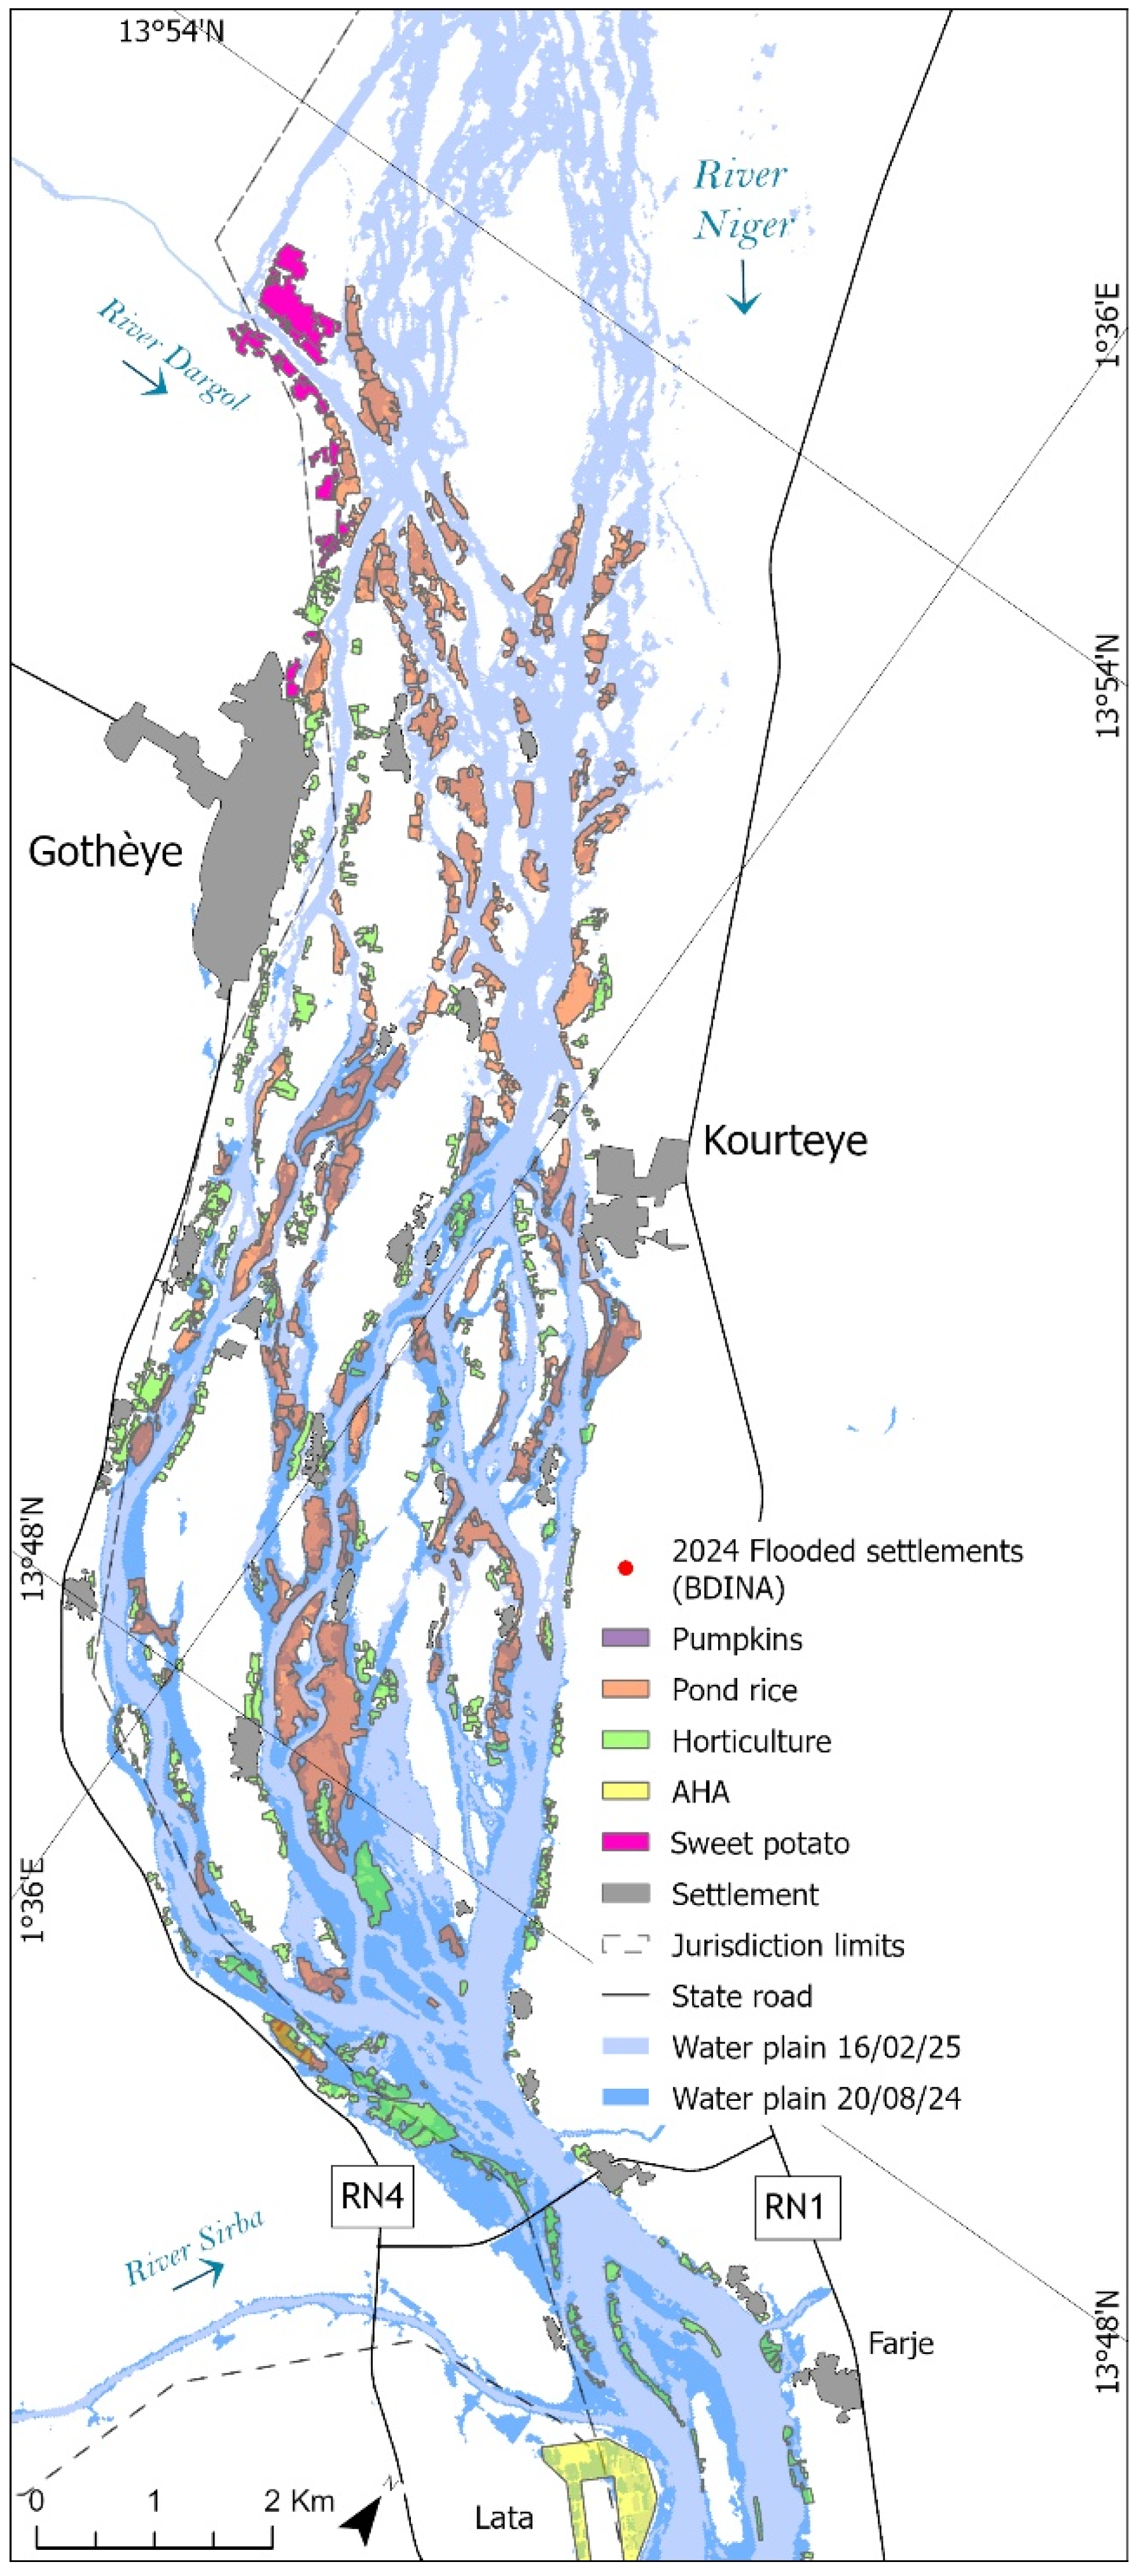
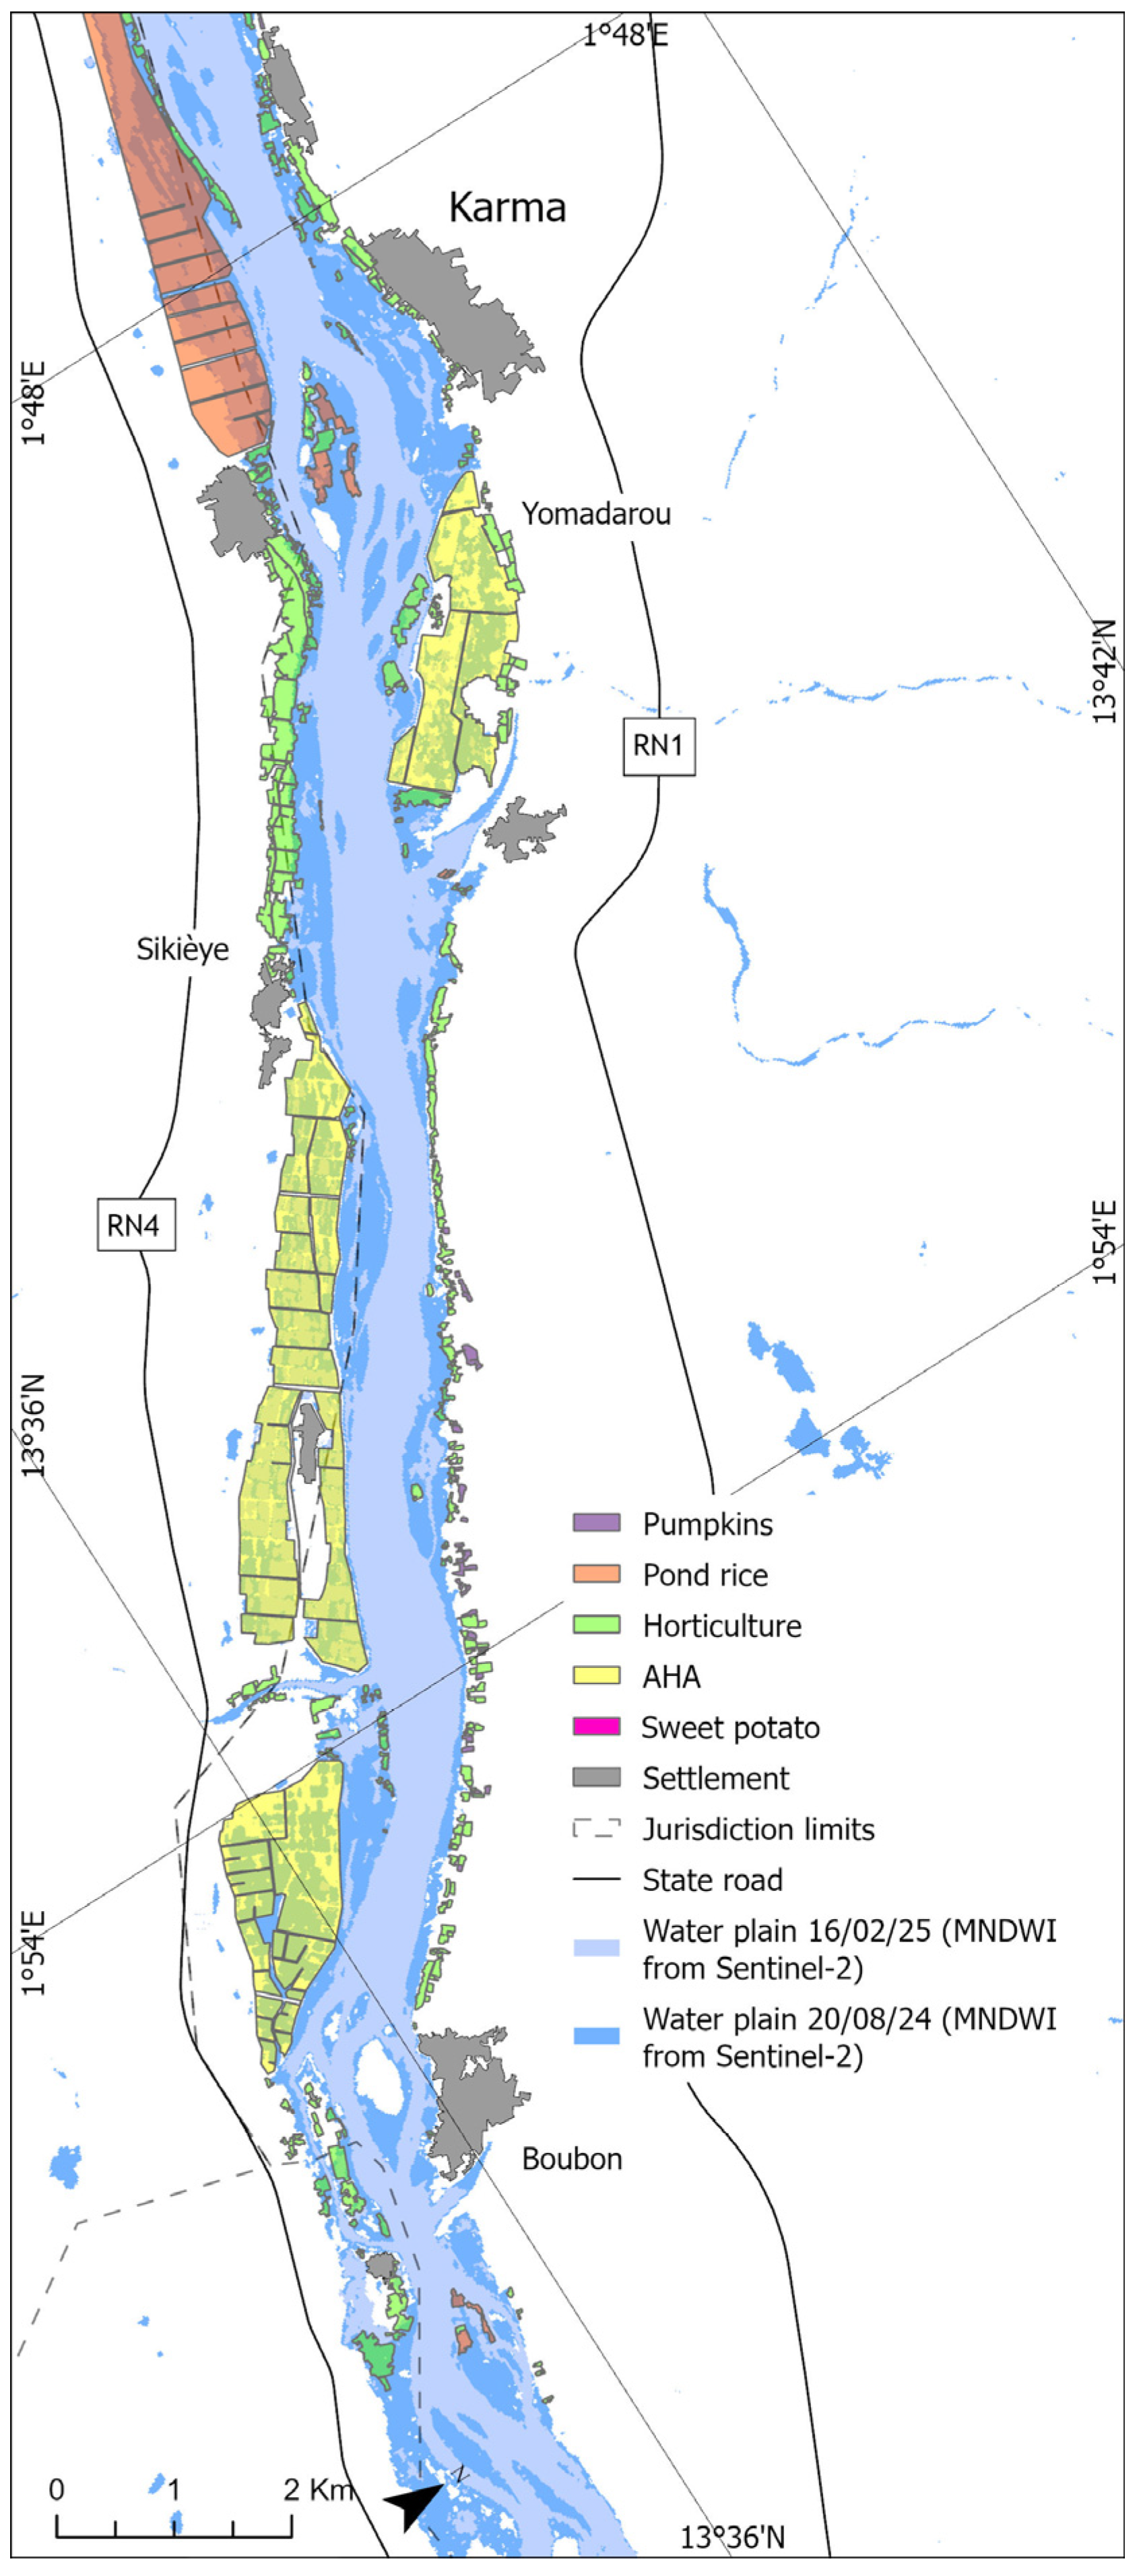
2.4.1. Flood Plain
2.4.2. Exposure
2.4.3. Map Validation
2.4.4. Assets Value
2.5. Risk
3. Results
3.1. Engagement
3.2. Hazard Identification
3.2.1. Fluvial Flood
3.2.2. Pluvial Flood
3.3. Exposed Assets
3.4. Exposure Map Validation
3.5. Assets Spatiotemporal Permanence
3.6. Damage
3.7. Flood Benefits
3.8. Risk
3.9. Risk Level Interpretation
4. Discussion
- (i)
- Early stakeholder participation. Community participation occurs from the methodology definition stage. Communities are not involved as sensors collecting data [86] but for their ability to interpret the observed dynamics and validate the results. This early involvement has implications for the ownership of the mapping, its updating, and future monitoring of local floods.
- (ii)
- Hazard. Heavy rainfall generating flash floods along the minor tributaries of the Niger River breaks the banks of the AHAs, floods the fields, and leads to backwater that cannot drain naturally into the river when it is in flood. Unlike the literature, risk mapping should consider the pluvial and fluvial hazards. The probability of occurrence of the rainfall is about 40%, that of local flood is 8%, and for the Guinean flood is 5.5%. Risk mapping in the Global South rarely expresses hazard as a statistical probability of occurrence [38,46]. The complexity of the processes, as non-stationarities [70,87] or multi-hazards [88], means that risk must be considered qualitatively. This knowledge has three implications. First, the exceptional flood of August 2024 may recur more times in the lifetime of small farmers cultivating along the river. Second, risk reduction measures should consider the reduction of flash floods along the minor tributaries of the Niger River and strengthen the embankments of upstream AHAs in addition to those along the river. Third, a more comprehensive large-scale risk analysis should be developed [89] to link flood risk scenarios with warning thresholds and enable impact-based flood forecasting.
- (iii)
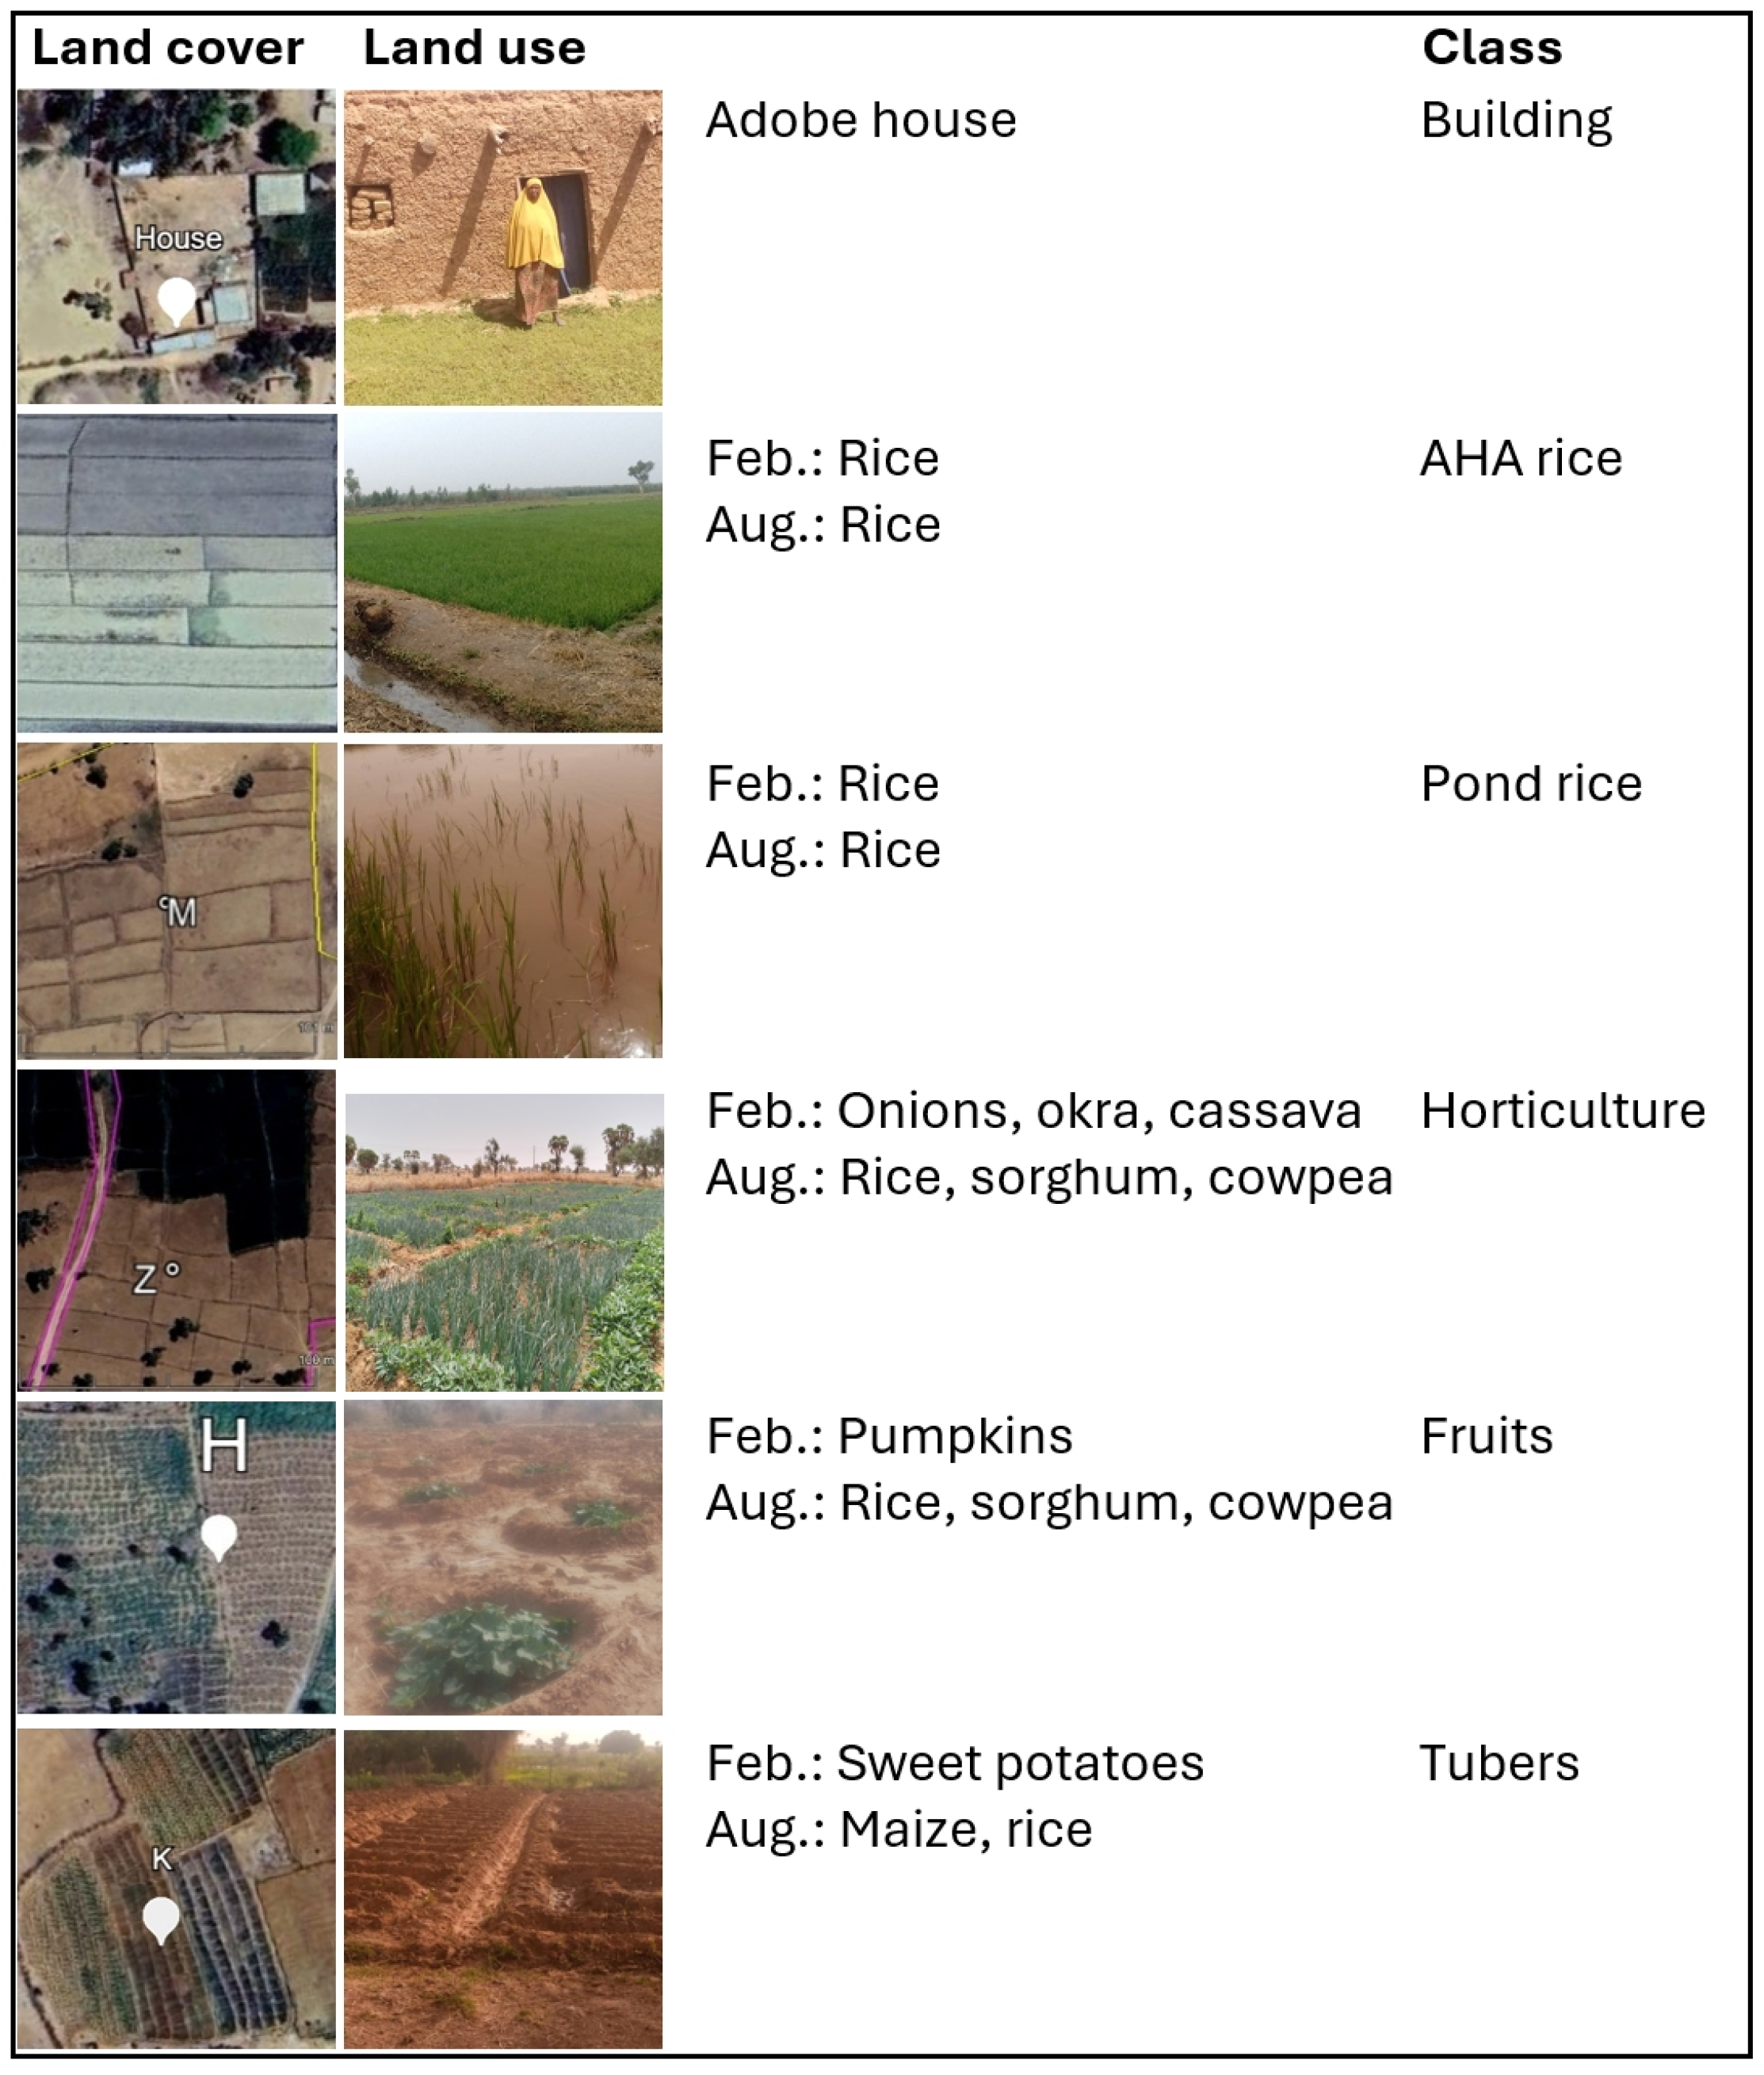
- Assets. Despite literature expectations [90,91], volunteered geographic information contributed to risk mapping with AHAs limits only, corresponding to 10% of the exposed area. Quantitative risk mapping requires more information for each asset (Table A6). The identification of six classes of assets by morphology and value provides information that was previously non-existent in Niger [92]. This information implies the possibility of appreciating the potential damage of the flood to horticulture, which constitutes an essential livelihood for riparian populations.
- (iv)
- Damage complexity. The division of assets into six classes and the assignment of weighted average values in the case of multi-crops and average values in sale prices over the year overcomes this complexity. The estimate of a single cereal crop (rice) prevails in the literature [93]. The implication is a more accurate risk mapping since the value of different asset classes ranges from 1240 EUR/ha (rice) to 8200 EUR/ha on average (onions, okra, and cassava).
- (v)
- Validation. The inundation area at the flood peak in mid-February 2025 is smaller than that measured on the ground. The implication is that damage and risk levels are underestimated. The literature rarely validated the flooded area measured by satellite imagery with ground control. Usually, the exposure map was validated by comparison with previously inundated sites as they appear from historical satellite imagery [49] or local datasets when available [42]. The significant discrepancy between the inundated areas in August 2024, according to BDINA and our exposure map, led us to prefer ground control points at the edge of the flood plain. However, we observed a significant deviation in the water edge according to the ground control points and satellite images in 17% of the points. This gap has a twofold explanation. First, the satellite images have a resolution of 20 m because the green band to calculate MNDWI is resampled to match the coarser resolution of the shortwave infrared band (Table 1). Second, the areas where the largest deviations are found are cultivated with rice or onions, whose vegetative stage largely obscures the water below.
- (vi)
- Spatio-temporal permanence of assets. The fields cultivated in 2024 are stable over time (Figure 11). This character has two implications. The first concerns the validity of the flood risk map over time. To keep the flood risk map current, it will be sufficient to ascertain the crops grown and their selling prices on sample fields. The second implication concerns risk reduction. The omnipresence of irrigated crops along the river and their stability over time affect the opportunity for farmers in the flood zone to move to safer sites. With few exceptions [96], exposure temporality has been poorly investigated.
- (vii)
- Flood benefits. We found no benefits from flooding at any of the 24 sites visited. No flood-recession crops as developed in Tanzania [97], along the Senegal River [98], and in the Dosso region in Niger [99] were found. Neither are wet-season fisheries developed as in the Philippines [100] nor fuel savings for irrigation.
- (viii)
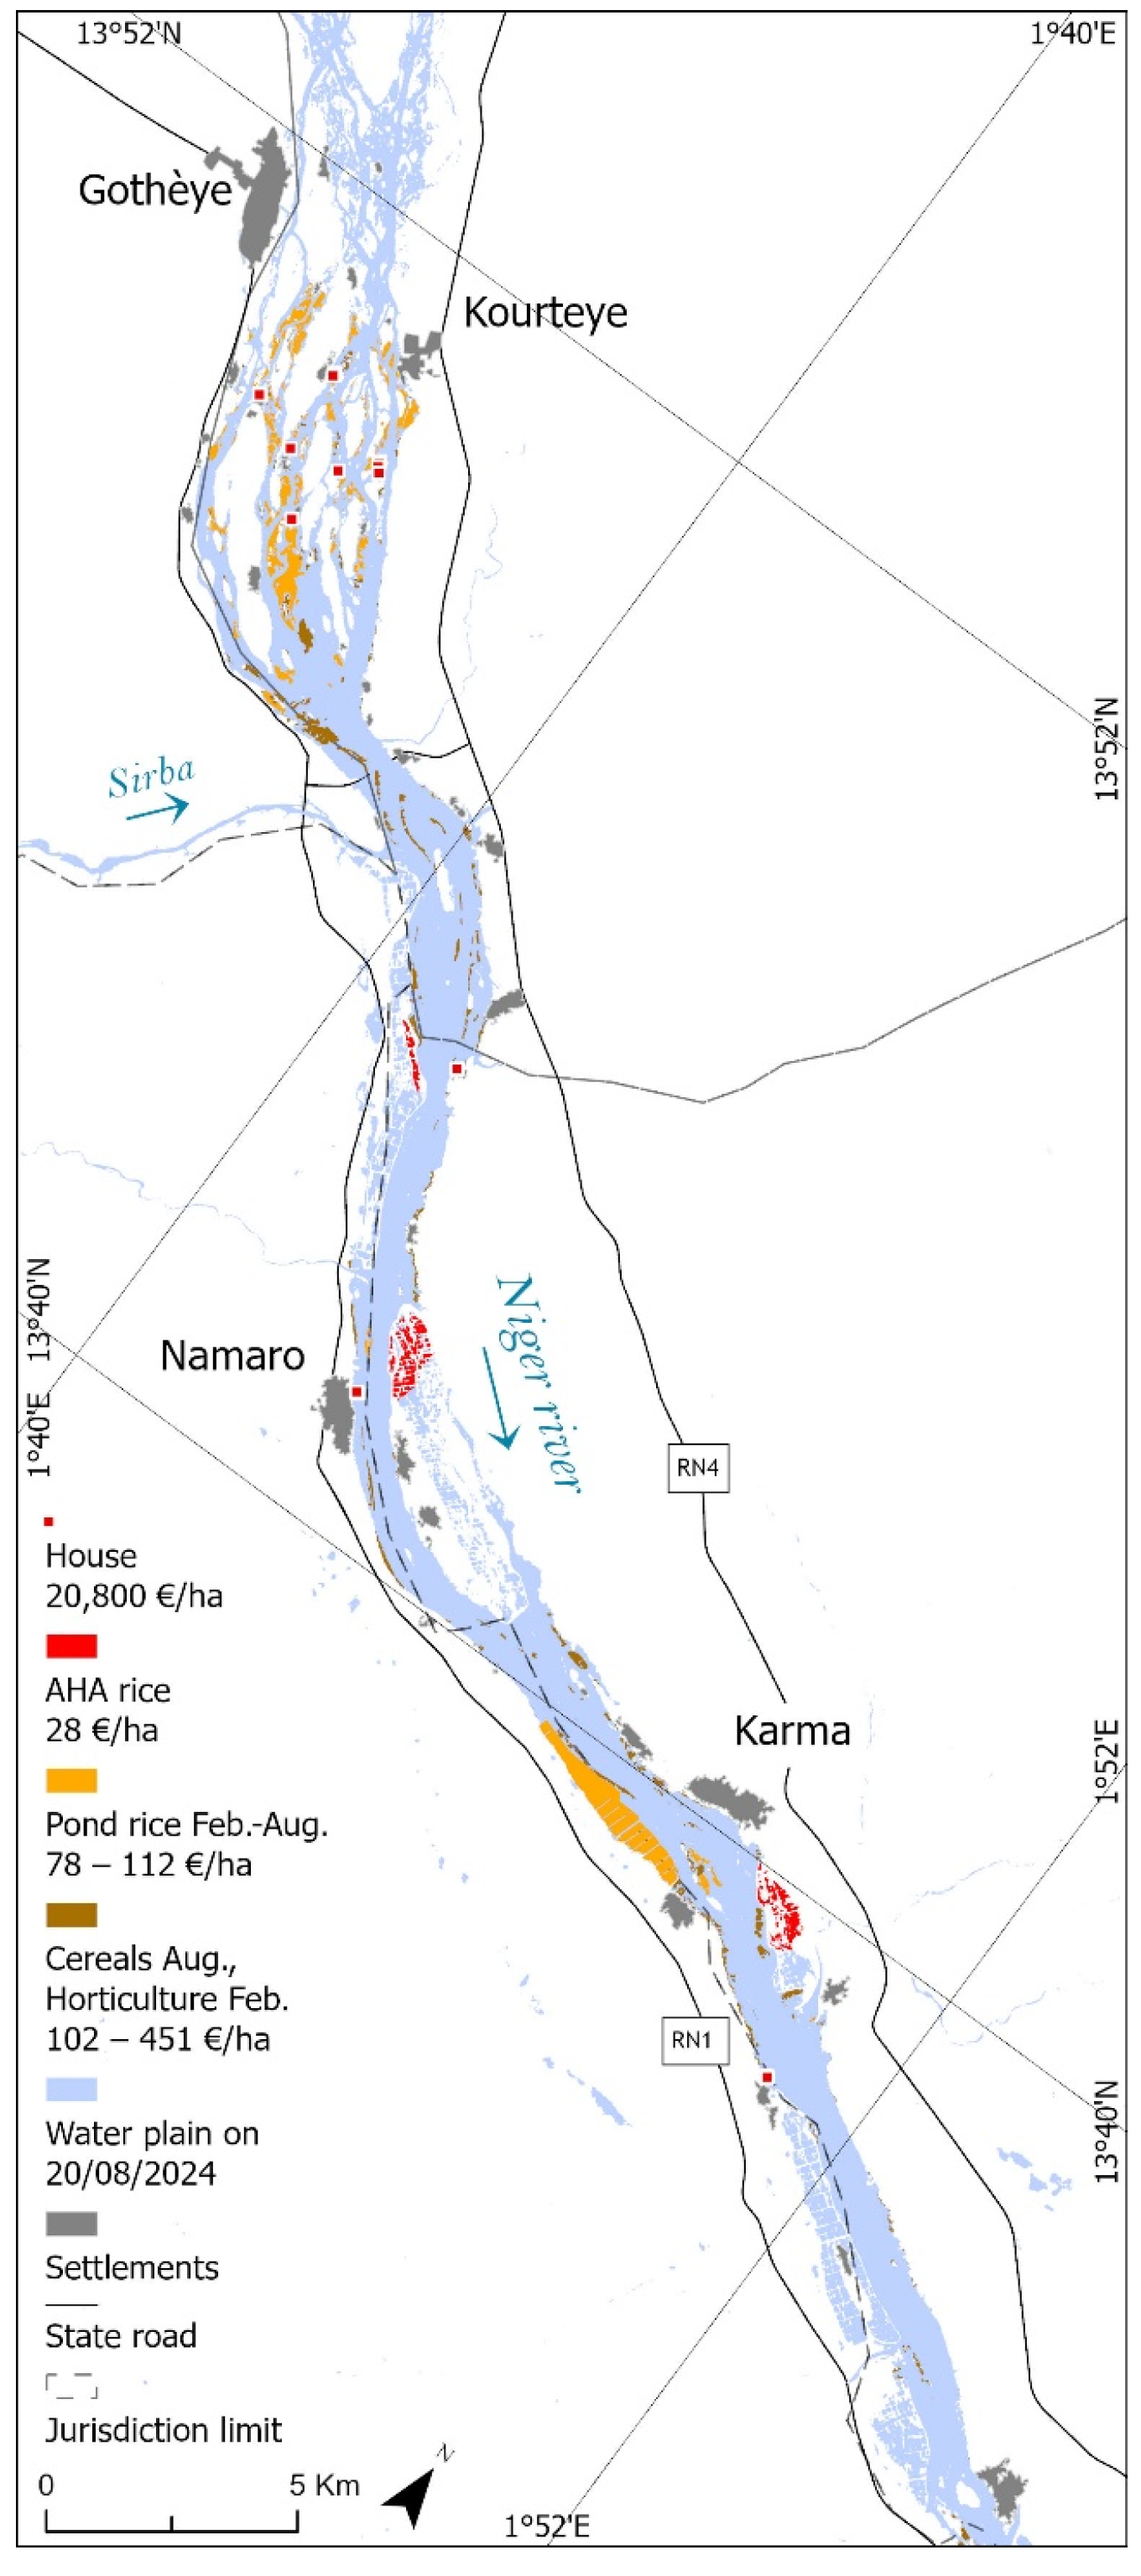
- Risk spatialization. Horticulture is at the highest risk. This result advances knowledge about assets limited to one crop until now [93]. However, comparisons with the literature remain difficult because crops and other rural assets are site-specific. Sometimes, buildings are at the highest risk [34]. At other times, crops are at the highest risk [45]. The numerous settlements along the river and on river islands are marginally at risk. However, the remaining settlements are far from the flooded area. The concentration of risk is in the vicinity of Niamey and on the river islands of Kourteye. These results stand out in the literature on risk mapping, which is rarely practiced with the details proposed in this study. It seldom considers the level of risk by administrative jurisdiction, nor does it locate hot spots. The implication of detailed mapping deals with risk prevention and reduction. This implies that prevention (step back and water pumping) can be directed toward locations where the concentration of damage is most remarkable, such as Sikieye, Kourteye, and Baugawi Zarma.
- (ix)
- Environmental justice. The estimated flood damage is just over EUR two million. According to the flood type, this represents 16% to 29% of the value of all irrigated agriculture in the zone. However, it may have intergenerational and intergroup implications [101] and push small farmers with only their field flooded into greater insecurity [102].
- (x)
- Flood risk scenarios for early warning. Risk maps could be integrated with hydraulic modelling to produce flood risk scenarios [103] linked to flood observations (hydrometers and scales) and hydrological forecasts upstream of the studied area within an early warning system. This will allow forecasting potential risks and damage downstream for each flood level, according to the approach already used for the Sirba local flood early warning system [104].
- Install an automatic hydrographic radar station upstream of the Sirba-Niger confluence to intercept the local flood fed by the Dargol River in advance.
- Establish a collaborative protocol with the four riparian municipalities to verify the floodplain edge locally during local and Guinean floods, the crops grown in the sample fields, and feed the exposed assets scenarios accordingly.
- Automate the visualization of potential damage for the benefit of exposed communities and the early flood warning system.
- Extend risk mapping upstream and use Sentinel-1 SAR imagery to overcome the obstacle of cloud cover, which prevents viewing areas inundated by the local flood.
5. Conclusions
Author Contributions
Funding
Data Availability Statement
Acknowledgments
Conflicts of Interest
Appendix A

| Region Country | Images | Flooded Area km2 | Flood Focus | Reference |
|---|---|---|---|---|
| Gowaingat BG | Sentinel-1/2 | Extent, LC | [10] | |
| Nasia GH | Landsat | 670 | Extent, LC | [11] |
| White Volta GH | Sentinel-1 SAR | 800 | Extent, Po, LC | [12] |
| Gaggar river IN | Sentinel-1 SAR | 123 | Extent, LC | [13] |
| Kendrapara IN | RADARSAT SAR | 346 | Extent, duration | [14] |
| Purba Medinipur IN | Sentinel-1 | 240 | Extent, LC | [15] |
| Ganga-Brhama IN | 397,707 | Extent, LC | [16] | |
| Nilwala LK | Sentinel | 109 | Extent, LC | [17] |
| Nsanje MW | Sentinel 1 SAR | 90 | Extent | [18] |
| Niger-Benoue NG | MODIS | 169,453 | Extent, Po | [19] |
| Niger-Benoue NG | Sentinel-1 SAR | 84 | Extent, Cr | [20] |
| Niger delta ML | Landsat | 20,000 | Extent | [21] |
| Caprivi NA | Envisat/ASAR | 720 | Extent | [22] |
| Cagayan PH | Sentinel-1 | 551 | Extent, Cr, Po | [23] |
| Sindh, PK | Sentinel-1 SAR | 7596 | Extent, LC | [24] |
| Dera Ghazi Khan PK | Landsat | 1462 | Extent | [25] |
| Multan PK | Landsat-8 | 1033 | Extent, LC | [26] |
| SS | Sentinel-1/2, PlanetScope | 8649 | Extent, cr, bu rds | [27] |
| Central VN | TerraSAR-X | 326 | Extent, Cr, Rd, Ut | [28] |
| Mekong VN | Sentinel-1 SAR | 101,000 | Extent | [29] |
| Region Country | Risk Area km2 | Community Participation | Risk Determinants | Hazard Probability | Risk Expression | Reference |
|---|---|---|---|---|---|---|
| El-Ham AL | None | HV | Indicators | Qualitative | [32] | |
| Rangpur BD | - | None | HV | Indicators | Qualitative | [33] |
| Kalapara BD | 51 | None | HD | unk | Quantitative | [34] |
| Southwest BD | - | None | HV | Flood depth | Qualitative | [35] |
| Niger valley BJ | 9118 | Exposure | HEV | Indicators | Qualitative | [36] |
| Adigrat ET | - | None | HV | Indicators | Qualitative | [37] |
| Edamo ET | 161 | Flooded zones | HV | Log-Pearson3 | Qualitative | [38] |
| Kobo ET | - | Flood depth | HV | Gumbel | Qualitative | [39] |
| Moustiques river HT | 222 | None | HV | Unspecified | Qualitative | [40] |
| Brahmaputra IN | 109 | HV interview | HV | Indicators | Qualitative | [41] |
| Coochbehar IN | 3388 | None | HV | Indicators | Qualitative | [42] |
| Navsari IN | 2211 | V survey | HV | Weibull recurr. | Qualitative | [43] |
| Narmada IN | 99 | None | HV | Indicators | Qualitative | [44] |
| Kashmir IN | 581 | None | HV | Indicators | Qualitative | [45] |
| Kosi River IN | - | None | LC, P | Gumbel | Qualitative | [46] |
| Kosi River IN | 1384 | None | Indicators | Qualitative | [47] | |
| Nagaon IN | 740 | None | HV | Flood frequency | Qualitative | [48] |
| Rel River IN | 442 | None | HV | no | Qualitative | [49] |
| Tapi river IN | 1463 | None | HV | Indicators | Qualitative | [50] |
| Damansara MY | 117 | None | HV | Indicators | Qualitative | [51] |
| Hadejia river NG | 30,569 | Flood factors, history, validation | HV | Indicators | Qualitative | [52] |
| Santa Fe PH | 12 | None | EV | Indicators | Qualitative | [53] |
| Mono river TG | - | None | HEVC | Indicators | Qualitative | [54] |
| Mekong VN | 3571 | None | HV | Flood depth | Qualitative | [55] |
| Quang Tho VN | - | V | HEV | Indicator | Qualitative | [56] |
| Quang Binh VN | 8065 | None | HV | Unspecified | Qualitative | [57] |
| Quang Binh VN | None | HD | Unspecified | Quantitative | [28] |
| Question | |
|---|---|
| 1 | Account of the August 2024 flood (date, type, previous day’s rainfall, recent rainfall trends, frequency of flooding, extent of flooded areas, threshold of rainfall beginning to cause damage, its trend over time, rainfall dynamics during the flood, how the alert was received, community reaction to the alert, procedure to be followed in the event of an alert, measures put in place, support received after the flood |
| 2 | Flood damage (quantification, quantification methods, quantifying body, damage, intangible damage, reason for damage to buildings, replacement costs of buildings, unrepaired damage) |
| 3 | Potential measures to cope with flooding (materialization of flood zones, presence of a civil protection officer, most crucial prevention measure implemented, date of implementation, performance of the measure during the flood, further measures to be implemented, measures in the local development plan, speed and direction of the expansion of the settlement |
| Question | |
|---|---|
| 1 | Designation of irrigation perimeter |
| 2 | Geographical coordinates of the perimeter |
| 3 | Photos of the perimeter |
| 4 | Year of perimeter creation |
| 5 | Area |
| 6 | Cultivated area in February 2025 |
| 7 | Number of fields |
| 8 | Number of farmers |
| 9 | Type of crop |
| 10 | Crop stage as at 20 August 2024 |
| 11 | Crop stage in mid-February 2025 |
| 12 | Crop yield T/ha |
| 13 | Crop use |
| 14 | Sale market |
| 15 | Selling price of each crop EUR/100 kg |
| 16 | Reason for flooding |
| 17 | Lost production (T or EUR) following the flood of 20 August 2024 |
| 18 | Production lost after the February 2025 flood |
| 19 | Measures for preventing future damage |
| 20 | Cost of recent similar measures |
| Local Flood | Guinean Flood | |
|---|---|---|
| θ1 | 1708.96 | 1697.47 |
| θ2 | 515.56 | 246.12 |
| θ3 | 0.12 | 0.163 |

| Question | |
|---|---|
| 1 | Site status as of mid-February 2025 □ Flooded. □ Not flooded |
| 2 | Status of the site in mid-August 2024 □ Flooded. □ Not flooded |
| 3 | Flood duration of the site (days) |
| 4 | Number of flood days causing crop loss |
| 5 | Flood dates of the pond rice according to the crop calendar |
| 6 | Opportunities offered by the flood |
| 7 | Crops on-site in mid-February 2025 |
| 8 | Crop yield (T/ha) |
| 9 | Number of harvested crops per year |
| 10 | Selling price of each crop EUR/100 kg □ At harvest …. T/ha. □ Max …T/ha |
| 11 | Market on which production is sold |
| 12 | Production costs incurred by the farmer EUR/ha Fertilisers Seeds Pesticides Fuel Sacks Other Total |
| 13 | Crops grown on the site in mid-August 2024 |
| 14 | Crop yield (T/ha) |
| 15 | Selling price of each crop EUR/100 kg □ At harvest …. T/ha. □ Max …T/ha |
| 16 | Market on which production is sold |
| Crop | Yield | Yields/Year | Price | |||
|---|---|---|---|---|---|---|
| At Harvest | Max | Average | ||||
| T/ha | Number | EUR/100 kg | EUR/100 kg | EUR/100 kg | EUR/ha | |
| AHA Rice N | 6–7.5 | 30 | 41 | 36 | 2430 | |
| AHA Rice K | 5–7.5 | 27 | 46 | 37 | 2313 | |
| Pond rice | 3–5.5 | 30 | 37 | 33.5 | 1424 | |
| Sorghum | 5 | 30 | 43 | 37 | 1850 | |
| Cowpea | 1.93 | 34 | 61 | 48 | 926 | |
| Onion N | 25 | 1 | 23 | 53 | 38 | 9500 |
| Cassava N | 30 | 1 | 19 | 23 | 21 | 6300 |
| Maize | 2.49 | 18 | - | 18 | 448 | |
| Gombo | 20 | 1 | 19 | 69 | 44 | 8800 |
| Sweet potato | 15 | 1 | 11 | 11 | 1650 | |
| Pumpkin N | 35–40 | 1 | 27 | 10,125 | ||
| Chilli N | 2 | 1 | 46 | 920 | ||
| Basil | 2.6 | 1 | 5 | 15 | 7.5 | 195 |
| Sesame | ||||||
References
- Tramblay, Y.; Villarini, G.; Zhang, W. Observed changes in flood hazard in Africa. Environ. Res. Lett. 2020, 15, 1040b5. [Google Scholar] [CrossRef]
- Panthou, G.; Lebel, T.; Vischel, T.; Quantin, G.; Sane, Y.; Ba, A.; Ndiaye, O.; Diongue-Niang, A.; Diopkane, M. Rainfall intensification in tropical semi-arid regions: The Sahelian case. Environ. Res. Lett. 2018, 13, 064013. [Google Scholar] [CrossRef]
- Tramblay, Y.; Villarini, G.; Saidi, M.E.; Massari, C.; Stein, L. Classification of flood-generating processes in Africa. Sci. Rep. 2022, 12, 18920. [Google Scholar] [CrossRef]
- Descroix, L.; Mahé, G.; Olivry, J.C.; Albergel, J.; Tanimoun, B.; Amadou, I.; Coulibaly, B.; Bouzou Moussa, I.; Faran Maiga, O.; Malam Abdou, M.; et al. Facteurs anthropiques et environnementaux de la recrudescence des inondations au Sahel. In Les Sociétés Rurales Face aux Changements Climatiques et Environnementaux en Afrique de l’Ouest; Sultan, B., Lalou, R., Amadou Sanni, M., Oumarou, A., Soumaré, M.A., Eds.; IRD: Marseille, France, 2015; pp. 153–170. ISBN 978-2-7099-2146-6. [Google Scholar]
- Wilcox, C.; Vischel, T.; Panthou, G.; Bodian, A.; Blanchet, J.; Descroix, L.; Quantin, G.; Casséc, C.; Tanimoune, B.; Konee, S. Trends in hydrological extremes in the Senegal and Niger rivers. J. Hydrol. 2018, 566, 531–545. [Google Scholar] [CrossRef]
- United Nations. Sendai Framework for Disaster Risk Reduction 2015–2030; UNISDR: Geneva, Switzerland, 2015; Available online: https://www.undrr.org/publication/sendai-framework-disaster-risk-reduction-2015-2030 (accessed on 20 March 2025).
- Trigg, M.A.; Birch, C.E.; Neal, J.C.; Bates, P.D.; Smith, A.; Sampson, C.C.; Yamazaki, D.; Hirabayashi, Y.; Pappenberger, F.; Dutra, E.; et al. The credibility challenge for global fluvial flood risk analysis. Environ. Res. Lett. 2016, 11, 094014. [Google Scholar] [CrossRef]
- Voigt, S.; Giulio Tonolo, F.; Lyons, J.; Kucera, J.; Jones, B.; Schneiderhan, T.; Platzeck, G.; Kaku, K.; Hazarika, M.K.; Czaran, L.; et al. Global trends in satellite-based emergency mapping. Science 2016, 353, 247–252. [Google Scholar] [CrossRef] [PubMed]
- Shoko, C.; Dube, T. A review of remote sensing of flood monitoring and assessment in southern Africa. Phys. Chem. Earth 2024, 136, 103796. [Google Scholar] [CrossRef]
- Billah, M.; Islam, A.S.; Bin Mamoon, W.; Rahman, M.R. Random forest classifications for land use mapping to assess rapid flood damage using Sentinel-1 and Sentinel-2 data. Remote Sens. Appl. Soc. Environ. 2022, 30, 100947. [Google Scholar] [CrossRef]
- Ghansah, B.; Nyamekye, C.; Owusu, S.; Agyapong, E. Mapping flood prone and Hazards Areas in rural landscape using landsat images and random forest classification: Case study of Nasia watershed in Ghana. Cogent Eng. 2021, 8, 1923384. [Google Scholar] [CrossRef]
- Li, C.; Dash, J.; Asamoah, M.; Sheffield, J.; Dzodzomenyo, M.; Gebrechorkos, S.H.; Anghileri, D.; Wright, J. Increased flooded area and exposure in the Whiter Volta river basin in Western Africa, identified from multi-source remote sensing data. Sci. Rep. 2022, 12, 3701. [Google Scholar] [CrossRef]
- Arora, M.; Sahoo, S.; Bhatt, C.M.; Litoria, P.K.; Pateriya, B. Rapid flood inundation mapping and impact assessment using Sentinel-1 SAR data over Ghaggar River basin of Punjab, India. J. Earth Syst. Sci. 2023, 132, 183. [Google Scholar] [CrossRef]
- Rahman, R.; Thakur, P.K. Detecting, mapping and analysing of flood water propagation using synthetic aperture radar (SAR) satellite data and GIS: A case study from the Kendrapara district of Orissa state of India. Egypt. J. Remote Sens. Space Sci. 2018, 21, S37–S41. [Google Scholar] [CrossRef]
- Khatun, M.; Garai, S.; Sharma, J.; Singh, R.; Tiwari, S.; Rahaman, S.M. Flood mapping and damage assessment due to the super cyclone Yaas using Google Earth Engine in Purba Medinipur, West Bengal, India. Environ. Monit. Assess. 2022, 194, 869. [Google Scholar] [CrossRef] [PubMed]
- Pandey, A.C.; Kaushik, K.; Parida, B.R. Google Earth Engine for large-scale flood mapping using SAR data and impact assessment on agriculture and population of Ganga-Brahmaputra basin. Sustainability 2022, 14, 4210. [Google Scholar] [CrossRef]
- Madhushani, C.I.; Makumbura, R.K.; Basnayake, V.; Pawar, U.; Azamathulla, H.M.; Rathnayake, U. Geospatial assessment of a severe flood event in the Nilwala River basin, Sri Lanka. Sustain. Water Resour. Manag. 2024, 10, 152. [Google Scholar] [CrossRef]
- Gondwe, S.V.C.; Shukla, S.H. Mapping flood risk of Nsanje district in Malawi using Sentinel-1 data. J. Remote Sens. GIS 2020, 11, 11–34. [Google Scholar]
- Nkeki, F.N.; Henah, P.J.; Ojeh, V.N. Geospatial techniques for the assessment and analysis of flood risk along the Niger-Benue basin in Nigeria. J. Geogr. Inf. Syst. 2013, 5, 123–135. [Google Scholar] [CrossRef]
- Odiji, C.; James, G.; Oyewumi, A.; Karau, S.; Odia, B.; Idris, H.; Aderoju, O.; Taminu, A. Decadal mapping of flood inundation and damage assessment in the confluence region of rivers Niger and Benue using multi-sensor data and Google Earth Engine. J. Water Clim. Change 2024, 15, 348–369. [Google Scholar] [CrossRef]
- Bonkoungou, B.; Bossa, A.Y.; van der Kwast, J.; Mul, M.; Sintondji, L.O. Inner Niger delta inundation extent (2010–2022) based on Landsat imagery and the Google Earth Engine. Remote Sens. 2024, 16, 1853. [Google Scholar] [CrossRef]
- Long, S.; Fatoyinbo, E.; Policelli, F. Flood extent mapping for Namibia using change detection and thresholding with SAR. Environ. Res. Lett. 2014, 9, 035002. [Google Scholar] [CrossRef]
- Tumaneng, R.D.; Morico, K.E.R.; Principe, J.A. Remote sensing and Google Earth Engine for rapid flood mapping and damage assessment: A case of typhoon Goni (Rolly) and Vamco (U-lysses). Int. Arch. Photogramm. Remote Sens. Spat. Inf. Sci. 2024, 48, 445–452. [Google Scholar] [CrossRef]
- Ghouri, A.Y.; Rehman, A.; Rasheed, F.; Miandad, M.; Rehman, G. Flood mapping using the Sentinel-1 SAR dataset and application of the change detection approach technique (CDAT) to the Google Earth Engine in Sindh province, Pakistan. Ecol. Quest. 2024, 35, 149–159. [Google Scholar] [CrossRef]
- Sajjad, A.; Lu, J.; Aslam, R.W.; Ahmad, M. Flood disaster mapping using geospatial techniques: A case study of the 2022 Pakistan floods. Environ. Sci. Proc. 2024, 2, 78. [Google Scholar] [CrossRef]
- Sajjad, A.; Lu, J.; Chen, X.; Chisenga, C.; Mazhar, N.; Nadeem, B. Riverine flood mapping and impact assessment using remote sensing technique: A case study of Chenab flood—2014 in Multan district, Punjab, Pakistan. Nat. Hazards 2022, 110, 2207–2226. [Google Scholar] [CrossRef]
- Cian, F.; Delgado Blasco, J.M.; Ivanescu, C. Improving rapid flood impact assessment: An enhanced multi-sensor approach including a new flood mapping method based on Sentinel-2 data. J. Environ. Manag. 2024, 369, 122326. [Google Scholar] [CrossRef]
- Luu, C.; Bui, Q.D.; von Meding, J. Mapping direct flood impacts from a 2020 extreme flood event in Central Vietnam using spatial analysis techniques. Int. J. Disaster Resil. Built Environ. 2021, 14, 85–99. [Google Scholar] [CrossRef]
- Nghia, B.P.Q.; Pal, I.; Chollacoop, N.; Mukhopadhyay, A. Applying Google Earth engine for flood mapping and monitoring in the downstream provinces of Mekong river. Prog. Disaster Sci. 2022, 14, 10235. [Google Scholar] [CrossRef]
- Merz, B.; Thieken, A.H.; Gocht, M. Flood risk mapping at the local scale: Concepts and challenges. In Flood Risk Management in Europe; Begun, S., Stive, M.J.F., Hall, J.W., Eds.; Springer: Dordrecht, The Netherlands, 2007; pp. 231–251. [Google Scholar] [CrossRef]
- Klaus, S.; Kreibich, H.; Merz, B.; Kuhlmann, B.; Schröter, K. Large-scale, seasonal flood risk analysis for agricultural crops in Germany. Environ. Earth Sci. 2016, 75, 1289. [Google Scholar] [CrossRef]
- Belazreg, N.E.; Habib, S.A.; Sen, Z.; Ferhati, A. Flood risk mapping using multi-criteria analysis (MCA) through AHP method case of El-Ham wadi watershed of Hodna basin (Algeria). Nat. Hazards 2024, 120, 1023–1039. [Google Scholar] [CrossRef]
- Rana, S.M.S.; Habib, A.M.A.; Sharifee, M.N.H.; Sultana, N.; Rahman, S.H. Flood risk mapping of the flood-prone Rangpur division of Bangladesh using remote sensing and multi-criteria analysis. Nat. Hazards Res. 2024, 4, 20–31. [Google Scholar] [CrossRef]
- Islam, F.; Bhattacharya, B.; Popescu, I. Flood risk assessment due to cyclone-induced dike breaching in coastal areas of Bangladesh. Nat. Hazards Earth Syst. Sci. 2019, 19, 353–368. [Google Scholar] [CrossRef]
- Tingsanchali, T.; Karim, M.F. Flood hazard and risk analysis in the southwest region of Bangladesh. Hydrol. Process. 2005, 19, 2055–2069. [Google Scholar] [CrossRef]
- Behanzin, I.D.; Thiel, M.; Szarzynski, J.; Boko, M. GIS-based mapping of flood vulnerability and risk in the Bénin Niger River valley. Int. J. Geomat. Geosci. 2015, 6, 1653–1669. [Google Scholar]
- Nigusse, A.G.; Adhanom, O.G. Flood hazard and Flood risk vulnerability mapping using geo-spatial and MCDA around Adigrat, Tigray region, Northern Ethiopia. Momona Ethiop. J. Sci. 2019, 11, 90–107. [Google Scholar] [CrossRef]
- Edamo, M.L.; Hatiye, S.D.; Minda, T.T.; Ukumo, T.Y. Flood inundation and risk mapping under climate change scenarios in the lower Bilate catchment, Ethiopia. Nat. Hazards 2023, 118, 2199–2226. [Google Scholar] [CrossRef]
- Ayenew, W.A.; Kebede, H.A. GIS and remote sensing based flood risk assessment and mapping: The case of Dikala Watershed in Kobo Woreda Amhara region, Ethiopia. Environ. Sustain. Indic. 2023, 18, 100243. [Google Scholar] [CrossRef]
- Glas, H.; De Maeyer, P.; Merisier, S.; Deruyter, G. Development of a low-cost methodology for data acquisition and flood risk assessment in the floodplain of the river Moustiques in Haiti. J. Flood Risk Manag. 2020, 13, e12608. [Google Scholar] [CrossRef]
- Hazarika, N.; Barman, D.; Das, A.K.; Sarma, A.K.; Borah, S.B. Assessing and mapping flood hazard, vulnerability and risk in the Upper Brahmaputra River valley using stakeholders’ knowledge and multicriteria evaluation (MCE). J. Flood Risk Manag. 2016, 11, S700–S716. [Google Scholar] [CrossRef]
- Chakraborty, S.; Mukhopadhyay, S. Assessing flood risk using analytical hierarchy process (AHP) and geographical information system (GIS): Application in Coochbehar district of West Bengal, India. Nat. Hazards 2019, 99, 247–274. [Google Scholar] [CrossRef]
- Patel, S.; Gohil, M.; Pathan, F.; Mehta, D.; Waikhom, S. Assessment of Flood Risk and Its Mapping in Navsari District, Gujarat. Iran. J. Sci. Technol. Trans. Civ. Eng. 2023, 48, 1021–1028. [Google Scholar] [CrossRef]
- Mangukiya, N.K.; Sharma, A. Flood risk mapping for the lower Narmada basin in India: A machine learning and IoT-based framework. Nat. Hazards 2022, 113, 1285–1304. [Google Scholar] [CrossRef]
- Kumar, R.; Acharya, P. Flood hazard and risk assessment of 2014 floods in Kashmir Valley: A space-based multisensor approach. Nat. Hazards 2016, 84, 437–464. [Google Scholar] [CrossRef]
- Sinha, R.; Bapalu, G.V.; Singh, L.K.; Rath, B. Flood risk analysis in the Kosi River basin, North Bihar using multi-parametric approach of Analytical Hierarchy Process (AHP). J. Indian Soc. Remote Sens. 2008, 36, 335–349. [Google Scholar] [CrossRef]
- Kumar, S.; Parida, B.R.; Ahammed, K.K.B. Flood risk assessment of the Kosi River basin in North Bihar using Synthetic Aperture Radar (SAR) data and AHP approach. Nat. Hazards Res. 2025; in press. [Google Scholar] [CrossRef]
- Sharma, S.V.S.P.; Rao, G.S.; Bhanumurthy, V. Development of village-wise flood risk index map using multi-temporal satellite data: A study of Nagaon district, Assam, India. Curr. Sci. 2012, 103, 25. [Google Scholar]
- Jodhani, K.H.; Patel, D.; Madhavan, N.; Gupta, N.; Singh, S.K.; Rathnayake, U. Unravelling flood risk in the Rel River watershed, Gujarat using coupled earth observations, multi criteria decision making and Google Earth Engine. Results Eng. 2024, 24, 102836. [Google Scholar] [CrossRef]
- Chandole, V.; Joshi, G.S.; Srivastava, V.K. Flood risk mapping under changing climate in lower Tapi river basin, India. Stoch. Environ. Res. Risk Assess. 2024, 38, 2231–2259. [Google Scholar] [CrossRef]
- Mojaddadi, H.; Pradhan, B.; Nampak, H.; Ahmad, N.; Ghazali, A.H.B. Ensemble machine-learning-based geospatial approach for flood risk assessment using multi-sensor remote sensing data and GIS. Geomat. Nat. Hazards Risk 2017, 8, 1080–1103. [Google Scholar] [CrossRef]
- Shuaibu, A.; Hounkpè, J.; Bossa, Y.A.; Kalin, R.M. Flood risk assessment and mapping in the Hadejia River basin, Nigeria, using hydro-geomorphic approach and multi-criterion decision-making method. Water 2022, 14, 3709. [Google Scholar] [CrossRef]
- Gacul, L.-A.; Ferrancullo, D.; Gallano, R.; Fadriquela, J.; Mendez, K.J.; Morada, J.R.; Morgado, J.K.; Gacu, J. GIS-based identification of flood risk zone in a rural municipality using fuzzy analytical hierarchy process (FAHP). Rev. Int. Geomat. 2024, 33, 295–320. [Google Scholar] [CrossRef]
- Ntajal, J.; Lamptey, B.L.; Mahamadou, I.B.; Nyarko, B.K. Flood disaster risk mapping in the Lower Mono River Basin in Togo, West Africa. Int. J. Disaster Risk Reduct. 2017, 23, 93–103. [Google Scholar] [CrossRef]
- Dinh, Q.; Balica, S.; Popescu, I.; Jonoski, A. Climate change impact on flood hazard, vulnerability and risk of the Long Xuyen quadrangle in the Mekong Delta. Int. J. River Basin Manag. 2012, 10, 103–120. [Google Scholar] [CrossRef]
- Tran, P.; Shaw, R.; Chantry, G.; Norton, J. GIS and local knowledge in disaster management; a case study of flood risk mapping in Viet Nam. Disasters 2008, 33, 152–169. [Google Scholar] [CrossRef] [PubMed]
- Ha, H.; Bui, Q.D.; Nguyen, H.D.; Pham, B.T.; Lai, T.D.; Luu, C. A practical approach to flood hazard, vulnerability, and risk assessing and mapping for Quang Binh province, Vietnam. Environ. Dev. Sustain. 2022, 25, 1101–1130. [Google Scholar] [CrossRef]
- Scawthorn, C.; Flores, P.; Blais, N.; Seligson, H.; Tate, E.; Chang, S.; Mifflin, E.; Thomas, W.; Murphy, J.; Jones, C.; et al. HAZUS-MH flood loss estimation methodology. II. Damage and loss assessment. Nat. Hazards Rev. 2006, 7, 72–81. [Google Scholar] [CrossRef]
- Kurihara, Y.; Miyamoto, M.; Sunakawa, R. Flood direct damage assessment due to Typhoon Ulysses by satellite images. Int. J. Disaster Risk Reduct. 2025, 118, 105067. [Google Scholar] [CrossRef]
- Tiepolo, M.; Braccio, S.; Fiorillo, E.; Galligari, A.; Katiellou, G.L.; Massazza, G.; Tarchiani, V. Participatory risk assessment of pluvial floods in four towns of Niger. Int. J. Disaster Risk Reduct. 2023, 84, 103454. [Google Scholar] [CrossRef]
- Bennett, M.M.; Gleason, C.J.; Tellman, B.; Alvarez Leon, L.F.; Friedrich, H.K.; Ovienmhada, U.; Mathews, A.J. Bringing satellites down to Earth: Six steps to more ethical remote sensing. Glob. Environ. Chang. Adv. 2024, 2, 100003. [Google Scholar] [CrossRef]
- IEC/ISO 31010; International Standard Risk Management—Risk Assessment Techniques. ISO/IEC: Geneva, Switzerland, 2009.
- ISO 31000; 2018 Risk Management. A Practical Guide. ISO: Vernier, Switzerland, 2021.
- Fiorillo, E.; Maselli, V.; Tarchiani, V.; Vignaroli, P. Analysis of land degradation processes on a tiger bush plateau in South West Niger using MODIS and LANDSAT TM/ETM+ data. Int. J. Appl. Earth Obs. Geoinform. 2017, 62, 56–68. [Google Scholar] [CrossRef]
- Jonkman, S.N.; Bočkarjova, M.; Kok, M.; Bernardini, P. Integrated hydrodynamic and economic modelling of flood damage in the Netherlands. Ecol. Econ. 2008, 66, 77–90. [Google Scholar] [CrossRef]
- De Moel, H.; van Alphen, J.; Aerts, J.C.J.H. Flood maps in Europe—Methods, availability and use. Nat. Hazards Earth Syst. Sci. 2009, 9, 289–301. [Google Scholar] [CrossRef]
- Amirebrahimi, S.; Rajabifard, A.; Mendis, P.; Ngo, T. A framework for a microscale flood damage assessment and visualization for a building using BIM–GIS integration. Int. J. Digit. Earth 2016, 9, 363–386. [Google Scholar] [CrossRef]
- Birkmann, J.; Welle, T. Assessing the risk of loss and damage: Exposure, vulnerability and risk to climate-related hazards for different country classifications. Int. J. Glob. Warm. 2015, 8, 191–212. [Google Scholar] [CrossRef]
- Tiepolo, M.; Braccio, S. Local and scientific knowledge integration for multi-risk assessment in rural Niger. In Renewing Local Planning to Face Climate Change in the Tropics; Tiepolo, M., Pezzoli, A., Tarchiani, V., Eds.; Springer: Cham, Switzerland, 2017; pp. 227–245. [Google Scholar] [CrossRef]
- Massazza, G.; Bacci, M.; Descroix, L.; Ibrahim, M.H.; Fiorillo, E.; Katiellou, G.L.; Panthou, G.; Pezzoli, A.; Rosso, M.; Sauzedde, E.; et al. Recent changes in hydroclimatic patterns over Medium Niger River basins at the origin of the 2020 flood in Niamey (Niger). Water 2021, 13, 1659. [Google Scholar] [CrossRef]
- Salas, J.D.; Obeysekera, J.; Vogel, R.M. Techniques for assessing water infrastructure for nonstationary extreme events: A review. Hydrol. Sci. J. 2018, 63, 325–352. [Google Scholar] [CrossRef]
- Hosking, J.R.M. L-moments: Analysis and estimation of distributions using linear combinations of order statistics. J. R. Stat. Soc. Ser. B (Method) 1990, 52, 105–124. [Google Scholar] [CrossRef]
- Grimaldi, S.; Kao, S.-C.; Castellarin, A.; Papalexiou, S.-M.; Viglione, A.; Laio, F.; Aksoy, H.; Gedikli, A. Statistical hydrology. In Treatise on Water Science; Wilderer, P., Ed.; Academic Press: Cambridge, MA, USA; Elsevier: Oxford, UK, 2011; Volume 2, pp. 479–517. [Google Scholar]
- Laio, F.; Ganora, D.; Claps, P.; Galeati, G. Spatially smooth regional estimation of the flood frequency curve (with uncertainty). J. Hydrol. 2011, 408, 67–77. [Google Scholar] [CrossRef]
- Marani, M.; Ignaccolo, M. A metastatistical approach to rainfall extremes. Adv. Water Resour. 2015, 79, 121–126. [Google Scholar] [CrossRef]
- Rahman, S.; Di, L. A systematic review on case studies of remote-sensing-based flood crop loss assessment. Agriculture 2020, 10, 131. [Google Scholar] [CrossRef]
- Notti, D.; Giordan, D.; Calò, F.; Pepe, A.; Zucca, F.; Galve, J.P. Potential and limitations of open satellite data for flood mapping. Remote Sens. 2018, 10, 1673. [Google Scholar] [CrossRef]
- Du, Y.; Zhang, Y.; Ling, F.; Wang, Q.; Li, W.; Li, X. Water bodies’ mapping from Sentinel-2 imagery with Modified Normalized Difference Water Index at 10-m spatial resolution produced by sharpening the SWIR band. Remote Sens. 2016, 8, 354. [Google Scholar] [CrossRef]
- Shrestha, B.B.; Okazumi, T.; Miyamoto, M.; Sawano, H. Flood damage assessment in the Pampanga river basin of the Philippines. J. Flood Risk Manag. 2016, 9, 355–369. [Google Scholar] [CrossRef]
- Adamou, H.; Outani, B.A.; Adamou, B.; Yacouba, S.A.; Iliassou, M.M.; Naroua, B.M.; Sodé, C. Manuel du Système de Riziculture Intensive pour le Riz Irrigué au Niger; INRAN: Niamey, Niger, 2021. [Google Scholar]
- République du Niger (RdN); Ministère du Commerce et de l’Industrie (MCI); Système d’Informations sur les Marchés Agricoles (SIMA). Bulletin Mensuel des Produits Agricoles n. 332 du Mois de Décembre 2024. Available online: https://simaniger.net/wp-content/uploads/2025/01/Bulletin-CR_12_24.pdf (accessed on 20 March 2025).
- République du Niger (RdN); Ministère du Commerce et de l’Industrie (MCI); Système d’Informations sur les Marchés Agricoles (SIMA). Bulletin Fruits et Legumes 633. Available online: https://simaniger.net/download/bulletin-hebdo-fruits-legumes-semaine-n08-du-mercredi-19-au-mardi-25-fevrier-2025/ (accessed on 20 March 2025).
- République du Niger (RdN); Ministère de l’Equipment. Plan Abregé de Reinstallation (PAR) Projet d’Aménagement et Bitumage de la Route Tamaské-Kalfou-Kolloma y Compris la Bretelle Mararraba (63 km); Rapport définitif; Direction Générale des Grands Travaux, Direction des Etudes Techniques: Niamey, Niger, 2019; Available online: https://esa.afdb.org/sites/default/files/PAR%20Projet%20d’Aménagement%20Bitumage%20de%20la%20route%20Tamaske-Niger.pdf (accessed on 20 March 2025).
- RECA. Fiche Technico-économique Riz-hors Aménagement Region Diffa. 2017. Available online: https://reca-niger.org/IMG/pdf/Fiche_technico-economique_riz_Diffa_Mai2017.pdf (accessed on 20 March 2025).
- RECA. Analyse Prospective de la Chaine du Valeur du Niebe au Niger 2021–2030; SOFRECO: Clichy, France, 2022; Available online: https://reca-niger.org/IMG/pdf/l4_etude_niebe.pdf (accessed on 20 March 2025).
- Wolff, E. The promise of a “people-centred” approach to floods: Types of participation in the global literature of citizen science and community-based flood risk reduction in the context of the Sendai Framework. Prog. Disaster Sci. 2021, 10, 100171. [Google Scholar] [CrossRef]
- Sauzedde, E.; Vischel, T.; Panthou, G.; Tarchiani, V.; Massazza, G.; Ibrahim, M.H. Compound-event analysis in non-stationary hydrological hazards: A case study of the Niger River in Niamey. Hydrol. Sci. J. 2025, 70, 406–421. [Google Scholar] [CrossRef]
- Tiepolo, M.; Bacci, M.; Braccio, S. Multihazard risk assessment for planning with climate in the Dosso region, Niger. Climate 2018, 6, 67. [Google Scholar] [CrossRef]
- Metin, A.D.; Dung, N.V.; Schröter, K.; Vorogushyn, S.; Guse, B.; Kreibich, H.; Merz, B. The role of spatial dependence for large-scale flood risk estimation. Nat. Hazards Earth Syst. Sci. 2020, 20, 967–979. [Google Scholar] [CrossRef]
- McCallum, I.; Liu, W.; See, L.; Mechler, R.; Keating, A.; Hochrainer-Stigler, S.; Mochizuki, J.; Fritz, S.; Dugar, S.; Arestegui, M.; et al. Technologies to support community flood disaster risk reduction. Int. J. Disaster Risk Sci. 2016, 7, 198–204. [Google Scholar] [CrossRef]
- Ward, P.J.; Coughlan de Perez, E.; Dottori, F.; Jongman, B.; Luo, T.; Safaie, S.; Uhlemann-Elmer, S. The need for mapping, modeling, and predicting flood hazard and risk at the global scale. In Global Flood Hazard. Applications in Modeling, and Forcasting; Schumann, G.J.-P., Bates, D.B., Apel, H., Aronica, G.T., Eds.; Geophysical Monograph; Wiley: Hoboken, NJ, USA, 2018. [Google Scholar] [CrossRef]
- Schulz, D.; Yin, H.; Tischbein, B.; Verleysdonk, S.; Adamou, R.; Kumar, N. Land use mapping using Sentinel-1 and Sentinel-2 time series in a heterogeneous landscape in Niger, Sahel. ISPRS J. Photogramm. Remote Sens. 2021, 178, 97–111. [Google Scholar] [CrossRef]
- Shrestha, B.B.; Kawasaki, A.; Zin, W.W. Development of flood damage functions for agricultural crops and their applicability in regions of Asia. J. Hydrol. Reg. Stud. 2021, 36, 100872. [Google Scholar] [CrossRef]
- Service Régional de Traitement d’Image et de Télédétection (SERTIT). Niger-Tillaberi. Flood-Impact Map Observed the 23/09/2020. 2020. Available online: https://reliefweb.int/map/niger/niger-tillaberi-flood-impact-map-observed-23092020 (accessed on 20 March 2025).
- United Nations Satellite Centre (UNOSAT). Niger Niamey and Tillaberi Regions Imagery Analysis 05/10/2022; Published 10 July 2022 V1; UNOSAT: Geneva, Switzerland, 2022. [Google Scholar]
- De Vries, D.H. Temporal vulnerability and the post-disaster ‘window of opportunity to woo:’ a case study of an African-American floodplain neighborhood after hurricane Floyd in North Carolina. Hum. Ecol. 2017, 45, 437–448. [Google Scholar] [CrossRef]
- Duvail, S.; Hamerlynck, O. The Rufiji river flood: Plague or blessing? Int. J. Biometeorol. 2007, 52, 33–42. [Google Scholar] [CrossRef]
- Bruckmann, L.; Ogilvie, A.; Martin, D.; Diakhaté, F.B.; Tilmant, A. Mapping seasonal flood-recession cropland extent in the Senegal River valley. Remote Sens. Appl. Soc. Environ. 2025, 37, 101473. [Google Scholar] [CrossRef]
- Tarchiani, V.; Fiorillo, E.; Katiellou, G.L.; Tankari, A.M. Risques et opportunités liés aux changements hydrologiques, le cas des mares de Falmey. In Risque et Adaptation Climatique dans la Region de Dosso au Niger; Katiellou, G.L., Tarchiani, V., Tiepolo, M., Eds.; L’Harmattan: Paris, France, 2021; pp. 193–212. [Google Scholar]
- Juarez-Lucas, A.; Kibler, K.M.; Ohara, M.; Sayama, T. Benefits of flood-prone land use and the role of coping capacity, Candaba floodplains, Philippines. Nat. Hazards 2016, 84, 2243–2264. [Google Scholar] [CrossRef]
- Roy, T.; Hasan, M.K.; Sony, M.M.A.A.M. Climate change, conflict, and prosocial behavior in Southwestern Bangladesh: Implications for environmental justice. In Environment, Climate, and Social Justice; Madhanagopal, D., Beer, C.T., Nikku, B.R., Pelser, A.J., Eds.; Springer: Singapore, 2022. [Google Scholar] [CrossRef]
- O’Hare, P.; White, I. Beyond ‘just’ flood risk management: The potential for—and limits to—alleviating flood disadvantage. Reg. Environ. Change 2018, 18, 385–396. [Google Scholar] [CrossRef]
- Massazza, G.; Tamagnone, P.; Wilcox, C.; Belcore, E.; Pezzoli, A.; Vischel, T.; Panthou, G.; Ibrahim, M.H.; Tiepolo, M.; Tarchiani, V.; et al. Flood hazard scenarios of the Sirba River (Niger): Evaluation of the hazard thresholds and flooding areas. Water 2019, 11, 1018. [Google Scholar] [CrossRef]
- Tarchiani, V.; Massazza, G.; Rosso, M.; Tiepolo, M.; Pezzoli, A.; Ibrahim, M.H.; Katiellou, G.L.; Tamagnone, P.; De Filippis, T.; Rocchi, L.; et al. Community and impact based early warning system for flood risk preparedness: The experience of the Sirba River in Niger. Sustainability 2020, 12, 1802. [Google Scholar] [CrossRef]


| Type | Acquisition Date | Green Band Resolution m | Infrared Band Resolution m |
|---|---|---|---|
| Sentinel 2 (2-A level) | 20 August 2024 | 10 | 20 |
| Sentinel 2 (2-A level) | 16 February 2025 | 10 | 20 |
| Stages of Rice Crops | Dry Season Week Number | Wet Season Week Number |
|---|---|---|
| Seedling | 46 | 25 |
| Nursery | 47–52 | 26–30 |
| Transplanting | 1–3 | 31–33 |
| In plot | 4–16 | 34–48 |
| Harvest | 17–19 | 49–51 |
| Municipality | AHA Rice | Pond Rice | Horticulture | Fruits | Tubers | All |
|---|---|---|---|---|---|---|
| ha | ha | ha | ha | ha | ha | |
| Gothèye | 0 | 20 | 79 | 0 | 0 | 99 |
| Karma | 904 | 212 | 271 | 12 | 1400 | |
| Kourteye | 0 | 469 | 228 | 0 | 2 | 700 |
| Namaro | 299 | 0 | 59 | 0 | 0 | 358 |
| All | 1203 | 701 | 637 | 12 | 2 | 2556 |
| Flood | Municipality | AHA Rice | Pond Rice | Cereals, Legumes | Horticulture | All |
|---|---|---|---|---|---|---|
| ha | ha | ha | ha | ha | ||
| 16 February 2025 | Gotheye | 0 | 5 | 0 | 10 | 15 |
| Karma | 0 | 20 | 0 | 25 | 45 | |
| Kourteye | 0 | 213 | 0 | 31 | 244 | |
| Namaro | 0 | 89 | 0 | 3 | 93 | |
| Total | 0 | 327 | 0 | 70 | 397 | |
| 21 August 2024 | Gotheye | 0 | 6 | 24 | 0 | 30 |
| Karma | 58 | 50 | 91 | 0 | 199 | |
| Kourteye | 0 | 235 | 94 | 0 | 329 | |
| Namaro | 13 | 128 | 31 | 0 | 172 | |
| Total | 71 | 419 | 240 | 0 | 730 |
| Ground Control Points | Excess of Water Edge at GCP over That MNDWI Detected | |
|---|---|---|
| Location in Figure 1 | Number | Metres |
| C | 5 | 323 |
| H | 6 | 83 |
| F | 5 | 36 |
| G | 2 | 170 |
| I (north of) | 5 | 36 |
| J-K | 3 | 150 |
| OLM (north of) | 3 | 40 |
| RS | 3 | 43 |
| T (north of) | 5 | 184 |
| Average | 35 | 127 |
| Municipality | Building Exposure, According to | Crop Exposure, According to | ||
|---|---|---|---|---|
| Risk Mapping Number | BDINA Number | Risk Map ha | BDINA ha | |
| Gotheye | 0 | 0 | 30 | 0 |
| Karma | 1 | 141 | 199 | 127 |
| Kourteye | 12 | 155 | 329 | 46 |
| Namaro | 8 | 194 | 172 | 0 |
| All | 21 | 490 | 730 | 173 |
| Crop | Phenological Stage | Submersion Duration | |||
|---|---|---|---|---|---|
| Mid-February | Mid-August | Mid-February | Mid-August | Crop Failure After | |
| Days | Days | Days | |||
| Okra | Fructification | 10–47 | 5 | ||
| Cassava | Early fruiting | 10–47 | 30 | ||
| Sorghum | - | 3 | 3 | 5 | |
| Cowpea | - | 3 | 3 | 5 | |
| Onion | Bulb | 10–47 | 3–7 | ||
| Pumpkins | Fructification | 10–47 | 7 | ||
| AHA rice | - | Bolting, tillering | |||
| Pond rice | Transplanting Leaf out | 10–47 | 30 | 7–10–15 | |
| Sweet potato | Growth | 10–47 | 10 | ||
| Basilique | Transplanting, growth | 10–47 | 15 | ||
| Chilli | Fructification | 10–47 | 7 | ||
| Flood | Assets | Damage | ||
|---|---|---|---|---|
| Class | ha | EUR/ha | EUR Thousands | |
| Local | Adobe houses | 0.1517 | 260,000 | 40 |
| AHA rice | 71 | 2372 | 168 | |
| Pond rice | 419 | 1424 | 597 | |
| Cereals, legumes | 240 | 1281 | 307 | |
| Sum | 730 | 1.112 | ||
| Guinean | Pond rice | 327 | 1424 | 466 |
| Horticulture | 70 | 8200 | 574 | |
| Sum | 397 | 1040 | ||
| Hydrological year | Adobe houses | 260,000 | 40 | |
| AHA rice | 2372 | 168 | ||
| Pond rice | 1424 | 1063 | ||
| Cereals, legumes | 1281 | 307 | ||
| Horticulture | 8200 | 574 | ||
| Sum | 1129 | - | 2152 | |
| Flood | Assets | Hazard | Damage | Risk | |||
|---|---|---|---|---|---|---|---|
| ha | EUR/ha | EUR Thousands | EUR Thousands | EUR/ha | |||
| 21 August 2024 | Houses | 0.08 | 0.1517 | 260,000 | 39.4 | 3.2 | 20,800 |
| AHA rice | 0.4 | 71 | 2372 | 168 | 67.4 | 28 | |
| Pond rice | 0.08 | 419 | 1424 | 597 | 47.7 | 114 | |
| Cereals | 0.08 | 240 | 1280 | 307 | 24.6 | 102 | |
| Sum | - | 730 | 142.8 | ||||
| 16 February 2025 | Pond rice | 0.055 | 327 | 1424 | 466 | 25.6 | 78 |
| Horticulture | 0.055 | 70 | 8200 | 574 | 31.6 | 451 | |
| Sum | - | 397 | 57.2 | ||||
| Hydrological year 2024–2025 | Houses | 0.08 | 260,000 | 3.2 | |||
| AHA rice | 0.4 | 2372 | 67.4 | ||||
| Pond rice | 0.08 | 1424 | 47.7 | ||||
| Pond rice | 0.055 | 1424 | 25.6 | ||||
| Cereals | 0.08 | 1281 | 24.6 | ||||
| Horticulture | 0.055 | 8200 | 31.6 | ||||
| Sum | 200.1 | ||||||
| Flood | Municipality | Asset Class | Hazard | Damage | Risk | ||
|---|---|---|---|---|---|---|---|
| ha | EUR/ha | EUR Thousand | EUR Thousand | ||||
| 21 August 2024 | Gotheye | Pond rice | 0.08 | 6 | 1424 | 9.5 | 0.7 |
| Cereals | 24 | 1281 | 30.7 | 2.5 | |||
| Sum | 30 | - | 39.3 | 3.1 | |||
| Karma | House | 0.0033 | 260,000 | 0.9 | 0.1 | ||
| AHA rice | 0.38 | 58 | 2372 | 137.6 | 52.3 | ||
| Pond rice | 0.08 | 50 | 1424 | 71.2 | 5.7 | ||
| Cereals | 91 | 1281 | 116.6 | 9.3 | |||
| Sum | 199 | - | 362.2 | 67.4 | |||
| Kourteye | House | 0.0451 | 260,000 | 11.7 | 0.9 | ||
| Pond rice | 235 | 1424 | 334.6 | 26.8 | |||
| Cereals | 94 | 1281 | 120.4 | 9.6 | |||
| Sum | 329 | - | 466.8 | 37.3 | |||
| Namaro | House | 0.08 | 0.1033 | 260,000 | 26.9 | 2.1 | |
| AHA rice | 0.42 | 13 | 2372 | 30.8 | 13.0 | ||
| Pond rice | 0.08 | 128 | 1424 | 182.3 | 14.6 | ||
| Cereals | 31 | 1281 | 39.7 | 3.2 | |||
| Sum | 172 | - | 279.7 | 32.9 | |||
| Sum | 730 | 1112.0 | 140.7 | ||||
| 16 February 2025 | Gotheye | Pond rice | 0.055 | 5 | 1424 | 7.1 | 0.4 |
| Horticulture | 10 | 8200 | 82.0 | 4.5 | |||
| Sum | 15 | - | 89.1 | 4.9 | |||
| Karma | Pond rice | 20 | 1424 | 28.5 | 1.6 | ||
| Gardens | 25 | 8200 | 205.0 | 11.3 | |||
| Sum | 45 | - | 233.5 | 12.8 | |||
| Kourteye | Pond rice | 213 | 1424 | 303.3 | 16.7 | ||
| Horticulture | 31 | 8200 | 254.2 | 14.0 | |||
| Sum | 244 | - | 557.5 | 30.7 | |||
| Namaro | Pond rice | 89 | 1424 | 126.7 | 7.0 | ||
| Horticulture | 3 | 8200 | 24.6 | 1.4 | |||
| Sum | 93 | - | 151.3 | 8.3 | |||
| Sum | 397 | - | 1031.4 | 56.7 | |||
| Hydrological year 2024–2025 | - | 2143.4 | 200.1 | ||||
Disclaimer/Publisher’s Note: The statements, opinions and data contained in all publications are solely those of the individual author(s) and contributor(s) and not of MDPI and/or the editor(s). MDPI and/or the editor(s) disclaim responsibility for any injury to people or property resulting from any ideas, methods, instructions or products referred to in the content. |
© 2025 by the authors. Licensee MDPI, Basel, Switzerland. This article is an open access article distributed under the terms and conditions of the Creative Commons Attribution (CC BY) license (https://creativecommons.org/licenses/by/4.0/).
Share and Cite
Tiepolo, M.; Abraiz, M.; Bacci, M.; Baoua, O.; Belcore, E.; Cannella, G.; Fiorillo, E.; Ganora, D.; Housseini, M.I.; Katiellou, G.L.; et al. Flood Damage Risk Mapping Along the River Niger: Ten Benefits of a Participated Approach. Climate 2025, 13, 80. https://doi.org/10.3390/cli13040080
Tiepolo M, Abraiz M, Bacci M, Baoua O, Belcore E, Cannella G, Fiorillo E, Ganora D, Housseini MI, Katiellou GL, et al. Flood Damage Risk Mapping Along the River Niger: Ten Benefits of a Participated Approach. Climate. 2025; 13(4):80. https://doi.org/10.3390/cli13040080
Chicago/Turabian StyleTiepolo, Maurizio, Muhammad Abraiz, Maurizio Bacci, Ousman Baoua, Elena Belcore, Giorgio Cannella, Edoardo Fiorillo, Daniele Ganora, Mohammed Ibrahim Housseini, Gaptia Lawan Katiellou, and et al. 2025. "Flood Damage Risk Mapping Along the River Niger: Ten Benefits of a Participated Approach" Climate 13, no. 4: 80. https://doi.org/10.3390/cli13040080
APA StyleTiepolo, M., Abraiz, M., Bacci, M., Baoua, O., Belcore, E., Cannella, G., Fiorillo, E., Ganora, D., Housseini, M. I., Katiellou, G. L., Piras, M., Saretto, F., & Tarchiani, V. (2025). Flood Damage Risk Mapping Along the River Niger: Ten Benefits of a Participated Approach. Climate, 13(4), 80. https://doi.org/10.3390/cli13040080