Article

Influence of Heat Waves on Ischemic Heart Diseases in Germany

by
Stefan Zacharias
1,*,
Christina Koppe
1 and
Hans-Guido Mücke
2
1
Deutscher Wetterdienst (German Meteorological Service), Center for Biometeorological Research (ZMMF), Stefan-Meier-Str. 4, Freiburg 79104, Germany
2
Federal Environment Agency, Department Environmental Hygiene, Corrensplatz 1, Berlin 14195, Germany
*
Author to whom correspondence should be addressed.
Climate 2014, 2(3), 133-152; https://doi.org/10.3390/cli2030133
Submission received: 4 May 2014 / Revised: 16 June 2014 / Accepted: 18 June 2014 / Published: 26 June 2014
(This article belongs to the Special Issue Climate Impacts on Health)

Abstract

:
The impact of heat waves on ischemic heart disease (IHD) mortality and morbidity in Germany during 2001–2010 is analyzed. Heat waves are defined as periods of at least three consecutive days with daily mean temperature above the 97.5th percentile of the temperature distribution. Daily excess mortality and morbidity rates are used. All calculations were performed separately for 19 regions to allow for the investigation of regional differences. The results show that IHD mortality during heat waves is significantly increased (+15.2% more deaths on heat wave days). In stark contrast, no heat wave influence on hospital admissions due to IHD could be observed. Regional differences in heat wave IHD mortality are present, with the strongest impact in Western Germany and weaker than average effects in the Southeastern and Northwestern regions. The increase in mortality during heat waves is generally stronger for females (+18.7%) than for males (+11.4%), and for chronic ischemic diseases (+18.4%) than for myocardial infarctions (+12.2%). Longer and more intense heat waves feature stronger effects on IHD mortality, while timing in season seems to be less important. Since climate change will most likely enhance the number and intensity of heat waves, the obtained results point to public adaptation strategies to reduce the future heat wave impact on mortality.

Graphical Abstract

1. Introduction

Weather affects public health in many ways and heat is one of the primary weather-associated threats to human life [1]. High ambient temperature is associated with increases in both mortality and morbidity [2,3,4,5]. For example, the death toll of the 2003 heat waves in Europe was estimated to be around 50,000 additional deaths [6]. Heat waves, defined as extended periods of extreme high temperatures, exert a stronger influence on human health than isolated hot days [7,8]. Generally, the heat effect is present particularly among the elderly, while the younger population is less vulnerable to heat stress (e.g., [9]). Furthermore, there are distinct differences between the various diseases: while the heat effect is highest for cardiovascular and respiratory diseases, other illnesses seem to be less affected [9,10].
Studies frequently report that the temperature-mortality relationship is stronger than the temperature-morbidity relationship, which also implies that heat episodes cause stronger increases in deaths than in hospital admissions [11,12]. Some authors also investigated the influence of heat wave characteristics on human health and showed that more intense and longer heat waves feature stronger effects [2,7]. Furthermore, an earlier occurrence of heat episodes in summer also led to a stronger effect [13,14,15].
The pathophysiological mechanisms of the heat impact on the human body involve dehydration, increased blood viscosity and a higher risk of thrombo-embolic diseases [16,17]. Moreover, high temperatures may impair the endothelial function, which in turn enhances the risk for cardiovascular events [18]. Even if dehydration is avoided, the work required to maintain thermoregulation is increased, which stresses the cardiovascular system [19].
While the previous results are generally well documented, there are a number of aspects regarding heat waves and health that are less frequently studied. For example, subtypes of diseases may be affected by heat via different mechanisms, which can lead to weaker or stronger physiological reactions to heat [4,20]. Some studies also report stronger heat-related impacts on women than on men [21,22,23]. Further subjects of interest are regional differences, since the effect of heat shows large geographical heterogeneity among cities or regions [9,24].
Understanding how heat affects human health in its various aspects is of major importance to prepare for the future and to minimize the temperature-related health impacts in a changing climate. Scientific knowledge of heat wave-associated mortality in Germany was claimed to be insufficient so far [25], since most studies focus on single heat episodes or only a subset of cities (e.g., [26,27]).
In our study, we analyze the impact of heat waves on ischemic heart diseases in Germany in the period 2001–2010. All IHD deaths and hospital admissions during this time period are considered in a nationwide database, which offers the advantage to assess reliable area-covering heat effects and to enable regional intercomparisons. Differences between mortality and morbidity as well as IHD subtype and gender differences are studied. Furthermore, the effects of heat wave characteristics (such as intensity, duration, and timing in season) on IHD are considered. The paper is organized as follows: a description of the data and methods used is given in Section 2, results are presented in Section 3, followed by a discussion and concluding remarks in Section 4.

2. Data and Methods

2.1. Mortality and Morbidity Data

Ischemic heart diseases (I20–I25 according to the International Classification of Diseases, 10th revision (ICD-10)) represent about 17% of all deaths and 4% of all hospital admissions in Germany in the period 2001–2010 [28,29]. Daily mortality and morbidity data are obtained from the Research Data Centre of the Statistical Offices of the Länder and cover all deaths and hospital admissions in Germany due to IHD in the years 2001–2010. An overview of the total numbers and daily averages of deaths counts and hospital admissions is presented in Table 1. The data are divided into subgroups of ischemic diseases (I20–I22 and I24–I25 for mortality data; I20, I21–I23, and I24–I25 for morbidity data) and according to gender. Furthermore, the data are available at the resolution of 19 regions, enabling an individual analysis of different geographic areas. An additional consideration of different age groups was not feasible due to data privacy protection reasons: whenever the number of daily cases in a region was below 5, it was set to 3 by the Research Data Centre, in order to avoid that single cases could be tracked. Due to the small number of cases with data privacy protection reasons (compared with the overall number of deaths or hospital admissions) a possible bias in the data analyses introduced by this method is very unlikely.
Table 1. Total numbers and daily averages of deaths and hospital admissions due to ischemic heart diseases (IHD) in Germany in the period 2001–2010. Differences between I20-I25 and the sum of I20 to I25 are caused by data privacy protection reasons: if the number of daily cases per region was smaller than 5, the number was set to 3 by the Research Data Centre of the Statistical Offices of the Länder.
ICD-10 CodeDiseaseDeathsHospital Admissions
SumPer DaySumPer Day
I20-I25Ischemic heart diseases1,474,9834047,478,2272048
I20Angina Pectoris642,6171762,715,232743
I21Acute myocardial infarction (MI)2,000,283548
I22Subsequent MI
I23Complications following MINo casesNo cases
I24Other acute ischemic heart diseases820,0782252,765,448757
I25Chronic ischemic heart disease
The mortality data are standardized following a two-step procedure. Firstly, for every region the absolute number of deaths is transformed into daily mortality rate per 100,000 inhabitants. Subsequently, the daily “excess” mortality, i.e., the difference between observed and expected mortality, is calculated in order to remove long-term trends and seasonal fluctuations. The expected mortality is calculated applying a method developed by [30]. In order to allow for seasonal variations in the mortality data, this method is smoothing the data by using a 365-day Gaussian low-pass filter with a filter response function R [31,32]:
R(f) = exp(−1/3 π2 f3)
with f as the frequency of the time series. The Gaussian smoothing also eliminates trends. Due to the length of the filter function of one year the minima and maxima of this function become very flat. In order to control for this fact, [33] suggests introducing a correction factor. This correction factor can be used if the oscillation of interest is sinusoidal as is the course of the year. We have chosen the correction factor in a way that the differences between the raw-data and the filter function were minimized. The rational for choosing a filter length of 365 days for the estimation of the expected mortality was that we want to cover one year with the filter. The corrected filter function is taken as the expected mortality rate.
The calculations for the morbidity data are generally done in a similar way, but additionally the strong weekly cycle was removed. This was done by the estimation of expected morbidity for every day of the week separately by application of the method of [30], but this time using a Gaussian filter with length 52 days. The rational for choosing this filter length was, as for the mortality data, that we want to cover one year with the filter. As each day of the week was filtered separately this required a filter with the same length as the number of weeks per year. After calculating the excess morbidity rate for every weekday, the data were put together again to one time series in their original order.
Detailed information about the monthly mortality and morbidity rates per 100,000 inhabitants is presented in Figure 1. Regarding the mortality rates (Figure 1, left), a decreasing long-term trend in the period 2001–2010 and a distinct seasonal cycle with the highest values in winter can be seen in all subtypes of ischemic heart diseases. Furthermore, the mortality rates are very similar for men and women. For the morbidity rates (Figure 1, right), a decreasing trend between 2001 and 2010 is observed for total IHD morbidity, but the subtypes I20 and I21-I23 show the opposite signal. Seasonal cycles are much weaker than for mortality. Furthermore, short-term fluctuations are present, which are caused by lower than average values in the month of December (probably due to the lack of planned hospital admissions in the last third of this month). Considering the gender differences, the morbidity rates are much higher for men than for women.
Figure 1. Monthly rates of mortality (left) and morbidity (right) per 100,000 inhabitants (averaged over all 19 regions) for ischemic diseases and its subgroups (the rates for men and women are based on 100,000 male/female inhabitants). For total ischemic diseases (I20–I25), additionally the geographical variability (calculated from the standard deviation of the 19 regions) is displayed by error bars.
Climate 02 00133 g001

2.2. Meteorological Data

Weather data were obtained from the German Meteorological Service. As we aim to study also regional variations in the relationships between heat waves and mortality or morbidity, for every region a representative weather station was selected. Only high-quality stations of the observational network of the German Meteorological Service are used (which are in accordance with the official weather station criteria of the World Meteorological Organization). Therefore, an urban influence can widely be excluded. The weather stations are furthermore selected according to representativeness of the local climate and of the population under investigation. In addition, stations that did not cover the complete study period or had substantial data gaps were omitted. Daily mean temperature was calculated from hourly temperature values at 2 m height. Missing values of temperature were filled in by linear interpolation (short data gaps) or by interpolated values of adjacent stations (longer data gaps). In summary, the quality of the temperature data set was very good, with less than 0.1% missing values.

2.3. Heat Wave Definition

Up to now, no common formal definition of heat waves exists (e.g., [1]). According to [34], a heat wave can be seen as “an extended period of unusually high atmosphere-related heat stress”. Therefore, a heat wave always includes the combination of intensity and duration of high temperature periods. In our study, we define heat waves as periods of at least three consecutive days with daily mean temperature above the 97.5th percentile of the temperature distribution between 2001–2010. This definition is similar to those used previously [15,23], but with the focus slightly more on duration than on intensity. A variety of meteorological variables and indices (e.g., mean temperature, maximum temperature, apparent temperature, humidex) has been used and compared against each other in previous studies [7,35,36,37,38]. There is no single temperature indicator that fits best in all situations, but mean temperature turned out to be a consistent and well-fitting predictor of mortality [7,35,36]. Since we evaluate heat wave related mortality and morbidity for every district separately, the use of relative over absolute thresholds allows for regional acclimatization to temperatures normal for a community. Furthermore, this enables the comparison of regional sensitivities. Heat waves are defined in each region for 2001–2010 using the region-specific temperature threshold. Each event is classified by its intensity (mean temperature during heat wave), duration (heat wave length in days), and time of occurrence (first or subsequent heat wave in a year).

2.4. Methods

The heat wave effect on ischemic heart diseases is investigated based on daily relative deviations of mortality and morbidity from the correspondent baseline (expected mortality and morbidity rate). To enable an evaluation of the temporal course of the mortality and morbidity effect before, during, and after a heat wave, for each event the time range from three days before up to 30 days after the onset of the heat wave is considered. For the graphical presentation of the mean temporal course of the heat wave impacts (cf. Section 3.2), the mortality and morbidity effects are averaged over all heat waves in the 19 regions (adjusted for population) during 2001–2010.
Heat wave characteristics are studied to evaluate the potential effects of heat wave intensity, duration, and timing on IHD mortality. Each of the 19 regions is analyzed separately and subsequently aggregated to a nationwide average weighted by population size. In order to investigate the heat wave intensity effect, impacts on IHD mortality were analyzed for three classes of intensity, which correspond to the lower, medium, and upper tercile of daily mean temperature values during heat waves. The duration effect was estimated by calculation of the heat wave influence on IHD mortality separately for heat waves with a length of 3 days, 4 days, 5–9 days, and 10–14 days. Medium- and long-length heat waves are aggregated as outlined above in order to obtain classes with similar numbers of heat wave days. In order to study the heat wave effects related to timing in season, we divided all heat waves into two subgroups: the first heat wave in a season and the subsequent heat waves in the same season.
The statistical significance of relative deviations of mortality and morbidity from the baseline for the temporal course of the averaged heat waves is assessed by the Monte Carlo method (cf. [39]). A total of 10,000 synthetic series were generated based on year-round relative deviations. For each series, the same number of 34-day sequences (D−3 to D+30) as the number of heat waves was drawn from the data set. From the 0.5th, 2.5th, 97.5th, and 99.5th percentiles of the resulting distribution, the 95% and 99% confidence intervals around the zero line are estimated.
The significance of differences between data subsets is calculated using the student t-test (e.g., [33]) with a confidence level of 0.95. Tested are the differences between heat wave days and non heat wave days, between regional differences, between males and females, and between IHD subtypes I20–I22 and I24–I25. Furthermore, the t-test was used for the calculation of significances regarding heat wave characteristics.

3. Results

3.1. Meteorological Heat Wave Characteristics

The meteorological heat wave characteristics in Germany and their spatial variability are presented in Table 2. The average region-specific threshold for daily mean temperature (97.5th percentile) is 22.7 °C. There are only moderate variations between the different regions with the lowest thresholds lying in the North of Germany. A similar pattern is observed for the average temperature during heat waves, which are lowest again in Northern Germany (see also Section 3.3.1 for a detailed regional analysis). The applied heat wave definition leads on average to 1.1 heat waves per year over the investigated period 2001–2010, with variation by region from 0.8–1.4 heat waves. Generally the Northern and Eastern territories tend to feature more frequent heat waves. The length of heat waves is within the range of three to 14 days with an average duration of 5.0 days. Longer heat waves are observed mostly in the Western districts, while they are generally shorter in Eastern Germany (cf. Section 3.3.1). There are on average 5.4 heat wave days per year, with regional differences varying from 4.0–6.3 days. In summary, the meteorological heat wave characteristics are relatively similar across Germany with only moderate variation by region.
Table 2. Meteorological heat wave characteristics for Germany during 2001–2010: mean (± standard deviation), minimum, and maximum of the 19 regions.
Heat Wave CharacteristicsMean (±Stdv)MinMax
Temperature threshold (°C)22.7 (±0.8)20.924.3
Mean temperature during heat waves (°C)24.7 (±0.9)22.326.2
Mean number of heat waves per year1.1 (±0.2)0.81.4
Mean duration of heat waves (days)5.0 (±0.6)4.06.3
Mean number of heat wave days per year5.4 (±0.5)4.66.7
Annual heat wave statistics for Germany are presented in Table 3. The occurrence of heat waves exhibits strong fluctuations between the individual years. Most heat waves are observed in 2003, 2006, and 2010, while in other years only very few heat waves occurred (e.g., 2005, 2009). Additionally, the longest average duration of heat waves is found in the years of 2003 and 2006. Therefore, the number of heat wave days shows a similar pattern as the number of heat waves, with the highest amount of heat wave days in the years 2003, 2006, and 2010. Altogether, these three years represent about 65% of heat wave days in the investigated time period.
Table 3. Heat wave statistics for 2001–2010: Average number of heat wave days per region, percentage of annual heat wave days compared to the total number of heat wave days in the period 2001–2010, average number of heat waves per region, and annual average heat wave duration.
YearAverage No. of Heat Wave Days Per RegionHeat Wave Days (%)Average No. of Heat Waves Per RegionAverage Duration (Days)
20013.87.01.13.4
20023.15.70.93.4
200312.923.92.16.1
20043.76.90.84.4
20050.81.60.33.2
200614.126.12.26.4
20073.66.71.03.6
20083.15.80.74.5
20090.51.00.23.3
20108.215.31.74.7

3.2. Heat Wave Related Mortality and Morbidity

The heat wave effect on deaths due to ischemic heart diseases (I20–I25) is presented in Figure 2 (left). The mean temporal course of heat waves exhibits a strong relationship between heat and mortality. With the onset of a heat wave, mortality rate deviations are increasing sharply, reaching a peak on day D+2, and subsequently declining slowly towards zero with falling temperature. The influence of heat is very direct, with a time lag of 0–1 days. Mortality rates lie continuously above the 99.5th percentile during days D+0 to D+12, confirming the highly significant heat wave effect on mortality. On average, mortality is increased by 15.2% during heat events (Table 4a), with significant differences between heat wave days and non heat wave days.
Figure 2. Mean relative deviations of IHD mortality (left) and morbidity (right) for 34-day sequences of heat waves beginning from three days before up to 30 days after the onset of the heat waves. Solid (dashed) lines denote the 99% (95%) confidence interval obtained by the Monte Carlo method, highly significant relative deviations (α < 0.01) are colored in red.
Climate 02 00133 g002
Table 4. Heat wave effects on IHD mortality: (a) Based on all heat waves during 2001–2010. Differences between individual genders (male vs. female) and IHD subtypes (I20–I22 vs. I24–I25) are significant (α < 0.05); (b) According to heat wave intensity classes (lower, medium, and upper tercile of daily mean temperature distribution during heat waves). Significant differences (α < 0.05) between intensity classes (medium/upper tercile vs. lower tercile) are marked with *; (c) According to duration of heat waves. Significant differences (α < 0.05) between duration classes (4/5–9/10–14-day length vs. 3-day length) are marked with *; (d) According to timing of heat waves (first heat wave in season or subsequent heat waves). Differences regarding timing in season are nonsignificant. (a–d) All heat wave effects in this table are significant (α < 0.05) if tested against summer (May–September) non heat wave days.
Data BaseMean Daily TemperatureNo. of Heat Wave DaysIHD Mortality Increases (%)
I20–I25I20–I25 MaleI20–I25 FemaleI20–I22I24–I25
(a) Complete Data Base:
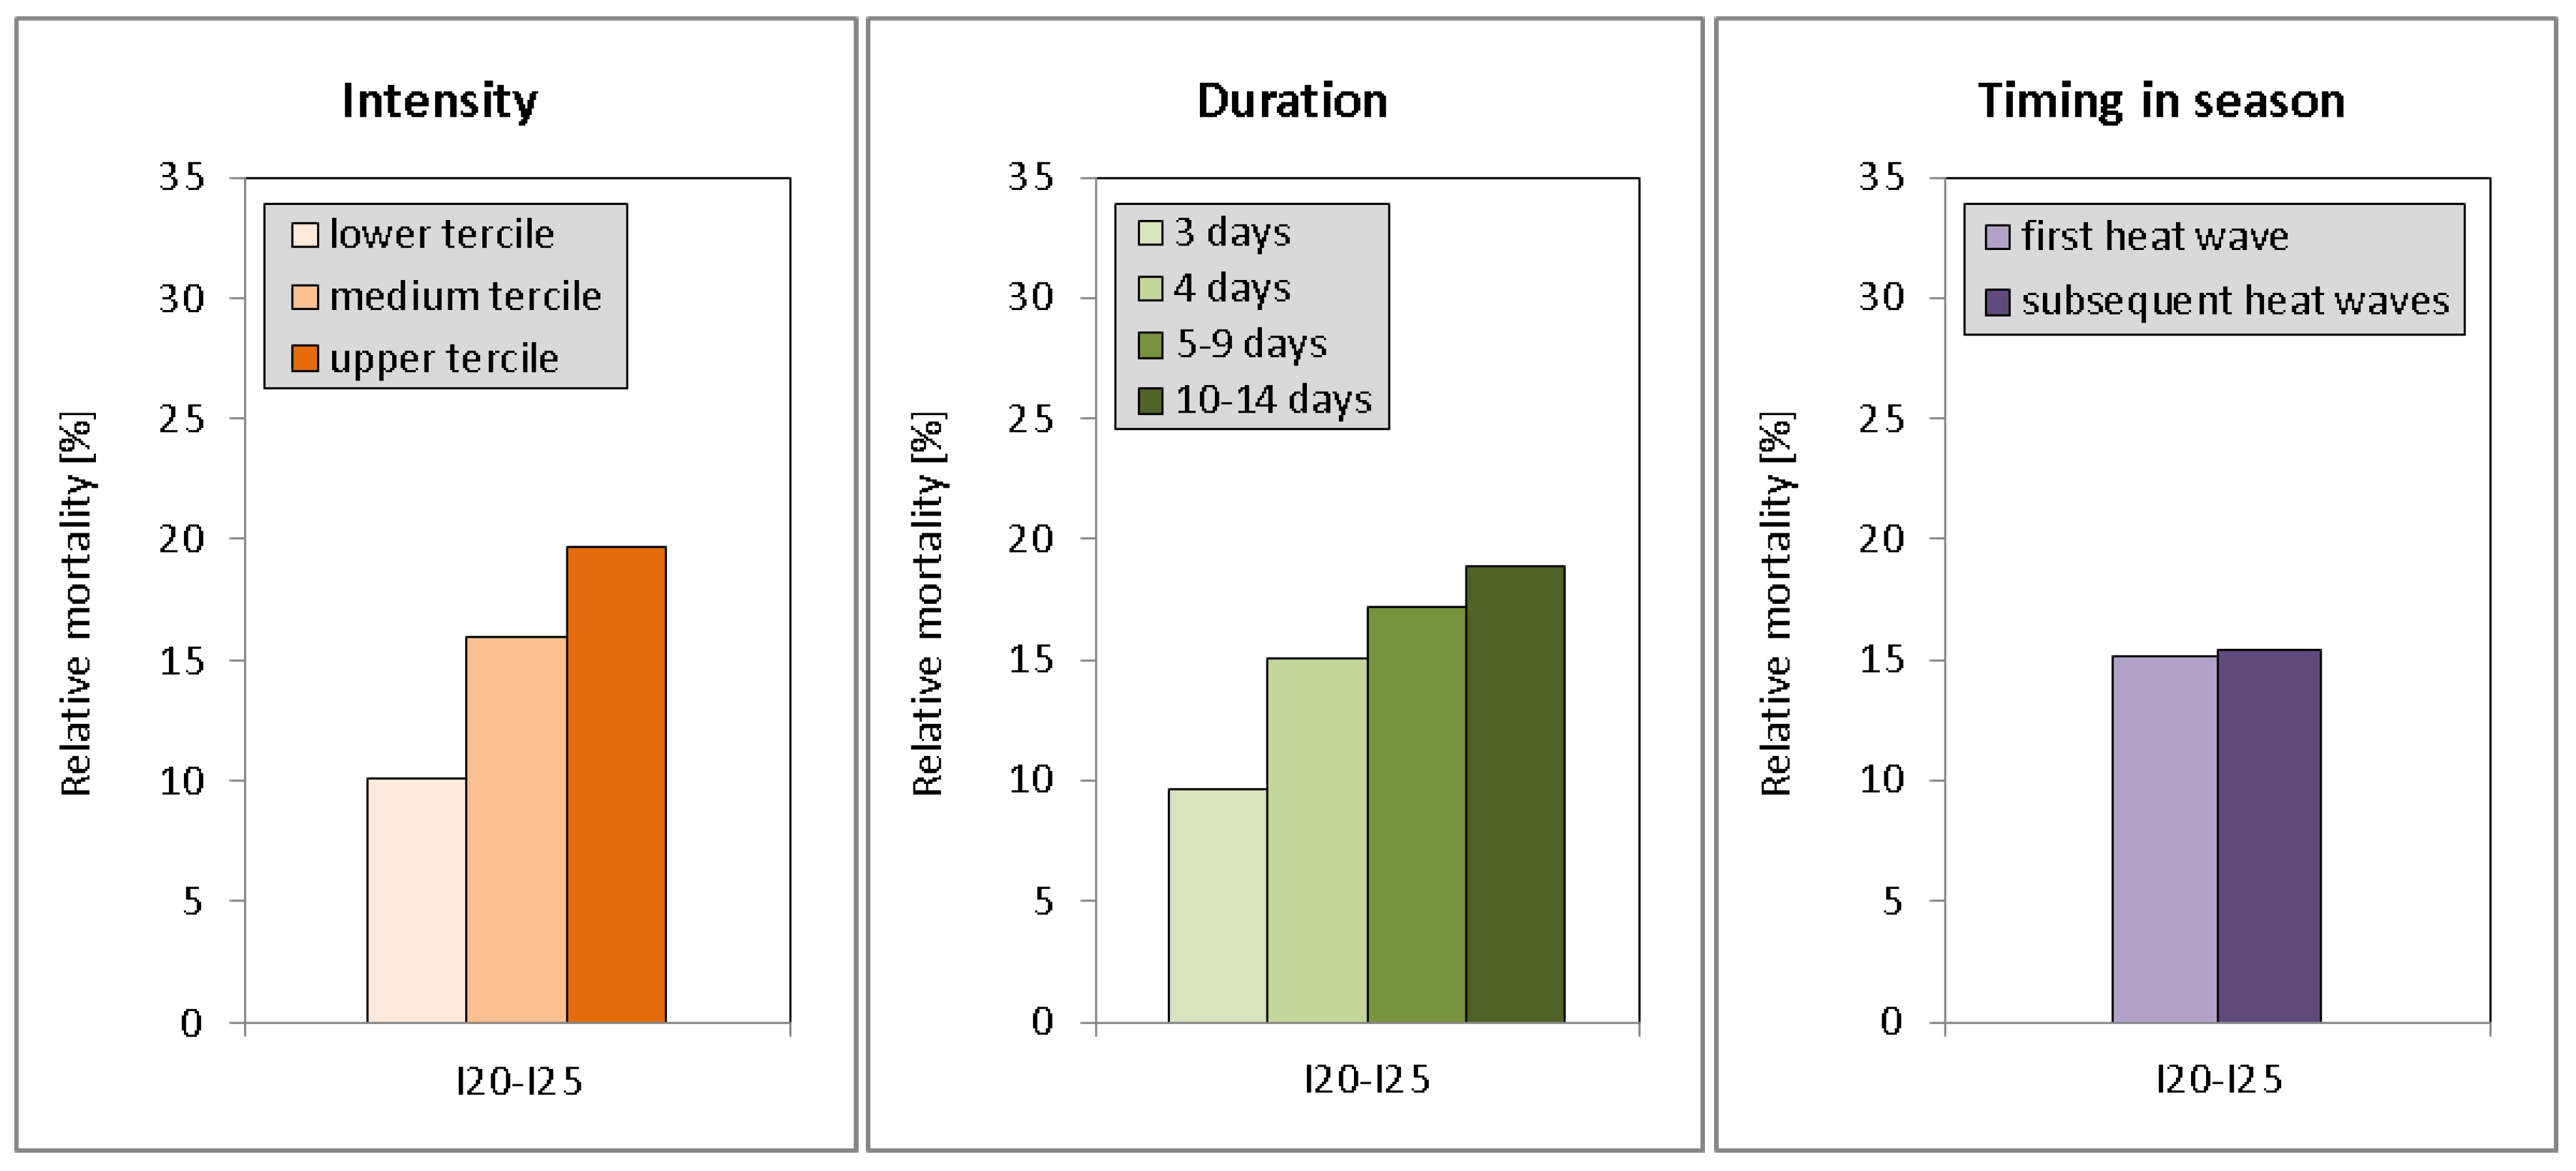
All heat waves24.7 °C102315.211.418.712.218.4
(b) Heat Wave Intensity Classes:
Lower tercile23.2 °C34110.17.411.78.712.5
Medium tercile24.4 °C34116.0*10.920.1*11.120.2*
Upper tercile26.5 °C34119.6*15.9*24.2*16.8*22.6*
(c) Duration of Heat Waves:
3 days24.1 °C29410.17.010.59.610.0
4 days24.7 °C15615.112.017.014.316.2
5–9 days24.4 °C28517.2*12.623.6*12.822.4*
10–14 days25.3 °C28818.9*16.0*26.0*15.125.0*
(d) Timing in Season:
First heat wave24.4 °C61715.111.518.213.417.3
subsequent heat waves24.9 °C40615.411.319.210.420.0
The mean temporal course of heat wave effects on IHD hospital admissions is shown in Figure 2 (right). In stark contrast to the mortality results, no significant relationship between heat and morbidity could be found. The deviations of the morbidity rate remain close to zero during the complete heat wave, with only little day-to-day variation and never exceeding values of ±2.5%. Since in our study heat waves affect IHD mortality but not morbidity, more detailed heat wave impacts (by region, gender, IHD subtype, and heat wave characteristics) will be presented only for mortality (Section 3.3).

3.3. Specific Heat Wave Related Mortality Effects

3.3.1. Regional Variations

There are strong regional variations in the heat wave effect on IHD mortality in Germany. While daily mortality rates are increased during heat waves by less than 10% in some districts, in other regions they are enhanced by up to 25% (Figure 3). Lower than average effects are observed mainly in the Southeast and in two Northwestern districts, moderate effects are seen in a broad band extending from the Northeast to the Southwest, and strongest mortality increases are found in the West (Federal State of North Rhine-Westphalia). However, due to the limited number of heat waves and the high variability of heat wave effects, only three regions show significant deviations from the national-scale mean of 15.2%.

3.3.2. Gender Differences

The investigation of heat wave effects on IHD mortality specified by gender exhibits major differences between the sexes. The heat effect is much stronger for women than for men in the majority of regions, with the exception of four adjacent regions located mainly in the Northwest featuring the opposite result (not shown). Regarding the mean temporal course of heat waves averaged over Germany, females seem to be considerably more vulnerable to heat than males (Figure 4, top). While average mortality increases for males are not exceeding 12%, the correspondent rates for females are much higher (up to 21%) and a total of ten days show highly significant deviations from the expected mortality rate. On average, during heat wave days the mortality rate is increased by 11.4% for males and by 18.7% for females (Table 4a). The gender difference is found to be significant (α < 0.05).

3.3.3. IHD Subtype Differences

The consideration of heat wave effects on mortality separately by IHD subtypes reveals large differences between the individual subtypes. In 17 of 19 regions in Germany the heat effect is stronger for I24–I25 (mainly chronic ischemic disease) than for I20–I22 (mainly myocardial infarction). Furthermore, the mean temporal course of heat waves shows the same result with higher values for I24–I25 than for I20–I22 (Figure 4, bottom). While for myocardial infarctions only four days are highly significant, for chronic ischemic diseases there are 11 days featuring highly significant mortality increases. On average, during heat wave days the mortality rate is enhanced by 12.2% for I20–I22 and by 18.4% for I24–I25 (Table 4a). The difference between the IHD subtypes is also found to be significant (α < 0.05).
Figure 3. Mean relative IHD mortality increase during heat wave days by region (2001–2010). Significant (α < 0.05) deviations from the national-scale mean (15.2%) are denoted by *. Mean temperature during heat wave days and mean duration of heat waves are given in brackets.
Climate 02 00133 g003

3.3.4. Effects of Heat Wave Characteristics

Regression analyses usually show a continuous increase in mortality with increasing temperature above a certain threshold. Therefore, it can be assumed that heat wave intensity also influences the deviation of mortality rate from its expected value. The analysis of the average temperatures during heat waves exhibits that intensity of heat waves is highly correlated with health impacts (Figure 5, left). While the least intense heat wave days are linked to about 10% more IHD deaths, the heat impact is enhanced by 16% for medium intense days and by about 20% for the most intense days. Detailed analyses also considering individual genders and IHD subtypes are presented in Table 4b. Differences between the intensity classes (upper/medium tercile vs. lower tercile) are significant for total IHD mortality and for most of the gender and disease-specific results.
Figure 4. Mean relative deviations of IHD mortality for males (top, left), females (top, right), subtypes I20–I22 (bottom, left), and subtypes I24–I25 (bottom, right) for 34-day sequences of heat waves beginning from 3 days before up to 30 days after the onset of the heat waves. Solid (dashed) lines denote the 99% (95%) confidence interval obtained by the Monte Carlo method, highly significant relative deviations (α < 0.01) are colored in red.
Climate 02 00133 g004
Figure 5. Mean relative deviations of IHD mortality according to: (left) heat wave intensity classes, (center) duration of heat waves, (right) timing of heat waves (first heat wave in season or subsequent heat waves).
Climate 02 00133 g005
The investigation of the duration effect shows that the duration of heat waves has major impacts on mortality: the longer the heat wave the higher the daily mortality increases (Figure 5, center). While heat waves with a duration of three days exhibit an average IHD mortality increase of about 10%, days during longer heat waves are associated with higher mortality increases of up to 19%. Enhanced temperatures during the longest heat waves (duration 10–14 days) may contribute to this result, but comparable daily mean temperatures during the heat waves of short and medium lengths (cf.Table 4c, second column) confirm that the duration effect is independent of the intensity effect. Considering individual genders and IHD subtypes, the general positive relationship between heat wave duration and IHD mortality is verified (Table 4c). In the majority of cases, the differences between medium or long-sized heat waves and short heat waves (5–9/10–14-day vs. three-day length) are significant.
The timing in season effect was analyzed via the classification of heat events into first-in-season or later-in-season heat waves. Overall, about 60% of heat wave days are classified as first-in-season. We found almost no difference between the two classes: both groups are associated with a mortality increase of about 15% (Figure 5, right and Table 4d). However, average intensity was lower and duration was shorter for first-in-season heat waves (temperature: 24.4 °C vs. 24.9 °C, duration: 4.4 vs. 5.9 days), which points to a masked timing in season effect. Rough estimates taking into account the differences in intensity and duration result in a small albeit not significant timing effect of 2%–3%. Differences were found between IHD subtypes and (to a lesser extent) between the individual genders: while first-in-season heat waves have higher effects than subsequent heat waves for subtypes I20-I22 and men, the opposite is found for I24-I25 and women. This suggests that a potential timing in season effect prevails mainly in males and persons with myocardial infarctions.

4. Discussion and Conclusions

In this study we provide evidence that heat waves in Germany are associated with significant excess in IHD mortality. On average, mortality increases during heat wave days by 15%, which is in line with results from studies regarding heat wave effects on total and cardiovascular mortality in the range of 10%–13% for other European countries, e.g., Austria [22], Czech Republic [23], the Netherlands [40], and Sweden [41]. The slightly higher values in this study may be due to different heat wave definitions and the restriction on persons with IHD. The mean temporal course of mortality during heat waves documents that the used heat wave definition is suitable to capture heat waves adequately. The link between heat and mortality is immediate with short time lags between the onset of the heat event and the mortality increase. Similar results are obtained by [23,39] for the Czech Republic and by [42] for Italy.
In contrast to the mortality results, no heat wave effect on hospital admissions could be found. Previous studies dealing with morbidity show a wide range of heat effects. Some authors find equally strong effects compared to mortality [43,44], but the majority of studies report weaker impacts [42,45,46,47]. Smaller or even absent impacts are observed particularly in studies that investigate heat wave effects on mortality and morbidity simultaneously [11,48,49]. The reasons for this behavior are still not well understood, one hypothesis states that deaths during heat events possibly occur very rapidly. Especially, older people living alone may not receive adequate care and medical attention during heat waves, and, therefore, may die at home before they have the chance to reach the next hospital [11,50]. However, further research is necessary to verify this hypothesis. The analyzed IHD morbidity data set shows a strong weekly course, with most admissions on Mondays and Tuesdays. More hospital admissions on Mondays are found also in other studies and are at least partially due to events with uncertain dates being coded as taking place on Mondays [51]. Furthermore, the observed weekly course is an indicator for the fact that many hospital admissions are being planned. Unfortunately, in our study it was not possible to separate planned from spontaneous (acute) hospital admissions, so that possible heat effects could be superimposed by other effects that are controlled by administrative factors. Therefore, we cannot exclude that using other morbidity indicators rather than hospital admissions, also IHD morbidity can be related to heat events.
Regional variations in the heat wave effect on IHD mortality were found to be relatively large across Germany. This is in line with the outcome of other studies, which also observe geographical differences of heat impacts, for example between coastal and inland areas in Italy [42]. The obtained findings underline the importance of long-term multi-city or multi-region studies, as investigations of heat waves for single cities or districts can mislead in the representativeness of results. Parts of the observed pattern can possibly be explained by climatic factors. For example, the relatively low heat wave effects in some Northwestern regions may be related to the maritime influence of the North Sea, which prevents an occurrence of extremely high temperatures. The strong heat wave impacts in Western Germany are at least partially due to the exceptional heat waves of August 2003, July 2006, and July 2010, each time featuring above-average mortality increases in this region. Additionally, longer average duration of heat waves in the West may also contribute to the elevated impacts. On the other hand, not all observed structures can be explained by climatic factors. For example, heat waves of similar intensity, duration, and timing in season are noticed to cause varying mortality increases in different regions. Potential reasons for the observed differences include uncertainties regarding the meteorological and mortality data sets, as well as population-specific and socioeconomic issues. Firstly, the used weather stations are primarily representative for their local environment but to a lesser extent for a larger area (for which health data were available). The thermal environment is further modified by population density (urban heat island effect) and building properties. Therefore, the individual exposition to heat is difficult to determine, particularly in spatial heterogeneous regions. Additionally, meteorological conditions not captured by the applied heat wave definition, e.g., high humidity or exceptionally high day/night-time temperatures, may be able to influence the results. Different regional reliability of the mortality data may also contribute to the observed pattern [52], as the compiling of the mono-causal mortality statistics was done by the federal states individually. Furthermore, differences in age structure, medical care quality, distance to the next hospital, socioeconomic status, and health awareness are of major importance and play a strong role for the spatial heterogeneity of heat wave effects. For example, the relatively low heat wave impacts in the city of Berlin compared to stronger effects in the surrounding rural region of Brandenburg, can at least partially be explained by differences in age structure (people aged above 60 years in 2010: 24.5%vs. 28.0% [53]) and the easier and faster access to medical care in the former area.
We were able to show significant gender differences regarding IHD mortality, with females being more vulnerable to heat than males. Most studies also find higher heat impacts for women [21,22,23], while only some authors report the opposite effect (e.g., [54]). Possible reasons for the gender differences involve population-specific factors (different age, social structures, and ethnic variability), as well as physiological mechanisms according to menopause [55] or pre-existing diseases, such as diabetes [56]. We observed smaller heat wave effects on myocardial infarctions (I20–I22) than on chronic ischemic heart diseases (I24–I25). Thus far, studies investigating heat influence on subgroups of IHD simultaneously are relatively rare. Some studies report smaller heat impacts on myocardial infarctions than on the overall number of ischemic diseases [4,57], but others do not [20]. In Germany, 55% of I20–I22 deaths and 43% of I24–I25 deaths are attributable to men. Moreover, people dying from chronic ischemic heart diseases are on average older than people dying from myocardial infarctions. Therefore, we assume that the differences between IHD subtypes are at least partly due to different gender and age structures. As for data privacy protection reasons our data set did not include age and gender for IHD subtypes, we were not able to follow up this hypothesis. Future research should incorporate age and gender specifics to verify this assumption.
We demonstrated that heat wave characteristics contribute substantially to IHD mortality. More intense heat waves lead to stronger mortality increases, a fact that is well-known for different regions of the world [7,15,24] and can be attributed to the positive temperature-mortality relationship for high ambient temperatures (e.g., [9] for 15 European cities). Additionally, the duration of heat waves is associated with the magnitude of excess mortality, which is also confirmed by previous investigations [8,15,24]. In our study, we found no timing in season effect of heat waves on mortality, contrary to results by other authors [13,15,58]. However, differences regarding intensity and duration between first and subsequent heat waves suggest at least a small masked timing effect. Seasonal acclimatization is a major reason for the timing effect and the elderly are known to have impaired acclimatization abilities. Since, in our study, the timing effect appears to be more present for men and persons with myocardial infarctions, we hypothesize that this is possibly due to the younger age of these groups, which leads to a better within-season acclimatization and reduced heat effects in later-in-season heat waves.
Previous studies have shown improved public health response due to the implementation of Heat Health Warning Systems (HHWS) [59,60,61]. In Germany, heat warnings are issued by the national meteorological service since 2005. However, only in some administrative regions an intervention chain was triggered in case of a warning by the responsible health authorities. Rough estimates show that there are only minor differences in the heat wave impact on IHD in Germany between the periods 2001–2005 and 2006–2010 (before and after the introduction of a HHWS in Germany). From the short period that has been analyzed before and after the introduction of the warning system and the differences in the character of the heat waves, e.g., heat waves were on average longer and a little bit more intense in the second five years, we cannot draw conclusions about the effectiveness of the warning system based on the available data.
Uncertainties regarding the estimation of heat wave effects on mortality involve possible confounding factors such as air pollution and forward displacement of deaths as well as changing structures in population and socioeconomic factors. Air pollution (particularly ozone and particulate matter) is reported to contribute to the impact of heat on mortality (e.g., [62,63,64]). We did not account for air pollution due to the lack of data. However, current research shows that heat wave effects in Europe are relatively robust to air pollution, with air pollutants contributing only minor to mortality during heat waves compared to temperature effects [65].
The term “mortality displacement” describes an increase in mortality during heat waves followed by a subsequent reduction after the heat wave. Such a pattern is frequently observed for heat episodes and suggests a short-term forward shift of mortality in people with impaired health who presumably would have died a few days or weeks later [40]. The magnitude of the mortality displacement effect varies strongly between individual heat waves. In a review, effects for major heat waves are reported to be mostly less than 15% [66], but other authors refer higher values (e.g., [67]). We did not investigate mortality displacement as we concentrated on daily mortality increases during heat waves and did not assess absolute numbers of deaths. However, the three weeks following the average heat wave show no indication of substantial mortality displacement (Figure 2, top).
Changing structures in age and socioeconomic factors during the period 2001–2010 may also influence the results. The increasing number of people aged above 60 years (2001: 24.1%, 2010: 26.3% [53]) is likely to enhance the subgroup of vulnerable persons. On the other hand, improved health care systems and health awareness accompanied by an increased use of air conditioning act to reduce the heat effects on mortality. However, since the study period of 10 years is comparatively short, the impacts of these potential changes are assumed to be limited.
In conclusion, the presented results show that (a) heat waves in Germany are associated with increased IHD mortality rates; (b) heat wave characteristics are strongly modulating the mortality results; and (c) heat impacts are different regarding individual regions, genders, and diseases.
The strengths of the current study consist in the estimation of heat effects specifically for ischemic heart diseases, which was analyzed relatively rarely to date, and its national-scale design which enables the estimation of area-covering heat effects and regional comparisons.
Climate change will most likely enhance the number and intensity of heat waves in Europe [68]. Therefore, the number of deaths attributed to heat is expected to increase considerably. Demographic changes are projected to additionally elevate the heat effect (higher number of potentially vulnerable persons), while long-term physiological adaptation to climate change will act in the opposite direction. Studies investigating the heat-mortality relationship are of major importance to design preventive measures, which are able to minimize the future heat wave risks. Heat health warning systems, heat wave action plans, public adaptation strategies and an enhanced use of air conditioning could help to reduce the individual heat burden. Furthermore, the heterogeneity in the heat wave impacts suggests that the implementation of gender and region specific heat wave action plans could be an appropriate strategy.

Acknowledgments

This work was funded by the Federal Environment Agency and the Federal Ministry for the Environment, Nature Conservation, Building and Nuclear Safety as part of the project UFOPLAN-371161238 “Climate change, bioclimatology and health effects” (2012–2014), embedded in the German Adaptation Strategy to climate change. We would like to kindly thank Urban Janisch (Research Data Centre of the Statistical Office of the Länder) for his help providing the mortality and morbidity data. We are also thankful to Daniela Bernhard for preparing the data sets and to Angelika Grätz and Christina Endler, German Meteorological Service, for remarks on an earlier version of the manuscript. We would also like to thank two anonymous reviewers for their helpful comments.

Author Contributions

All authors contributed extensively to the work presented in this paper. Hans-Guido Mücke supervised the project, Christina Koppe assembled the input data, and Stefan Zacharias analyzed the output data. Stefan Zacharias wrote the main paper, and Christina Koppe and Hans-Guido Mücke wrote parts of the manuscript. All authors discussed the results and implications and commented on the manuscript at all stages.

Conflicts of Interest

The authors declare no conflict of interest.

References

  1. Gosling, S.N.; Lowe, J.A.; McGregor, G.R.; Pelling, M.; Malamud, B.D. Associations between elevated atmospheric temperature and human mortality: A critical review of the literature. Clim. Chang. 2009, 92, 299–341. [Google Scholar]
  2. Anderson, B.G.; Bell, M.L. Weather-related mortality: How heat, cold, and heat waves affect mortality in the United States. Epidemiology 2009, 20, 205–213. [Google Scholar] [CrossRef]
  3. Basu, R. High ambient temperature and mortality: A review of epidemiologic studies from 2001 to 2008. Environ. Health 2009. [Google Scholar] [CrossRef]
  4. Ostro, B.; Rauch, S.; Green, R.; Malig, B.; Basu, R. The effects of temperature and use of air conditioning on hospitalizations. Am. J. Epidemiol. 2010, 172, 1053–1061. [Google Scholar] [CrossRef]
  5. Green, R.S.; Basu, R.; Malig, B.; Broadwin, R.; Kim, J.J.; Ostro, B. The effect of temperature on hospital admissions in nine California counties. Int. J. Public Health 2010, 55, 113–121. [Google Scholar] [CrossRef]
  6. Larsen, J. Setting the Record Straight: More than 52,000 Europeans Died from Heat in Summer 2003. Available online: http://www.earth-policy.org/plan_b_updates/2006/update56 (assessed on 27 March 2014).
  7. Hajat, S.; Armstrong, B.; Baccini, M.; Biggeri, A.; Bisanti, L.; Russo, A.; Paldy, A.; Menne, B.; Kosatsky, T. Impact of high temperatures on mortality: Is there an added heat wave effect? Epidemiology 2006, 17, 632–638. [Google Scholar] [CrossRef]
  8. Gasparrini, A.; Armstrong, B. The impact of heat waves on mortality. Epidemiology 2011, 22, 68–73. [Google Scholar] [CrossRef]
  9. Baccini, M.; Biggeri, A.; Accetta, G.; Kosatsky, T.; Katsouyanni, K.; Analitis, A.; Anderson, H.R.; Bisanti, L.; D’Ippoliti, D.; Danova, J.; et al. Heat effects on mortality in 15 European cities. Epidemiology 2008, 19, 711–719. [Google Scholar] [CrossRef]
  10. Chung, J.Y.; Honda, Y.; Hong, Y.C.; Pan, X.C.; Guo, Y.L.; Kim, H. Ambient temperature and mortality: An international study in four capital cities of East Asia. Sci. Total Environ. 2009, 408, 390–396. [Google Scholar] [CrossRef]
  11. Kovats, R.S.; Hajat, S.; Wilkinson, P. Contrasting patterns of mortality and hospital admissions during hot weather and heat waves in Greater London, UK. Occup. Environ. Med. 2004, 61, 893–898. [Google Scholar] [CrossRef]
  12. Michelozzi, P.; Accetta, G.; de Sario, M.; D’Ippoliti, D.; Marino, C.; Baccini, M.; Biggeri, A.; Anderson, H.R.; Katsouyanni, K.; Ballester, F.; et al.; PHEWE Collaborative Group High temperature and hospitalizations for cardiovascular and respiratory causes in 12 European cities. Am. J. Respir. Crit. Care Med. 2009, 179, 383–389. [Google Scholar] [CrossRef]
  13. Díaz, J.; Jordán, A.; García, R.; López, C.; Alberdi, J.C.; Hernández, E.; Otero, A. Heat waves in Madrid 1986–1997: Effects on the health of the elderly. Int. Arch. Occup. Environ. Health 2002, 75, 163–170. [Google Scholar] [CrossRef]
  14. Hajat, S.; Kovats, R.S.; Atkinson, R.W.; Haines, A. Impact of hot temperatures on death in London: A time series approach. J. Epidemiol. Commun. Health 2002, 56, 367–372. [Google Scholar] [CrossRef]
  15. Anderson, G.B.; Bell, M.L. Heat waves in the United States: Mortality risk during heat waves and effect modification by heat wave characteristics in 43 U.S. communities. Environ. Health Perspect. 2011, 119, 210–218. [Google Scholar] [CrossRef]
  16. Flynn, A.; McGreevy, C.; Mulkerrin, E.C. Why do older patients die in a heatwave? QJM 2005, 98, 227–229. [Google Scholar] [CrossRef]
  17. Cheng, X.; Su, H. Effects of climatic temperature stress on cardiovascular diseases. Eur. J. Intern. Med. 2010, 21, 164–167. [Google Scholar] [CrossRef]
  18. Nawrot, T.S.; Staessen, J.A.; Fagard, R.H.; van Bortel, L.M.; Struijker-Boudier, H.A. Endothelial function and outdoor temperature. Eur. J. Epidemiol. 2005, 20, 407–410. [Google Scholar] [CrossRef]
  19. Havenith, G. Temperature Regulation, Heat Balance and Climatic Stress. In Extreme Weather Events and Public Health Responses; Springer-Berlin: Heidelberg, Germany, 2005; pp. 69–80. [Google Scholar]
  20. Basu, R.; Ostro, B.D. A multicounty analysis identifying the populations vulnerable to mortality associated with high ambient temperature in California. Am. J. Epidemiol. 2008, 168, 632–637. [Google Scholar] [CrossRef]
  21. Hajat, S.; Kovats, R.S.; Lachowycz, K. Heat-related and cold-related deaths in England and Wales: Who is at risk? Occup. Environ. Med. 2007, 64, 93–100. [Google Scholar]
  22. Hutter, H.P.; Moshammer, H.; Wallner, P.; Leitner, B.; Kundi, M. Heatwaves in Vienna: Effects on mortality. Wien. Klin. Wochenschr. 2007, 119, 223–227. [Google Scholar] [CrossRef]
  23. Kyselý, J.; Plavcová, E.; Davídkovová, H.; Kynčl, J. Comparison of hot and cold spell effects on cardiovascular mortality in individual population groups in the Czech Republic. Clim. Res. 2011, 49, 113–129. [Google Scholar] [CrossRef]
  24. D’Ippoliti, D.; Michelozzi, P.; Marino, C.; de’Donato, F.; Menne, B.; Katsouyanni, K.; Kirchmayer, U.; Analitis, A.; Medina-Ramón, M.; Paldy, A.; et al. The impact of heat waves on mortality in 9 European cities: Results from the EuroHEAT project. Environ. Health 2010. [Google Scholar] [CrossRef]
  25. Bittner, M.I. Effects of heat waves on mortality in Germany. Gesundheitswesen 2013. [Google Scholar] [CrossRef]
  26. Hoffmann, B.; Hertel, S.; Boes, T.; Weiland, D.; Jöckel, K.H. Increased cause-specific mortality associated with 2003 heat wave in Essen, Germany. J. Toxicol. Environ. Health A 2008, 71, 759–765. [Google Scholar] [CrossRef]
  27. Hertel, S.; le Tertre, A.; Jöckel, K.H.; Hoffmann, B. Quantification of the heat wave effect on cause-specific mortality in Essen, Germany. Eur. J. Epidemiol. 2009, 24, 407–414. [Google Scholar] [CrossRef]
  28. Federal Statistical Office of Germany. Gesundheit: Todesursachen in Deutschland 2010; Fachserie 12, Reihe 4; Statistisches Bundesamt: Wiesbaden, Germany, 2011. [Google Scholar]
  29. Federal Statistical Office of Germany. Gesundheit: Diagnosedaten der Patienten und Patientinnen in Krankenhäusern 2010 (einschließlich Sterbe- und Stundenfälle); Fachserie 12, Reihe 6.2.1; Statistisches Bundesamt: Wiesbaden, Germany.
  30. Koppe, C.; Jendritzky, G. Inclusion of short-term adaptation to thermal stresses in a heat load warning procedure. Meteorol. Z. 2005, 14, 271–278. [Google Scholar] [CrossRef]
  31. Schönwiese, C.D. Praktische Statistik für Meteorologen und Geowissenschaftler, 2nd ed.; Gebrüder Bornträger: Berlin, Germany, 1992. [Google Scholar]
  32. Laschewski, G.; Jendritzky, G. Effects of the thermal environment on human health: An investigation of 30 years daily mortality data from SW Germany. Clim. Res. 2002, 21, 91–103. [Google Scholar] [CrossRef]
  33. Taubenheim, J. Statistische Auswertung Geophysikalischer und Meteorologischer Daten. In Geographische Monographien; Buchheim, W., Fanselau, G., Hiller, W., Menzel, H., Eds.; Akademische Verlagsgesellschaft Geest & Pertig K.-G.: Leipzig, Germany, 1969; pp. 311–345. [Google Scholar]
  34. Robinson, P.J. On the definition of a heat wave. J. Appl. Meteorol. 2001, 40, 762–775. [Google Scholar] [CrossRef]
  35. Barnett, A.G.; Tong, S.; Clements, A.C.A. What measure of temperature is the best predictor of mortality? Environ. Res. 2010, 110, 604–611. [Google Scholar] [CrossRef] [Green Version]
  36. Yu, W.; Guo, Y.; Ye, X.; Wang, X.; Huang, C.; Pan, X.; Tong, S. The effect of various temperature indicators on different mortality categories in a subtropical city of Brisbane, Australia. Sci. Total Environ. 2011, 409, 3431–3437. [Google Scholar] [CrossRef] [Green Version]
  37. Lin, Y.K.; Chang, C.K.; Li, M.H.; Wu, Y.C.; Wang, Y.C. High-temperature indices associated with mortality and outpatient visits: Characterizing the association with elevated temperature. Sci. Total Environ. 2012, 427, 41–49. [Google Scholar]
  38. Morabito, M.; Crisci, A.; Messeri, A.; Capecchi, V.; Modesti, P.A.; Gensini, G.F.; Orlandini, S. Environmental temperature and thermal indices: What is the most effective predictor of heat-related mortality in different geographical contexts? Sci. World J. 2014. [Google Scholar] [CrossRef]
  39. Kyselý, J.; Plavcová, E. Declining impacts of hot spells on mortality in the Czech Republic, 1986–2009: Adaptation to climate change? Clim. Chang. 2012, 113, 437–453. [Google Scholar] [CrossRef]
  40. Huynen, M.M.; Martens, P.; Schram, D.; Weijenberg, M.P.; Kunst, A.E. The impact of heat waves and cold spells on mortality rates in the Dutch population. Environ. Health Perspect. 2001, 109, 463–470. [Google Scholar] [CrossRef]
  41. Rocklov, J.; Barnett, A.G.; Woodward, A. On the estimation of heat-intensity and heat-duration effects in time series models of temperature-related mortality in Stockholm, Sweden. Environ. Health 2012. [Google Scholar] [CrossRef] [Green Version]
  42. Morabito, M.; Crisci, A.; Moriondo, M.; Profili, F.; Francesconi, P.; Trombi, G.; Orlandini, S. Air temperature-related human health outcomes: Current impact and estimations of future risks in Central Italy. Sci. Total Environ. 2012, 441, 28–40. [Google Scholar] [CrossRef]
  43. Nitschke, M.; Tucker, G.R.; Bi, P. Morbidity and mortality during heatwaves in metropolitan Adelaide. Med. J. Aust. 2007, 187, 662–665. [Google Scholar]
  44. Tong, S.; Wang, X.Y.; Barnett, A.G. Assessment of heat-related health impacts in Brisbane, Australia: Comparison of different heatwave definitions. PLoS One 2010. [Google Scholar] [CrossRef] [Green Version]
  45. Mastrangelo, G.; Fedeli, U.; Visentin, C.; Milan, G.; Fadda, E.; Spolaore, P. Pattern and determinants of hospitalization during heat waves: An ecologic study. BMC Public Health 2007. [Google Scholar] [CrossRef]
  46. ström, D.O.; Forsberg, B.; Rocklöv, J. Heat wave impact on morbidity and mortality in the elderly population: A review of recent studies. Maturitas 2011, 69, 99–105. [Google Scholar]
  47. Wang, X.Y.; Barnett, A.G.; Yu, W.; FitzGerald, G.; Tippett, V.; Aitken, P.; Neville, G.; McRae, D.; Verrall, K.; Tong, S. The impact of heatwaves on mortality and emergency hospital admissions from non-external causes in Brisbane, Australia. Occup. Environ. Med. 2012, 69, 163–169. [Google Scholar] [CrossRef]
  48. Johnson, H.; Kovats, R.S.; McGregor, G.; Stedman, J.; Gibbs, M.; Walton, H.; Cook, L.; Black, E. The impact of the 2003 heat wave on mortality and hospital admissions in England. Health Stat. Q. 2005, 25, 6–11. [Google Scholar]
  49. Williams, S.; Nitschke, M.; Weinstein, P.; Pisaniello, D.L.; Parton, K.A.; Bi, P. The impact of summer temperatures and heatwaves on mortality and morbidity in Perth, Australia 1994–2008. Environ. Int. 2012, 40, 33–38. [Google Scholar] [CrossRef]
  50. Semenza, J.C.; McCullough, J.E.; Flanders, W.D.; McGeehin, M.A.; Lumpkin, J.R. Excess hospital admissions during the July 1995 heat wave in Chicago. Am. J. Prev. Med. 1999, 16, 269–277. [Google Scholar] [CrossRef]
  51. Barnett, A.G.; Dobson, A.J. Is the increase in coronary events on Mondays an artifact? Epidemiology 2004, 15, 583–588. [Google Scholar] [CrossRef]
  52. Löwel, H.; Döring, A.; Heier, M.; Meisinger, C.; Schneider, A.; Kaup, U.; Gösele, U.; Hymer, H. Gesundheitsberichterstattung des Bundes. In Koronare Herzkrankheiten und akuter Myokardinfarkt; Robert-Koch-Institut: Berlin, Germany, 2006; pp. 1–35. [Google Scholar]
  53. Federal Statistical Office of Germany. Bevölkerung und Erwerbstätigkeit: Bevölkerungsfortschreibung 2010; Fachserie 1, Reihe 1.3; Statistisches Bundesamt: Wiesbaden, Germany, 2012. [Google Scholar]
  54. Robine, J.M.; Michel, J.P.; Herrmann, F.R. Excess male mortality and age-specific mortality trajectories under different mortality conditions: A lesson from the heat wave of summer 2003. Mech. Ageing Dev. 2012, 133, 378–386. [Google Scholar] [CrossRef]
  55. Rosano, G.M.; Vitale, C.; Marazzi, G.; Volterrani, M. Menopause and cardiovascular disease: The evidence. Climacteric 2007, 10, 19–24. [Google Scholar]
  56. Winston, G.J.; Barr, R.G.; Carrasquillo, O.; Bertoni, A.G.; Shea, S. Sex and racial/ethnic differences in cardiovascular disease risk factor treatment and control among individuals with diabetes in the Multi-Ethnic Study of Atherosclerosis (MESA). Diabetes Care 2009, 32, 1467–1469. [Google Scholar] [CrossRef]
  57. Urban, A.; Davídkovová, H.; Kyselý, J. Heat-and cold-stress effects on cardiovascular mortality and morbidity among urban and rural populations in the Czech Republic. Int. J. Biometeorol. 2013. [Google Scholar] [CrossRef]
  58. Páldy, A.; Bobvos, J.; Vámos, A.; Kovats, R.S.; Hajat, S. The Effect of Temperature and Heat Waves on Daily Mortality in Budapest, Hungary, 1970–2000. In Extreme Weather Events and Public Health Responses; Springer-Berlin: Heidelberg, Germany, 2005; pp. 99–107. [Google Scholar]
  59. Fouillet, A.; Rey, G.; Wagner, V.; Laaidi, K.; Empereur-Bissonnet, P.; le Tertre, A.; Frayssinet, P.; Bessemoulin, P.; Laurent, F.; de Crouy-Chanel, P.; et al. Has the impact of heat waves on mortality changed in France since the European heat wave of summer 2003? A study of the 2006 heat wave. Int. J. Epidemiol. 2008, 37, 309–317. [Google Scholar] [CrossRef]
  60. Bassil, K.L.; Cole, D.C. Effectiveness of public health interventions in reducing morbidity and mortality during heat episodes: A structured review. Int. J. Environ. Res. Public Health 2010, 7, 991–1001. [Google Scholar] [CrossRef]
  61. Morabito, M.; Profili, F.; Crisci, A.; Francesconi, P.; Gensini, G.F.; Orlandini, S. Heat-related mortality in the Florentine area (Italy) before and after the exceptional 2003 heat wave in Europe: An improved public health response? Int. J. Biometeorol. 2012, 56, 801–810. [Google Scholar] [CrossRef]
  62. Bell, M.L.; McDermott, A.; Zeger, S.L.; Samet, J.M.; Dominici, F. Ozone and short-term mortality in 95 US urban communities, 1987–2000. JAMA 2004, 292, 2372–2378. [Google Scholar] [CrossRef]
  63. Samoli, E.; Analitis, A.; Touloumi, G.; Schwartz, J.; Anderson, H.R.; Sunyer, J.; Bisanti, L.; Zmirou, D.; Vonk, J.M.; Pekkanen, J.; Goodman, P.; et al. Estimating the exposure-response relationships between particulate matter and mortality within the APHEA multicity project. Environ. Health Perspect. 2005, 113, 88–95. [Google Scholar]
  64. Burkart, K.; Canário, P.; Breitner, S.; Schneider, A.; Scherber, K.; Andrade, H.; Alcoforado, M.J.; Endlicher, W. Interactive short-term effects of equivalent temperature and air pollution on human mortality in Berlin and Lisbon. Environ. Pollut. 2013, 183, 54–63. [Google Scholar] [CrossRef]
  65. Analitis, A.; Michelozzi, P.; D’Ippoliti, D.; de’Donato, F.; Menne, B.; Matthies, F.; Atkinson, R.W.; Iñiguez, C.; Basagaña, X.; Schneider, A.; et al. Effects of heat waves on mortality: Effect modification and confounding by air pollutants. Epidemiology 2014, 25, 15–22. [Google Scholar] [CrossRef]
  66. Martiello, M.A.; Giacchi, M.V. High temperatures and health outcomes: A review of the literature. Scand. J. Public Health 2010, 38, 826–837. [Google Scholar] [CrossRef]
  67. Saha, M.V.; Davis, R.E.; Hondula, D.M. Mortality displacement as a function of heat event strength in 7 US cities. Am. J. Epidemiol. 2014, 179, 467–474. [Google Scholar] [CrossRef]
  68. Meehl, G.A.; Tebaldi, C. More intense, more frequent, and longer lasting heat waves in the 21st century. Science 2004, 305, 994–997. [Google Scholar] [CrossRef]

