Regional Landsat-Based Drought Monitoring from 1982 to 2014


National Center for Remote Sensing, National Council for Scientific Research (CNRS), Riad al Soloh, Beirut 1107 2260, Lebanon
*
Author to whom correspondence should be addressed.
Climate 2015, 3(3), 563-577; https://doi.org/10.3390/cli3030563
Submission received: 21 May 2015
/
Revised: 9 July 2015
/
Accepted: 3 August 2015
/
Published: 7 August 2015
Abstract
:Drought is a serious natural hazard with far-reaching impacts including soil damages, economic losses, and threatening the livelihood and health of local residents. The goal of the present work was to monitor the vegetation health across Lebanon in 2014 using remote sensing techniques. Landsat images datasets, with a spatial resolution of 30 m and from different platforms, were used to identify the VCI (Vegetation Condition Index) and TCI (Temperature Condition Index). The VCI was based on the Normalized Difference Vegetation Index (NDVI) datasets. The TCI used land surface temperature (LST) datasets. As a result, the VHI (Vegetation Health Index) was produced and classified into five categories: extreme, severe, moderate, mild, and no drought. The results show practically no extreme drought (~0.27 km2) in the vegetated area in Lebanon during 2014. Moderate to severe drought mainly occurred in the north of Lebanon (i.e., the Amioun region and the plain of Akkar). The Tyr region and the Bekaa valley experienced a low level of drought (mild drought). This approach allows decision makers to monitor, investigate and resolve drought conditions more effectively.
1. Introduction
Drought is a worldwide phenomenon that threatens the future of water and food supplies, as well as the global economy. Since 1900, more than eleven million people have died as a consequence of drought and more than two billion have been affected by drought, which is more than any other physical hazard [1]. Drought is generally defined as an extended period—a season, a year, or several years—of deficient precipitation compared with the statistical multi-year average for a region that results in a water shortage for some activity, group, or environmental sector [2]. While research in the early 1980’s uncovered more than 150 published definitions of drought [3], Wilhite & Glantz (1985) [4] classified drought into four types: meteorological, hydrological, agricultural, and socioeconomic. The first three approaches are more common and deal with ways to measure drought as a physical phenomenon [5]. The last approach associates the supply and demand of some economic good with elements of meteorological, hydrological, and agricultural drought.
Drought can be described by three characteristics (i.e., intensity, duration and spatial coverage), which can be assessed by the usage of drought indices [4]. Drought indices are mainly special combinations of indicators, which are based primarily on meteorological and hydrological data. For example, the Palmer Drought Severity Index [6,7] has been widely used by the U.S. Department of Agriculture to determine when to grant emergency drought assistance. The SPI (Standardized Precipitation Index) [8] is an index based upon the probability of precipitation for any time scale. The CMI (Crop Moisture Index) [9] reflects moisture supply in the short term across major crop-producing regions and is not intended to assess long-term droughts. The RDI (Reclamation Drought Index) is calculated at the river basin level, incorporating temperature as well as precipitation, snowpack, streamflow, and reservoir levels as inputs [10]. The Vegetation Health index (VHI) [11] is based on a combination of products extracted from vegetation signals, namely the Normalized Difference Vegetation Index (NDVI) and the Land Surface Temperature (LST), both of which are initially derived from the NOAA Advanced Very High Resolution Radiometer (AVHRR) sensor. A complete analysis of drought indices is provided by Wilhite (2005) [12].
Satellite-based remote sensing has been widely used over the past decades, from a national to a global scale, to monitor many environmental activities, including drought. It provides continuous spatial and temporal measurements as well as a historical record of conditions across large geographic areas. Globally, drought monitoring has been studied extensively through different types of satellite sensors, such as Grace [13], MODIS [14,15,16], AMSR-E [17,18] and AVHRR [19,20,21,22], or even a combination of two sensors (i.e., AMSR-E and MODIS) [23]. Other studies in the region [24,25,26,27,28,29] were based on AVHRR or MODIS with a coarse spatial resolution (i.e., 1 km and 250 m, respectively).
In this paper, vegetative regions in Lebanon were examined during 2014. First, both NDVI and LST datasets were processed and interpreted across Lebanon using Landsat satellite images with a spatial resolution of 30 m. Later, the VHI was produced, identifying drought zones in this country.
2. Study Area
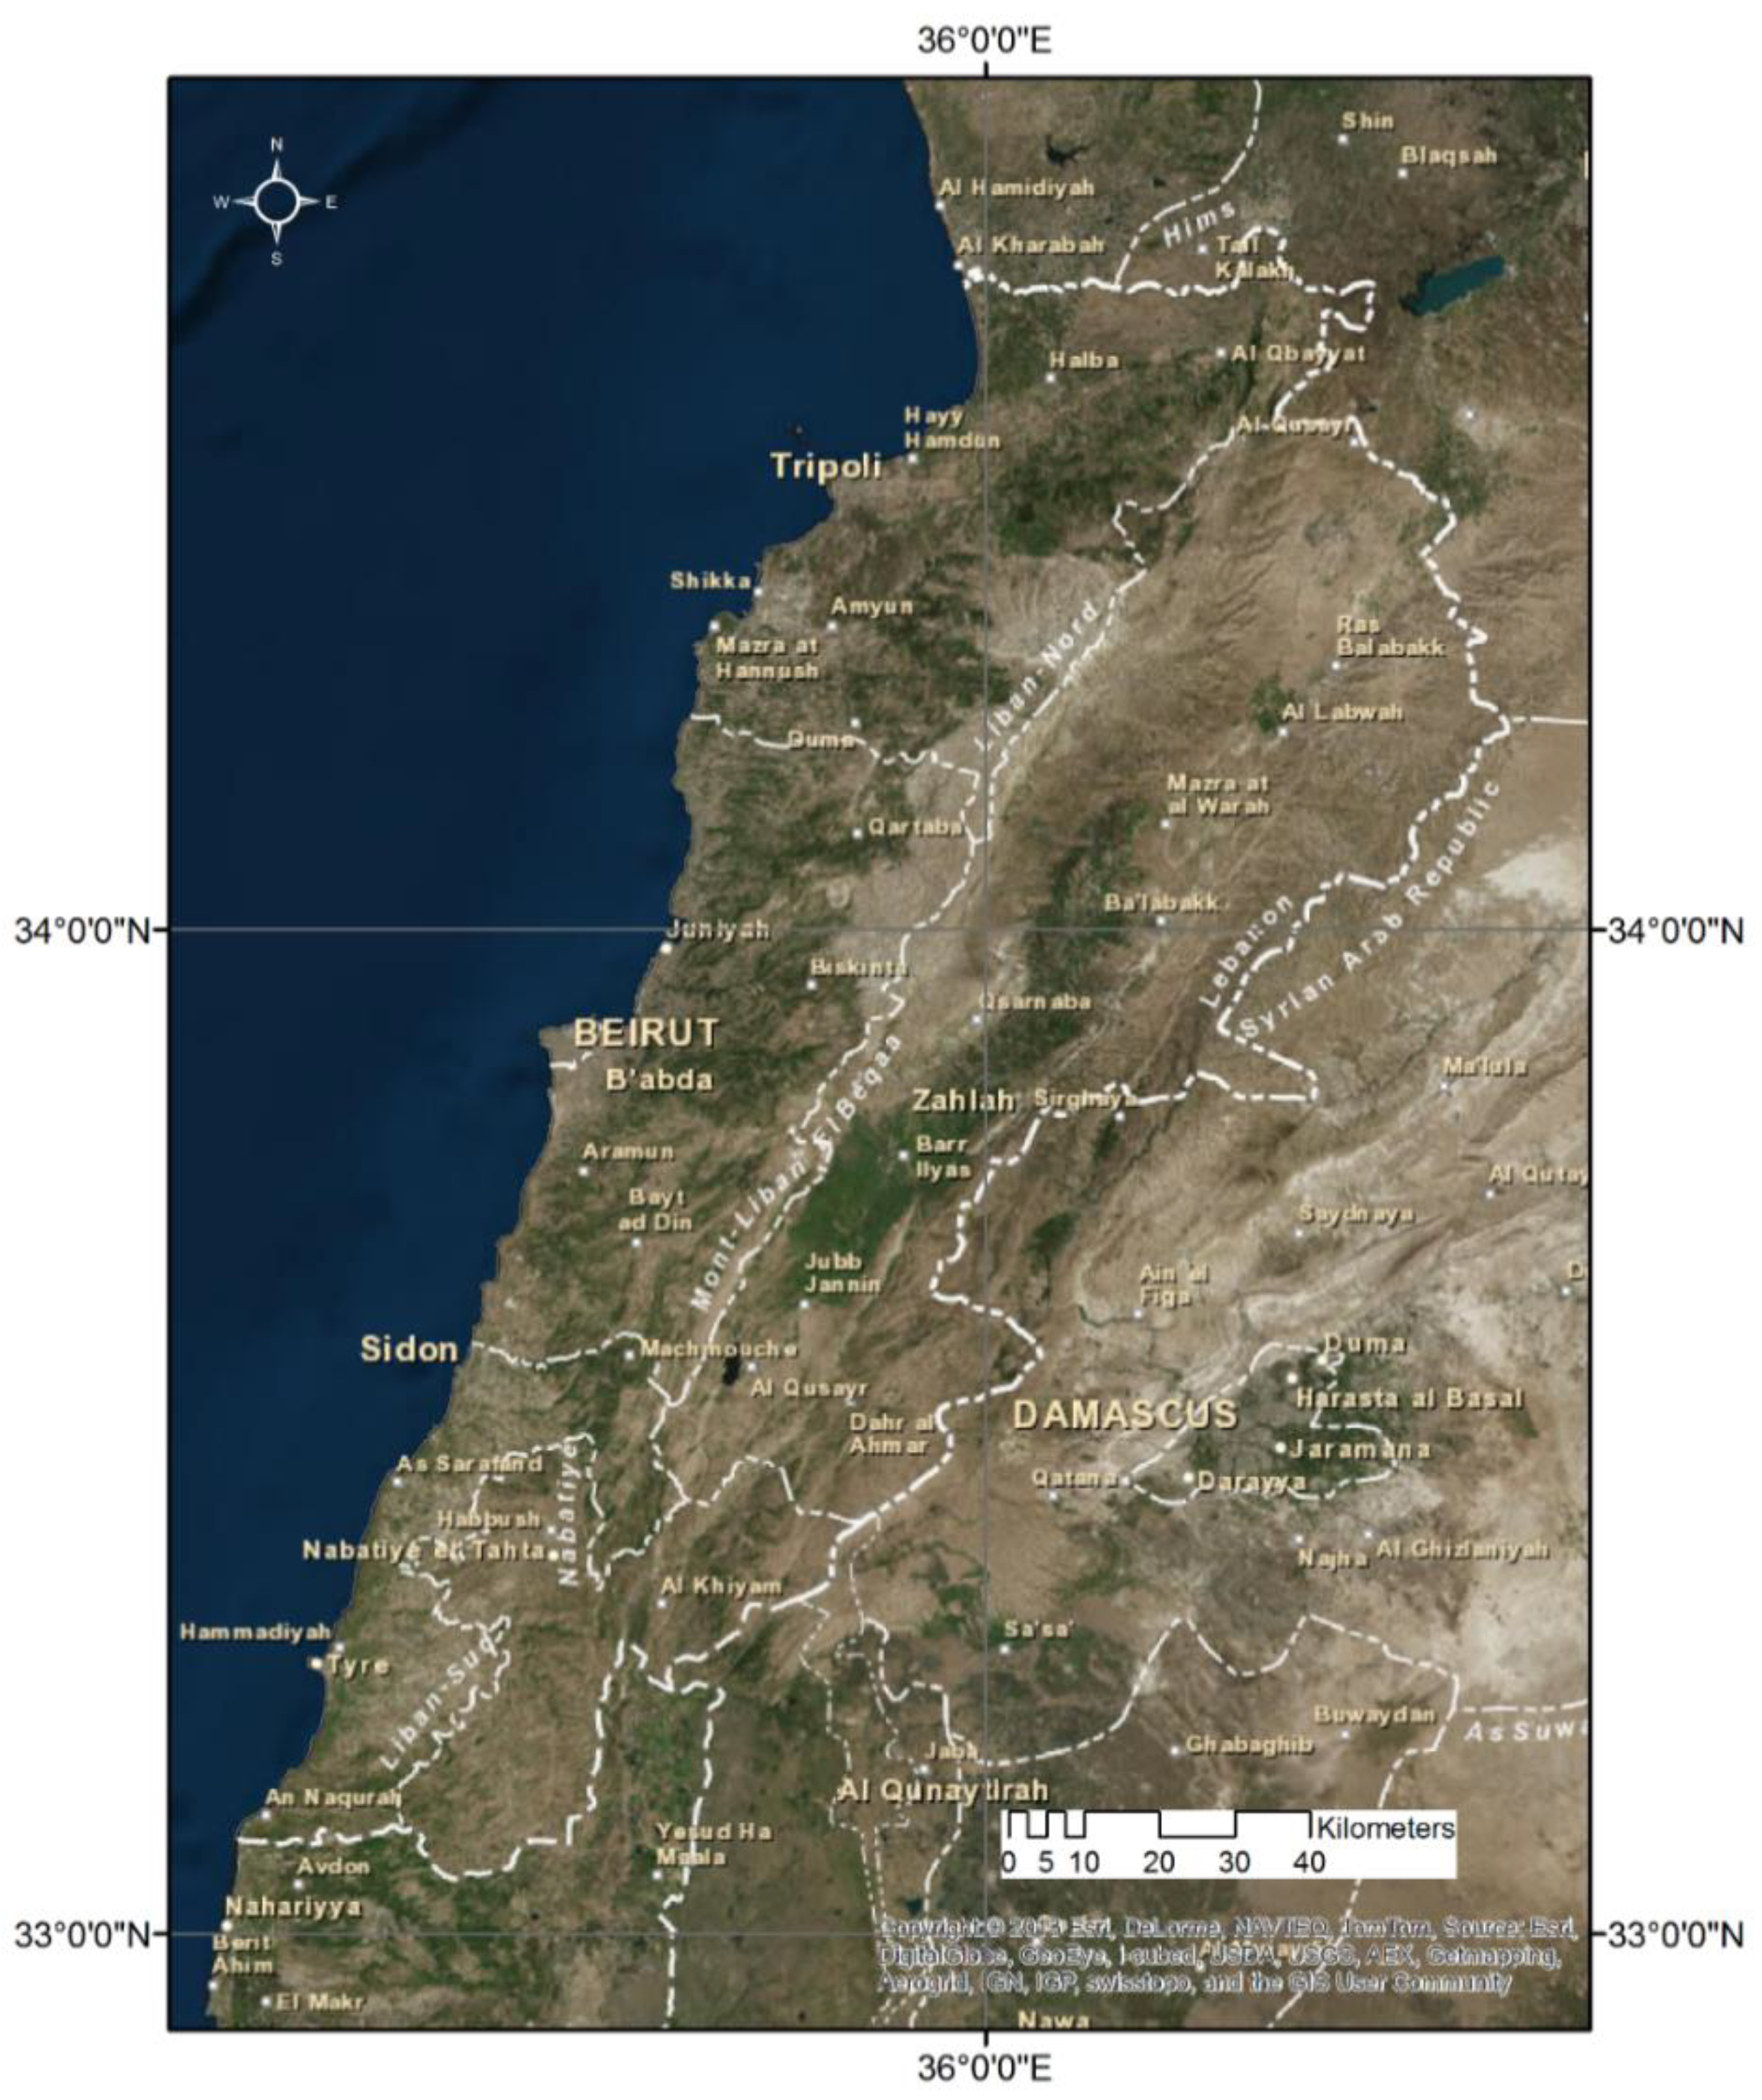
Lebanon (Figure 1) is a small country located at 33°52'19"N and 35°30'35"E. It is perched on two mountain ranges named the Mount-Lebanon and the anti-Lebanon, with a valley throughout the middle named the Bekaa. Lebanon has a prevailing Mediterranean climate characterized by a hot, dry summer, and a cool, rainy winter. Semi-arid and arid areas exist in the North of the Bekaa valley.
Figure 1.
National geographic map of Lebanon.

Lebanon’s annual rainfall exceeds 800 million cubic meters, which helps maintain more than 2000 fountains during the dry season that lasts about seven months. However, with the annual decline in the proportion of successive rainfall and its distribution throughout the year, drought conditions have been exacerbated during the past two years (i.e., 2012–2013). As of 2014, Lebanon was facing a summer drought after a record dry winter coupled by a massive influx of Syrian refugees and long-standing water management problems. This drought lowered the groundwater level and decreased the flow of the springs. A direct consequence is the threat to the agricultural sector in this country. Long-term solutions begin with the monitoring of the drought areas, which is the aim of this study.
3. Data and Methods
3.1. Data Background
Landsat datasets were downloaded from the U.S. Geological Survey website (i.e., landsat.usgs.gov). Only the months of March, April and May were included. These months reflect the highest vegetation proliferation per year. The datasets were a combination of four different satellites: Landsat 4 and 5 (launched on 16 July 1982 and 1 March 1984, respectively) containing 28 satellite images; Landsat 7 (launched on 15 April 1999) including 26 satellite images; and Landsat 8 (launched on 11 February 2013) with 11 satellite images. Landsat images are a collection of high resolution satellite imagery, with a spatial resolution of 30 m, provided in a standardized, orthorectified format.
3.2. Methodology
3.2.1. NDVI
In general, a Normalized Difference Vegetation Index (NDVI) is calculated using the reflectance of the red and the near infrared bands. While red is the third band for Landsat 4, 5 and 7, it is the fourth band for Landsat 8. The infrared is band number 4 for Landsat 4, 5 and 7, whereas it is band 5 for Landsat 8. As a result, the NDVI was calculated as follows:
where NDVI values range between −1 and 1.
3.2.2. LST
Thermal bands were used for the determination of the land surface temperature (LST). This is the sixth band for Landsat 4, 5 and 7 and bands 10–11 for Landsat 8. Satellite TIR sensors measure top of the atmosphere (TOA) radiances, from which brightness temperatures can be derived using Plank’s law [30]. The formulas used at each step for the conversion of the digital number to land surface temperature are presented in Table 1.

| Processing Steps | Formulas | |
|---|---|---|
| Conversion of DN (Digital Number) to At-Satellite Brightness Temperature |
| |
| Calculation of the Land Surface Temperature in Kelvin |
| |
| Conversion from Kelvin to Celsius |
|
The K1 and K2 constants for the Landsat sensors are provided in Table 2. The values of the center wavelength (λ) for the different thermal bands are listed in Table 3. In addition, it is important to note that we only used band 10 from Landsat 8 due to the larger calibration uncertainty associated with TIRS band 11. It is recommended that users rely on TIRS Band 10 data as a single spectral band and should not attempt a split-window correction for atmospheric correction [32].
| Constant | Landsat 4 | Landsat 5 | Landsat 7 | Landsat 8 (Band 10) | Landsat 8 (Band 11) |
|---|---|---|---|---|---|
| K1 (watts/meter squared * ster * μm) | 671.62 | 607.76 | 666.09 | 774.89 | 480.89 |
| K2 (Kelvin) | 1284.30 | 1260.56 | 1282.71 | 1321.08 | 1201.14 |
| Satellite | Band | Center Wavelength (μm) |
|---|---|---|
| Landsat 4, 5, and 7 | 6 | 11.45 |
| Landsat 8 | 10 | 10.8 |
| Landsat 8 | 11 | 12 |
3.2.3. VCI, TCI and VHI
The Vegetation Condition Index (VCI), the Temperature Condition Index (TCI), and the Vegetation Health Index (VHI) have been further developed using the following equations [33]:
where:
- NDVI, NDVImin, and NDVImax are the seasonal average of the smoothed weekly NDVI, its multiyear absolute minimum and its maximum, respectively;
- Tc, Tmin, and Tmax are similar values for land surface temperature in Celsius.
| Drought | Values |
|---|---|
| Extreme | <10 |
| Severe | <20 |
| Moderate | <30 |
| Mild | <40 |
| No | ≥40 |
While the NDVI shows seasonal vegetation dynamics, the VCI rescales vegetation dynamics between 0 and 100 to reflect relative changes in the moisture condition from extremely bad to optimal [34,35]. High VCI values correspond to healthy and unstressed vegetation. On the other hand, low TCI values correspond to vegetation stress due to high temperature and dryness [36]. The VCI, TCI and VHI have been classified in Table 4.
Figure 2.
Methodology flowchart for the VHI calculation.
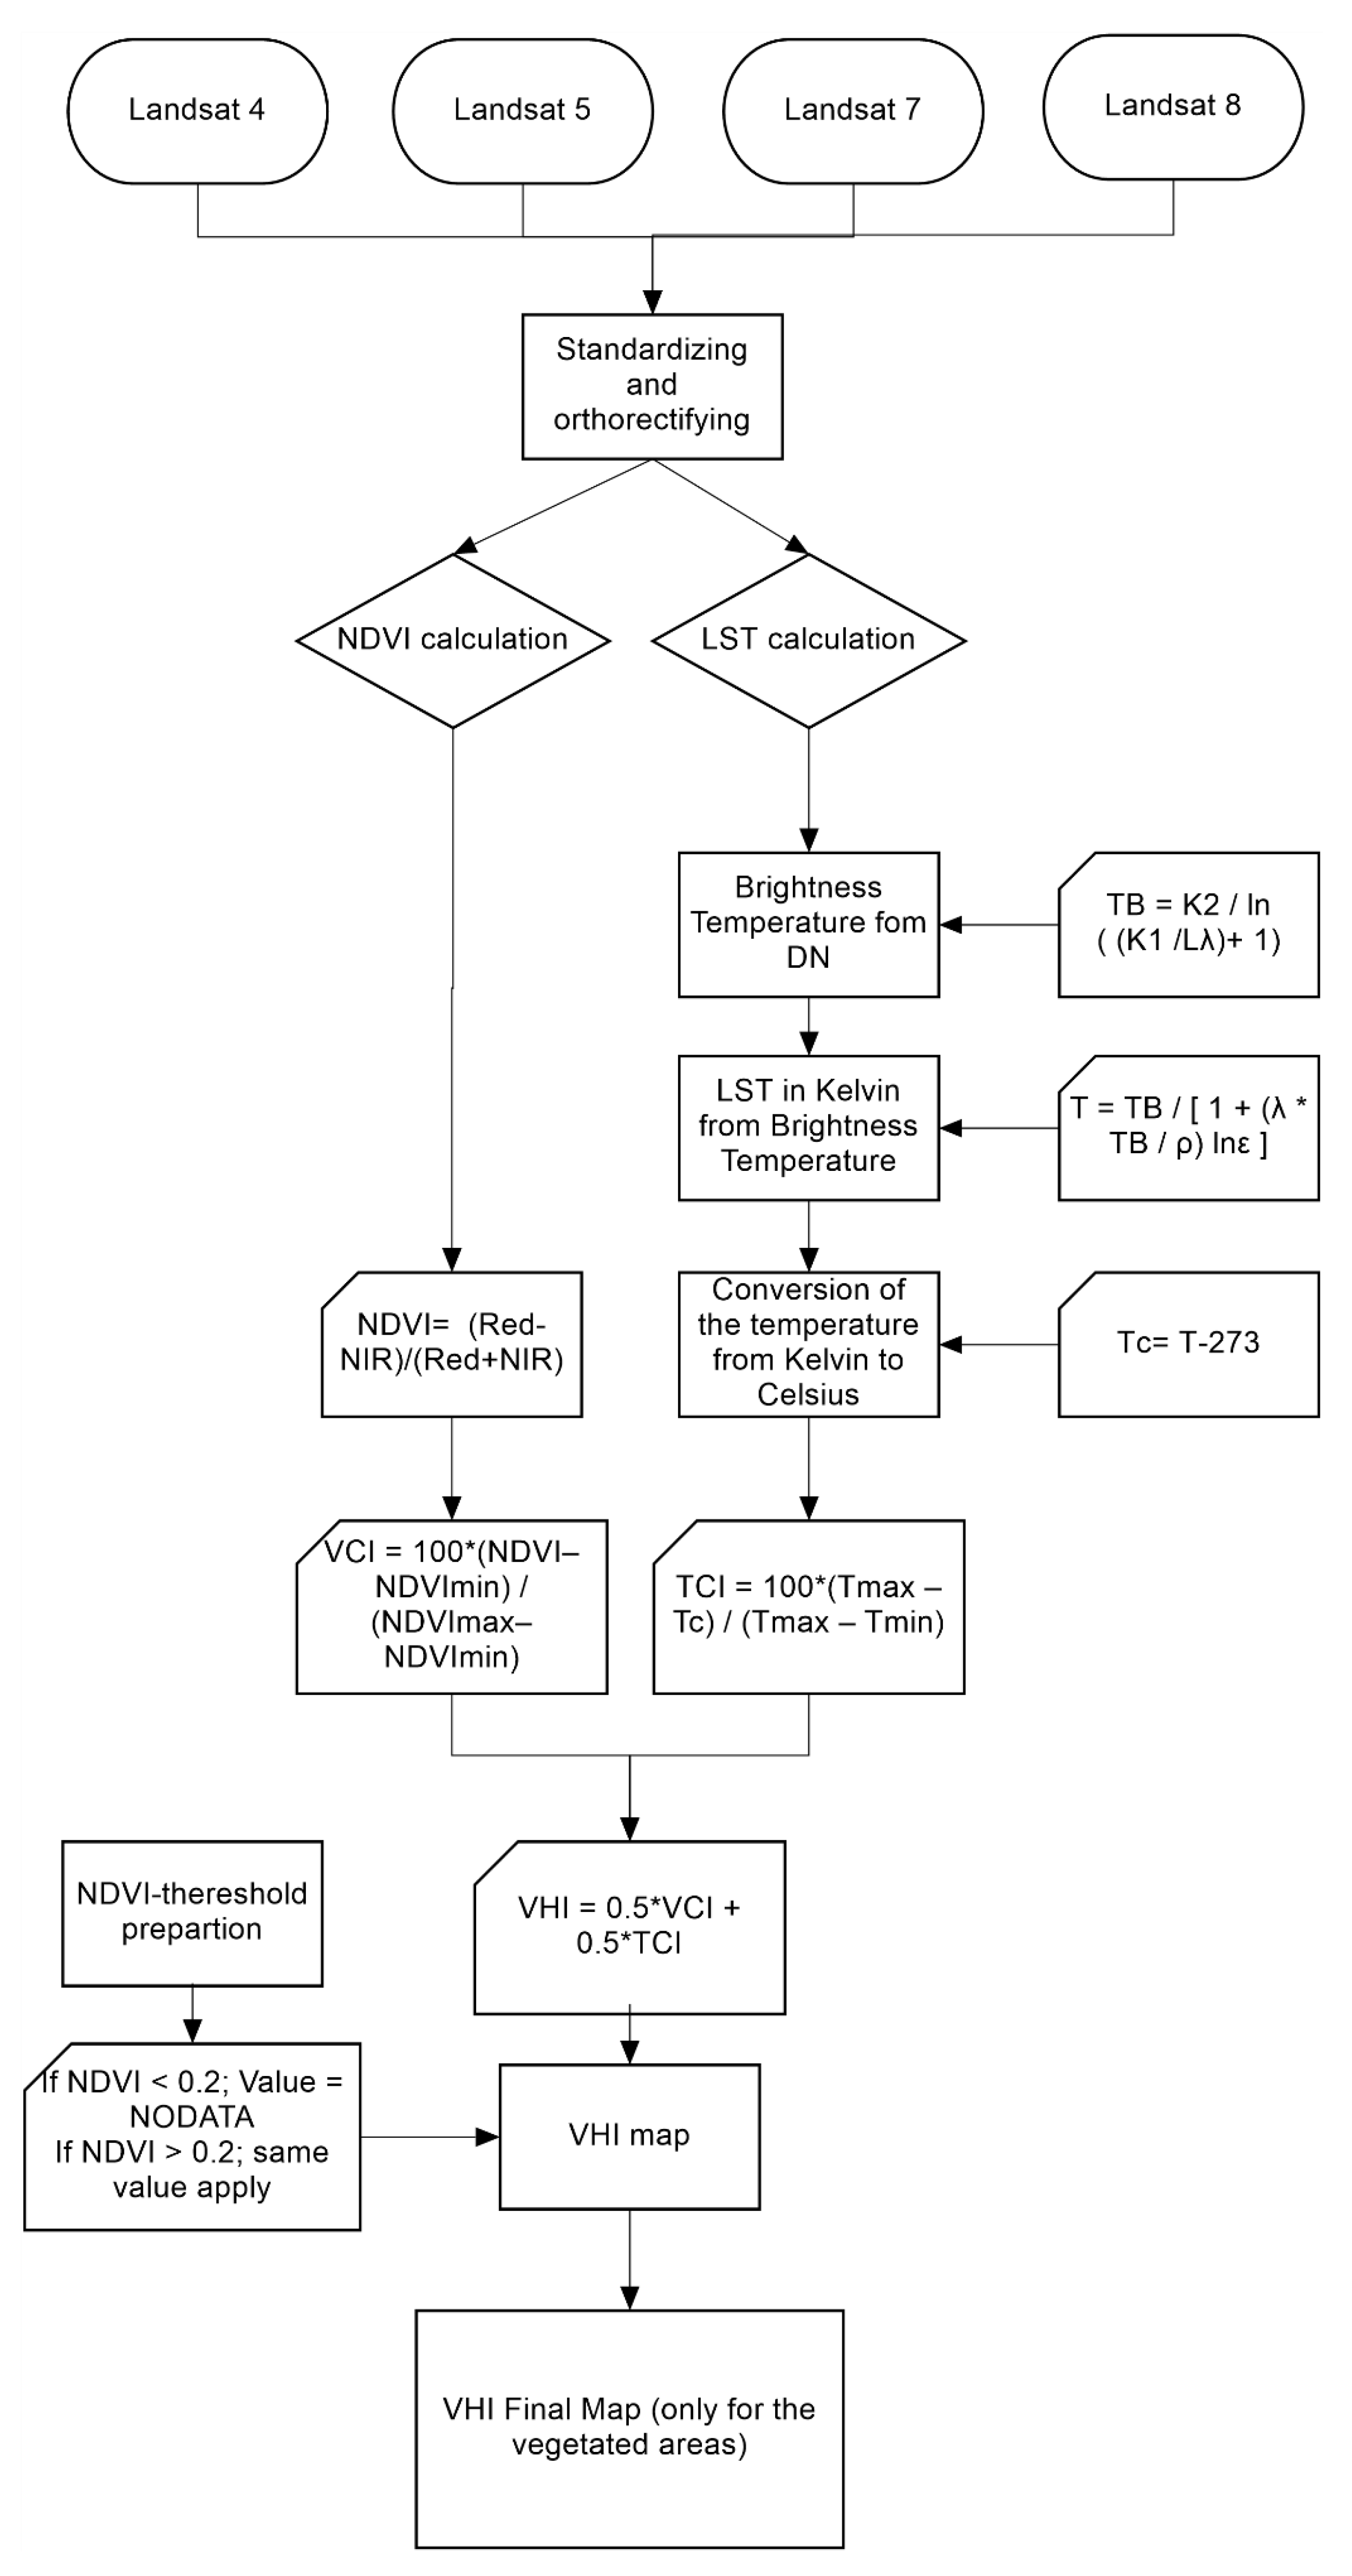
Water, snow or ice, urban areas and bare soil were excluded from the final map with the usage of a condition applied to the NDVI map for 27 May 2014, as follows:
where 0.2 is the threshold value for the vegetated area.
This last output was named “NDVI-threshold”. A final step would be the combination of the VHI and the “NDVI-threshold” to generate a new VHI map where only vegetated areas are included. The methodology flowchart is presented in Figure 2.
The same processes were applied between 1982 and 2002 to provide the drought condition (TCI, VCI and VHI) for 2002.
4. Results
VCI and TCI maps were produced (Figure 3). In the first, the most affected areas are in the north and south of Lebanon, located generally at the coast. In addition, Bekaa valley, particularly in the middle region of the valley, also shows an extreme drought condition. However, no prevailing drought situation is observed across the country. On the other hand, the TCI map indicates a severe to extreme drought in the northern Lebanese regions. The southern part of Lebanon shows a dominant mild to no drought condition.
Figure 3.
VCI (left) and TCI (right) variations in Lebanon, 2014.

As a result, the VHI index was generated for the time period between 1982 and 2014 (Figure 4). Almost no extreme drought (~0.27 km2) was detected in the vegetated area of Lebanon (Table 5). Moderate to severe drought, representing nearly 4 percent of the total vegetated area, was mainly located in the north of Lebanon (i.e., the Amioun region and the plain of Akkar). This is also evident in the Tyr region (in South Lebanon), and in the middle of the Bekaa valley area, i.e., Joub Jannine, Anjar and Riyak. Mild drought, covering an area of 907 km2, was registered all across Lebanon. However, the Tyr region, the Bekaa valley, as well as the plain of Akkar constituted the largest mild drought areas.
Figure 4.
Vegetation Health Index (VHI) classes in Lebanon, 2014.

| Drought | Area in km2 | Area in Percentage |
|---|---|---|
| Extreme | 0.27 | <0.01 |
| Severe | 22.62 | 0.32 |
| Moderate | 268.41 | 3.80 |
| Mild | 907.35 | 12.84 |
| No | 5868.79 | 83.04 |
5. Discussion
The VCI, TCI and VHI were designed to characterize the moisture (VCI), thermal (TCI) and total vegetation health (VHI) conditions in response to weather impacts. The VHI was generated for Lebanon for 2014. It is a combination of the NDVI and LST. Most of the Lebanese regions showed mild to no drought conditions in the vegetated areas (~96 percent). In addition, extreme drought was unnoticed even at a high resolution of 30 m. This means that the vegetation cover in Lebanon has been almost stable for the last three decades.
However, moderate to severe drought occurred in four main locations: the Tyr region (in the South), the Amioun region (in the North), the plain of Akkar (in the North), and in the middle of the Bekaa valley. These areas can be classified into three categories according to the origin of the factor affecting the severity of the drought; the first, containing the Tyr region and the Bekaa valley, where the variation in the NDVI indicated this drought; the second, which includes the plain of Akkar, where the difference in temperature has affected the drought condition in this region; the third, including the Amioun region, where the vegetation condition (NDVI) as well as the land surface temperature increased the drought in this area.
In fact, the main cause of the drought in Tyr is the change in agriculture production in this region. Citrus in Tyr was generally exported to other Arabian countries, especially to the Gulf region, through Syria. After the outbreak of the Syrian civil war, which began in the early spring of 2011, cultivation gradually changed from citrus (e.g., oranges, lemons, citrus) to banana plantations. First, Lebanese citrus faces many competitors such as Egypt and Turkey due to the transit problem through Syria. Second, banana cultivation has a better market locally and regionally. Third, even though the profit from selling banana is not as much as that from citrus, land owners prefer to sell, and that is what counts for them. However, banana trees need up to two years to reach adulthood. As a result, the NDVI values were decreased in the Tyr region. As for the Bekaa valley, the variation in the NDVI was mainly affected by the increasing amount of bare land in the region. Cities, where much more opportunities are available, are attracting new generations, mostly teenagers. Agricultural land has been left uncultivated. Because bare land has lower NDVI values, the NDVI for the Bekaa valley was lowered accordingly.
North Lebanon, mainly in the Amioun region as well as in the plain of Akkar, is the area most affected by temperature variations (Figure 3, right). In fact, this region is located at a low altitude and a high latitude area. Global warming could be the main cause. Moreover, Syrians refugees are constructing shelters over the agriculture areas of the plain. As a consequence, the plain of Akkar has been classified as being under drought conditions according to the VHI map (Figure 4). As for the Amioun area, the increasing temperature has caused serious disease outbreaks: olive agriculture has been affected (Figure 5). Peacock eye disease, for example, destroys the chlorophyll in trees, weakening them and reducing their ability to produce fruit. While Amioun is home to 2 million olive trees—22 percent of Lebanon’s total crop—the decreasing chlorophyll quantities in these trees has resulted in a reduction in their NDVI values (Figure 3, left). As a result, the VHI map indicates a moderate to severe drought in the Amioun area.
Figure 5.
Olive tree repartitioning in the Amioun region on the VHI map.

In 2002 (Figure 6), low TCI values seemed to affect the northern part of Lebanon, similar to 2014. However, droughts were less intense with a smaller extent and severity. This proves the effect of climate change in this Lebanese region. In 2002, the VCI showed a moderate to extreme drought in the Bekaa valley. As a result, the low interest in the agriculture fields as a source of income has been present since 2002. It is clearly evident that the drought in Akkar, Amioun and Tyr could not be identified from the 2002 VHI map. This shows that the effect of climate change, including the Syrian refugees’ constructions, the disease outbreak (e.g., peacock eye disease), as well as the changes in agriculture production are all recently reported problems. In conclusion, the drought extent and severity in 2002 (i.e., 1.08 percent of the total area) was much less pronounced than in 2014 (i.e., 16.97 percent). It is an alarming situation that needs to be addressed to prevent further deterioration of the drought conditions over the Lebanese region.
Figure 6.
TCI (upper-left), VCI (upper-right) and VHI (bottom) variations in Lebanon, 2002.

Finally, observing the actual drought condition in comparison to a large time scale—between 1982 and 2014—is one of the main important components of this research. At a spatial resolution of 30 m, drought was accurately identified, and this will help decision makers in their assessments and reductions of this phenomenon. The combination of the temperature and the vegetation-moisture conditions to produce a drought map has a greater advantage than focusing on one variable only. However, the use of diverse sensors (i.e., TM, ETM+, and OLI) equipped on different Landsat platforms (i.e., Landsat 4, 5, 7 and 8) could represent a limitation of the study. Ortho-rectification and validation by visual interpretation are necessary, particularly because it is a pixel-based method. Moreover, the sensors that detect the NDVI and LST have different ranges, which may result in some uncertainties in the study. The different spatial resolutions between these satellites is also a weakness. A straight-forward solution would be the resampling of the datasets. In addition, noises, clouds, unidentified areas, etc. alter the values of the pixel and its surroundings. While the elimination of these regions seems the most plausible solution, data loss is the main disadvantage. Added to these constraints, we were only able to collect an average of two images per year. Sufficient numbers of ground stations are also lacking in our region. Any attempt to calibrate our results with climatic data would be impossible. Regardless, the VHI is used as a drought detection tool based on the assumption that the NDVI and LST at a given pixel size will vary inversely over time, with variations in the VCI and TCI driven by local moisture conditions. As a result, an examination of their trends, particularly because of the dissimilar climatic zones in our study area and the long study period, would validate our results. However, Kanieli et al. (2010) [37] stated that only when energy (i.e. higher latitude and elevations) is the limiting factor—which is not the case here—for vegetation growth, a positive correlation exists between the LST and NDVI and makes their use unacceptable.
6. Conclusions
Many advanced remote sensing instruments (e.g., MODIS, TRMM, SPOT Vegetation, AMSR-E, AMSU, GRACE, etc.) have been launched to collect information to monitor different aspects of drought. The development of advanced processing and analysis techniques and improved computing capabilities have resulted in new approaches that can be used for drought monitoring.
In this paper, the Vegetation Condition Index (VCI), resulting from the Normalized Difference Vegetation Index (NDVI), and the Temperature Condition Index (TCI), derived from Land Surface Temperature (LST), were combined to produce a Vegetation Health Index (VHI) map for 2014. This map has a spatial resolution of 30 m and includes all Lebanese vegetated areas. The drought regions were highlighted and they cover the Amioun region, the plains of Bekaa and Akkar, as well as the Tyr area; almost no extreme drought was registered.
However, the accuracy of the results depends much more on the spatial resolution and quality of the input data than on the methodology itself. For future studies, higher temporal and spatial resolutions are recommended. Adding other drought-inducing factors are also suggested as a way to achieve a higher representation of the actual drought status. Our mapping method is rapid, straightforward and principally fed by remote sensing data. It provides a flexible tool, and is applicable for a wide variety of regions, especially in emerging countries where technical facilities and historical in-situ measurements are lacking. Policy makers in Lebanon are invited to investigate and assess drought regions more effectively through our outputs.
A major conclusion is that three different types of drought regions exist. In the North, drought is due to increased temperature in addition to the pressure caused by the Syrians refugees. In Amioun, it is the combination of the temperature and NDVI changes: a disease outbreak exacerbated the problem. The third reason is the NDVI reduction. This was caused by a shift to growing bananas, which require up to two years to reach adulthood and to be detected as vegetation from the satellite sensors (i.e., the Tyr region), and the increase in the extent of bare land (i.e., the Bekaa plain).
Author Contributions
Faour Ghaleb and Mhawej Mario carried out the main part of writing, although all coauthors contributed to the text. The research was carried out by all co-authors, comprising both processing work and also data analysis.
Conflicts of Interest
The authors declare no conflict of interest.
References
- Food and Agriculture Organization of the United Nations. Drought Facts. Available online: http://www.fao.org/docrep/017/aq191e/aq191e.pdf (accessed on 15 June 2015).
- Niemeyer, S. New drought indices. In Proceedings of the 1st International Conference Drought Management: Scientific and Technological Innovations, Zaragoza, Spain, 2–14 June 2008.
- The National Drought Mitigation Center (NDMC). University of Nebraska, Lincoln. Available online: http://drought.unl.edu/DroughtBasics/TypesofDrought.aspx (accessed on 19 October 2014).
- Wilhite, D.A.; Michael, H.G. Understanding: The drought phenomenon: The role of definitions. Water Int. 1985, 10, 111–120. [Google Scholar] [CrossRef]
- Dai, A. Drought under global warming: A review. Wiley Interdiscip. Rev. 2011, 2, 45–65. [Google Scholar] [CrossRef]
- Palmer, W.C. Meteorological Drought; Office of Climatology, U.S. Weather Bureau: Washington, DC, USA, 1965.
- Huang, S.; Devendra, D.; Claudia, Y.; Gyanesh, C.; Liu, S. Integration of Palmer Drought Severity Index and remote sensing data to simulate wetland water surface from 1910 to 2009 in Cottonwood Lake area, North Dakota. Remote Sens. Environ. 2011, 115, 3377–3389. [Google Scholar] [CrossRef]
- McKee, T.B.; Doesken, N.J.; Kleist, J. The relationship of drought frequency and duration to time scales. In Proceedings of the 8th Conference on Applied Climatology; American Meteorological Society: Boston, MA, USA, 1993; Volume 17, pp. 179–183. [Google Scholar]
- Palmer, W.C. Keeping track of crop moisture conditions, nationwide: The new crop moisture index. Weatherwise 1968. [Google Scholar] [CrossRef]
- Hayes, M.J. What is Drought? Drought Indices. Available online: http://drought.unl.edu/planning/monitoring/comparisonofindicesintro.aspx (accessed on 20 June 2015).
- Tucker, C.J.; Vanpraet, C.; Boerwinkel, E.; Gaston, E.A. Satellite remote sensing of total dry matter production in the Senegalese Sahel. Remote Sens. Environ. 1983, 13, 461–474. [Google Scholar] [CrossRef]
- Wilhite, D.A. Drought and Water Crises: Science, Technology, and Management Issues; CRC Press: Boca Raton, FL, USA, 2005. [Google Scholar]
- Di, L.; Shen, Y.; Sun, A.; Hong, Y.; Longuevergne, L.; Yang, Y.; Li, B.; Chen, L. Drought and flood monitoring for a large karst plateau in Southwest China using extended GRACE data. Remote Sens. Environ. 2014, 155, 145–160. [Google Scholar]
- Caccamo, G.; Chisholm, L.A.; Bradstock, R.A.; Puotinen, M.L. Assessing the sensitivity of MODIS to monitor drought in high biomass ecosystems. Remote Sens. Environ. 2011, 115, 2626–2639. [Google Scholar] [CrossRef]
- Rhee, J.; Im, J.; Carbone, G.J. Monitoring agricultural drought for arid and humid regions using multi-sensor remote sensing data. Remote Sens. Environ. 2010, 114, 2875–2887. [Google Scholar] [CrossRef]
- Zhang, X.; Susan Moran, M.; Zhao, X.; Liu, S.; Zhou, T.; Ponce-Campos, G.E.; Liu, F. Impact of prolonged drought on rainfall use efficiency using MODIS data across China in the early 21st century. Remote Sens. Environ. 2014, 150, 188–197. [Google Scholar] [CrossRef]
- Mladenova, I.E.; Jackson, T.J.; Njoku, E.; Bindlish, R.; Chan, S.; Cosh, M.H.; Holmes, T.R.H.; de Jeu, R.A.M.; Jones, L.; Kimball, J.; et al. Remote monitoring of soil moisture using passive microwave-based techniques—Theoretical basis and overview of selected algorithms for AMSR-E. Remote Sens. Environ. 2014, 144, 97–213. [Google Scholar]
- Zhang, A.; Jia, G. Monitoring meteorological drought in semiarid regions using multi-sensor microwave remote sensing data. Remote Sens. Environ. 2013, 134, 12–23. [Google Scholar] [CrossRef]
- Bayarjargal, Y.; Karnieli, A.; Bayasgalan, M.; Khudulmur, S.; Gandush, C.; Tucker, C.J. A comparative study of NOAA–AVHRR derived drought indices using change vector analysis. Remote Sens. Environ. 2006, 105, 9–22. [Google Scholar] [CrossRef]
- Rojas, O.; Vrieling, A.; Rembold, F. Assessing drought probability for agricultural areas in Africa with coarse resolution remote sensing imagery. Remote Sens. Environ. 2011, 115, 343–352. [Google Scholar] [CrossRef]
- Ji, L.; Peters, A.J. Assessing vegetation response to drought in the northern Great Plains using vegetation and drought indices. Remote Sens. Environ. 2003, 87, 85–98. [Google Scholar] [CrossRef]
- Unganai, L.S.; Kogan, F.N. Drought monitoring and corn yield estimation in Southern Africa from AVHRR data. Remote Sens. Environ. 1998, 63, 219–232. [Google Scholar] [CrossRef]
- Choi, M.; Hur, Y. A microwave-optical/infrared disaggregation for improving spatial representation of soil moisture using AMSR-E and MODIS products. Remote Sens. Environ. 2012, 124, 259–269. [Google Scholar] [CrossRef]
- Heumann, B.W.; Seaquist, J.W.; Eklundh, L.; Jönsson, P. AVHRR derived phenological change in the Sahel and Soudan, Africa, 1982–2005. Remote Sens. Environ. 2007, 108, 385–392. [Google Scholar] [CrossRef]
- Mahyou, H.; Karrou, M.; Mimouni, J.; Mrabet, R.; El Mourid, M. Drought risk assessment in pasture arid Morocco through remote sensing. Afr. J. Environ. Sci. Technol. 2010, 4, 845–852. [Google Scholar]
- Abdrabbo, M.A.; Farag, A.; Abul-Soud, M.; El-Mola, M.M.; Moursy, F.S.; Sadek, I.I.; Hashem, F.A.; Taqi, M.O.; El-Desoky, W.M.S.; Shawki, H.H. Utilization of satellite imagery for drought monitoring in Egypt. World Rural Obs. 2012, 4, 27–37. [Google Scholar]
- AL-Timimi, Y.K.; George, L.E.; AL-Jiboori, M.H. Drought risk assessment in Iraq using remote sensing and GIS techniques. Iraqi J. Sci. 2012, 53, 1078–1082. [Google Scholar]
- Erian, W.; Katlan, B.; Babah, O. Drought Vulnerability in the Arab Region, Case Study-Drought in Syria; Arab Center for the Studies of Arid Zones and Dry Lands and United Nations International Strategy for Disaster Reduction: Geneva, Switzerland, 2011. [Google Scholar]
- Amin, O.M.; Jan, A.; Mehrdad, R.; Ali, M.; R Afshin, S. Drought monitoring methodology based on AVHRR images and SPOT vegetation maps. J. Water Resour. Prot. 2011, 3, 325–334. [Google Scholar]
- Dash, P.; Göttsche, F.M.; Olesen, F.S.; Fischer, H. Land surface temperature and emissivity estimation from passive sensor data: Theory and practice-current trends. Int. J. Remote Sens. 2002, 23, 2563–2594. [Google Scholar] [CrossRef]
- Van de Griend, A.A.; Owe, M. On the relationship between thermal emissivity and the normalized difference vegetation index for natural surfaces. Int. J. Remote Sens. 1993, 14, 1119–1131. [Google Scholar] [CrossRef]
- USGS (U.S. Geological Survey). Landsat 8 (L8) Operational Land Imager (OLI) and Thermal Infrared Sensor (TIRS): Calibration Notices. Available online: http://landsat.usgs.gov/calibration_notices.php (accessed on 15 June 2015).
- Kogan, F.; Stark, R.; Gitelson, A.; Jargalsaikhan, L.; Dugrajav, C.; Tsooj, S. Derivation of pasture biomass in Mongolia from AVHRR-based vegetation health indices. Int. J. Remote Sens. 2004, 25, 2889–2896. [Google Scholar] [CrossRef]
- Kogan, F.N. Application of vegetation index and brightness temperature for drought detection. Adv. Space Res. 1995, 15, 91–100. [Google Scholar] [CrossRef]
- Kogan, F.; Gitelson, A.; Zakarin, E.; Spivak, L.; Lebed, L. AVHRR-based spectral vegetation Index for quantitative assessment of vegetation state and productivity. Photogramm. Eng. Remote Sens. 2003, 69, 899–906. [Google Scholar] [CrossRef]
- Bhuiyan, C. Desert vegetation during droughts: Response and sensitivity. Int. Arch. Photogramm. Remote Sens. Spat. Inf. Sci. 2008, 37, 907–912. [Google Scholar]
- Karnieli, A.; Agam, N.; Pinker, R.T.; Anderson, M.; Imhoff, M.L.; Gutman, G.G.; Panov, N.; Goldberg, A. Use of NDVI and land surface temperature for drought assessment: Merits and limitations. J. Clim. 2010, 23, 618–633. [Google Scholar] [CrossRef]
© 2015 by the authors; licensee MDPI, Basel, Switzerland. This article is an open access article distributed under the terms and conditions of the Creative Commons Attribution license (http://creativecommons.org/licenses/by/4.0/).
Share and Cite
MDPI and ACS Style
Ghaleb, F.; Mario, M.; Sandra, A.N. Regional Landsat-Based Drought Monitoring from 1982 to 2014. Climate 2015, 3, 563-577. https://doi.org/10.3390/cli3030563
AMA Style
Ghaleb F, Mario M, Sandra AN. Regional Landsat-Based Drought Monitoring from 1982 to 2014. Climate. 2015; 3(3):563-577. https://doi.org/10.3390/cli3030563
Chicago/Turabian StyleGhaleb, Faour, Mhawej Mario, and Abou Najem Sandra. 2015. "Regional Landsat-Based Drought Monitoring from 1982 to 2014" Climate 3, no. 3: 563-577. https://doi.org/10.3390/cli3030563