Article

Processes Prior and during the Early 18th Century Irish Famines—Weather Extremes and Migration

by
Steven Engler
1,2,*,† and
Johannes P. Werner
3,†
1
Institute for Advanced Study in the Humanities, 45128 Essen, Germany
2
Department of Geography, Climatology, Climate Dynamics and Climate Change, Justus Liebig University, 35390 Giessen, Germany
3
Department of Earth Science and Bjerknes Centre for Climate Research, University of Bergen, Postbox 7803, N-5020 Bergen, Norway
*
Author to whom correspondence should be addressed.
These authors contributed equally to this work.
Climate 2015, 3(4), 1035-1056; https://doi.org/10.3390/cli3041035
Submission received: 8 September 2015 / Revised: 3 November 2015 / Accepted: 25 November 2015 / Published: 10 December 2015
(This article belongs to the Special Issue Climate Impacts on Health)

Abstract

:
This paper advances the current debates on famine and famine history, with a focus on the first half of the 18th century in Ireland. Ireland was often hit by severe famines and two of them, specifically the famines of 1728–1729 and 1740–1741, are at the center of this article. The analysis of those famines will show the relevance of weather extremes as one driver in the functional chain of famines. Analyzing the linkage between weather extremes and social, political and economic vulnerabilities of the society further enhances the debate on past famines. Additionally, this paper focuses on the migration flows in the context of both Irish famines. These migration flows lay the foundation for the migration patterns during the “Great Irish Famine” of 1845–1852.

1. Introduction

Famines were common in many European countries before the second half of the 20th century. Ireland was one of those countries. In contrast to other famine-affected nations, Ireland’s historical experiences are deeply embedded in today’s culture, such as arts, fairy tales, and songs. Some of these mementos are still perceivable in Ireland. For example “The Fields of Athenry” is an Irish folk song of the 1970s, which addresses the miserable situation in the town of Athenry in Galway County during the Great Famine of 1845–1852. During important sports events Irish fans still sing this unique song showing the major role of famines for their own identity, their solidarity and the Irish culture. Other less known songs also cover the periods of earlier famines (prior to 1845).
We will take a closer look at those pre-1845 famines in Ireland and analyze the relationship of weather extremes and social facets, such as harvest failures and their impacts. Despite all climate determinism debates (for further reading: [1])—which are rightfully held and taken very seriously by both authors—we also think that it needs to be reconsidered to include weather-related indicators and in a broader sense environmental measures back into modern famine research as but one factor in a bigger functional chain. This has been partially neglected since Sen’s [2] well-established “Food Entitlement Decline” (FED) approach. FED focuses on a population’s food entitlements, i.e. the distribution of food, rather than its availability. According to Sen, “entitlement refers to the set of alternative commodity bundles that a person can command in a society using the totality of rights and opportunities that he or she faces” [3]. He describes the distribution problem as “the group contrast” [2] and claims that, “while famines involve fairly widespread acute starvation, there is no reason to think that it will affect all groups in the famine-affected nation” [2].
To highlight the value of including not only the socio-economical factors but also environmental factors in famine research we analyze two historical Irish cases (1728–1729 and 1740–1741). Furthermore, this widens the time frame of theoretical famine research that is too often based on the Sahel crises of the 1970s and 1980s and the Bengal famine of the 1940s (e.g., [2,4,5,6]). From a methodological perspective it is therefore necessary to collect, analyze and reconstruct weather data (temperature, precipitation, etc.) for the mentioned periods and to additionally include sources (books, newspapers, diaries, etc.) referring to social or environmental aspects of these days.
The remainder of this paper is organized as follows. In Section 2, we first give an introduction to famine vulnerability. We then explore the situation in Ireland during the early 18th century focusing on the climatological state before the famine, and the weather situations immediately preceding the famine years. The two early 18th century Irish famines and their possible weather related initiating driver are studied in Section 3. Section 4 analyzes the migration processes during both famines.

2. Famine Vulnerability of the Irish Society in the Early 18th Century

Food insecurity and famines have been major problems of mankind from the past up to the present day, and are likely to continue to be in the future [7]. This becomes obvious looking at the global political strategies such as the Millennium Development Goals (MDGs) and the Sustainable Development Goals (SDGs). According to Wolde-Mariam [8] famines are characterized by a “general hunger affecting large numbers of people in rural areas as a consequence of the non-availability of food for a relatively long time”. This definition excludes two important aspects: Firstly, famines also occur in urban areas. Secondly, people may experience famine even if food is generally available. Considering this criticism, Ó Gráda [5] states that a “famine refers to a shortage of food or purchasing power that leads directly to excess mortality from starvation or hunger-induced diseases”. Even though Ó Gráda’s definition captures the essence of famines, it excludes the dimensions of time and space. From an institutional standpoint the World Health Organization [9] defines famine as “regional failure of food production or supply, sufficient to cause a marked increase in disease and mortality due to severe lack of nutrition and necessitating emergency intervention, usually at an international level”. Furthermore, we have suggested elsewhere [10,11] to define famines “as an extreme scarcity of food or a drop in exchange entitlements in a certain region over a multi-year period that threatens the way of life of the already-vulnerable resident population and frequently leads to a higher mortality rate”. The trajectories of famines can be separated into four phases, namely pre-famine vulnerability, the initiating driver, the coping capacity and direct impacts as well as the adaptation phase [10]. Migration plays a major role as a form of resilience with regards to coping, adaptation and transformation [12].

The Pre-Famine Situation in Ireland in the 18th Century

To get a comprehensive picture of pre-famine vulnerability in Ireland during the forgotten famines (1728–1729 and 1740–1741; more information in Section 3), we will first describe and analyze the situation before those events. While the phrase “forgotten famines” could be used for all Irish famines prior to the “Great Irish Famine” of 1845–1852. However, Dickson [13] used it specifically fort he Irish famine of 1740–1741. The concept of “vulnerability” has emerged from the wider framework of studies of disaster as a key to reveal the geographic, social and economic preconditions for disastrous events and their complex relationship [14,15,16]. However, in the face of its almost inflationary use, there is a need to define “vulnerability” [17]. The “Intergovernmental Panel on Climate Change” [18], defines vulnerability
“as the propensity or predisposition to be adversely affected. Such predisposition constitutes an internal characteristic of the affected element. In the field of disaster risk, this includes the characteristics of a person or group and their situation that influences their capacity to anticipate, cope with, resist, and recover from the adverse effects of physical events”.
As Collet [19] has pointed out, the investigation of predispositions refocuses the study of disasters (such as famines) replacing an existing focus on their analysis as events with the examination of more long-term historical developments before the onset of a disaster. In other words, disasters should be perceived as long-term processes rather than events [20].
It has been argued that Ireland was in a state of famine at least from the 16th century and the occupation of the English onwards. We will identify some of the key reasons for this constant state of want that persisted even before the famines analyzed in this article. Engler et al. [11] used the Famine Vulnerability Analysis Model (FVAM, see [10]) to systematically evaluate the socio-environmental conditions. In their analysis, several indicators for vulnerability, of which a list can be found in Engler et al. 2013 [11] with categories “population”, “politics” and “economy”, are checked, ranging from social status of the analyzed group and equality of the society to education and legal structures as well as market related indicators, such as tax system, employment and market integration. Their findings of most indicators in the analyzed sectors “population”, “politics” and “economy” pointing to an at least tense situation also hold true in the late 17th and early 18th century and will be briefly summarized. The Irish society was one of great inequalities consisting of a small number of people having plenty and a large group, mostly Irish Catholics, living in poverty. The (mostly English) Protestants oppressed the Catholic populace, who on their part were often denied the right to vote, barred from getting any formal education and thus unable to influence decision-making processes. This resulted in laws that ignored the needs of the largely rural Catholic populace through production limits and price setting. Roman Catholics additionally did not have the same rights as Protestants and different sets of applicable laws existed for the two groups. With regard to welfare and healthcare, no larger organized system existed yet. Welfare was based on charitable organizations at the local scale, which were unable to cope with the scale of need in the years of famine. Another problematic feature was the state of infrastructure. While roads close to major cities such as Dublin were generally in a good state, the transportation network was less developed and cared for in the more rural regions. There, markets functioned on a much more local scale, while higher, more regional or large-scale market integration could probably have leveled out price hikes in a situation of famine. Among the 22 analyzed indicators, which are comprehensible throughout the line of argumentation in this paper, related to the social sphere, the majority (15) point towards a vulnerable society already. This constant state of pre-famine vulnerability meant that additional stress through what we term the initiating driver (for further information on the method, see reference [10]) could push the situation past a tipping point and into a famine.
We argue that the additional factors that ultimately lead to the analyzed famines was provided by the adverse weather situation. In the following we thus provide an overview over the general climate of Ireland in the early 18th century. In general, climate in Ireland is dominated by westerly atmospheric flows, bringing moist and temperate air from the North Atlantic, especially from September to January, where monthly mean precipitation today (1981–2010) exceeds 100 mm/month. Spring and summer months’ precipitation still typically lies above 75 mm/month [21]. Monthly temperatures are typically above freezing in winter and stay below 20 °C in the summer months [22].
While the 18th century lies within the termination phase of the Little Ice Age (LIA), a period of markedly lower temperatures in Europe and elsewhere [23], gridded temperature reconstructions by Guiot et al. [24] show surprisingly minor differences between the period before the famine (1680–1720) and today’s (1981–2010) climate. While Guiot et al. [24] reconstruct similar mean growing season temperatures as today, Luterbacher et al. [25] and Xoplaki et al. [26] show cooler than today temperatures (about −1 °C) in spring and summer, and much cooler (−1.5 °C) temperatures in autumn and winter. This supports the notion of Europe undergoing a “Little Ice Age”. Precipitation was about on par with that of the present day [27]. However, Wanner et al. [28,29] note that especially towards the end of the LIA several long term blocking situations occurred over Europe. Persistent high pressure systems over the continent blocked the usually predominantly westerly flow, and lead to influx of polar or subpolar air masses. This is supported by ship logbook data analyzed by Wheeler et al. [30] that show reduced westerlies around the British Isles, by sea level pressure reconstructions conducted by Luterbacher et al. [31] and NAO reconstructions of Trouet et al. [32]. This would have led to markedly cooler winters than today and cooler spring temperatures and is of great importance when assessing weather-related impacts on Irish food security: Oat is normally seeded in April with typical harvest dates around August. The young plants are especially sensitive to cold spring temperatures. Potatoes, the other staple food in 18th-century Ireland, is, under normal circumstances, a robust crop. However, it is sensitive especially to heavy rains and frost occurring in late April and early May [33,34]. With the exception of the study by Wheeler et al. [30], there are unfortunately no high quality temperature-, precipitation- or other climate-related data freely available for our region of interest. There are, however, a few studies on oak trees (International Tree Ring Database, ITRDB) by Baille and Pilcher (BRIT042, BRIT044) and Brown [35,36,37]. While it is generally accepted that oaks can record drought conditions or moisture availability in regions with comparable climate [38,39], an analysis (see online material) shows only a weak signal in the data. The data do qualitatively match the assessment of precipitation by Pauling et al. [27], supporting the findings there. We thus use the climate field reconstructions by Luterbacher et al. [24] and Xoplaki et al. [26] for seasonal temperature reconstructions and the data of Pauling et al. [26] for reconstructing precipitation. While the data have in principle a resolution on par with the CRU data, they are not based on data in our region of interest. We thus present isle-wide averages from these data sets only and where appropriate provide some qualitative descriptions of the conditions as perceived by contemporaries.
The outlined general climatological situation is actually favorable to agriculture. However, the focus on two staple crops—oats and potatoes—for much of the subsistence of the local populace could lead to difficult situations should one of them fail entirely. This, together with the political and economic situation, set the stage for what was to happen throughout the 18th century.

3. Irelands Forgotten Famines

Famines have been one of the defining elements in Irish history even before the end of the “Great Irish Famine” of 1845–1852.
“To give particular dates as the occasions of famine years is, to some extent, to create a wrong impression of the Irish situation, the truth being that the country lived in a chronic state approaching famine, and that the particular years which are mentioned by historians as famine years were simply the years in which the chronic symptoms became acute”.
[40]
Referring to the famine of the Great Frost in 1740–1741 Dickson [13] introduced the term of a “forgotten famine”. While “forgotten” seems to overemphasize the situation, “underrepresented” (in the scientific community) certainly fits. The same holds true for the famine of 1728–1729. This owes to the fact that the “Great Irish Famine” of 1845–1852 overshadows other earlier impacts.

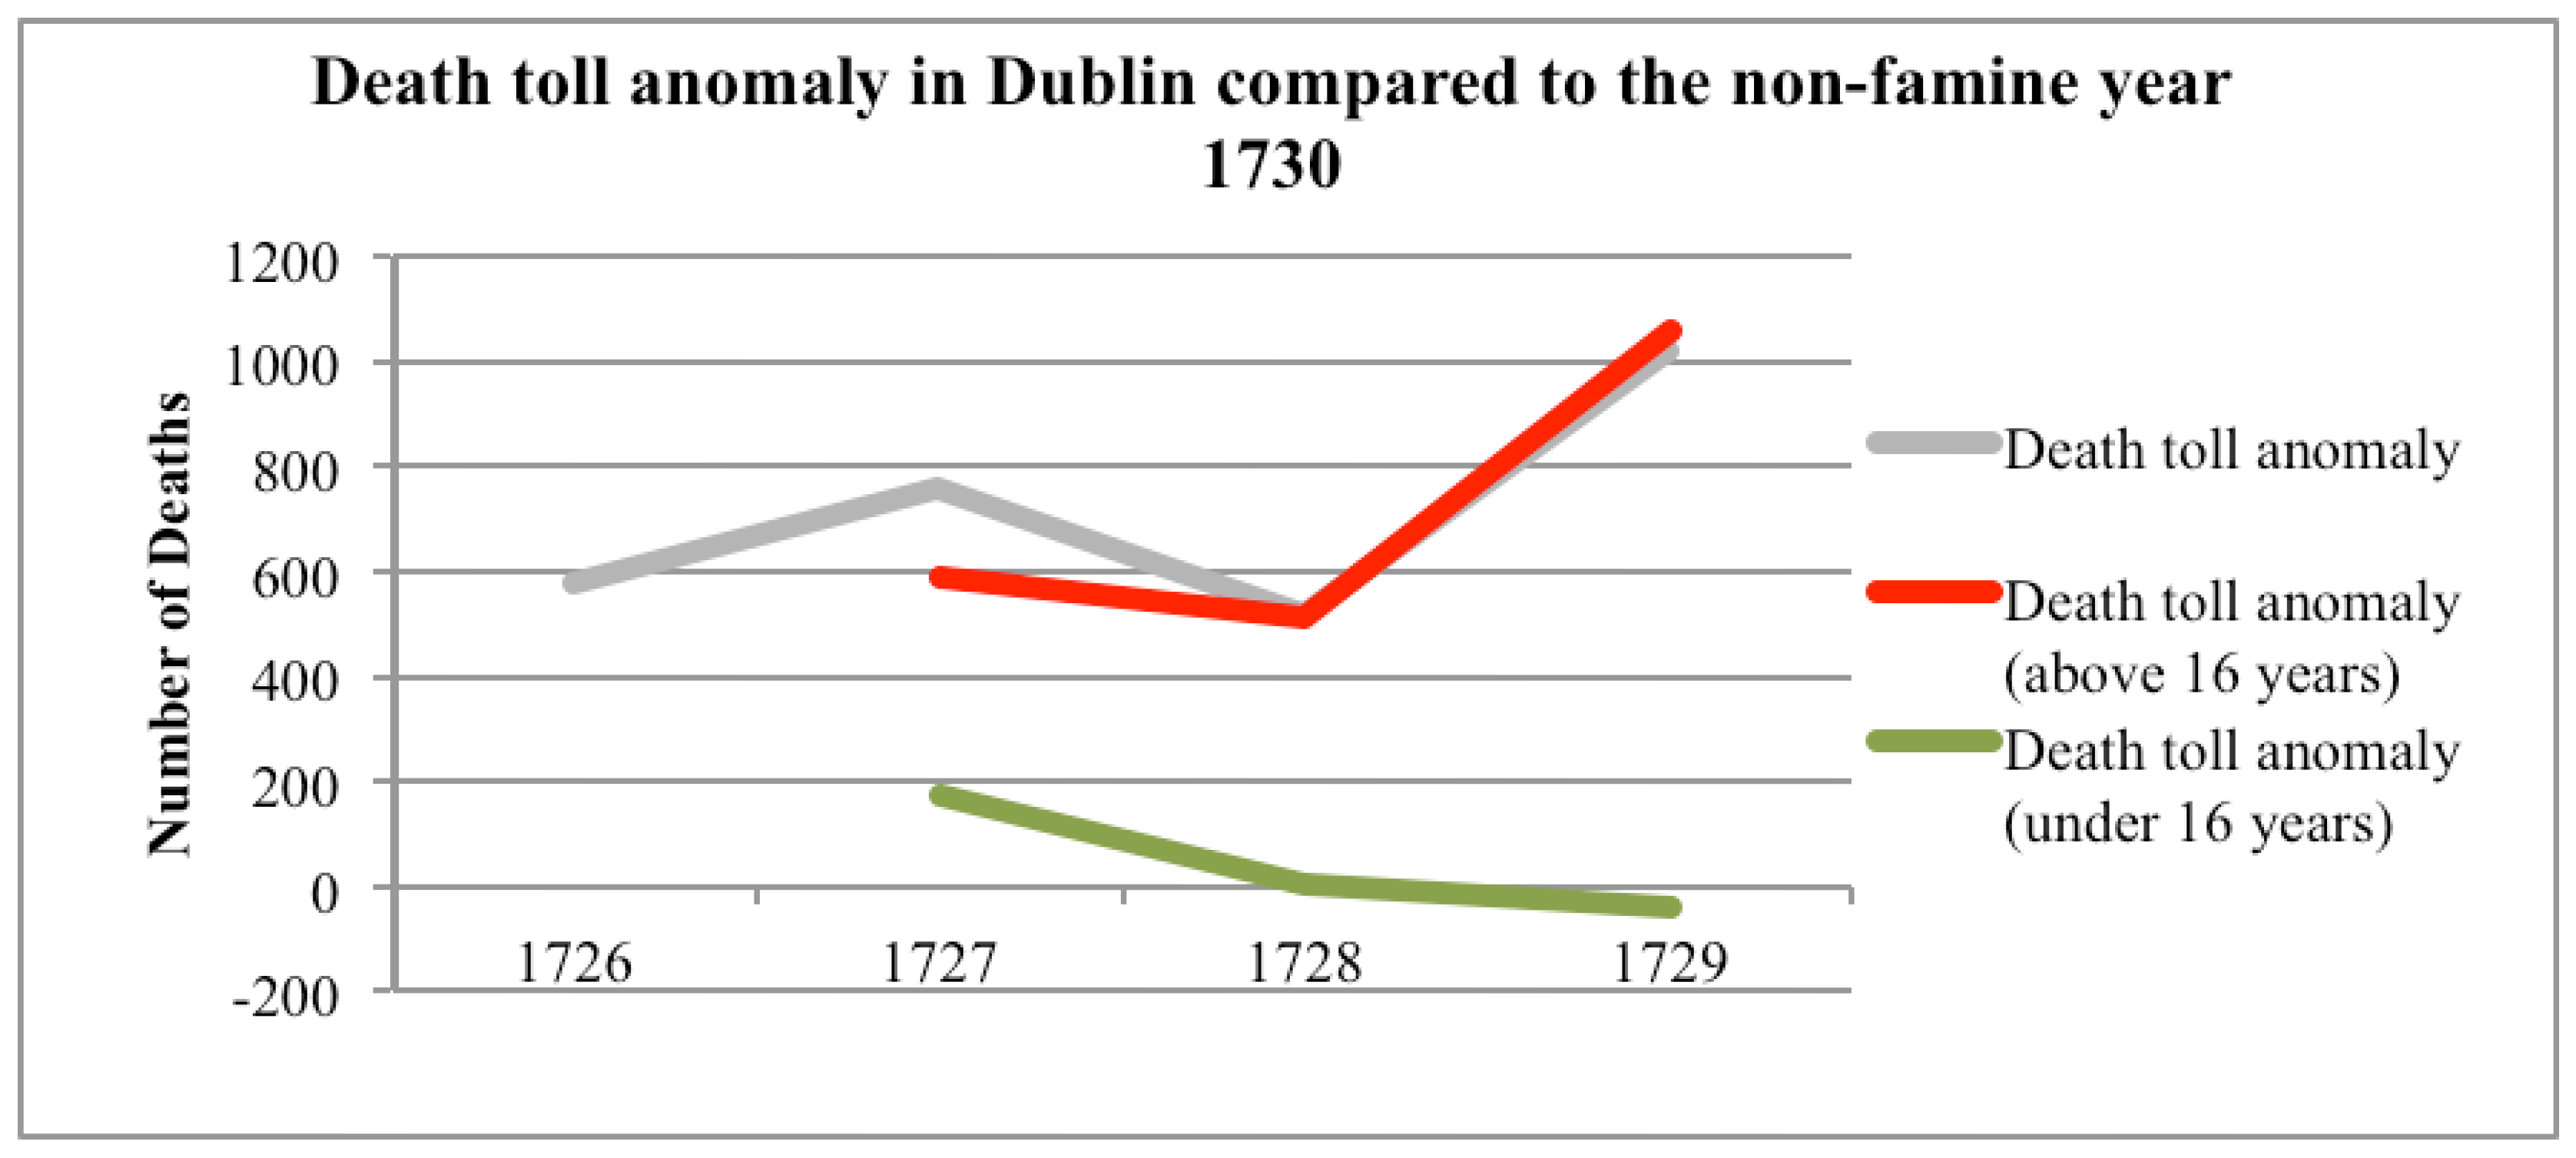
3.1. The Oat Famine of 1728–1729

As outlined above, what has been termed an “initial driver” by Engler [10] and Engler et al. [11] can drive an already vulnerable society into a state of famine. The social, political and economic situation in Ireland provided such a state of vulnerability (see Section 2). Then, in the late 1720s, Ireland suffered consecutive years of bad harvest. According to Boulter, Church of Ireland Archbishop of Armagh between 1724 and 1742, this situation verging on famine conditions started as early as 1725 (Boulter, 1770: 181). In July 1727, the first signs of the outbreak of an acute famine became observable:
“[…] and the terrible scarcity next to a famine that a great part of the kingdom now labours under by the corn not yielding well last year, and to which we are liable upon any the least accident in our harvest […]”.
[41]
Due to the absence of oat at the end of 1727, which was the staple food of the Irish in late summer, the people in need started to eat their sowed potatoes two months earlier than usual. This made them even more vulnerable for a famine in the upcoming months of 1728 [41]. Boulter describes the situation as follows:
“And as the winter subsistence of the poor is chiefly potatoes, this scarcity drove the poor to begin with their potatoes before they were full grown, so that they have lost half the benefit of them, and have spent their stock about two month sooner than usual, and oatmeal is at this distance from harvest in many parts of the kingdom three times the customary price, so that this summer must be more fatal to us than the last, when I fear many hundreds perished by famine”.
[41]
The famine in 1728–1729 was related to unusual temperature and precipitation conditions in the years before, leading to the aforementioned poor crop yields.
The climate field reconstructions by Luterbacher et al. [25] and Xoplaki et al. [26] show that the summer of 1725 was much colder (−1.8 °C) than in preceding decades (1680–1720). This matches the (not independent) data of the Central England Temperature Series [42].
According to the precipitation reconstruction of Pauling et al. [27], the first phase of oat growth in April and May 1725 was slightly dryer (−100 mm to −10 mm) than the long-term Irish average. This was followed by a summer (June, July August) that was much wetter than normal (50 mm to 175 mm). According to Kelly [43], who is referring to a weather diary from Dublin, the unusually wet summer in this region actually began in May 1725 already:
“However, the summer and autumn proved disastrous. From the beginning of May until the end of August, it rained virtually every day. According to the weather diary maintained by a Dublin parish constable, there was precipitation on twenty four of June’s thirty days; July was unusually wet, and August was worse. ‘The weather was so exceeding bad’ in August, the constable recorded, ‘the harvest was spoiled and most of the fruit and vegetable productions of the earth’.”.
[43]
The year concluded with a cool and dry winter. The year 1726 was similar with smaller amplitudes. In 1727, the cold (−1 °C wrt. 1680–1720) winter was followed by a warm spring and summer (+1 °C and +0.7 °C wrt. 1680–1720). Summer precipitation was about average. The results from Pauling et al. (2006) and Luterbacher et al. [25] are supported (for the growing season) by analyses of tree ring data from oaks (ITRDB data, BRIT042 and BRIT044 by Baillie and Pilcher [35], BRIT054 and BRIT055 by Brown, see appendix [36,37]). These data show in principle a mostly positive moisture balance for the 1720s caused by the cooler and wetter conditions in the beginning. Towards the end of the 1720s, conditions normalize. Consequently, the weather conditions from 1725 to 1727 were the main reason for several consecutive insufficient harvests. The year 1728 began with a cold winter (−1.5 °C wrt. 1680–1720), followed by a cold spring (−1.1 °C wrt. 1680–1820, all data from Luterbacher et al. [27] and Xoplaki et al. [26]). While summer is reconstructed to have been slightly warmer than average (+0.5 °C) with average precipitation all year [27], the growing season temperature reconstruction by Guiot et al. [24] shows slightly cooler (−0.3 °C) temperatures in that year. While the VEI (volcanic explosivity index) series used by climate modelers [44] indicates a moderate eruption in 1727/28, it is likely that there was no influence on Irish weather that year. The reconstructed response (cold winter, normal summer) is atypical [45] and it can be supposed that it was a high latitude volcano [46]. The deficient harvests exacerbated the situation caused by already tense social conditions in Ireland. According to Dickson [13], the country was “lightly governed, materially poor, and socially polarised” at the time. Major problems arose because of the disparities between the richer and the poorer parts of the society and because of the discrimination of Irish Catholics. According to the literature referring to these years Ireland’s population was divided into three classes:
“There is in no kingdom greater inequality than in Ireland: one class of great property who live excessively sumptuous: the second and more numerous class hurting their fortunes by the imitation of the first—the third in extreme poverty”.
[40]
Irish Catholics were discriminated against through the penal laws and other restrictions. Catholics, who represented at least 70 percent of the Irish population, were strictly excluded from political participation and in particular, they were denied the right to vote in elections from 1728 to 1793 [41,47,48].
After three bad harvests and inadequate grain imports prices rose drastically [43], as the cleric Hugh Boulter describes:
“When I went [on] my visitation last year, barley in some inland places, sold for 6s. [Schillings] a bushel, to make a bread of, and oatmeal (which is the bread of the north) sold for twice or thrice the usual price and we met all the roads full of whole families that had left their homes to beg abroad, since their neighbours had nothing to relieve them with”.
[41]
Coping strategies of the people, such as changed food habits, saving of edibles and money, etc., did not work anymore and the famine struck them. Jonathan Swift, the famous Irish essayist and also the Dean of St. Patrick´s Cathedral in Dublin describes the famine situation, under the pseudonym of M.B. Drapier, as follows:
“An evil that has crept on us by degrees, and is now grown so familiar to us, that we can see without the least commotion, our publick streets crowded with living spectres, bodys of our species with half life, rambling about for sustenance, in the most miserable condition human nature can be reduc’d to”.
[49]
Due to the absence of a unified population accounting office in Ireland in 1728/29 and the fragmented archival material, it is difficult to estimate how deadly this famine was in total, but compared to a non-famine year (in this case 1730), the death rate in Dublin was significantly higher (Figure 1). Especially in the years 1727 and 1729, the death rates increased. In much smaller numeric amounts, the death rates also increased in the cities of Killaloe in County Clare, Athy in County Kildare, Syddan in County Meath and Castlejordan in County Offaly [50]. It is striking that the death rates of the under 16-year-old Dubliners remained quite stable, while the death rates of the above 16-year-old peaked.
As is the case in most famines, the poor suffered more from the situation of scarcity [13,40]. George Faulkner’s (1703–1775 was an Irish publisher and bookseller) the Dublin Journal - a local, well-archived newspaper - thus stated: “the poor [are] likely to famish” [51].
Figure 1. Death toll anomaly in Dublin compared to the non-famine year 1730. The Data was taken from “The Dublin Weekly Journal” issues 1726–1731.
Climate 03 01035 g001

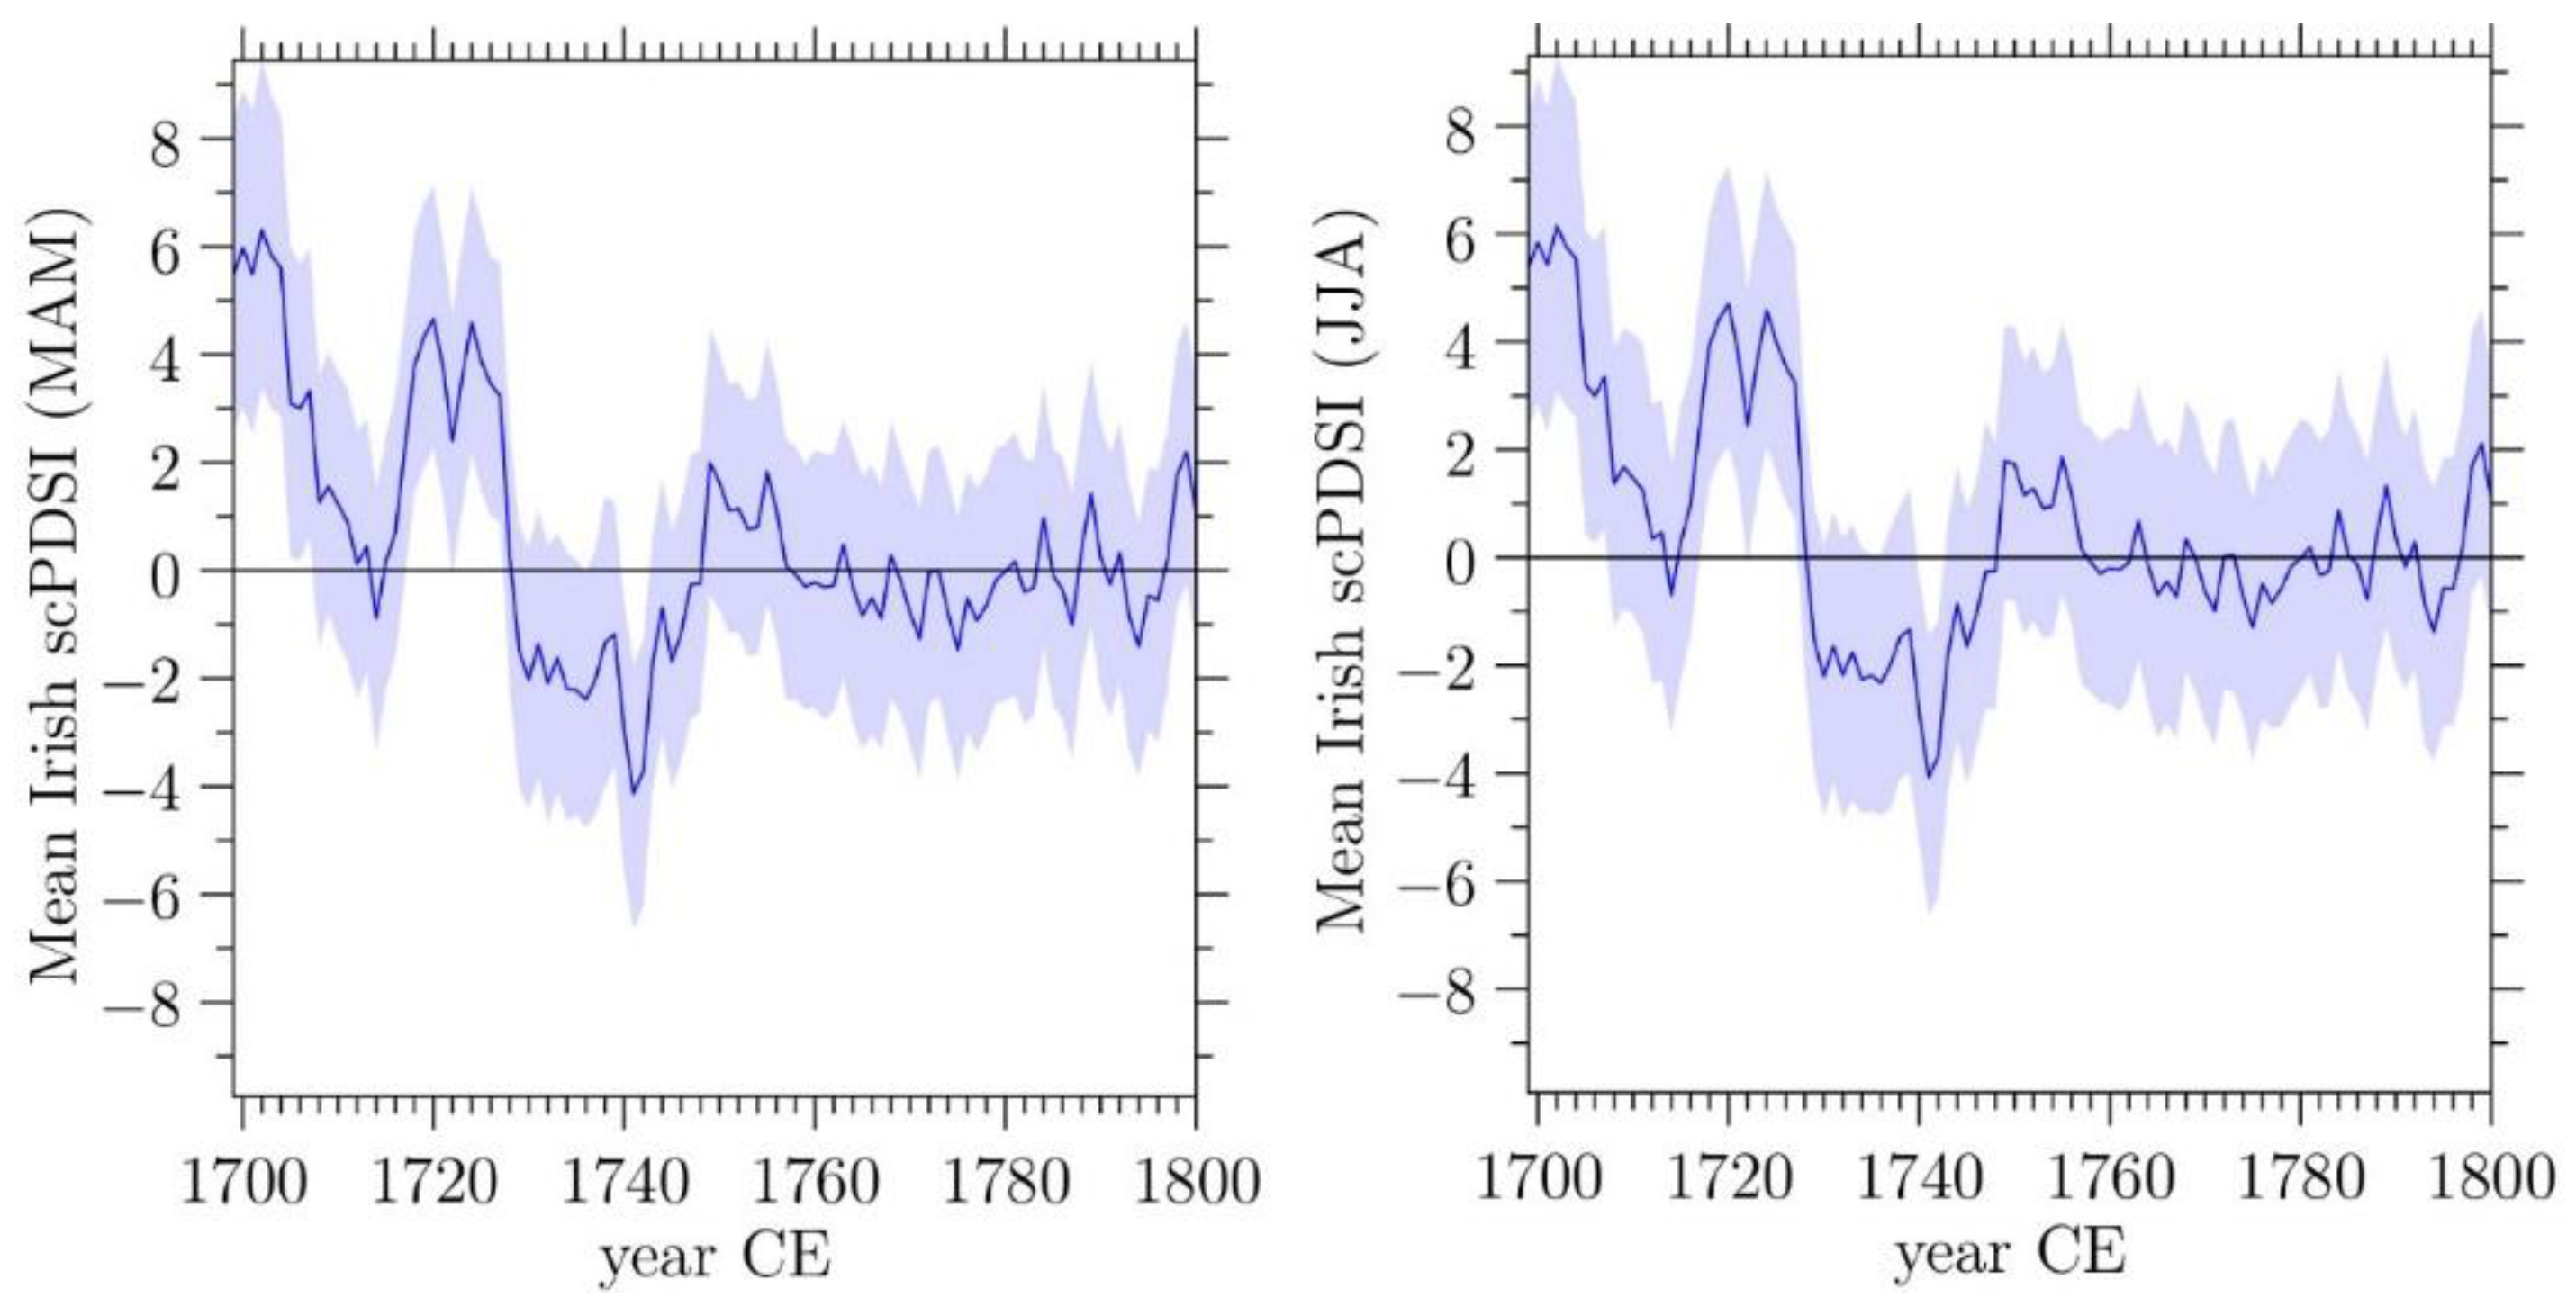
3.2. The Famine of the Great Frost of 1740/41

Considering 1740/41 as an exclusively Irish calamity would create a false impression of the situation. In fact, it was a European crisis, at least in most parts of the continent. Burdens were manifold: harsh weather, leading to failing harvests, drastically increasing grain prices and a great mortality rate struck Europe. But in comparison to other countries, Ireland was unique in being hit by every single one of these issues [52,53,54].
The famine years of the late 1720s were followed by unusually warm conditions. All seasons with the exception of the winter of 1730/31 were at least as warm as in the previous decades (1680–1720). Westerly flow dominated the circulation, with only weak easterlies during winter [30]. This decade has been reconstructed as one of the warmest in the LIA [24,25,26]. While the drought reconstruction (see Appendix) shows dryer conditions, this does not seem to have harmed agriculture and could be mostly a result of higher temperatures rather than of a decrease in precipitation (which would contradict the assessment of Wheeler et al. [30]). Then, in autumn 1739, harsh climatic conditions struck the highly vulnerable and already famished Irish population [11]. The main causes of vulnerability before and after the famine were, as in the 1720s, the agricultural system, a policy of segregation and social inequalities introduced by the British government. Since the potato had made its way from the New World to Ireland, it had become one of the two main staple foods, prior to and during 1740. After the failure of the oat crops in 1727, which was one reason for the following famine (see Section 3.1), “a sequel of dominance of the potato in the economy of the people [occured], and persisted till some time after the Great Famine” [55]. This dependence on a single crop for of the main part of the year proved disastrous (see also Engler et al. [11]), when the potato harvest failed due to the frost of 1740 (see also Fuller et al. [33], p. 93): a persistent blocking situation occurred in the winter of 1739/40, with a high pressure system over the continent blocking the normal westerly winds. Instead of the moist and temperate maritime air masses from the Atlantic, polar or subpolar air moved towards Ireland [25,28,29,30]. This led to the markedly colder winter (−1.8 °C wrt. 1680–1720) and spring (−1.4 °C wrt. 1680–1720), which brought about the famine [33]. The contemporary newspapers also reported on these harsh climatic conditions:
“The frost still continues here very severe; numbers are in want, the hardness of the Season not permitted them to work; and letters from most part of the country give most melancholy accounts of its effects, the mills being stopped; they cannot get their corn ground, and the poor whose chief support is potatoes are in extreme want, they being mostly spoil’d in the ground”.
[56]
According to Luterbacher et al. [25] and Xoplaki et al. [26], the temperatures between December and February in 1739/1740 were −1.7 °C lower with a cold spring 1740 (−1.4 °C) following (all wrt. 1680–1720).
Owing to failing potatoes and cold and dry climatic conditions, the food prices increased drastically:
“There is now as great scarcity of provision in this city [Dublin] as ever known, and it is much to be feared all over this kingdom, every kind of food being at vast high prices, which is owing to the great drought we have had ever since last Christmas, there not having been one day’s rain. During that time forty thousand sheep have died in Connaught within these two months”.
[57]
Therefore, the affected people tried to cope with the situation of scarcity by changing their food habits. Firstly, they ate less in order to save as much food as possible. Secondly, they started to eat the so-called “famine foods” [5], e.g., sour milk, nettles, charlock and rotten potatoes [13].
This situation of hardship exacerbated the vulnerability of an already volatile social fabric, and, among the famine-affected Irish population, amplified processes such as a higher crime rate, diseases, deaths and migration. In the times of the greatest food scarcity, from 1740 to 1741, specific diseases spread among the poorest groups of society because of smaller amounts of and unhealthier food and worse living conditions. Fevers, relapsing fevers, typhus, fluxes and intestinal illnesses were only the most prominent of these diseases. “Here is an uncommon mortality among the poor people, by fevers and fluxes, owing, no doubt, in a great measure to their poor living” [58]. Some of these diseases also affected the richer parts of society, such as the Smallpox. Poverty, the scarce food situation and diseases all contributed to a high death rate. During the 1740–1741 famine, 13 percent of the population died. According to Ó Gráda, the death rate during the “Great Irish Famine” was slightly lower with a total of 12 percent [5].
The other population-decreasing factor was emigration, which will be studied in detail in the next section.

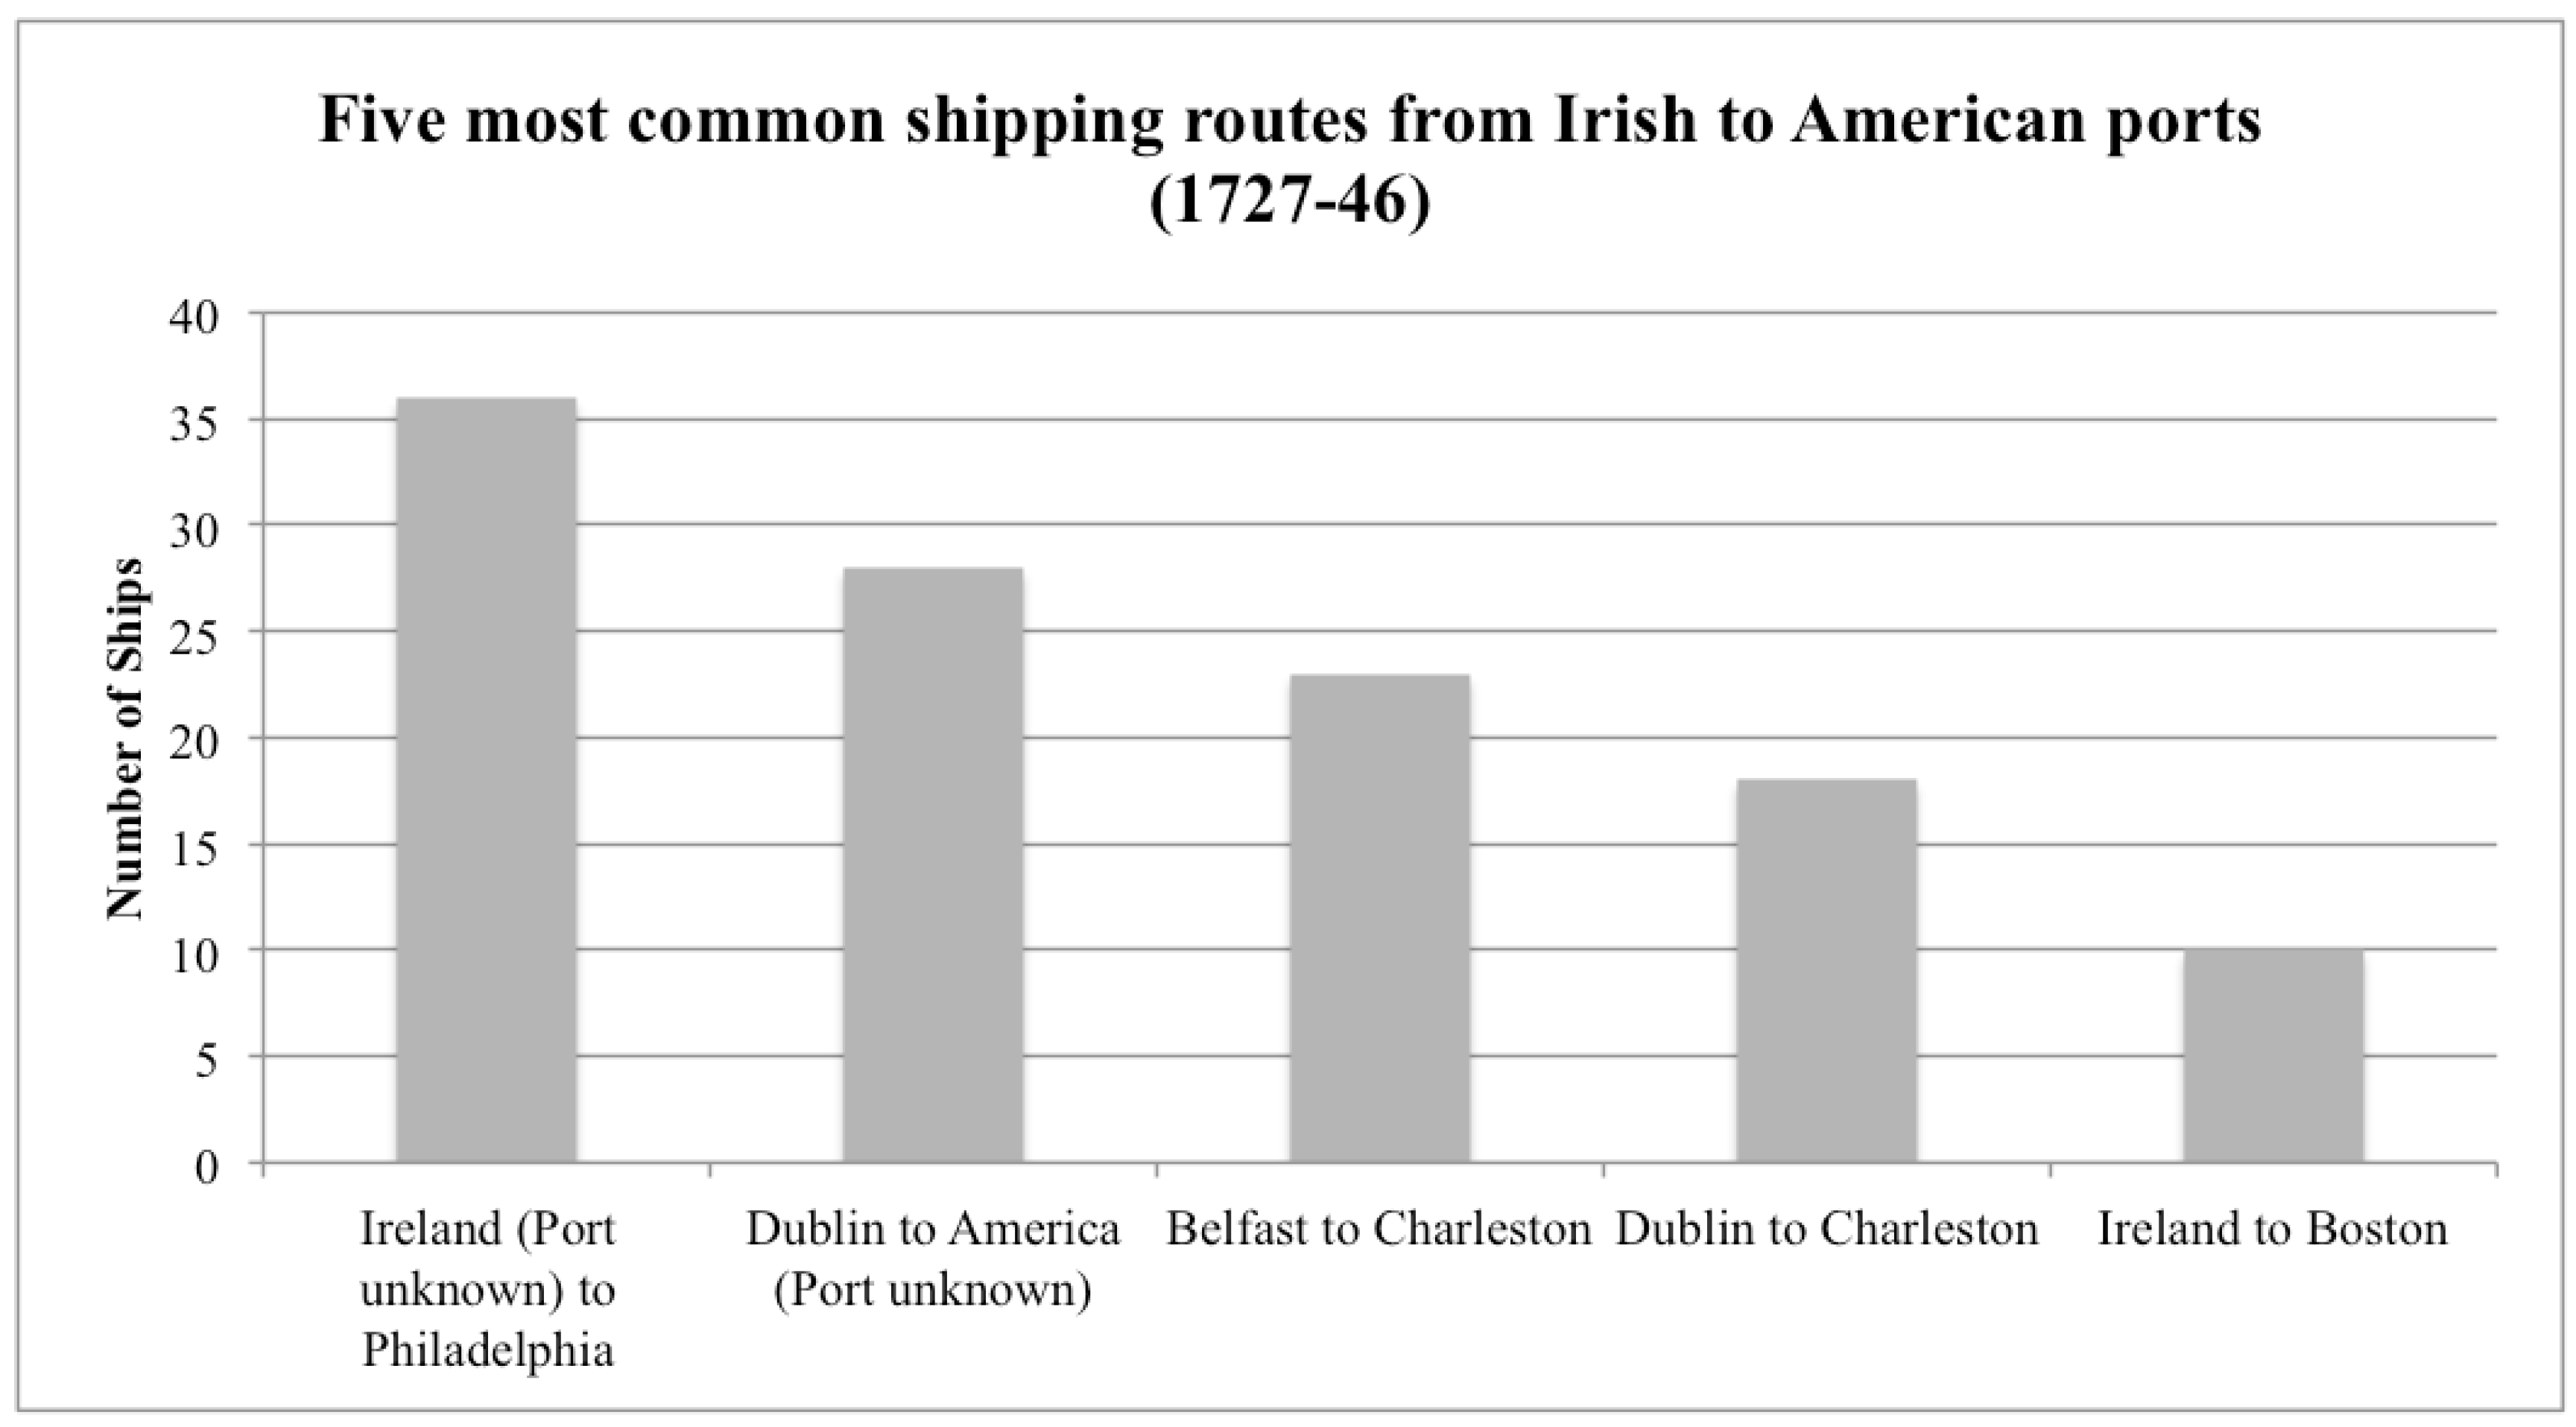
4. Migration Processes during both 18th Century Famines

One of the most obvious connections between both mentioned famines is the climate. The harsh temperature and precipitation conditions—together with the social, economic and political pre-famine vulnerability of the affected people—acted as initial drivers for consecutive harvest failures between 1725 and 1729 (including the acute famine years) and 1739–1741, leading to both famines. Nevertheless, climatic drivers influencing the agricultural sector are only one of many influences on the nutrition of Irish society. In fact, it was the combination with socio-environmental aspects that led to deaths and mass migration.
In addition to the food shortages caused by the weather extremes, migration as an adaptation strategy is the nexus between both famines analyzed in this paper (Section 3.1 and Section 3.2) Migration is not the only adaptation strategy used during both famines. However, in this paper we want to focus on this aspect. More information on other coping and adaptation strategies is available for reading in Dickson [13] and Engler et al. [11]. Hence, it is important to study the migration flows of both famines in detail. During and after both famines most of the migration flows remained internal [13], mostly in a form of rural-urban migration. The cause of this movement was food scarcity in the countryside and the belief that a better life was to be attained in the towns. This hope was based on the market integration of towns. The migration of some members of the family of the farmer Lucas of Corofin from the hinterlands of Ennis into the city can be seen as characteristic of this process [59]. As to the poorer parts of Irish society, Dickson [13] states that generally “most of their wanderings contained within the island”, due to a lack of financial opportunities.
Concerning external migration, stepwise movements typified the situation in both famines. In those days going abroad from Ireland was only possible by ship. Therefore, the greater port cities served as emigration and immigration gateways for “predominately rural” Ireland [47], where only 12.5 percent of the population lived in cities in 1725 [47]. Dublin is likely to have been the biggest city with a population of around 150,000. It was also a place of great demographic change due to immigration and emigration processes between 1728 and 1745. Cork was the second biggest city with an estimated population of only 40,000. Nevertheless, the city had a vast trading network abroad, which possibly made it the most important seaport for trade in Ireland [60,61]. This trading and shipping routes connectivity played a major role for subsequent destination choices of Irish migrants. The other ports, where emigration streams left Ireland were Belfast and Londonderry in the North and Galway and Limerick in the West [62,63,64]. External migration could be both: temporary—mostly seasonal, but also a final way of adaptation. A typical destination for seasonal labor migrants was London. In the first half of the 18th century, around 450 seasonal labor migrants left Ireland eastwards only to return at a later point in time [65]. In times of scarcity, the number of migrants was much higher. Those people, whom famine and its aftermaths forced to change their lifestyle and leave their homes for good, mostly migrated to today’s USA. In Figure 2 we portray the five most common shipping routes from Ireland to America: The primary destinations were Philadelphia, Charleston in South Carolina, Boston and New York. Some uncertainties remain, as occasionally the exact place of origin as well as the precise destination is missing in the analyzed data.
One specific example for the emigration process in 1740/41 is the route to Pennsylvania, USA. The flows of goods and information already existing between Pennsylvania and Ireland facilitated emigration [58,66]. Large numbers of Irish people moved to Philadelphia (Pennsylvania), following their ancestors, relatives and friends who migrated in 1728–1729. Wokeck states that the emigration rate to Philadelphia rose by 500 percent when comparing 1730 and 1740 [67,68]. Thus, the majority of migrants from 1728 to 1746 further established the migration routes to the USA that came into use again at the time of the “Great Irish Famine” in 1845–1852. All of these results underline Findlay’s second mobility principle: “Once a decision to move has been taken, there is an almost immutable law that most people move over short distances rather than longer distances. And places with large populations have greater interaction with each other than those with fewer people” [69].
Figure 2. Five most common shipping routes from Irish to American ports (1727–1746). The dataset was taken from Dobson [62,63,64].
Climate 03 01035 g002
In the case of these two famines, migration commonly produced counter flows. By “counter flows”, we are referring to information that returned across the Atlantic Ocean in the form of letters to family members [70], friends and to the diverse existing newspapers in Ireland. The information included knowledge transfer concerning agriculture, descriptions of the chosen destinations and biographic news.
Overall, both Irish famines analyzed in this paper are characterized by high migration rates. Due to missing authorities or agencies for the general recording of migrants during both Irish famines, exact figures on the amount of emigration are missing. Especially the dataset for 1728/29 is too weak to even estimate emigration numbers. Nevertheless, they must have been significant according to contemporary witnesses:
“As to this country it is impossible to express their condition who live in it. Whole parishes laid waste; the inhabitants who were very numerous gone and going with delude hopes to New-England, and numbers of those that are left here are subsisting upon horse and dog flesh”.
[71]
In the case of the famine of the Great Frost, Fitzgerald and Lambkin [72] consider 1741 as a “migration landmark” year. Smyth even assumes that the migration rate was as high as it was during the Great Irish Famine of 1845–1852 (Smyth [48] cited in Fitzgerald and Lambkin, [72]). Although this rate may be too high, it can be taken as an indicator for steady migration flows. Cullen [73] also stresses this by concluding that most of the one-third decrease in tax payments in Sligo and Kerry was due to out-migration and not to deaths. According to Stevenson [74], “the emigrants leaving Belfast and Derry for America were not fewer than twelve thousand annually” in times of the famine in 1740–1741. The emigration rate could have been even greater, but besides the previously mentioned poverty, the impending war with Spain acted as a restraint [67].
Migration as an adaptation method was not an option for all social groups. In a letter to the Duke of Newcastle from 16 July 1728, Hugh Boulter describes the situation of the Protestants as follows:
“We have hundreds of families (all protestants) removing out of the north to America, and the least obstruction in the linen-manufacture, by which the north subsists, must occasion greater numbers following […].
[41]
Even though we are not referring to any type of a push-and-pull theory on migration (further information on the theory see: de Haas, [75]; Heineberg, [76]; Lee, [77]), we use the central terms (push and pull) detached from the appending theory. The push factors for the described migration processes were manifold [13,40,67,68,72,73,74]. Food scarcity, a high unemployment rate, politically established inequalities, etc. (cf. previous sections) forced the people to migrate, in order to escape deprivation. The pull factors are directly connected to the previously mentioned shipping routes and information connectivity. In the times of the greatest scarcity in Ireland, the people saw ships from various places in America arriving with huge amounts of grain, which sparked hopes for a healthier and wealthier life abroad. Newspaper advertisements of shipping companies further raised this faith in a better life [57]. External effects influencing the decision-making processes of populations are also analyzed by constraint models of migration. The external constraints may relate to the social, economic and/or ecological sphere [78]. In the case of the Irish famines studied here, the use of the term “constraints” certainly makes sense. Counteracting the previously mentioned factors was the great poverty of a majority of the population, which posed a crucial barrier for migration. Therefore, the scale of emigration could have been even higher, but “mostly Irishmen (were) too poor to pay for the transatlantic passage” [67].

5. Conclusions

In this paper we, studied two Irish famines from the early 18th century (1728–1729 and 1740–1741) in order to widen the horizon of famine research. The role of weather and weather extremes as an initiating driver of famine in vulnerable societies becomes obvious considering the processes that led to both famines analyzed here. Even today, weather and weather extremes—besides other social and environmental dynamics—are important factors for agriculture-based societies, that are not independent from rainfall patterns or even entirely resilient against natural disasters such as hail storms, floods, etc. However, climate and weather extremes are but one factor when assessing the causes of famines. For them to have an impact as in 18th century Ireland, other factors, such as missing welfare, less open and inaccessible markets, or inequality inside society, need to be present.
Furthermore, both case studies underline the significance of migration as one adaptation alternative in times of famine. In this context, the importance of migration is manifold: Firstly, short-term migrations, such as seasonal labor migrations (from Ireland to London), could provide financial opportunities in times of distress. Secondly, short distance migration, in our case studies rural-to-urban, additionally provides chances for the hunger-affected groups: In the urban setting the access to all kinds of relief structures is better than in the countryside. Thirdly, long distance and mostly external migration (in our case studies mostly to America) often served as a life-saving adaptation strategy. Incoming ships, with heavy loads of grain of all sorts and letters from relatives already living abroad raised hopes for a better life in a different country. In this context migration can also be seen as a transformative process of the newly debated resilience paradigm [12].
Further mitigation of famines in the future profoundly depends on the right understanding of processes leading to famine. Since Sen [2] introduced his “Food Entitlement Decline” theory in the 1980s, environmental drivers were widely excluded from the debate on famine causation. The history of famines and the recent and still ongoing food scarcity at the Horn of Africa show that this is an important omission. Weather extremes certainly influence the outcome of harvests and thus have a strong impact on agricultural productivity. Due to climate change, we will likely face more situations of extreme weather in the future.
However, Famines are extremely complex and weather/climate is only one driver in the functional chain. The wide range of social, political and economic facets (such as inequity, poverty, power struggles, etc.) of famines are at least as important as the environmental drivers. Therefore, analyzing famines should follow a case-by-case approach. Additionally, famine research would profit from another change in perspective. It should focus much more on the affected population and societies and the circumstances they are living in. On the one hand, research on vulnerability, perception of own susceptibilities in the context of food insecurity and the capacity to adapt will be at the core of minimizing the occurrence of famines in the future. On the other hand, it will be crucial to change global food systems to a new form of sustainable production and consumption to achieve long-term food security.

Acknowledgments

The BMBF research project “Climates of Migration: Klimawandel und Umweltmigration in historischer Perspektive” by Christof Mauch, Franz Mauelshagen and Uwe Lübken offered valuable support to this research project. Thanks also to Saskia Dankwart-Kammoun, Esther Trost, Nora Schecke and Alexander Nolte (all at the “Institute for Advanced Study in the Humanities Essen”) for their help in bringing this study to fruition.
Johannes P. Werner gratefully acknowledges support by the Centre for Climate Dynamics (SKD) at the University of Bergen.

Conflicts of Interest

The authors declare no conflict of interest.

Appendix

As mentioned in the main text, there is not much climate archive data freely available for Ireland. We thus assess whether the four tree ring series of oak available in the International Tree ring Database (ITRDB) can be used to analyze past climate variability. Over Great Britain, oaks have recently been used by Wilson et al. [39] to reconstruct past droughts through the Palmer Drought Severity Index (PDSI). The PDSI basically integrates water balance anomalies: the normal state for any given location is a PDSI of zero. Should evapotranspiration (the amount of water evaporated from the surface and transpired by plants) exceed precipitation there will be a momentary moisture deficit and the PDSI will become negative. Should precipitation then increase or evapotranspiration decrease due to lower temperatures, the moisture balance will first normalize and finally become positive, as excess water accumulates (see, e.g., Cook et al. [79] for an application). A variant of the PDSI, the so-called self-calibrating PDSI (scPDSI) has been evaluated for Europe by the Climate Research Unit (CRU, see van der Schrier et al. [80]). We next try and calibrate the tree ring data to different seasonal averages of the scPDSI using different regression based methods.

Data 

The oak data by Baille and Pilcher (BRIT042, BRIT044) and Brown [35,36,37] were downloaded from the ITRDB and the chronologies imported into R and then standardized to zero mean and unit standard deviation. These data are referenced in the text and figures either by the ITRDB ID or the generic term ITRDB. The scPDSI as calculated by the CRU was sourced from the KNMI for a subset covering the island of Ireland only. As an initial test whether the tree ring data actually contain an scPDSI signal on the seasonal time scale, we calculate the cross correlation between the tree ring and the scPDSI data. Two of the series from Northern Ireland, BRIT042 and BRIT044, show some positive correlation with spring (March–May) scPDSI, the series from Dublin (BRIT054) exhibits at least some non-vanishing cross correlation with summer (June–August) scPDSI. The rest of the cross correlations is low and there seems to be scarcely any signal present in the BRIT055 series. Another, bigger, problem for our aim at estimating the PDSI in the early 18th century is the replication of the tree ring series: before the 1740s, the two series with most PDSI signal (BRIT042 and BRIT044) have only a sample depth of five individual measured series, which is inadequate for quantitative reconstructions. There is also a marked change in variability of the chronology. Likely, the changes in replication are not corrected for when calculating the average signal [81,82].

Methods 

Despite the shortcomings of the data outlined above, we nevertheless try to target the PDSI over Ireland, using the available tree ring chronologies. Often one aims at reconstructing climate in space and time, for which several different methods exist (see e.g., Smerdon et al. [83] and Werner et al. [84]). Here, the amount of available data in the pre-instrumental period is so low—two tree ring series at most for spring and summer scPDSI—that a spatial reconstruction is unfeasible and would not recover much more than regional averages. Using the method outlined by Tingley and Huybers [85,86] and Werner et al. [84], spatial estimates can in principle be derived. The method, termed BARCAST by Tingley and Huybers, is based on a postulated hierarchy of stochastic processes:
Ct+1 − μ = a × (Ct – μ) + et
Ot = Ht(b0 + b1Ct + eO,t)
Equation (A1) is also known as the process level model (how does the climate variable Ct evolve in space and time) and Equation (A2) is denoted as the data level model (how the Ot are created based on the climate variable at time t). The other parameters in Equation (A1) are the mean of the climate variable μ and the persistence term a, which can be interpreted as the year to year memory of the climate variable Ct. The term et is multivariate normal white noise, with (in this case) a covariance structure that is homogenous and exponentially decreasing in all directions with distance: et~N(0, Σ), Σi,j = σ·exp(−φ|xi − xj|), having a variability of σ and a decorrelation distance of 1/φ. The data level model Equation (A2) is just a linear response function with observational noise eO,t and a data selection matrix Ht, which contains a 1 at locations and times where observations are present and a zero otherwise. For full description of the model, please see Tingleey and Huybers [85,86].
From this, probability distributions for all parameters and variables of interest can be derived. These are then iteratively estimated, resulting theoretically in several realizations of draws from a high dimensional joint distribution for all parameters, variables of interest in space and time (each target location, each year) that are self consistent: a single “draw” of the climate (for all years and locations) fits the parameters that belong to this draw, and the spatio-temporal properties of the climate are correctly described by the parameters, a property that is more difficult to archive in linear regression methods. This needs to be kept in mind when analyzing the results. However, inspection of the derived set of parameters flags some important problems (see next section). Averaging over the spatial reconstruction returns an Ireland-average scPDSI, which resembles direct (regression based) estimates, targeting the Ireland-mean scPDSI directly—save for the amplitude and uncertainty bands—which is a direct consequence of the assumed linear relationship between the proxy and the target, the limited number of proxy series and the Central Limit Theorem. We thus also estimate the scPDSI through multivariate linear regression, as a comparison for the Bayesian reconstruction. Essentially, the exact method of regression (direct, indirect, and error in variables) is of no major concern here: the shape will be preserved and just the amplitude of the different reconstructions will change, along with their error bars. As the data quality is rather problematic prior to 1750, we will use the resulting reconstruction for qualitatively cross validating the assessments in the main article only.

Reconstructions and Discussion 

The reconstruction based on BARCAST delivers us more than just the estimated scPDSI: the method returns parameter estimates for the postulated stochastic models. These can be used to assess possible problems in the data quality as well as the applicability of the models used. Looking at the distribution of some of the estimated parameters (Figure A1), we can see that the persistence is relatively high (0.7) as is the interannual variability. Additionally, the observational error for the instrumental data is rather large. This hints that there could be some mismatch of proxy and instrumental data regarding their (mostly temporal) properties: There is likely more “memory” in the tree ring data than in the actual instrumental scPDSI data. The proxy response parameters (the linear parameter b1 and the noise strength, here denoted by tau) fit that of the initial assessment reported above.
Figure A2 shows the spring (MAM) and summer (JJA) scPDSI reconstructions, averaged over the whole island for both reconstruction methods (blue: BARCAST, red: linear regression, scaled) and the instrumental data (black line). Comparing only the instrumental (lat 150 years) portion among the two subplots shows striking similarity. Through the processes outlined above, scPDSI is an integrating measure and thus subsequent months (or seasons) are closely related. For BARCAST, the ensemble spread and the reconstruction mean are given. It can clearly be seen that (1) both methods return similar results (regarding the changes, but not the amplitudes) and (2) the width of the uncertainties of the linear regression estimates surpasses the amplitude of the reconstructed variability. This is a typical result when using a linear regression model with high noise data. Please note that although there is an apparent change in year-to-year variability (less fast fluctuations) prior to the instrumental period, this is an artifact of plotting the reconstruction mean rather than the individual trajectories. The reconstruction mean (averaged over all reconstructions derived through BARCAST) serves as a sort of best estimate in an L2 norm sense. As noted for the instrumental period, the reconstructed scPDSI of both seasons (spring and summer) is very similar when comparing both seasons.
Figure A1. Histogram of drawn parameters, process level and instrumental noise (top row) and data level (proxy response) arranged by columns. Proxy noise strength in second row, offset b0 and slope b1 in third and fourth row.
Climate 03 01035 g003
Figure A2. Ireland wide averaged seasonal scPDSI for spring (MAM, top row) and summer (JJA, bottom row) using two different methods: BARCAST (blue) and direct linear regression (red) with uncertainties (90%, shaded) and instrumental data (black line). The scPDSI of MAM and JJA is very similar (both instrumental data and reconstruction).
Climate 03 01035 g004
Figure A3. 18th century scPDSI for MAM (left) and JJA (right). Since they are based on the same data but with slightly different weights, they are almost indistinguishable.
Climate 03 01035 g005
Figure A3 shows the reconstruction for the conditions during the first half of the 18th century. The data support the findings in Section 3 of the main text. We, however, caution against using the data for more than a superficial comparison. As shown above, the signal content of the tree ring data is really low, which might be the reason why the original authors of the used ITRDB data did not use them for climate reconstructions, and additionally in the data made available through the ITRDB, the variance adjustment problem is likely not addressed.

References

  1. Stehr, N.; von Storch, H. Climate Determines: An Anatomy of a Disbanded Line of Research. 1998. Available online: http://www.hvonstorch.de/klima/pdf/Climate.determines.pdf (accessed on 15 July 2015).
  2. Sen, A. Poverty and Famines: An Essay on Entitlement and Deprivation; Oxford University Press: Oxford, UK, 1981. [Google Scholar]
  3. Sen, A. Resources, Values and Development; Oxford University Press: Oxford, UK, 1984. [Google Scholar]
  4. Devereux, S. Theories of Famine; Harvester Wheatsheaf: New York, NY, USA, 1993. [Google Scholar]
  5. Ó Gráda, C. Famine: A Short History; Princeton University Press: Princeton, NJ, USA, 2009. [Google Scholar]
  6. Okorafor Ndubuisi, J. The Sahelian drought and migration of the Fulani’s into Nigeria, 1970–2000. In Proceedings of the Conference on Environmental Change and Migration in historical Perspective, Munich, Germany, 4–6 August 2011.
  7. Feed the Future Fact Sheet: Feed the Future. Available online: http://www.feedthefuture.gov/ (accessed on 19 October 2011).
  8. Wolde-Mariam, M. Rural Vulnerability to Famine in Ethiopia, 1958–1977; Stosius Inc/Advent Books Division: Addis Ababa, Ethiopia, 1984. [Google Scholar]
  9. WHO Famine Risk. 2012. Available online: http://www.who.int/entity/ceh/indicators/faminerisk.pdf (accessed on 1 October 2012).
  10. Engler, S. Developing a historically based Famine Vulnerability Analysis Model (FVAM)—An interdisciplinary approach. Erdkd. Arch. Sci. Geogr. 2012, 66, 157–172. [Google Scholar] [CrossRef]
  11. Engler, S.; Mauelshagen, F.; Werner, J.; Luterbacher, J. The Irish famine of 1740–1741: Famine vulnerability and “climate migration”. Clim. Past 2013, 9, 1161–1179. [Google Scholar] [CrossRef]
  12. Von Grebmer, K.; Headey, D.; Olofinbiyi, T.; Wiesmann, D.; Fritschel, H.; Yin, S.; Yohannes, Y.; Foley, C.; von Oppeln, C.; Iseli, B.; et al. 2013 Global Hunger Index. The Challenge of Hunger: Building Resilience to Achieve Food and Nutrition Security. Available online: http://www.ifpri.org/sites/default/files/publications/ghi13.pdf (accessed on 14 December 2013).
  13. Dickson, D. Arctic Ireland: The Extraordinary Story of the Great Frost and Forgotten Famine of 1740–1741; The White Row Press: Belfast, Northern Ireland, 1997. [Google Scholar]
  14. Blaikie, P.M.; Connon, T.; Davis, J.; Wisner, B. At risk: Natural Hazards, People’s Vulnerability, and Disasters; Routledge: London, UK, 2014. [Google Scholar]
  15. Oliver-Smith, A. Peru’s five hundred year earthquake: Vulnerability in historical context. In Disasters, Development and Environment; Varley, A.J., Ed.; Wiley: Chichester, NY, USA, 1994; pp. 3–48. [Google Scholar]
  16. Cutter, S.L. Vulnerability to environmental hazards. Prog. Hum. Geogr. 1996, 20, 529–539. [Google Scholar] [CrossRef]
  17. Füssel, H.M. Vulnerability: A generally applicable conceptual framework for climate change research. Glob. Environ. Chang. 2007, 17, 155–167. [Google Scholar] [CrossRef]
  18. Intergovernmental Panel on Climate Change (IPCC). Managing the Risk of Extreme Events and Disasters to Advance Climate Change Adaptation; Cambridge University Press: Cambridge, UK, 2012.
  19. Collet, D. “Vulnerabilität” als brückenkonzept der hungerforschung. In Handeln in Hungerkrisen, Neue Perspektiven auf Soziale und Klimatische Vulnerabilität; Collet, D., Schanbacher, A., Lassen, T., Eds.; Universitätsverlag Göttingen: Göttingen, Germany, 2012; pp. 13–25. [Google Scholar]
  20. Oliver-Smith, A. Theorizing Vulnerability in a globalized world. A political ecological perspective. In Mapping Vulnerability: Disasters, Development and People; Bankoff, G., Frerks, G., Hilhorst, D., Eds.; Earthscan: London, UK, 2004; pp. 10–24. [Google Scholar]
  21. Schneider, U.; Becker, A.; Finger, P.; Meyer-Christoffer, A.; Rudolf, B.; Ziese, M. GPCC Monitoring Product: Near Real-Time Monthly Land-Surface Precipitation from Rain-Gauges Based on SYNOP and CLIMAT Data; GPCC: Ahmedabad, India, 2011. [Google Scholar]
  22. Rohde, R.; Muller, R.A. A new estimate of the average earth surface land temperature spanning 1753 to 2011. Geoinform. Geostat. Overv. 2013, 1. [Google Scholar] [CrossRef]
  23. Werner, J.P.; White, J.W.; Yasue, K.; Zorita, E. Continental-scale temperature variability during the past two millennia. Nat. Geosci. 2013, 6, 339–348. [Google Scholar]
  24. Guiot, J.; Corona, C.; ESCARSEL Members. Growing season temperatures in Europe and climate forcings over the past 1400 years. PLoS ONE 2010. [Google Scholar] [CrossRef] [PubMed]
  25. Luterbacher, J.; Dietrich, D.; Xoplaki, E.; Grosjean, M.; Wanner, H. European seasonal and annual temperature variability, trends, and extremes since 1500. Science 2004, 303, 1499–1503. [Google Scholar] [CrossRef] [PubMed]
  26. Xoplaki, E.; Luterbacher, J.; Paeth, H.; Dietrich, D.; Steiner, N.; Grosjean, M.; Wanner, H. European spring and autumn temperature variability and change of extremes over the last half millennium. Geophys. Res. Lett. 2005. [Google Scholar] [CrossRef]
  27. Pauling, A.; Luterbacher, J.; Casty, C.; Wanner, H. 500 years of gridded high-resolution precipitation reconstructions over Europe and the connection to large-scale circulation. Clim. Dyn. 2006, 26, 387–405. [Google Scholar] [CrossRef]
  28. Wanner, H.; Brázdil, R.; Frich, P.; Fryhendahl, K.; Jonsson, T.; Kington, J.; Pfister, C.; Rosenørn, S.; Wishman, E. Synoptic interpretation of monthly weather maps for the late Maunder Minimum (1675–1704). In Climatic Trends and Anomalies in Europe 1675–1715; Frenzel, B., Ed.; Gustav-Fischer-Verlag: Stuttgart, Germany, 1994; pp. 401–424. [Google Scholar]
  29. Wanner, H.; Pfister, C.; Brázdil, R.; Frich, P.; Frydendahl, K.; Jónsson, T.; Kington, J.; Lamb, H.H.; Rosenørn, S.; Wishman, E. Wintertime European circulation patterns during the Late Maunder Minimum cooling period (1675–1704). Theor. Appl. Climatol. 1995, 51, 167–175. [Google Scholar] [CrossRef]
  30. Wheeler, D.; García-Herrera, R.; Wilkinson, C.W.; Ward, C. Atmospheric circulation and storminess derived from Royal Navy logbooks: 1685 to 1750. Clim. Chang. 2010, 101, 257–280. [Google Scholar] [CrossRef]
  31. Luterbacher, J.; Xoplaki, E.; Dietrich, D.; Rickli, R.; Jacobeit, J.; Beck, C.; Gyalistras, D.; Schmutz, C.; Wanner, H. Reconstruction of Sea Level Pressure fields over the Eastern North Atlantic and Europe back to 1500. Clim. Dyn. 2002, 18, 545–561. [Google Scholar] [CrossRef]
  32. Trouet, V.; Esper, J.; Graham, N.E.; Baker, A.; Scourse, J.D.; Frank, D.C. Persistent positive North Atlantic Oscillation mode dominated the Medieval Climate Anomaly. Science 2009, 324, 78–80. [Google Scholar] [CrossRef] [PubMed]
  33. Pfister, C. Grain Price Formation and Weather Patterns in Europe Prior to the Railway Age; Rachel Carson Center: München, Germany, 2011. [Google Scholar]
  34. Fuller, M.P.; Hamed, F.; Wisniewski, M.; Glenn, D.M. Protection of plants from frost using hydrophobic particle film and acrylic polymer. Ann. Appl. Biol. 2003, 143, 93–97. [Google Scholar] [CrossRef]
  35. Baillie, M.G.L.; Pilcher, J.R. ITRDB Record BRIT044 “Castle Coole”. 2014. Available online: http://hurricane.ncdc.noaa.gov/pls/paleox/f?p=519:1:::::P1_STUDY_ID:2671 (accessed on 21 July 2014). [Google Scholar]
  36. Brown, D.M. ITRDB Record BRIT054 “Phoenix Park Dublin”. 2014. Available online: http://hurricane.ncdc.noaa.gov/pls/paleox/f?p=519:1:::::P1_STUDY_ID:10508 (accessed on 21 July 2014). [Google Scholar]
  37. Brown, D.M. ITRDB Record BRIT055 “Belvoir Park Forest”. 2014. Available online: http://hurricane.ncdc.noaa.gov/pls/paleox/f?p=519:1:::::P1_STUDY_ID:10509 (accessed on 21 July 2014). [Google Scholar]
  38. Buentgen, U.; Tegel, W.; Nicolussi, K.; McCormick, M.; Frank, D.; Trouet, V.; Kaplan, J.O.; Herzig, F.; Heussner, K.U.; Wanner, H.; et al. 2500 Years of European Climate Variability and Human Susceptibility. Science 2011, 331, 578–582. [Google Scholar] [CrossRef] [PubMed]
  39. Wilson, R.J.S.; Miles, D.; Loader, N.; Melvin, T.M.; Cunningham, L.; Cooper, R.J.; Briffa, K.R. A millennial long March-July precipitation reconstruction for southern-central England. Clim. Dyn. 2013, 40, 997–1017. [Google Scholar] [CrossRef]
  40. O’Brien, G.A.T. The Economic History of Ireland in the Eighteenth Century; Nabu Press: Dublin, Ireland; London, UK, 1918. [Google Scholar]
  41. Boulter, H. Letters Written by His Excellency Hugh Boulter, D.D. Lord Primate of All Ireland, etc. to Several Ministers of State in England, and Some Others. Containing, an Account of the most Interesting Transactions Which Passed Ireland from 1724 to 1738; George Faulkner and James Williams: Dublin, Ireland, 1770. [Google Scholar]
  42. Manley, G. The mean temperature of central England, 1698–1952. Q. J. R. Meteorol. Soc. 1953, 79, 242–261. [Google Scholar] [CrossRef]
  43. Kelly, J. Harvest and hardship: Famine and scarcity in Ireland in the late 1720s. Stud. Hibernica 1992, 26, 65–105. [Google Scholar]
  44. Crowley, T.J.; Unterman, M.B. Technical details concerning development of a 1200-yr proxy index for global volcanism. Earth Syst. Sci. Data Discuss. 2012, 5, 1–28. [Google Scholar] [CrossRef]
  45. Zanchettin, D.; Timmreck, C.; Bothe, O.; Lorenz, S.J.; Hegerl, G.; Graf, H.F.; Luterbacher, J.; Jungclaus, J.H. Delayed winter warming: A robust decadal response to strong tropical volcanic eruptions? Geophys. Res. 2013, 40, 204–209. [Google Scholar] [CrossRef]
  46. Grieser, J.; Schönwiese, C.D. Parametrization of spatio-temporal patterns of volcanic aerosol induced stratospheric optical depth and its climate radiative forcing. Atmòsfera 1999, 12, 111–113. [Google Scholar]
  47. McCracken, J.L. The social structure and social life, 1714–1760. In A new history of Ireland, IV: Eighteenth-century Ireland, 1691–1800; Moody, T.W., Vaughan, W.E., Eds.; Oxford University Press: Oxford, UK, 1986; pp. 31–56. [Google Scholar]
  48. Smyth, W.J. Map-Making, Landscapes and Memory: A Geography of Colonial and Early Modern Ireland c.1530–1750; Cork University Press: Cork, Ireland, 2006. [Google Scholar]
  49. Drapier, M.B. A Letter to the People of Ireland; Thomas Hume: Dublin, Ireland, 1729. [Google Scholar]
  50. Church of Ireland. Parish Registers in the National Archives of Ireland. 1729. [Google Scholar]
  51. Faulkner, G. Newspaper Section: Dublin; Microfilm Material of the National Library of Ireland: Dublin, Ireland, 1729. [Google Scholar]
  52. Mauelshagen, F. Klimageschichte der Neuzeit, 1500–1900; WBG: Darmstadt, Germany, 2010. [Google Scholar]
  53. Post, J.D. Climatic variability and the European mortality wave of the early I740s. J. Interdiscip. Hist. 1984, 15, 1–30. [Google Scholar] [CrossRef] [PubMed]
  54. Post, J.D. Nutritional status and mortality in eighteenth-century Europe. In Hunger in History: Food Shortage, Poverty, and Deprivation; Newman, L.F., Ed.; Wiley & Sons: Cambridge, UK, 1995; pp. 241–280. [Google Scholar]
  55. Salaman, R. The History and Social Influence of the Potato; Cambridge University Press: Cambridge, UK, 1985. [Google Scholar]
  56. Reilly, R. The Dublin News-Letter: Newspaper Section: Dublin; Microfilm Material of the National Library of Ireland: Dublin, Ireland, 1740. [Google Scholar]
  57. Faulkner, G. The Dublin Journal: Newspaper Section: Dublin; Microfilm Material of the National Library of Ireland: Dublin, Ireland, 1740. [Google Scholar]
  58. Faulkner, G. The Dublin Journal: Newspaper Section: Dublin; Microfilm Material of the National Library of Ireland: Dublin, Ireland, 1740a. [Google Scholar]
  59. Ó Dálaigh, B. Ennis in the 18th Century: Portrait of an Urban Community; Irish Academic Press: Dublin, Ireland, 1995. [Google Scholar]
  60. Lloyd, E. A Description of the Flourishing City of Corke: The Second City in the Kingdom of Ireland; But the First Sea-Port for Trade; Andrew Welsh: Cork, Ireland, 1732. [Google Scholar]
  61. Warburton, J.; Whitelaw, J.; Walsh, R. History of the City of Dublin: From the Earliest Accounts to the Present Time; Containing Its Annals, Antiquities, Ecclesiastical History, and Charters; Its Present Extent, Public Buildings, Schools, Institutions, &c. to Which are Added, Biographical Notices of Eminent Men, and Copious Appendices of Its Population, Revenue, Commerce, and Literature; W. Bulmer and Co. Cleveland-Row: London, UK, 1818; Volume I. [Google Scholar]
  62. Dobson, D. Ships from Ireland to Early America, 1623–1850; Clearfield: Baltimore, MD, USA, 1999; Volume 1. [Google Scholar]
  63. Dobson, D. Ships from Ireland to Early America, 1623–1850; Clearfield: Baltimore, MD, USA, 2004; Volume 2. [Google Scholar]
  64. Dobson, D. Ships from Ireland to Early America, 1623–1850; Clearfield: Baltimore, MD, USA, 2010; Volume 3. [Google Scholar]
  65. Smyth, W.J. Irland und nordirland. In Enzyklopädie. Migration in Europa. Vom 17. Jahrhundert bis zur Gegenwart; Bade, K.J., Emmer, P.C., Lucassen, L., Oltmer, J., Eds.; Ferdinand Schöningh: Paderborn, Germany, 2008; pp. 85–94. [Google Scholar]
  66. The Dublin Gazette. Newspaper Section: Dublin, 21 June 1740; Microfilm Material of the National Library of Ireland: Dublin, Ireland, 1740. [Google Scholar]
  67. Wokeck, M.S. German and Irish immigration to colonial Philadelphia. Proc. Am. Philos. Soc. 1989, 133, 128–143. [Google Scholar]
  68. Wokeck, M.S. Trade in Strangers: The Beginnings of Mass Migration to North America; Pennsylvania State University Press: University Park, PA, USA, 2003. [Google Scholar]
  69. Findlay, A.M. Migrant destinations in an era of environmental change. Glob. Environ. Chang. 2011, 21, 1–9. [Google Scholar] [CrossRef]
  70. Miller, K.A.; Schrier, A.; Boling, B.D.; Doyle, D.N. Irish Immigrants in the Land of Canaan: Letters and Memoirs from Colonial and Revolutionary America, 1675–1815; Oxford University Press: Oxford, UK, 2003. [Google Scholar]
  71. Faulkner, G. Newspaper Section: Extract of a Letter from a Gentleman in the Country to His Friend in Dublin; Microfilm Material of the National Library of Ireland: Dublin, Ireland, 1729. [Google Scholar]
  72. Fitzgerald, P.; Lambkin, B. Migration in Irish History, 1607–2007; Palgrave: Basingstoke, UK, 2008. [Google Scholar]
  73. Cullen, L.M. The Emergence of Modern Ireland, 1600–1900; Batsford: Dublin, Ireland, 1981. [Google Scholar]
  74. Stevenson, J. Two Centuries of Life in Down 1600–1800; The Linenhall Press: Belfast, Northern Ireland; Dublin, Ireland, 1920. [Google Scholar]
  75. De Haas, H. Migration and Development—A Theoretical Perspective; University of Oxford: Oxford, UK, 2008. [Google Scholar]
  76. Heineberg, H. Einführung in die Anthropogeographie/Humangeographie; Schöningh and UTB: Paderborn, Germany, 2004. [Google Scholar]
  77. Lee, E. A theory of migration. Demography 1966, 3, 47–57. [Google Scholar] [CrossRef]
  78. Bähr, J. Bevölkerungsgeographie Verteilung und Dynamik der Bevölkerung in Globaler, Nationaler und Regionaler Sicht; UTB: Stuttgart, Germany, 1997. [Google Scholar]
  79. Cook, E.R.; Meko, D.M.; Stahle, D.W.; Cleaveland, M.K. Drought reconstructions for the continental United States. J. Clim. 1999, 12, 1145–1162. [Google Scholar] [CrossRef]
  80. Van der Schrier, G.; Briffa, K.R.; Jones, P.D.; Osborn, T.J. Summer moisture variability across Europe. J. Clim. 2006, 19, 2828–2834. [Google Scholar] [CrossRef]
  81. Frank, D.; Esper, J.; Cook, E. On variance adjustments in tree-ring chronology development. In Tree Rings in Archaeology, Climatology and Ecology; TRACE, 2006; Volume 4, pp. 56–66. [Google Scholar]
  82. Wigley, T.M.L.; Briffa, K.R.; Jones, P.D. On the average value of correlated time series, with applications in dendroclimatology and hydroclimatology. J. Clim. Appl. Meteorol. 1984, 23, 201–213. [Google Scholar] [CrossRef]
  83. Smerdon, J.E.; Kaplan, A.; Chang, D.; Evans, M.N. A pseudoproxy evaluation of the CCA and RegEM methods for reconstructing climate fields of the last Millennium. J. Clim. 2011, 24, 1284–1309. [Google Scholar] [CrossRef]
  84. Werner, J.P.; Smerdon, J.E.; Luterbacher, J. A pseudoproxy evaluation of Bayesian Hierarchical Modelling and canonical correlation analysis for climate field reconstructions over Europe. J. Clim. 2013, 26, 851–867. [Google Scholar] [CrossRef]
  85. Tingley, M.P.; Huybers, P. A Bayesian algorithm for reconstructing climate anomalies in space and time. Part I: Development and applications to paleoclimate reconstruction problems. J. Clim. 2010, 23, 2759–2781. [Google Scholar]
  86. Tingley, M.P.; Huybers, P. A Bayesian algorithm for reconstructing climate anomalies in space and time. Part II: Comparison with the regularized expectation-maximization algorithm. J. Clim. 2010, 23, 2782–2800. [Google Scholar] [CrossRef]

