1. Introduction and Background
Due to an increase in population, urbanisation and resource demand, developing countries in arid regions of Sub-Saharan Africa face the highest risk from both physical and economic water scarcity [
1,
2]. Future water security, principally projected in rainfall patters, in this region remains undetermined, and this uncertainty, combined with the inherent uncertainty in population and resource demand projections and interactions, leads to a large overall uncertainty in future water scarcity. The importance of the relationship between water, energy, and food is better understood through interrelated modelling [
3]. Through this, strategies can be formulated that aim to best and fairly satisfy the demands of all affected parties, whether that be domestic users, industrial users or the ecosystem, amongst others [
4,
5,
6,
7]. With uncertain resource supplies and demand, it is important to assess the reliability and robustness of a system through modelling—this can be especially crucial to understand the risk faced by developing countries in managing their resources. The combination of uncertainty from climate change and socio-economic and demographic factors, such as population growth, creates significant levels of uncertainty that must be accounted for when planning for future system operation [
8]. There is much literature on water resource models incorporating different uncertainty such as climate change and future demand [
9,
10,
11]. In addition, much of the literature surrounds the modelling of resource systems that consider the uncertainty and risk; an interested reader is referred to the work of [
12,
13,
14,
15] on risk-based modelling of water resource system planning, its definition, and implementation as well as the work of [
16,
17,
18] on defining and quantifying the metrics for robustness and reliability for assessment of supply systems under climate change. Most of these works, although different in application, share the same principle that
reliability is the probability that the system under consideration is in a non-failure state [
19] and that the
robustness incorporates the concept of reliability, and represents the capability of a system to be able to absorb and withstand disturbances and crises whilst still operating in a non-failure state [
12,
20]. In this study, a simulation-based optimisation model was formulated to assess the reliability and robustness of the Masinga reservoir planning system in Kenya under both climate and demand uncertainties.
Case Study: Kenya’s Masinga Dam
Kenya’s Tana river basin accounts for 21% of the total land area of Kenya, and is essential for meeting Kenya’s agriculture and municipal water demands; it provides 80% of the water for Nairobi, and generates a great deal of Kenya’s power [
21]. The river also provides for much of Kenya’s population, including eight million people who live along it, with water for food. Due to poor management, however, the river’s health is under threat [
21]. Kenya suffers from both physical water scarcity and economic water scarcity; its renewable surface water volume is only 650 m
3 per capita, well below the recommended minimum of 1000 m
3 [
22]. As with many developing countries, Kenya utilises hydroelectric power to account for a large share of its installed capacity: 52.1% is generated by hydroelectric sources, and the major power generators are part of the Seven Forks Scheme on the Tana River [
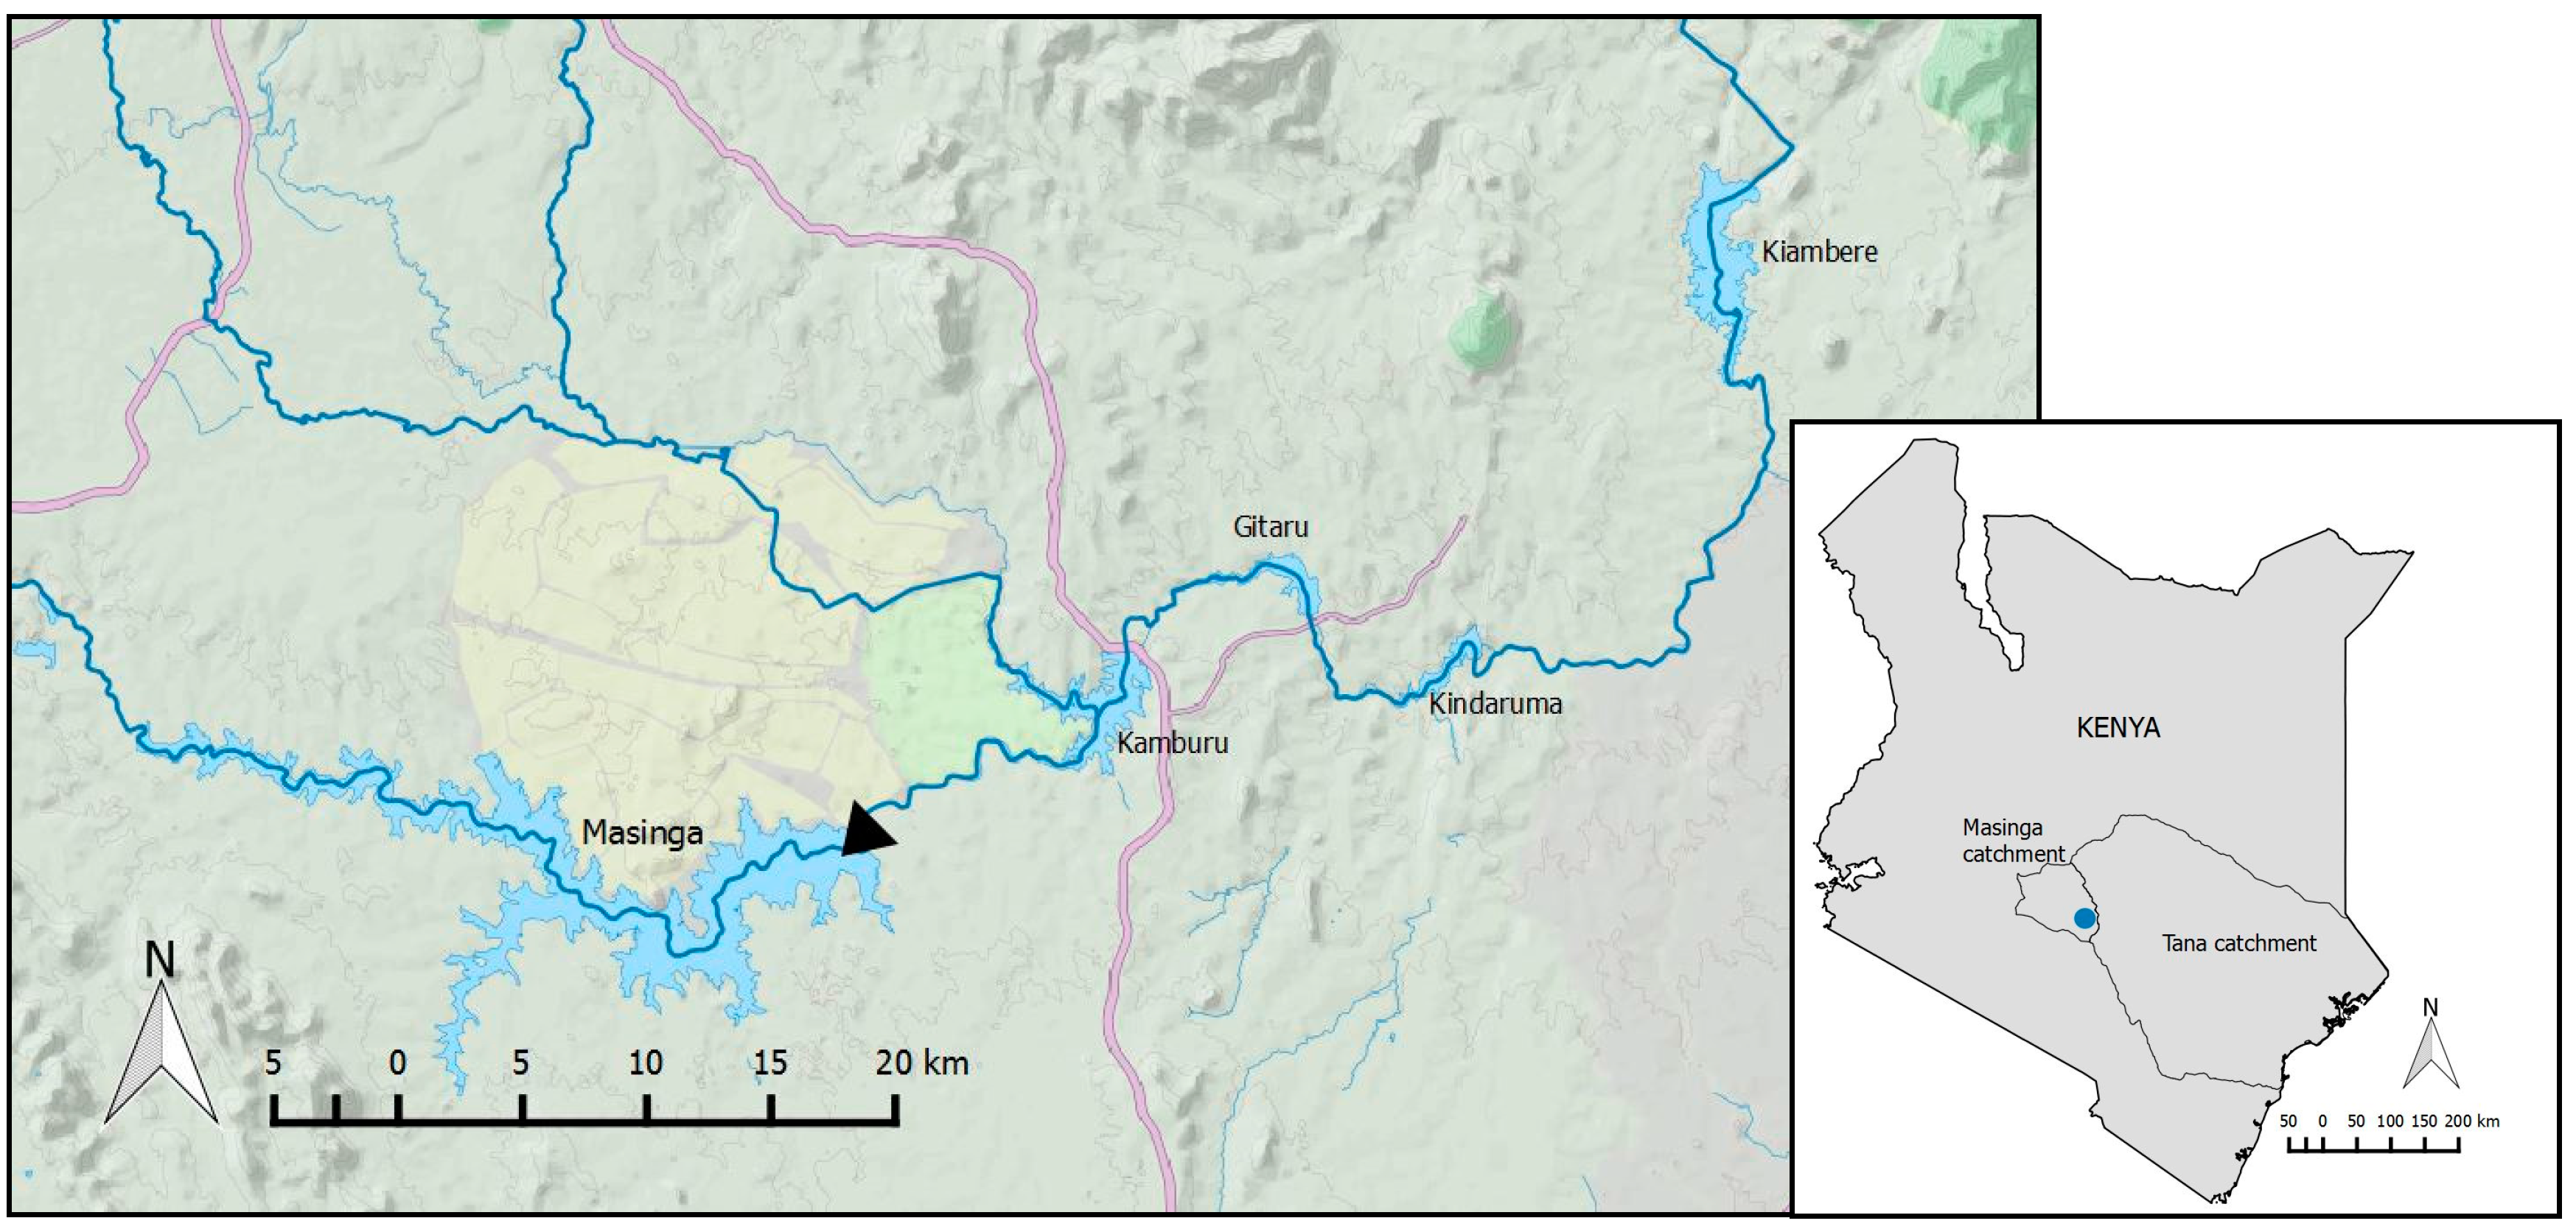
23]. The Masinga dam is the first dam on the stretch (
Figure 1) and, despite only having a maximum output of 40 MW, has by far the largest reservoir — holding 1560 MCM [
24,
25]. This reservoir is essential for supplying the local area with water, as it hosts large areas of agriculture. The Tana river basin experiences relatively even temperatures across the year, but there is a large variability in rainfall in the Tana basin over a year, which the makes the Masinga reservoir and dam critical in regulating water quantities in the area. Additionally, the Masinga reservoir plays an important ecological role, and is home to fish, hippopotamus, and crocodiles; the fish here are supplied to the local area, and so also provide residents with income [
26].
With Kenya’s projected increase in fossil fuel and nuclear power generation, the reliance on the electrical output from the Seven Forks dams is to lessen (hydropower’s share will fall from 50% to 5% by 2031) [
27]. Kenya is currently in the early stages of implementing its “Vision 2030” plan, a long-term development policy aiming to enable the country to become a middle-income, industrialising country [
28]. As part of this plan, the Tana River Basin is expected to have irrigation schemes being implemented along its entirety which will dramatically increase water demand in the entire basin [
25,
29,
30]. This is part of the government’s plan to utilise agriculture as a key sector to help reach the desired 10% annual economic growth rate in 2030 [
28]. Additionally, the plan includes ten proposed reservoirs and dams, as well as both new intra-basin water transfer systems, and expansions to existing ones—as with the Masinga-Kitui reservoir link.
2. Masinga Dam Model Building
To model the Masinga dam system, the system’s parameters should be identified. In addition, projected data for reservoir inflow, population growth, municipal and irrigation demand, as well as flow required to meet the power demand should be collected. Although likely to be an important factor for the future of the Masinga reservoir and dam, the impact and occurrence of extreme climate events, such as heavy rainfall or drought, were not assessed in this study given the lack of relevant data, uncertainties of precipitation predications and the link to hydrological models, as well as the uncertainties surrounding the potential impacts on agricultural and municipal dynamics. Instead, this study assesses the robustness and resilience of the system against multiple, broad-ranging different future scenarios, which, over the longer time-periods assessed, was considered appropriate.
2.1. Data Collection
The key system parameter data values are given in
Table 1. Data for monthly river flow from the Tana River were obtained for the period 1934–1975 from ORNL DACC [
31], and scaled to match reservoir inflow data from Oludhe et al. [
32]. Note that sedimentation was not considered in this study, although it has been noted that it is a potentially significant issue for the reservoir system [
23,
33]. The uncertainty surrounding sedimentation in the Masinga reservoir is notably large [
33], and to model comprehensively would require large assumptions regarding the effects of precipitation, and any dredging or catchment management efforts; consequently, it fell outside the scope of this project.
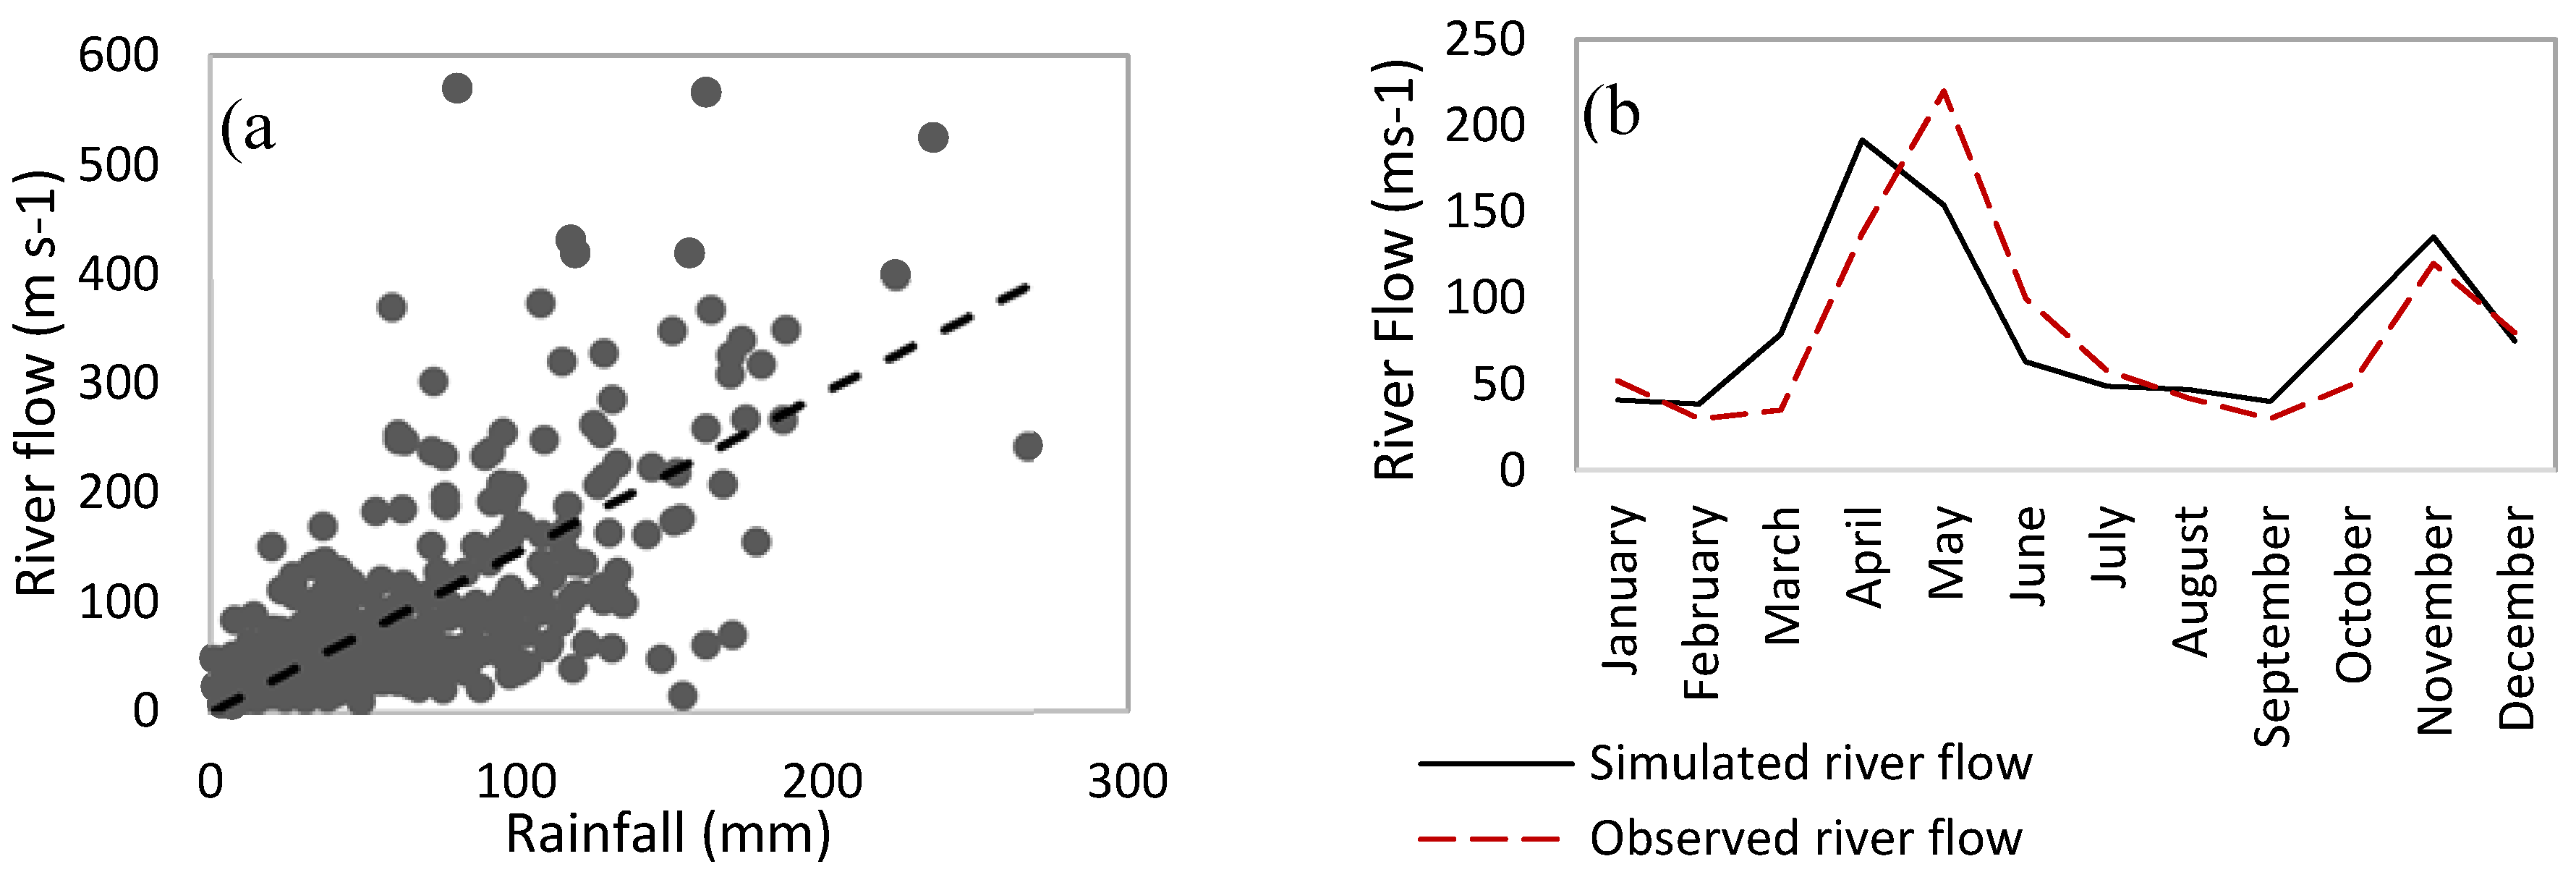
From this data, projected inflow data for the reservoir were created, through regression analysis, based on historic relationships between the river’s flow and climatic data [
36] (
Figure 2).
The projected rainfall data are from four different climate models: CGCM2 (Coupled Global Climate Model version 2), CSIRO2 (Commonwealth Scientific and Industrial Research Organisation model version 2), HadCM3 (Hadley Centre Coupled Model, version 3), and PCM (Parallel Climate Model). These four models are those used in the Third Assessment Working Group 1 Report by IPCC [
37], and each approaches climate projections with different sensitivities and climate responses. Each model projected for four key IPCC scenarios: A1FI, A2, B1, and B2. The A1FI scenario is fossil-intensive, and represents rapid economic growth, and a peak in population by mid-century, followed by strong technological advancement. The A2 scenario describes continuous population growth, but slow economic and technological change. The B1 has a similar population growth pattern to A1FI, but with rapid economic change, and the introduction of clean technologies. The B2 scenario describes a slower-paced population growth rate than A2 with slower and more diverse technological change, with an orientation toward environmental protection and social equity [
37]. Of the four scenarios, A1FI is the scenario expected to produce the largest amount of CO
2, followed by A2, B2, and then B1. In this way, A1FI is the worst-case scenario, and B1 is the best-case scenario. Each of the four models creates different projections for rainfall to 2050 in Kenya. The variation between the 16 scenarios is considered to be the complete range of possible future rainfall, and thus the basis for the entire range of future possible river flows for each given year. For each month, a probability distribution is created, and the ranges of 5%, 20%, 50%, 80% and 95% are specified, whereby, for example, the inflow rate associated with the 20% probability is the value for which there is a 20% chance that the flow rate will be lower than this value.
Probabilistic population projections are obtained for Kenya from the United Nations [
38]. The rate of population growth for Kenya is consistent with the expected rate of growth for the Tana basin as described by Nippon Koei [
39], and so are considered suitable for our study of Masinga dam. Current values of municipal and irrigation demand for different crops in the area (sugar cane, cotton, and rice) are taken from Kiptala [
40] and Hurford and Harou [
25], and are divided by a representative population to create a fixed per-capita value for the irrigation and municipal demand projections; irrigation demand varies depending on month (see
Table 2), and is lessened by increased rainfall, whereas municipal demand is assumed constant throughout the year, as it often does not vary considerably [
41,
42]. These values are tied to the population projections to project total increase in municipal and irrigation demand over time, as well as their respective uncertainty ranges. Irrigation demand is assumed to grow proportionately to population on the basis that food demand grows proportionately to population [
43]. It should be noted that the uncertainty in population projections is much smaller than that for climate projections.
Economic advancement, resulting in better irrigation efficiency or a change in diet, is not assumed in this study. Similarly, growth in demand for municipal water due to economic advancement is not considered as a factor. The proposed 1000 ha irrigation project for Masinga has similar variation in monthly demand to this base irrigation, and is forecast to grow linearly from 2015 to 2030, when it is expected to be completed. From 2030 onward, it is expected to continue to grow at a rate consistent with population, with the assumption that additional related demands would continue to grow [
39]. As all of Kenya’s rice is grown just north of the Masinga dam [
44], the 1000 ha irrigation project is assumed to be rice.
Figure 3 shows the proportions of demand for the median scenario.
2.2. Model Construction
The study aims to create a model to optimise the quantity of extra water available for selected timeframes. This enables both the simulation of the incoming and outgoing water quantities based upon projected reservoir flow and demands, and to assess how well the system can cope with large seasonal differences. The model is designed to be run for each year between 2015 and 2050, as well as any given range of years within this period.
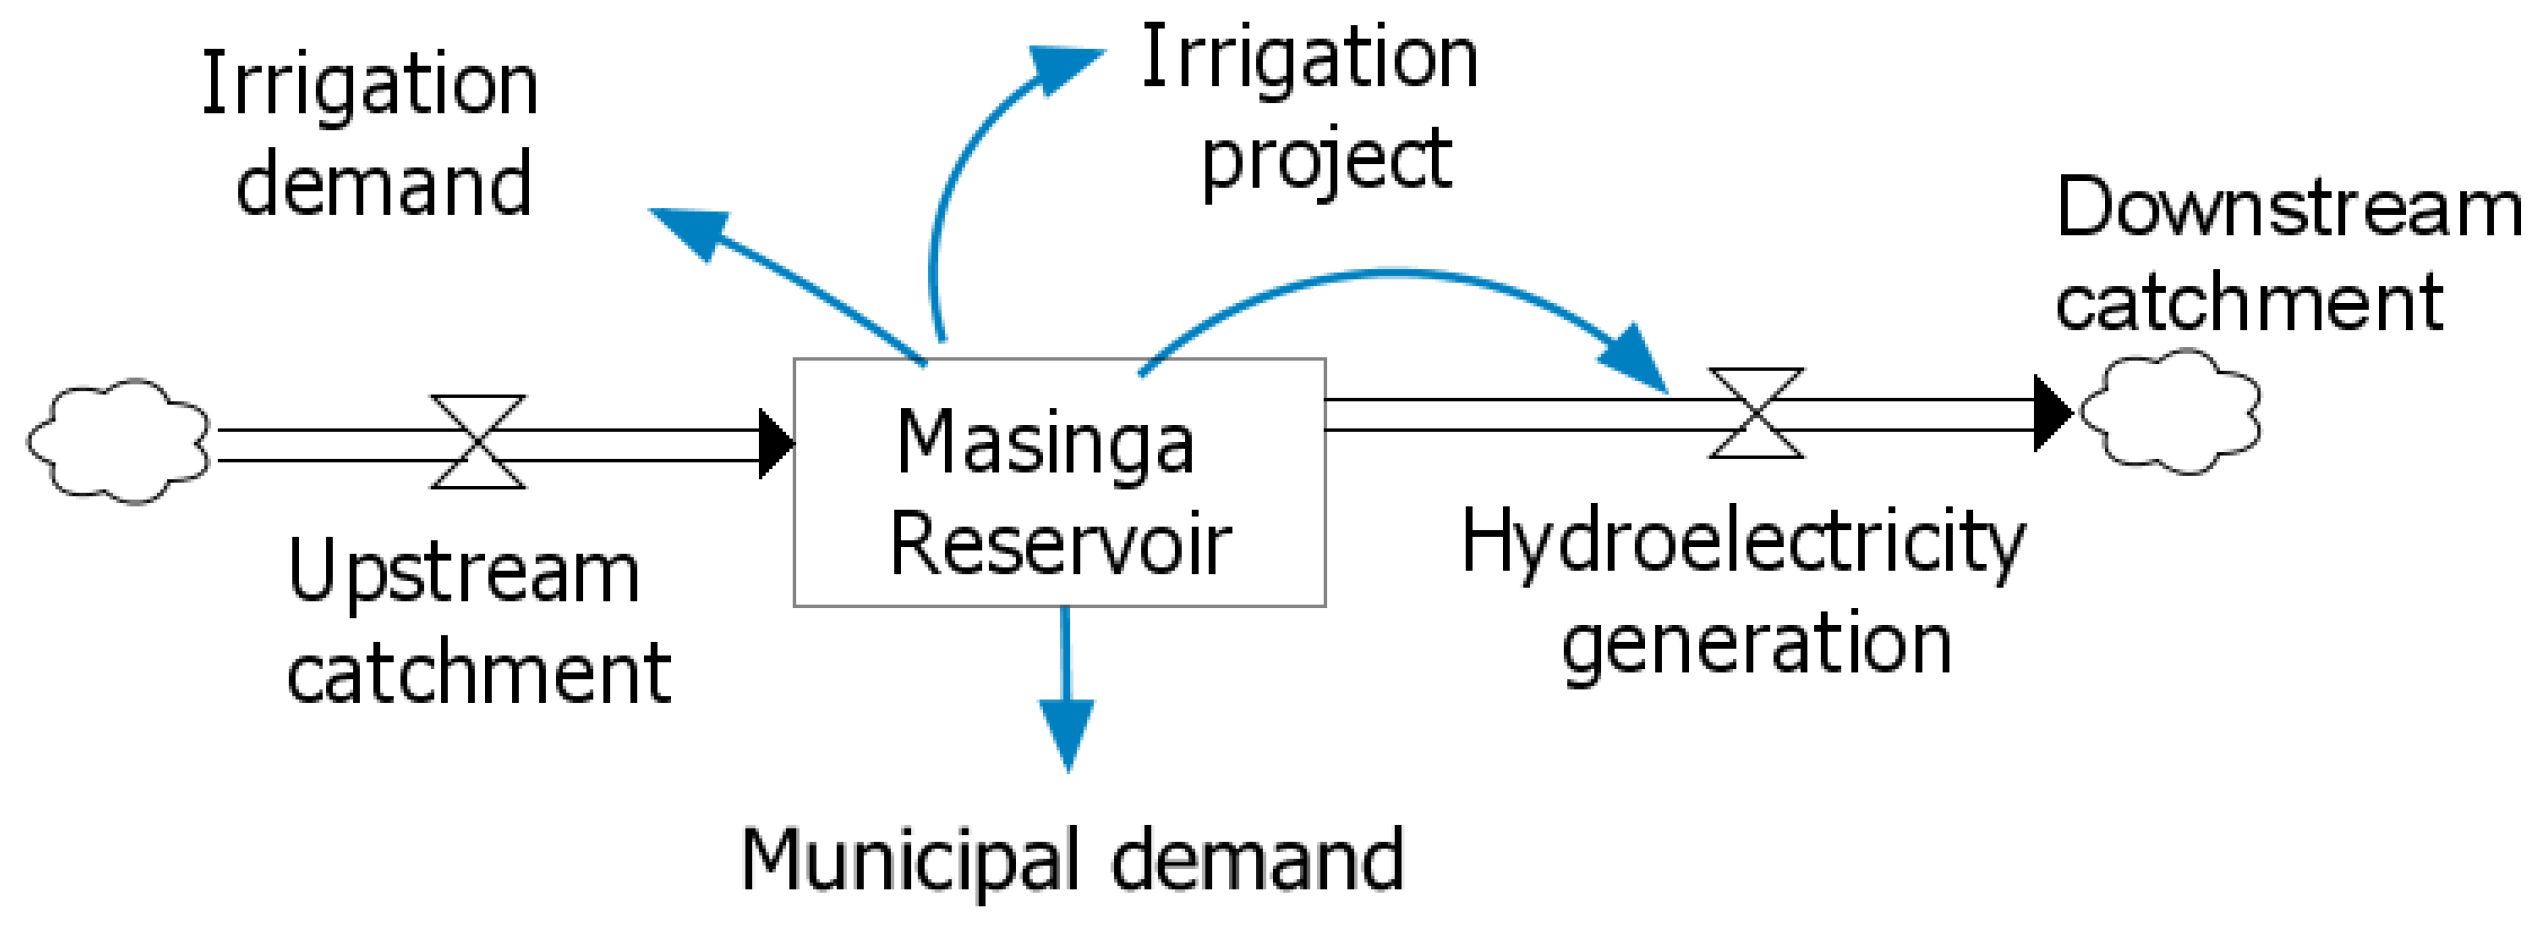
Figure 4 shows the Masinga dam system conceptual model.
The objective of the model is to maximise extra available water for power generation after satisfying demand for municipal and irrigation water. Therefore, the following mathematical model applies:
where
is the number of total selected months, and
is the extra water available for month
.
The objective is subject to the following constraints:
where
is 1000 MCM,
is 1560 MCM,
is the storage at the end of the time-period, and
is the initial storage, in this case 1300 MCM.
is the storage at time
t,
is the inflow,
is the evaporation,
is the irrigation demand,
is the municipal demand,
is the irrigation project demand,
is the downstream/power demand for time-step (month)
, and
is the storage at the start of the next month. The upper bound,
(92.8 MCM), is the volume of water required to create maximum power minus the volume of water to meet the required minimum power. The model produces the difference between supply and demand over time while working within the system constraints.
2.3. Model Setting and Scenario Building
The model is run for both single- and multi-year optimisation. For single-years, the model is run on a yearly basis for the years 2020, 2025, 2030, 2040 and 2050; the results generated show the future supply-demand balance for the reservoir if no water was stored for the next year, and all excess water goes through the dam for power generation. Note that power output itself has not been maximised as, to do appropriately, prices for power would have to be considered and matched with generation times [
45,
46,
47], and this fell beyond the scope of this study. The model allows the user to decide the distribution of excess water throughout the year. Subsequently, for multi-years, the model is run for the periods 2016–2020, 2016–2025, 2016–2030, 2016–2040 and 2016–2050 to analyse how long the reservoir could operate before experiencing a net deficit, doing so by storing water instead of immediately using it to generate power, thus increasing the system’s robustness to growing disparity between supply and demand, and increasing future reliability.
As a proposed alternative, the model is also run a third time, for the same periods as above, but with the system constraints having been altered to reflect the reservoir’s walls heightened by 1.5 m to increase capacity to 2000 MCM, up from 1560 MCM. For this scenario, the starting volume is increased to 1500 MCM. This scenario aims to show how an increased capacity will further affect the robustness of the reservoir, and allows for a prolonged operation period without requiring external initiatives to relieve or reduce its demands.
Five probability intervals are applied to each of the above three optimisation modelling exercises, producing a total of 25 scenarios for each model run. As a result, the worst-case scenario is the lowest flow rate and the highest population—the 5 and 95 percentiles, respectively. The best-case scenario was the opposite, with maximum supply and minimum demand. The system is considered most reliable if it can meet the maximum possible demands with the minimum available supply. The 25 possible future scenarios are displayed within the probability matrix shown in
Table 3.
4. Discussion
The results for the baseline scenario—2015—show that the system operates within its limits, and that supply can comfortably meet demand, with enough extra water passing through the turbines to generate a good proportion of the maximum potential power output from the dam. However, the volume of water to be demanded for irrigation and municipal use is expected to increase significantly (see
Figure 3). This rise draws into question the ability of the reservoir to operate sustainably into the future whilst also meeting all water demand requirements—minimum power and, hence, downstream demands.
Single-year planning does not offer much reliability or robustness, especially past year 2020. A short term year-by-year planning is not a suitable approach; indicating that long-term planning is preferable as reported in [
46,
48]. Recent operation has seen the Masinga dam losing volume at the expense of fully meeting demands [
34]. Allowing the storage level to fall when there is a deficit, as the reservoir currently practices, allows demand to be fully satisfied, but does make it increasingly hard to recover the stored water volumes that have been lost from the reservoir [
49]. Where the system’s operation has been considered over longer periods of time, the longevity is increased, owing to storing water during early years. Nevertheless, by 2040 and 2050, the demand starts to become far greater than the supply, and, even with long-term planning the reservoir is likely to experience large deficits. By increasing the size of the reservoir, the impact that these deficits will have is reduced, and the likelihood of system failure for any given period is lessened, thus improving reliability. Through longer-term planning, the water availability values as a percentage of available reservoir capacity fall significantly, indicating that the system is better equipped to cope with sudden unexpected changes in climate, thus improving the system robustness [
19].
The expansion of the reservoir size has been proposed twice already, in 1997 and 2009, with the key selling point being to increase power generation through the creation of a larger head [
50]. This study suggests, however, that a better justification for the expansion plan may be to increase the robustness of the system, given the projected increases in demands on the reservoir. The operational optimisation over longer periods in this model works on the basis that hydroelectric generation can be sacrificed down to the minimum acceptable level. To further improve robustness, hydroelectric power generation can be sacrificed below the minimum, if downstream demands continue to be met. As Kenya is planning a large increase in its overall power output, with more nuclear and fossil fuel, as well as the new High Falls Dam downstream of Masinga [
39], the maximum contribution of up to 40 MW should be able to be sourced elsewhere. However, the construction of nuclear power plants can suffer delays, and the burning of coal will add to the causes of global climate change uncertainty. Additionally, increased climate change, through the burning of fossil fuels, will contribute to a further strain on the reservoir system through extreme weather, increased evaporation from the reservoir, and affecting the irrigation demands of local crops. As such, increasing the size of the reservoir is a low-risk action that will do more to maintain both the electricity generation and the important irrigation and municipal water source.
Additional to outsourcing power generation, large irrigation projects are planned around the High Falls Dam. The creation of large irrigation systems downstream may be able to take some stress from the Masinga dam, feasibly by allowing it to operate primarily as a municipal water supplier and flood/drought regulation reservoir. However, due to the downstream location of many of the proposed schemes, the relief on the Masinga dam may not be as high as necessary, as it will still need to allow large flows of water downstream, which is also important for a passing stream flow to serve as a water source for environmental reasons such as maintaining fauna and flora, in turn providing an additional food source to crops. Knoop et al. [
51] suggest several ecosystem-friendly approaches to securing water in the Tana Basin, including the creation of bunds, pits, and several water-harvesting techniques. Wide implementation of such small-scale water-securing measures may go a long way to alleviate stresses on larger infrastructure such as the Masinga dam [
51,
52], and would likely go some way as an inexpensive measure to reduce the need to build other large reservoir systems. As well as increasing the capacity of the dam, it could be considered that, at the cost of even the minimum power generation, the lessening of minimum storage bounds in the reservoir would allow for more flexibility. However, it must be noted that, as well as reducing power output, allowing the reservoir to become shallow will allow the water to heat more, and therefore increase evaporation, as well as creating negative ecosystem impacts [
53,
54,
55]. This is especially the case for the Masinga dam, since it is shallow compared to its large capacity [
55,
56]. The allowance of a smaller minimum storage volume would also put the reservoir at greater risk of sudden extreme events [
19]. For example, if the reservoir is permitted to fall to a very low volume and the region is struck by an unexpected drought, the reservoir has less ability to absorb the impact.
The results from this study coincide with the broader literature that water systems, and those operating with trade-offs, are likely to suffer in the face of an uncertain climate future. Other studies using simulation models for African water systems also find that long-term water management needs to be seriously addressed to avoid water shortages, which also affect food and energy sources [
11,
57,
58,
59]. For example, De Wit and Stankiewicz [
57] predicted the water supply across Africa by 2100, and concluded that surface water access would be seriously affected if not for adaptation. Challinor et al. [
58] found that a critical mass of expertise in water management in relation to the climate and changing environment should be maintained to address the impact of climate change on livelihoods through hydrological forcings, and Ragab and Prudhomme [
59] stated that the uncertainty found in climate projection models should not paralyse policy makers, and that future planning should account for as many possible impacts as possible. Similar findings have been made for other at-risk regions such as the Middle East and Southeast Asia [
60,
61].
The model presented in this study does not consider extreme events. This vulnerability to droughts and floods is a further reason to support to the expansion of the reservoir, on top of the noted increased operational robustness when supplying demand [
19]. Many climate reports point to projected increases in more frequent extreme weather, and so increasing the robustness of the reservoir system should be considered a priority. When considering potential changes to demand not considered by this study, an important aspect is downstream demand from the dam. Although the minimum outflow required to create energy is currently suitably large to supply the downstream reservoirs (due in part to downstream river tributaries), there are likely to be increases in downstream demand due to growing irrigation demand [
30]. There are many plans for large irrigation projects in the Tana basin, and irrigation along the riverside all the way from Masinga to the river delta at the Indian Ocean is expected [
62]. This offers further support for enlarging the Masinga reservoir, as the larger capacity would allow for greater variation in outflow patterns, and may be able to work to provide the downstream dams, as well as irrigation users, with water at times when natural river flows are low [
63]. This would take away from the availability of water in the reservoir in the future as predicted by the simulation modelling carried out here, and so may require a re-allocation of demand supply.
5. Conclusions and Future Work
Kenya has ambitious plans to greatly expand irrigation and municipal supply by 2030, and these plans should consider how best to operate and prioritise the demands met by its reservoirs. This study has considered the reliability and robustness of one of the main reservoirs, Masinga, that plays a crucial role to Kenya’s future development plan. The dam system has been formulated as an optimisation-based simulation model to maximise the water availability. The reservoir inflow rates and demand growth are projected into the future, accounting for climate supply and demand uncertainties, respectively, and they are used in the model. Based on the different projection scenarios, three alternative planning strategies are considered: short-term, long-term, and long-term with reservoir expansion. The results indicate that, by 2020, there is a 50%–80% chance that the reservoir will have a larger supply than demand, and, by 2025, this percentage falls to at least 20%, before dropping to just over 1.25% in 2030. The offset of water deficits is possible at the expense of above-minimum power generation, increasing reliability and robustness significantly; however, if the power generation is to be considered of high importance, or if downstream demands increase, then either demand must be reduced elsewhere, or water availability in the area must be increased. The study provides a platform to study the implication of different planning and management practices as well as the reservoir expansion projects in order to relieve the predicted stress on the Masinga reservoir and dam. The study asserts that the expansion plans for the reservoir to increase the capacity by around 25% should be considered to increase the likelihood of surplus supply over long timespans. This may be especially important as more unpredictable extreme floods and droughts are expected to be a part of the future climate of East Africa, and the larger reservoir capacity would allow for more water to be stored and released as necessary. This will also extend the period that the reservoir can operate without suffering significant deficits, in spite of climate change uncertainty. Municipal and irrigation demand are considered proportionally correlated with population growth in this study. This may not necessarily be accurate, especially for a developing country such as Kenya, where economic growth may skew the trajectory. Future work should use more sophisticated modelling to account for more realistic demand projection as well as river flows to consider extreme events and the effects of sedimentation. In order to enable this work, there is a need for better water monitoring, not only in the reservoir, but also of rainfall in the basin and river flow rates.


