3.1. Development of the 2012–2015 California Drought
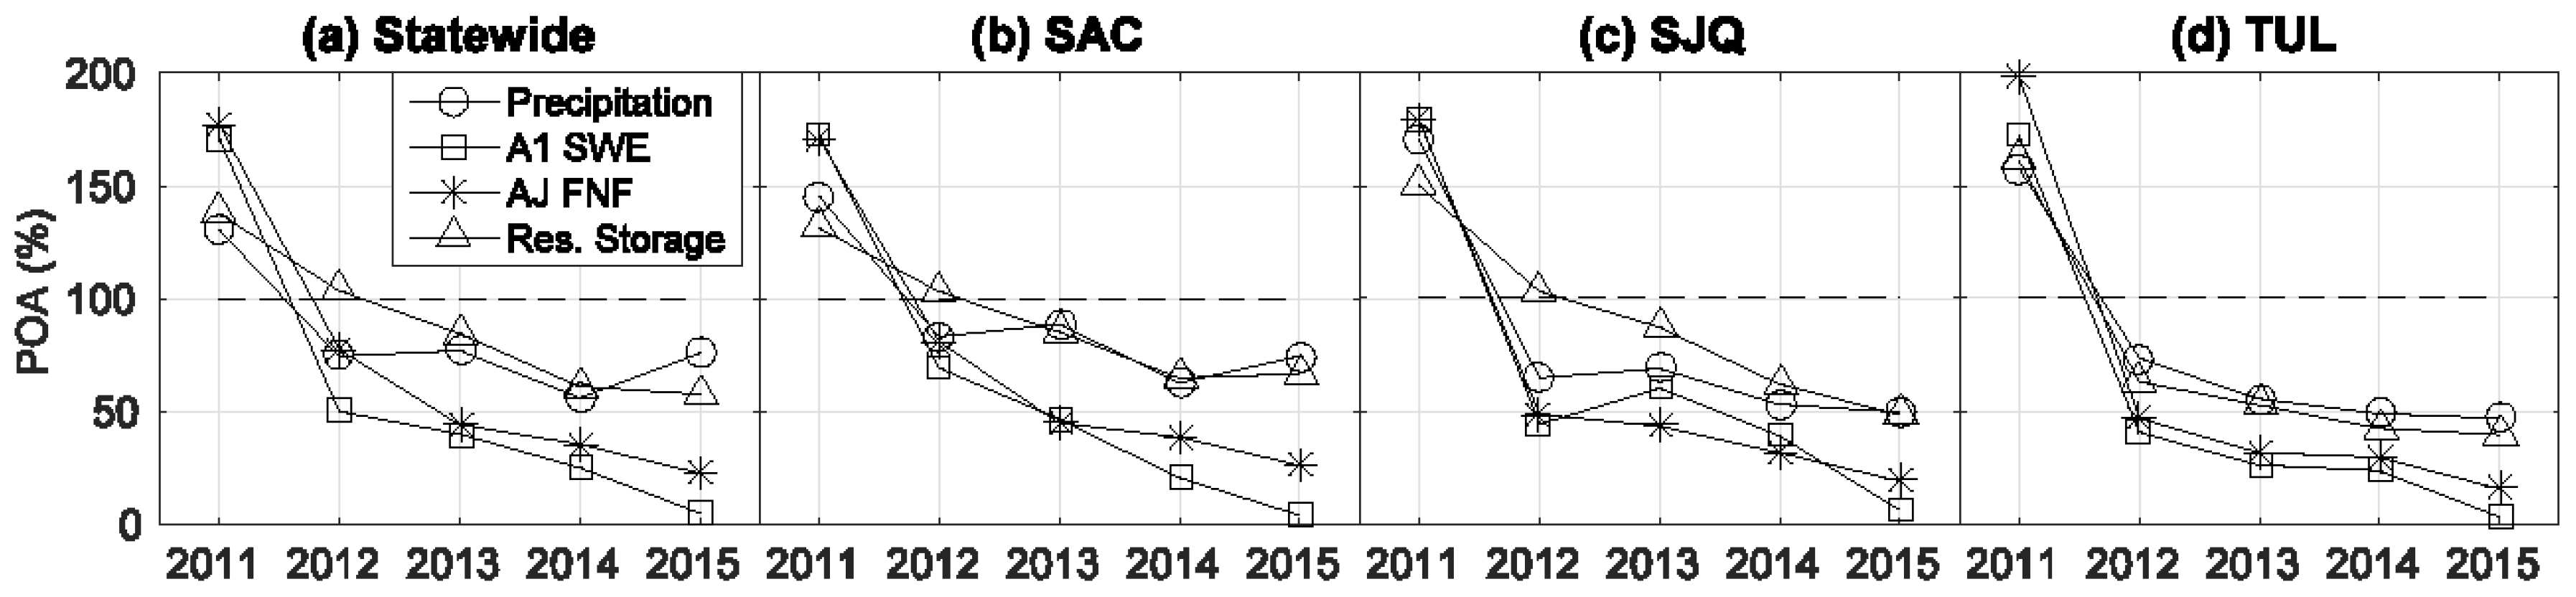
Water year 2011 preceding the 2012–2015 drought has above average precipitation, A1 SWE, AJ FNF, and reservoir storage statewide and in the SAC, SJQ, and TUL regions (
Figure 2). In contrast, water years 2012–2015 indicate significantly below average precipitation, A1 SWE, and AJ FNF on the annual scale. Reservoir storages by the end of the water year 2012 (September 2012), however, are slightly above average statewide as well as for SAC and SJQ regions. In general, an overall declining trend is evident in all four variables from 2011–2015 except for that statewide precipitation in 2015 is higher than the previous three years. Among four variables, A1 SWE has the largest deficit followed by the AJ FNF. In 2015, the statewide A1 SWE (AJ FNF/reservoir storage) is only 5% (23%/58%) of average. Among the three regions, the TUL region tends to be impacted the most with the lowest percent of average (POA) values in four variables in 2015. Overall, from 2012–2015, the progressively increasing severity of the drought is evident.
Four-year (2012–2015) accumulated deficiencies in those four variables presented in
Figure 2 are determined (
Table 4). Statewide, a shortfall of 117% of average (660 mm) in precipitation is observed from 2012–2015. This shortfall has a cascading effect, leading to shortfalls in snowpack (280% accumulated deficiency in A1 SWE), streamflow (220% deficiency in AJ FNF), and reservoir storage (93% deficiency). Similar deficits are also evident for the other three regions. In general, the TUL region has the largest deficiencies (in percent of average) for all four variables, indicating that the region has the most severe drought conditions in the Central Valley. This is in line with what
Figure 2 illustrates. Among the four variables, snowpack indicates the most significant shortage on average, with a percent of average value consistently above 250% for all study regions. This is also consistent with what
Figure 2 shows regarding the snowpack conditions. It is worth noting that for the SJQ region, the deficiency in AJ FNF (260% of average) is slightly higher than that of the A1 SWE (250% of average). This is due to the fact that snow is not the unique source for AJ FNF. Precipitation within the period from April to July is another contributor. The deficiency in AJ FNF partially stems from the lack of April-July precipitation over the SJQ region. It should also be highlighted that the deficiencies in snowpack are far more significant than precipitation. This is due to the fact that temperature is an important factor in snowfall and rainfall partition from precipitation as well as the accumulation of snowpack.
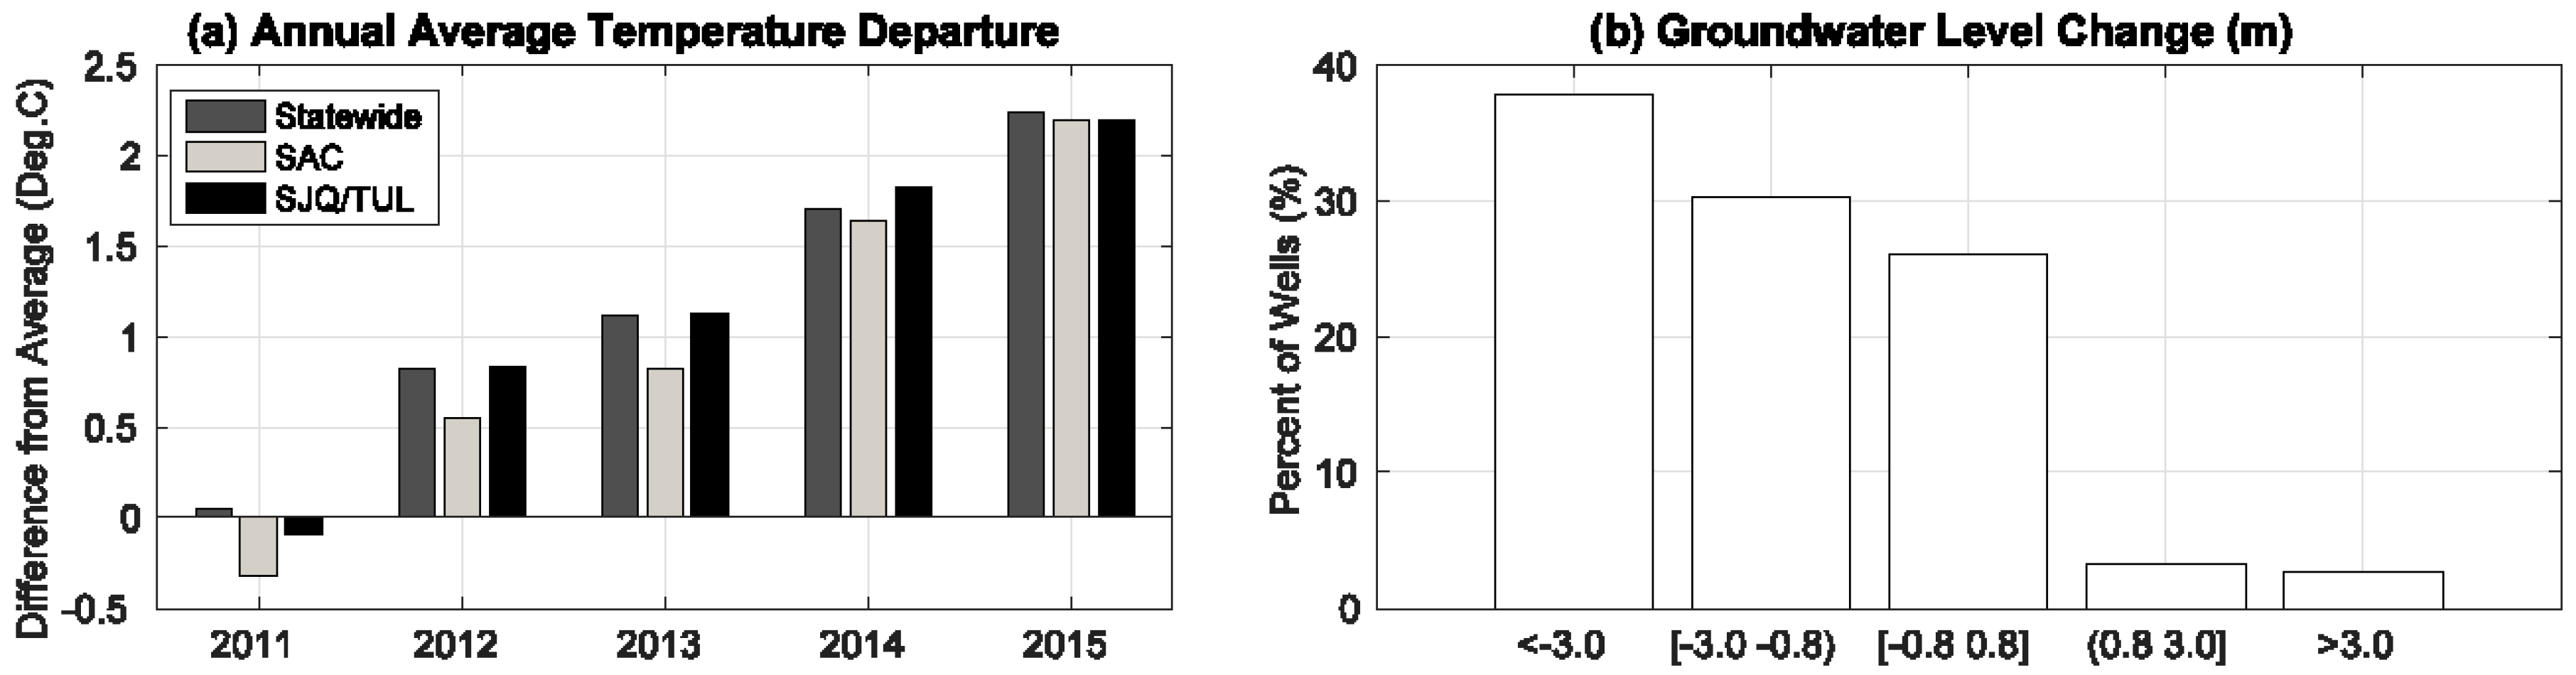
The departures of annual average temperature from the long-term (1896–2015) average values for the past five years are calculated (
Figure 3a). In 2011, statewide temperature is slightly (0.05 °C) above the long-term average. For three Central Valley regions, it is slightly below the long-term average (−0.32 °C for SAC; −0.09 °C for SJQ and TUL). However, since 2011, annual average temperature for each region is consistently above the long-term mean. Statewide, increases (over long-term average) in annual average temperature from 2012–2015 are 0.83 °C, 1.12 °C, 1.71 °C, and 2.24 °C, respectively. A similar monotonically increasing trend in the departure is also observed for three Central Valley regions. In comparison, increases in the SAC region are the least significant. In the record period (1896–2015), year 2015 is the hottest year followed by 2014 statewide. High temperature along with shortfalls in precipitation leads to significantly lower than average A1 SWE (
Figure 2;
Table 4).
Groundwater provides about 40% of the urban and agricultural water demand across the state. Groundwater usages in regions SAC, SJQ, and TUL account for 30%, 38%, and 53% of respective total regional water use. During drought periods when surface water supplies are reduced, groundwater usage typically increases to mitigate the adverse impact of water shortage. This is the case for the 2012–2015 drought across the state (
Figure 3b). Out of 2109 groundwater monitoring wells, in the five-year period from Fall 2010 to Fall 2015, about 68% (1436) of the wells experience declines in water level larger than 0.8 m (2.5 ft). Particularly, 37.8% (797) of the wells observe declines more than 3 m (10 ft) in magnitude. A small number of wells (5.9%), however, observe increases (greater than 0.8 m) in water level in this five-year period.
3.2. Temporal Characteristics of the Drought
To obtain a general understanding on the severity of the drought at different temporal scales, the 28 variables tabulated in
Table 2 are ranked in their corresponding record periods according to their specific values at one- to four-year levels. For temperature, the highest value is ranked first, indicating the hottest condition. For other variables, the lowest value is ranked first, indicative of the driest condition. Either way, rank one generally indicates the most severe drought condition.
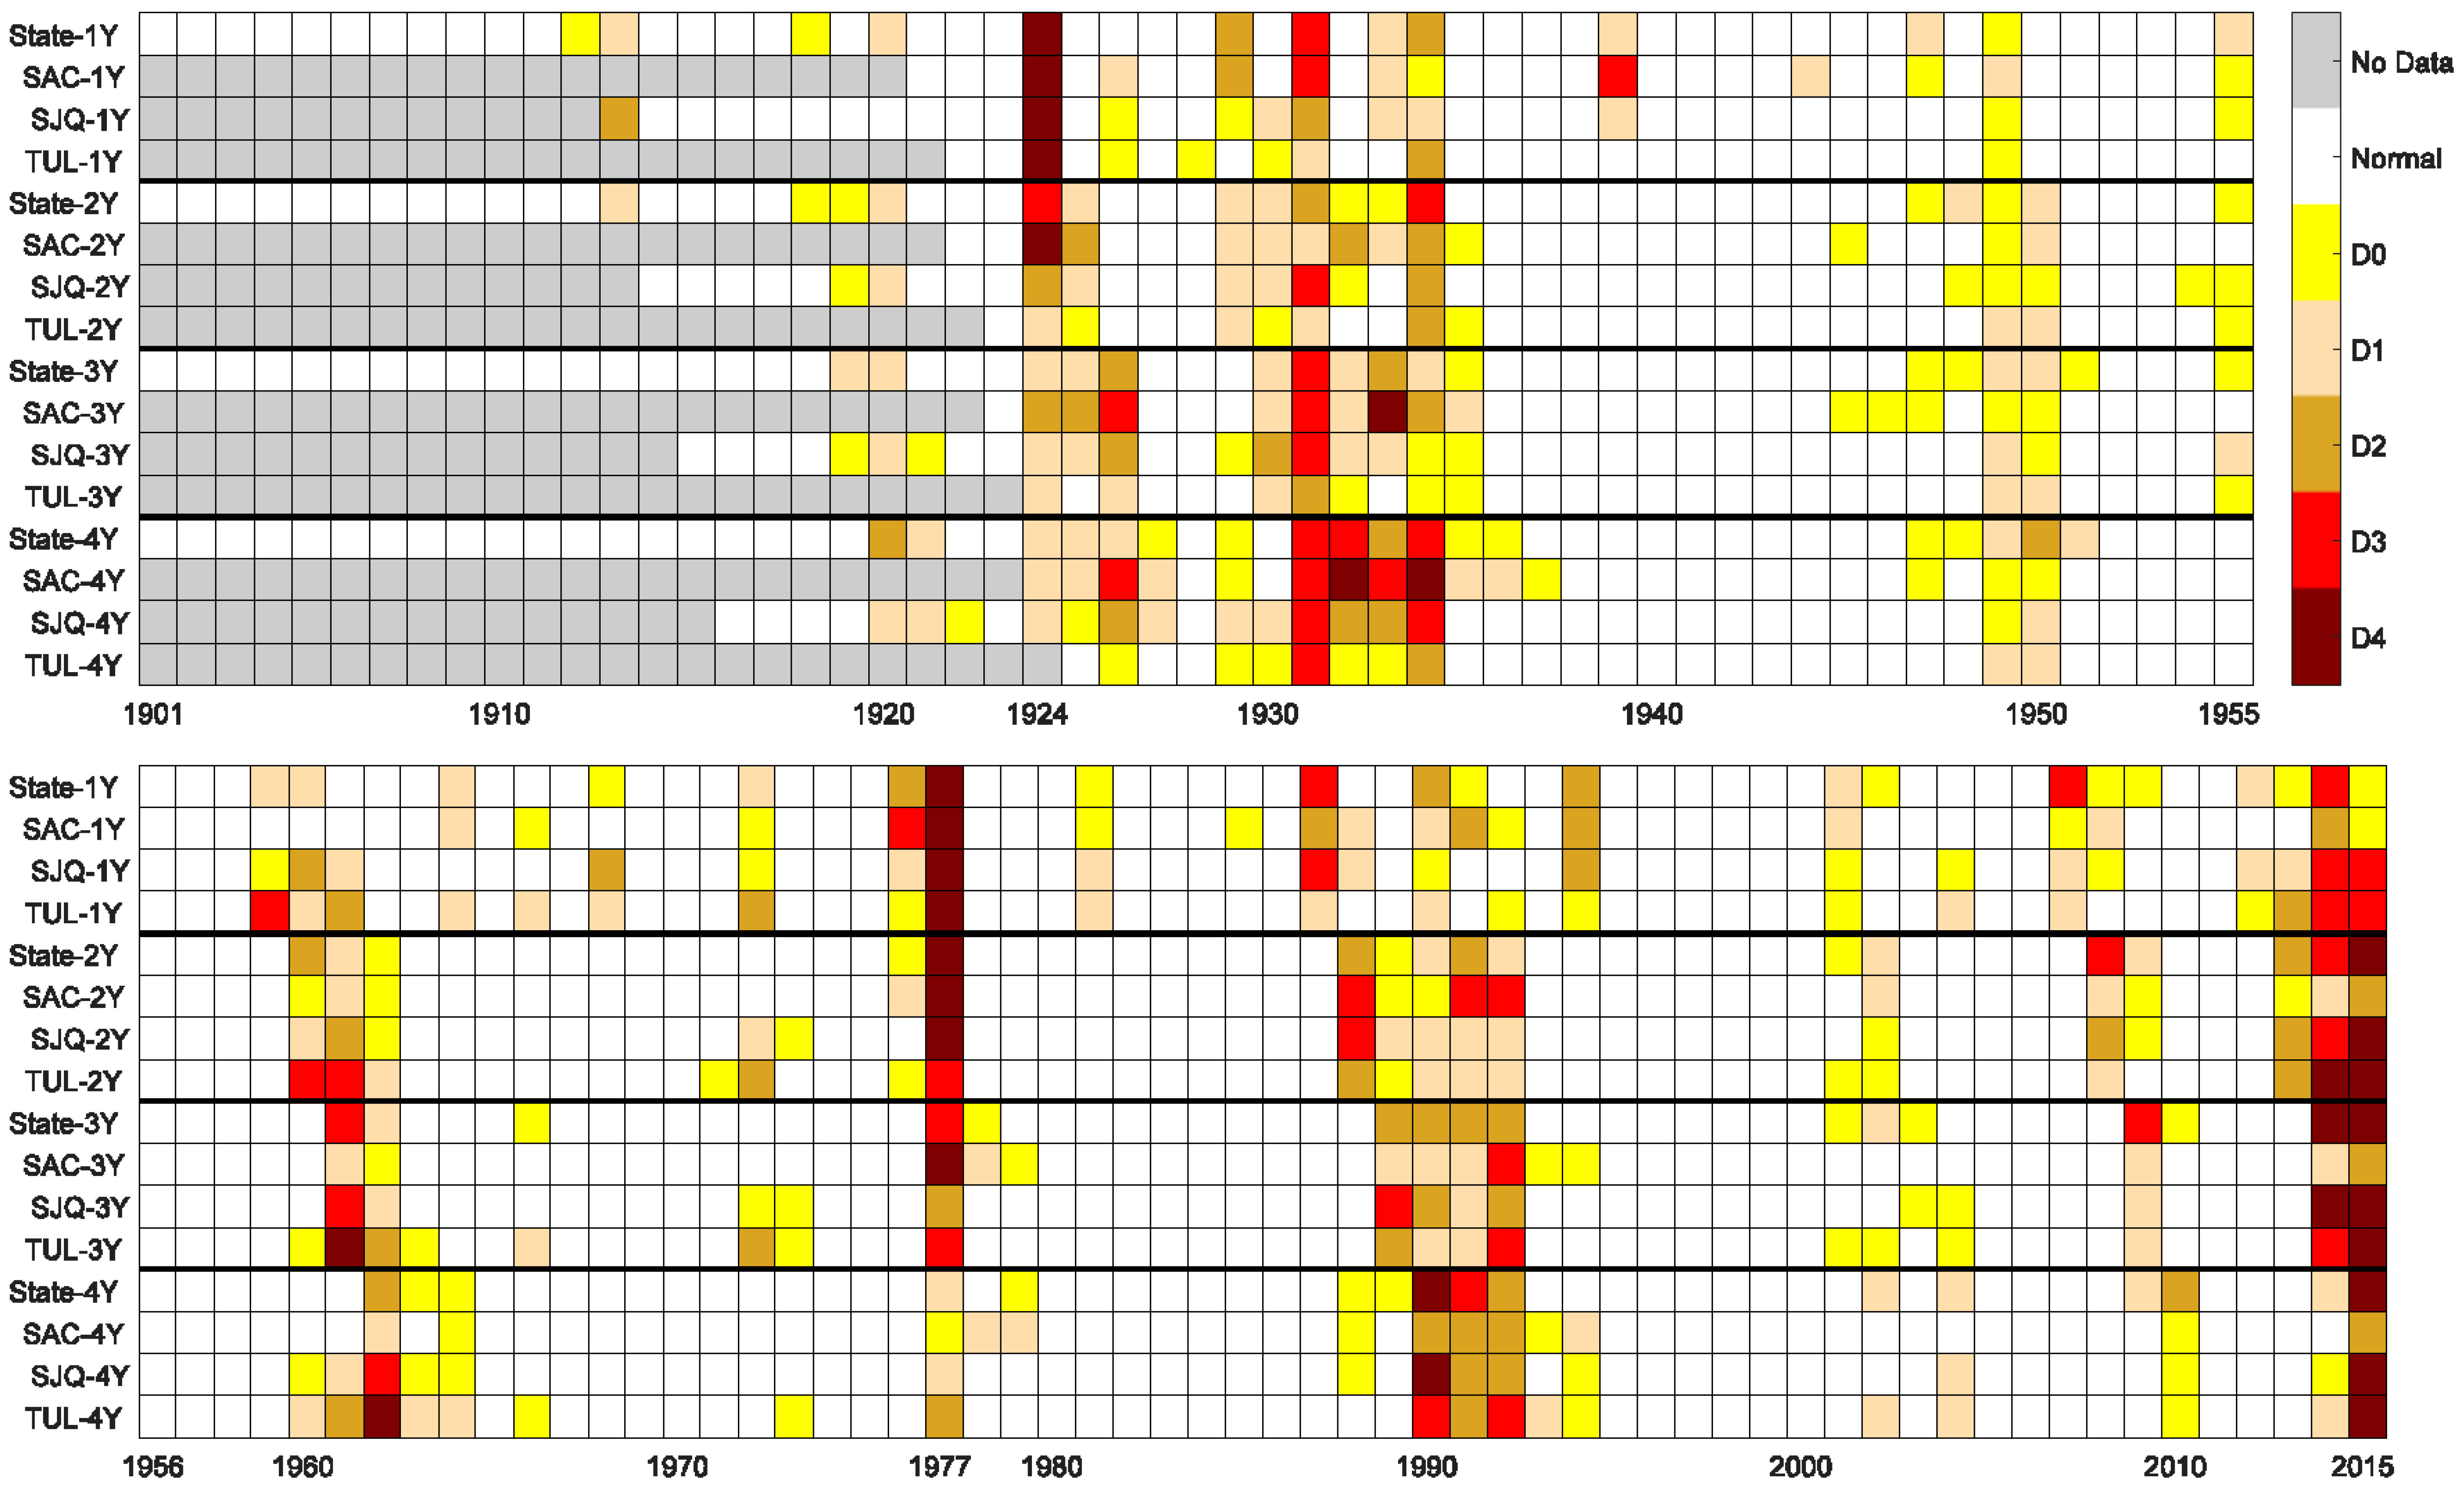
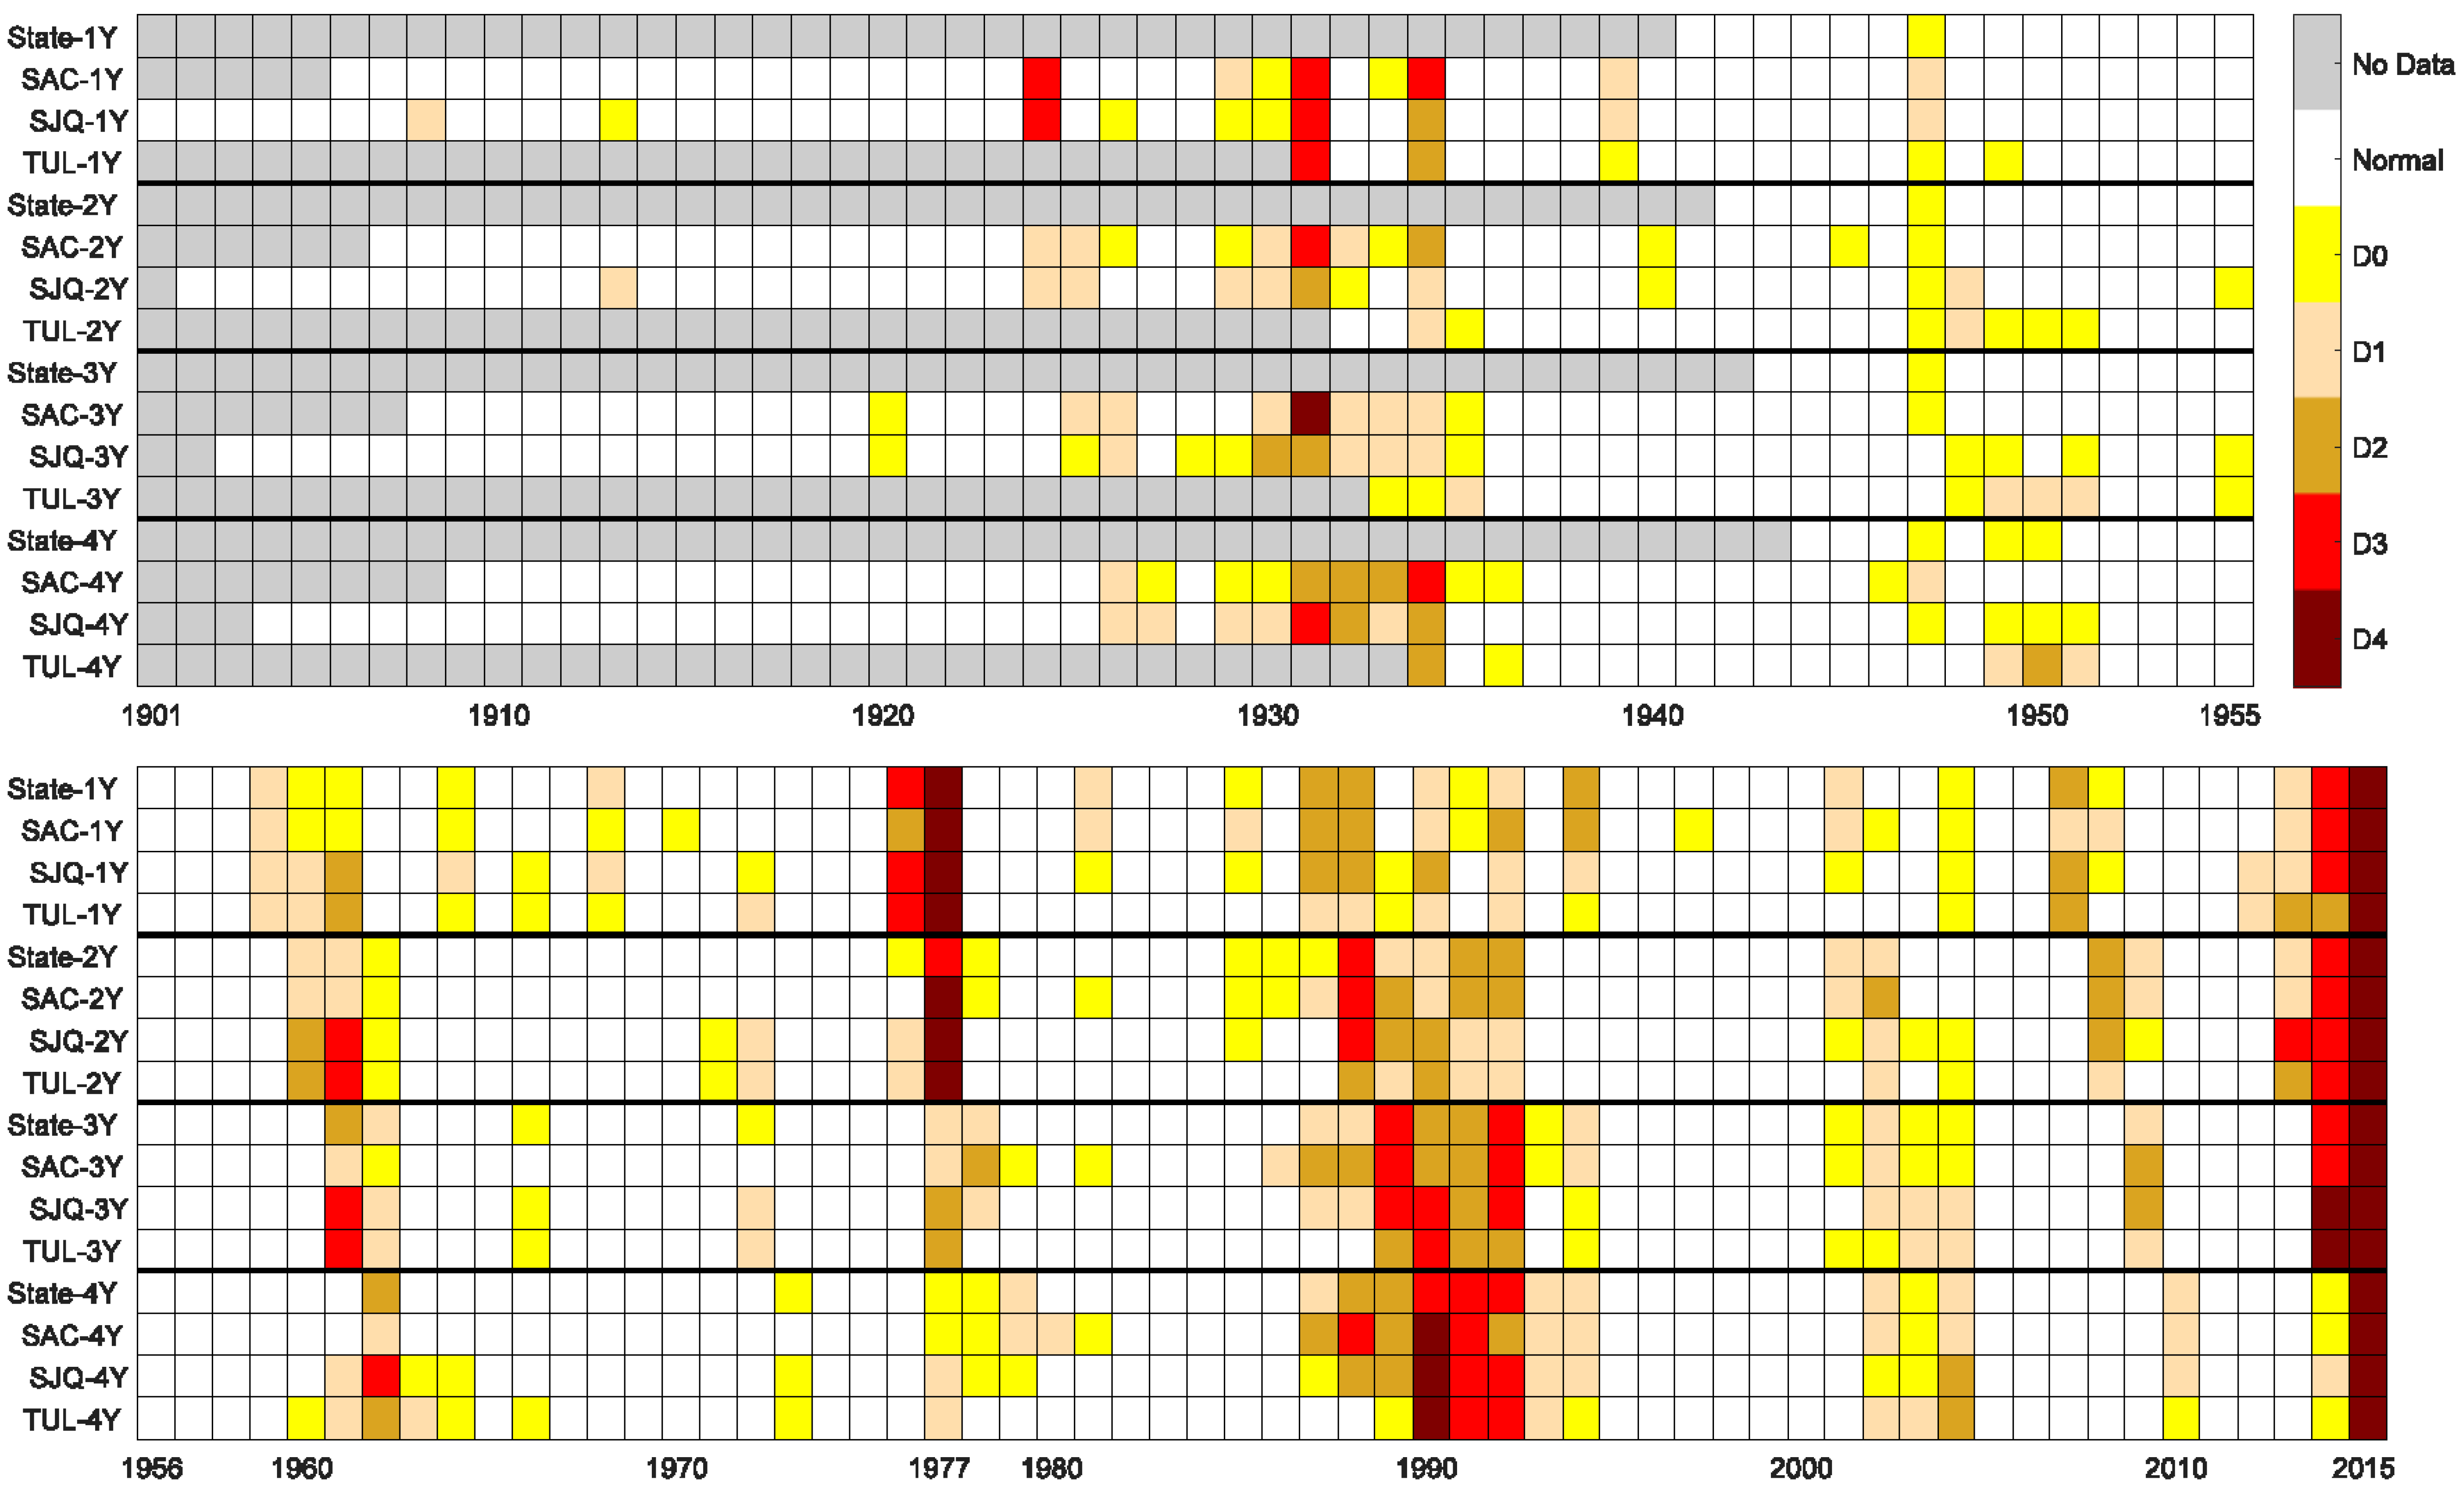
Drought monitor categories of statewide precipitation, 8SI, 5SI, and 6SI at one- to four-year levels are shown first (
Figure 4). At the one-year scale, during the period from 2012–2015, on average year 2014 tends to be the driest year (D3 for 5SI, 6SI, and statewide; D2 for 8SI). Over the entire record period, however, precipitation conditions (statewide, 8SI, 5SI, and 6SI) of year 1977 and 1924 are both exceptional (D4). At the two-year level, 1976–1977 stands out as the driest two-year period, with statewide precipitation, 8SI, and 5SI deemed as exceptionally low (D4) and 6SI extremely low (D3). The period 2014–2015 is also dry with exceptionally low statewide precipitation, 5SI, and 6SI (D4) and severe conditions (D2) when looking at the 8SI. At the three-year scale, for statewide condition and 5SI, both 2012–2014 and 2013–2015 are exceptional (D4); for 8SI, both 1931–1933 and 1975–1977 are exceptional (D4), while 2012–2015 is categorized as severe (D2); for 6SI, the period 2013–2015 is exceptional (D4) along with 1959–1961. At the four-year level, for statewide conditions and the 5SI, both periods 2012–2015 and 1987–1990 are exceptional (D4). For 6SI, the period 2012–2015 is exceptional (D4) but not unprecedented (1959–1962 is also with D4 category). For 8SI, the period 2012–2015 is severe (D2); however, periods 1929–1932 and 1931–1934 are drier with exceptionally low amount of precipitation observed (D4). Overall, no single year within the period 2012–2015 is unprecedented in terms of statewide precipitation, 8SI, 5SI, and 6SI. At the two-year level, both 2013–2014 and 2014–2015 for 6SI are unparalleled before 2012. At the three-year scale, statewide precipitation and 5SI within 2012–2014 and 2013–2015 are unprecedented before 2012. Among the three precipitation indices, 8SI has relatively less severe conditions.
In contrast to the observation that statewide precipitation along with 8SI, 5SI, and 6SI are not all exceptional in different sub-periods within 2012–2015, AJ FNF in 2015 across the state and over three Central Valley regions are all in the exceptional (D4) category (
Figure 5). It is the same case for 2014–2015, 2013–2015, and 2012–2015 at two-year, three-year, and four-year levels, respectively. Particularly, statewide AJ FNF of 2014–2015 and 2012–2015 is unparalleled at two-year and four-year levels, respectively. At the three-year level, statewide AJ FNF from 2013–2015 is unparalleled; for the SJQ and TUL regions, both 2012–2014 and 2013–2015 are unprecedented before 2012 in the record period. This contrast between precipitation and AJ FNF in the past four years (
Figure 4 and
Figure 5) is due to the fact that AJ FNF largely depends on the snowmelt. Record low snowpack (
Figure 1) reduces snowmelt contribution to AJ FNF. Additionally, record high temperature (
Figure 3a) likely shifts the snowmelt timing earlier, contributing to less snowmelt from April–July.
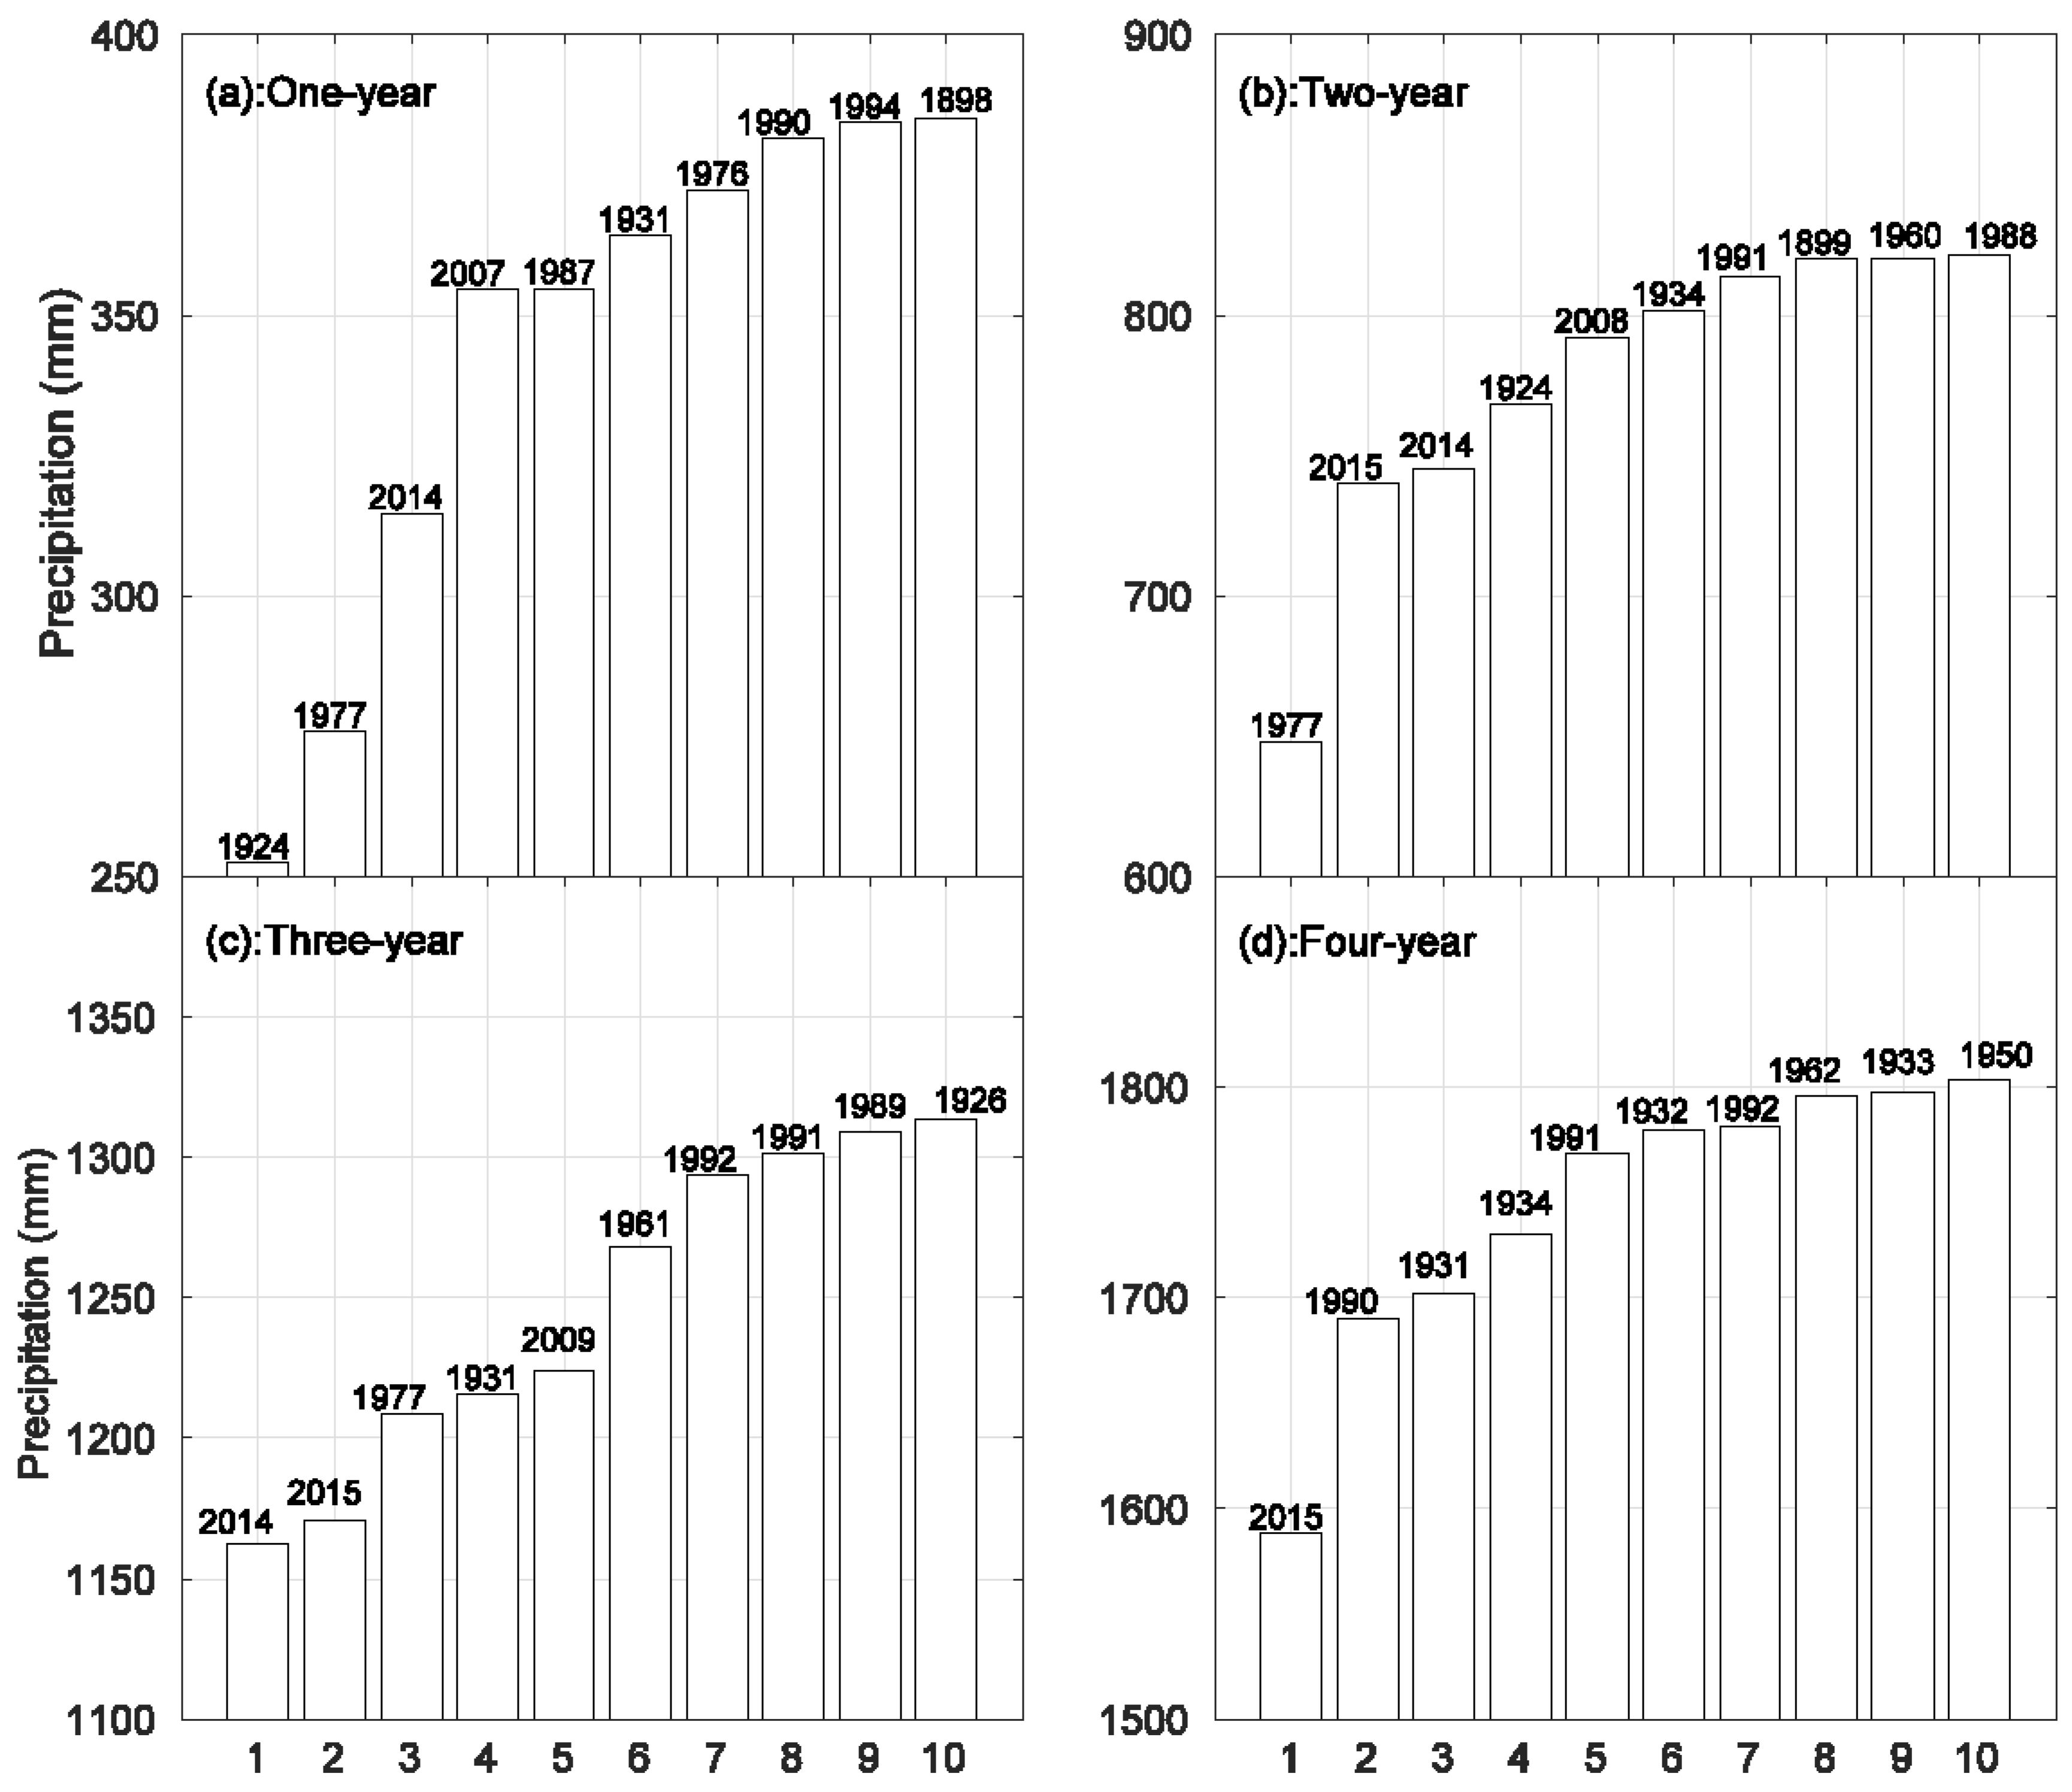
In addition to drought monitor category, it is also a common practice in drought planning and management to compare the driest periods at different levels of periods. The ten driest periods in terms of statewide precipitation at one- to four-year levels are applied as an example (
Figure 6). It is clear that year 1924 receives the lowest annual precipitation (
Figure 6a) followed by 1977. At two-year, three-year, and four-year levels, the periods 1976–1977, 2012–2014, and 2012–2015 observe the lowest amount of precipitation, respectively (
Figure 6b–d). This indicates that, at one-year and two-year levels, no sub-periods of 2012–2015 are unprecedented in terms of precipitation, whilst it is the case at three-year and four-year levels. Though not making the top of the list, water year 2014 is the third driest year (
Figure 6a); the precipitation amounts of 2014–2015 and 2013–2014 rank the second the third lowest, respectively, at the two-year level. These observations are generally consistent with what is shown in
Figure 4.
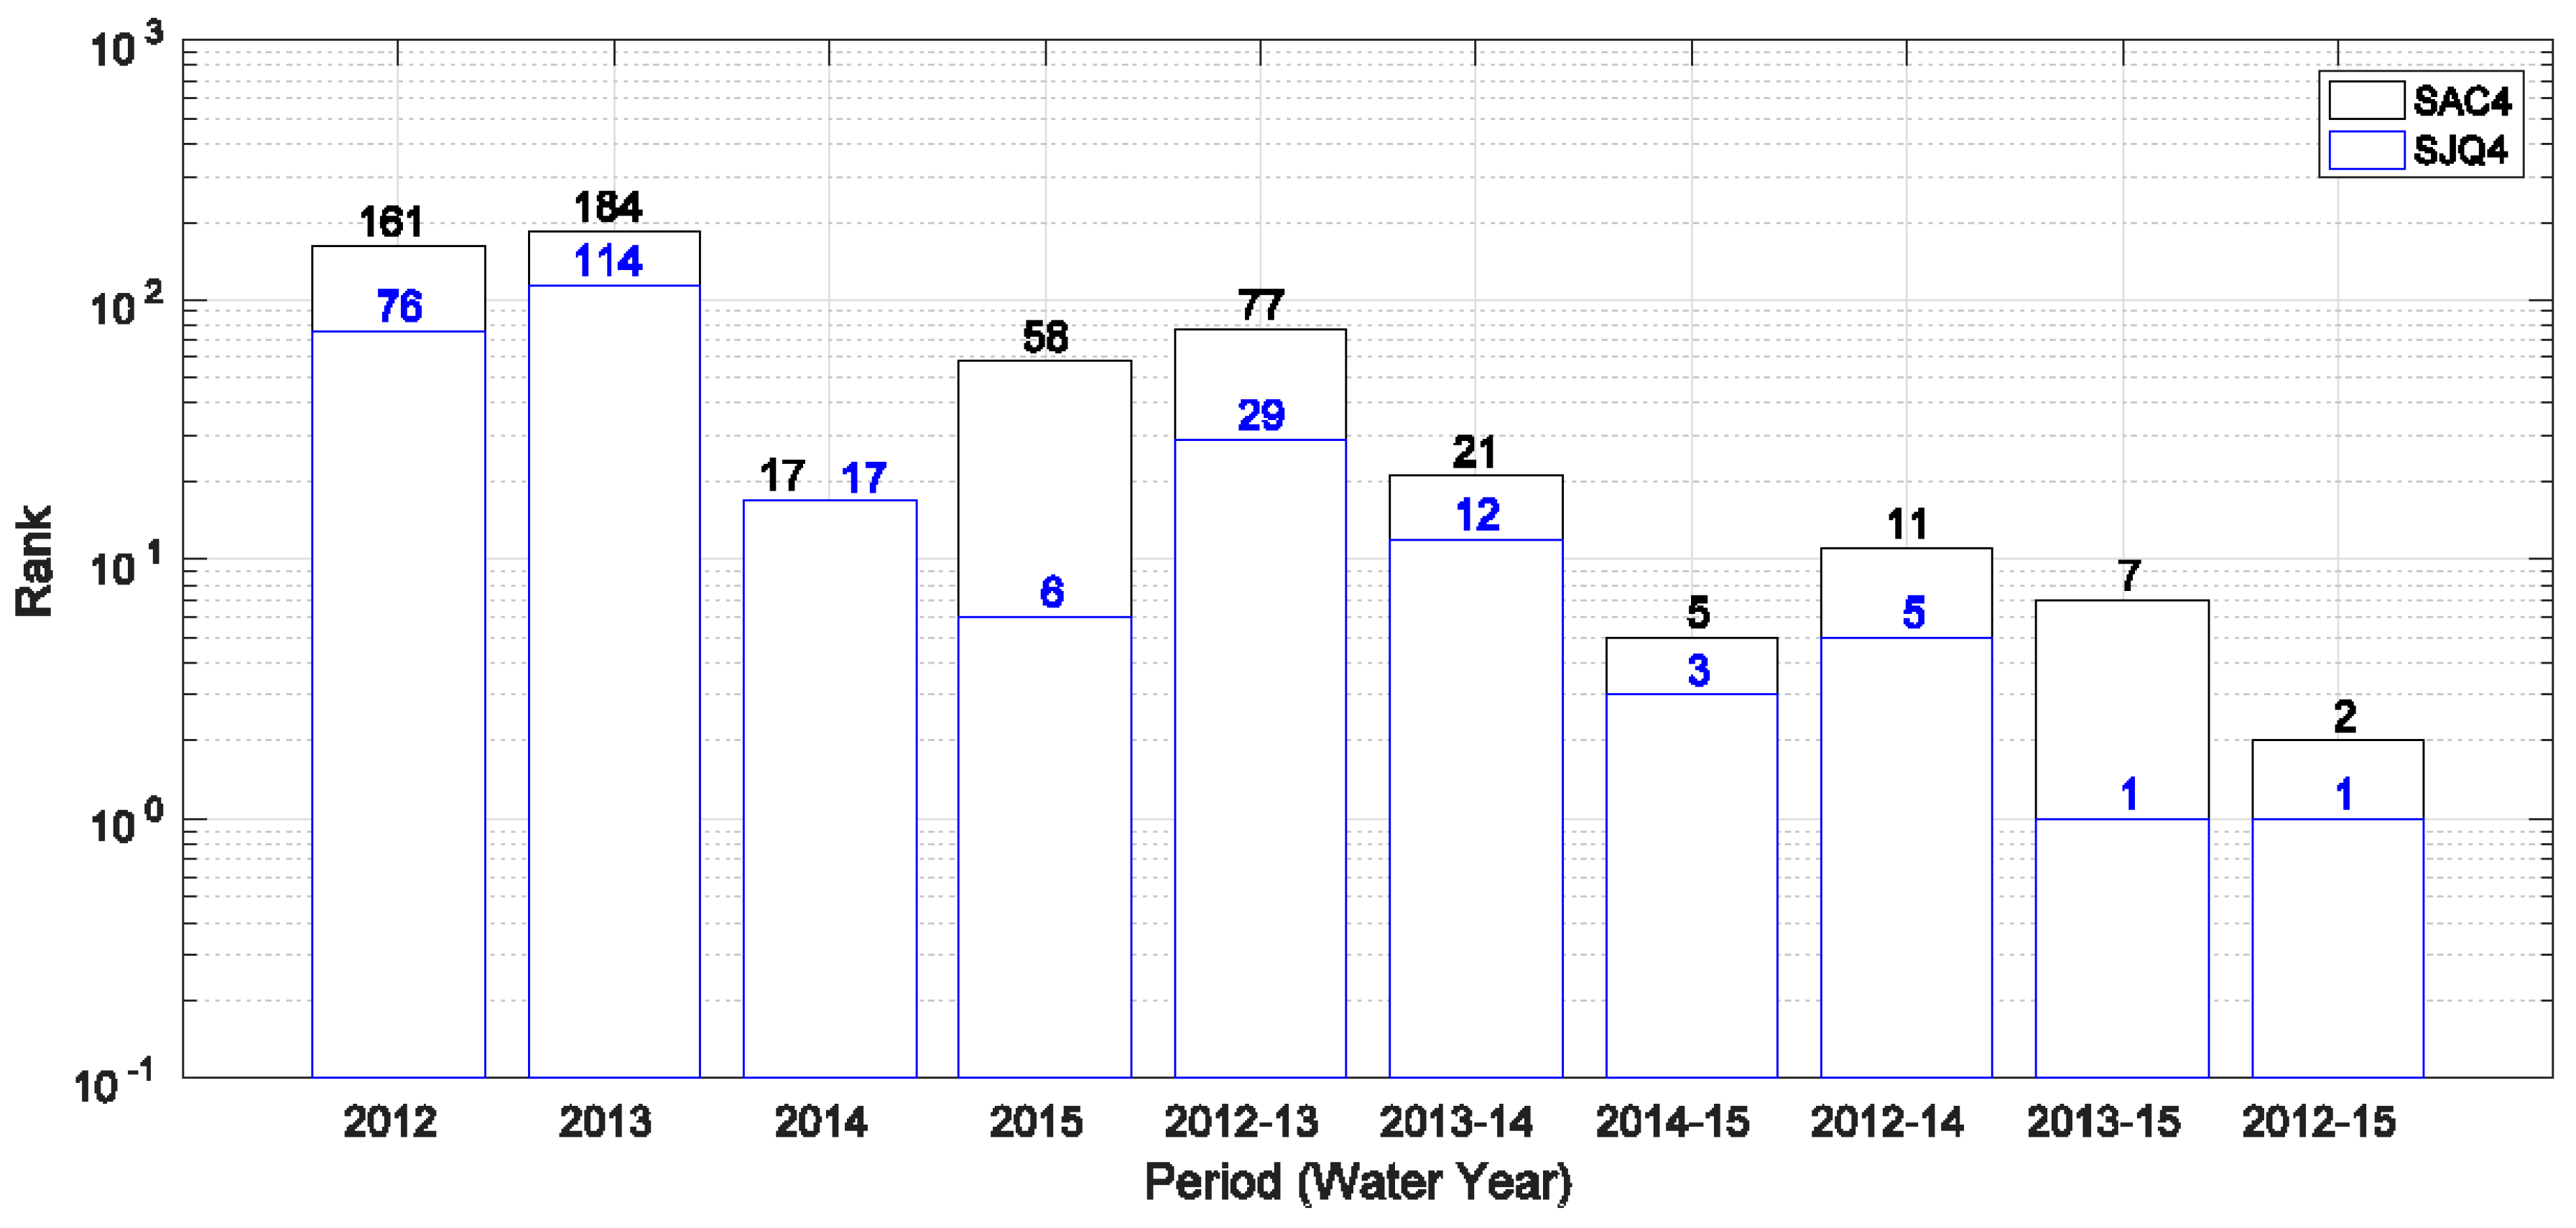
Instrumental data are often limited by the length of the record period. Reconstructed paleoclimatic data supplement the instrumental data in terms of extending the analysis period, making it feasible to assess current drought events on a millennial scale. Based on reconstructed flow data (dating back to 900) and corresponding observed data (in the instrumental period), the SAC4 and SJQ4 annual FNFs at different levels of years within 2012–2015 are analyzed in a paleoclimatic context (
Figure 7). Looking at a single year, only water year 2015 is a top 10 driest (rank sixth) year in terms of annual FNF for the SJQ four rivers. At the two-year level, the period 2014–2015 ranks third for the SJQ4 and fifth for the SAC4. On the three-year scale, average annual FNF of 2013–2015 for the SJQ4 and the SAC4 ranks first and seventh, respectively. At the four-year level, 2012–2015 FNF of the SJQ4 is also unparalleled, while it is the second lowest for SAC4. This shows that at three-year and four-year levels, the drought conditions (measured by annual FNF) in San Joaquin region are exceptional even within a prolonged millennial period (900–2015), while it is not the case for the Sacramento region. At one-year and two-year levels, neither of these two regions observes unprecedented annual FNFs.
In addition to statewide precipitation and annual FNF for the SAC4 and the SJQ4, other variables (as tabulated in
Table 2) are also ranked in their record periods. The corresponding periods at one- to four-year levels when these variables rank first are presented in this study (
Table 5). For temperature, a period ranking first means the hottest (highest temperature) period. For other variables, a period ranking first indicates that the period is with the lowest value of the specific variable in the record period. Statewide, the driest year is 1924 (1977) in terms of precipitation (annual FNF and reservoir storage). However, water year 2015 has the highest temperature, lowest A1 SWE and AJ FNF. At the two-year level, the period 1976–1977 stands out as the driest in terms of precipitation, annual FNF, and reservoir storage. For the other three variables, the period 2014–2015 has the most severe conditions in the record period. Looking at the three-year level, the period 1990–1992 has the lowest annual FNF and reservoir storage and the period 2012–2014 is the driest (lowest precipitation). For the remaining three variables, the period 2013–2015 has the lowest values. At the four-year level, the period 2012–2015 tends to have the driest conditions in terms of all variables except for reservoir storage. The period 1989–1992 is the four-year period with the lowest reservoir storage. For the TUL region, the periods (one- to four-year levels) with the lowest reservoir storage all occur in the drought from 1988–1992. The driest single year is 1977 in terms of precipitation. For other variables, the driest conditions all occur within the 2012–2015 drought at one- to four-year levels. Except for variables WSI and hybrid FNF, which are specific to the SAC region and the SJQ region, the driest single years of these two regions for other variables are consistent with the statewide conditions. The driest two-year periods of these two regions are also consistent with the corresponding statewide conditions with one exception. The period 1976–1977 has the lowest AJ FNF for the SJQ region while it is 2014–2015 for the SAC region and statewide. At the three-year level, the conditions of the SAC region and the SJQ region are mostly similar to those of the statewide conditions with one exception for each region. The driest three-year (with lowest precipitation) period for the SAC region is 1975–1977 other than 2012–2014. The three-year period 2013–2015 (instead of 1990–1992) has the lowest annual FNF for the SJQ region. At the four-year level, the conditions over the SJQ region are in line with the corresponding statewide conditions. However, for the SAC region, the periods with the lowest precipitation and annual FNF are both 1931–1934 rather than 2012–2015. Focusing on the WSI, the driest one- to four-year periods for the SAC region differ from those of the SJQ region. The single year with the lowest WSI is 1977 (2015) for SAC (SJQ). The corresponding four-year periods are 2012–2015 and 1928–1931 for the SAC region and the SJQ region, respectively. In a paleoclimatic context, the one-year and two-year periods with the lowest annual FNF are 1580 and 1579–1580, respectively, for both the SAC region and the SJQ region. At three-year and four-year levels, as also indicated in
Figure 7, the SJQ region observes the lowest annual FNF during the periods 2013–2015 and 2012–2015, respectively. For the SAC region, the corresponding periods are 1578–1580 and 1931–1934, respectively. In general, though differences exist across different regions, the period 2012–2015 and sub-periods within it are not unparalleled for all variables.
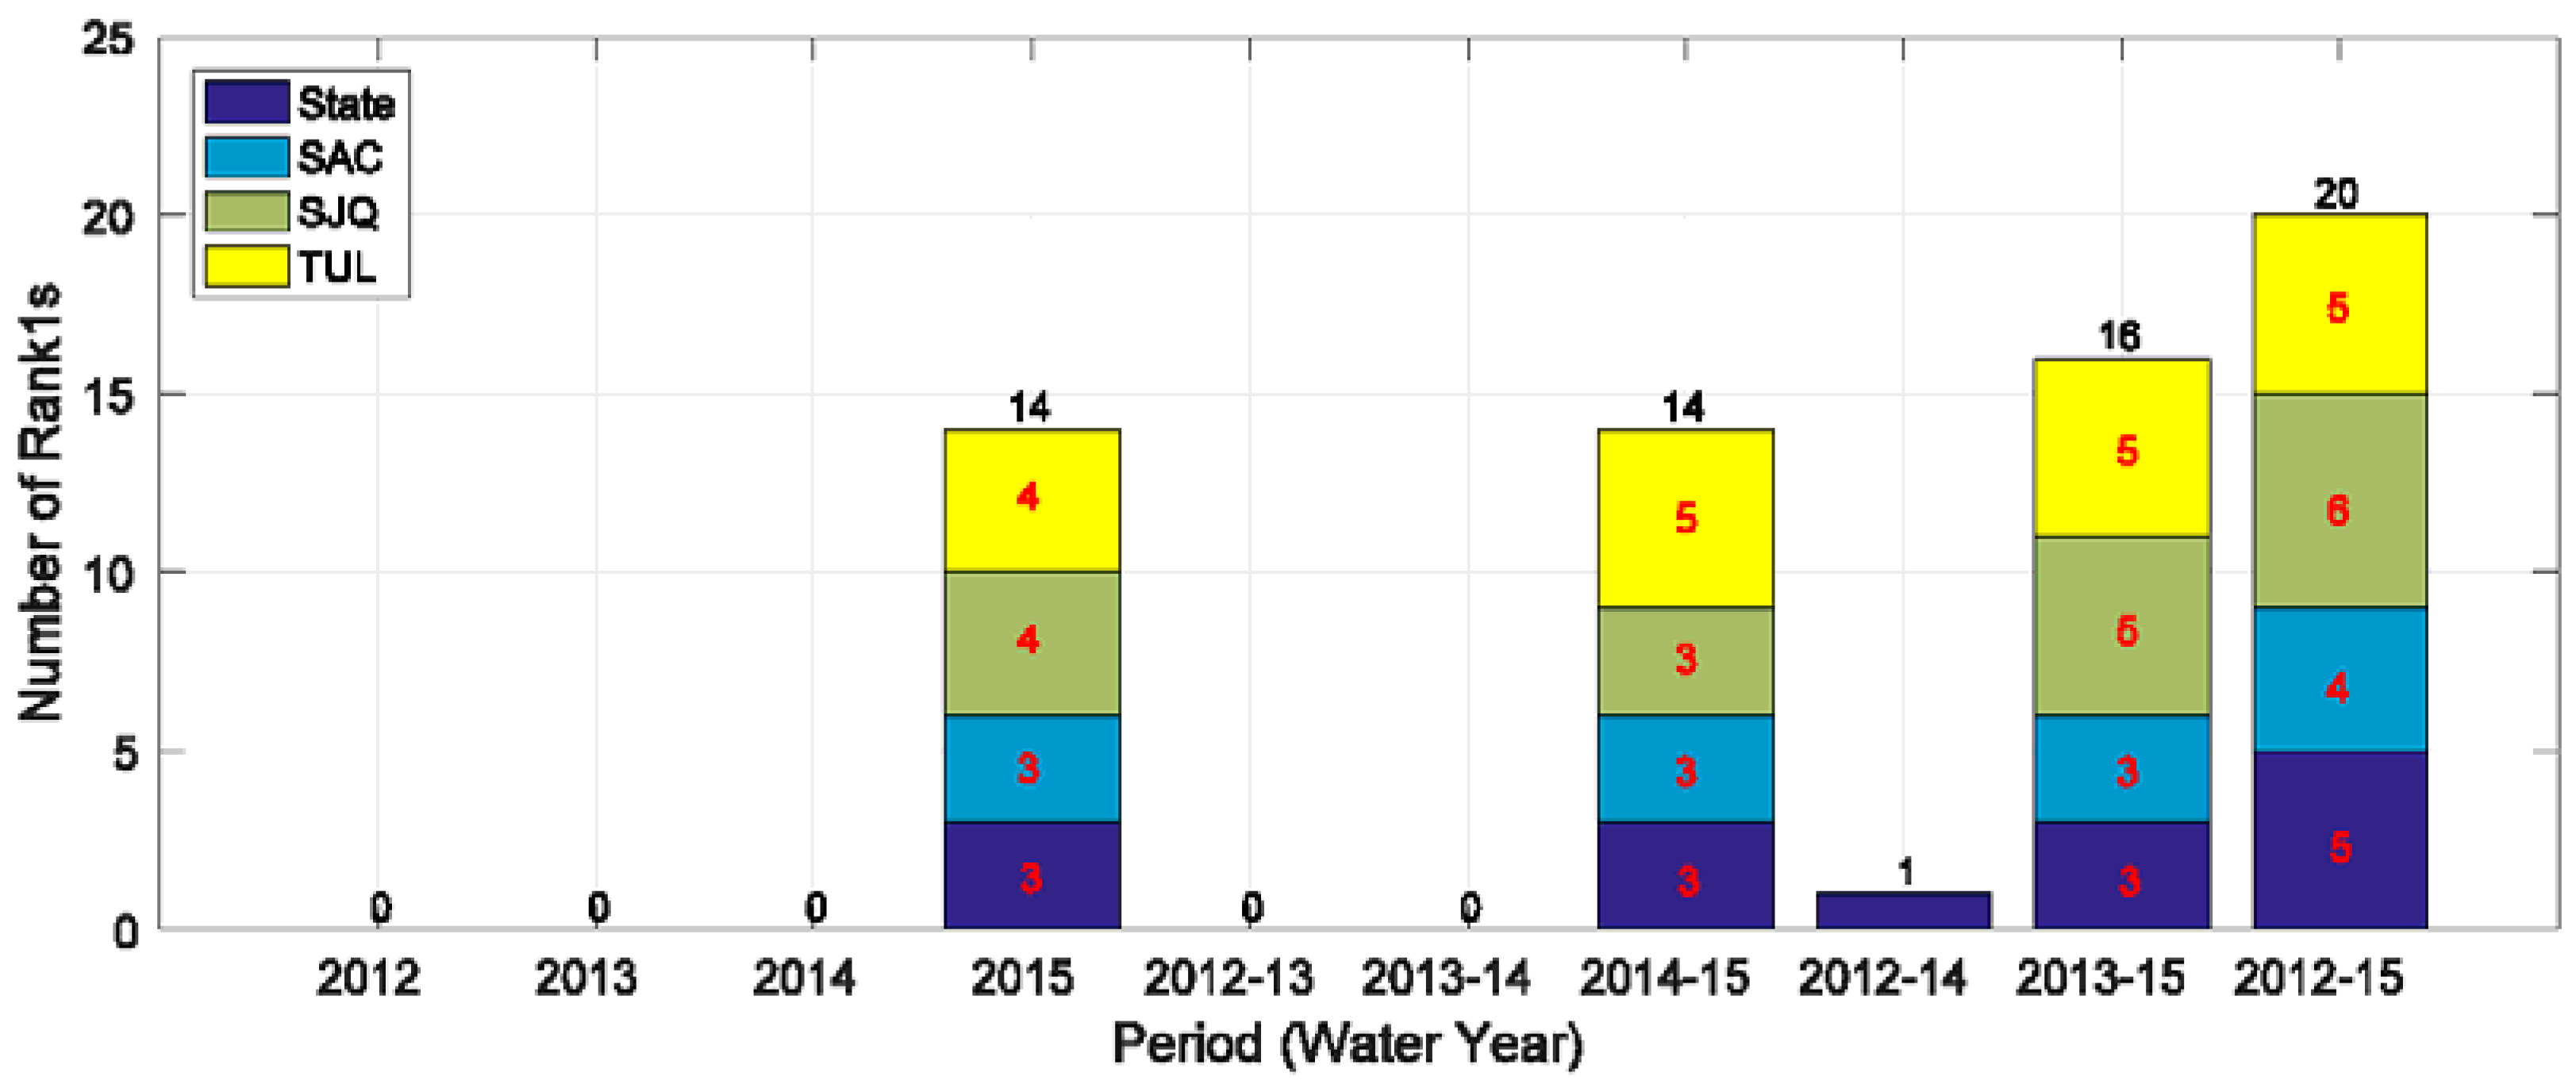
To identify which sub-periods within 2012–2015 have the most severe conditions, the number of variables ranked first is counted for each one- to four-year sub-period (
Figure 8). It is evident that at the one-year level, no variables in (water) year 2012, year 2013, or year 2014 rank first in the record period. However, in 2015, 14 out of 28 variables rank first (three statewide and for the SAC region; four for the SJQ region and the TUL region each). At the two-year level, 14 variables rank first in 2014–2015 (three statewide, the SAC region, and the SJQ region each; five for the TUL region) versus none in other two two-year sub-periods. Looking at the three-year level, the sub-period 2013–2015 tends to be the drier one with 16 variables ranked first (three statewide and for the SAC region; five for the SJQ region and the TUL region each) versus one in 2012–2014. At the four-year scale, 20 out of 28 variables rank first (five statewide and for the TUL region; four for the SAC region; six for the SJQ region). Overall, it is evident that, within the period 2012–2015, 2015, 2014–2015, and 2013–2015 have the most (more) significant drought conditions at one- to three-year levels, respectively. At the four-year level, 2012–2015 is not unprecedented for eight out of 28 variables considered.
3.3. Spatial Characteristics of the Drought
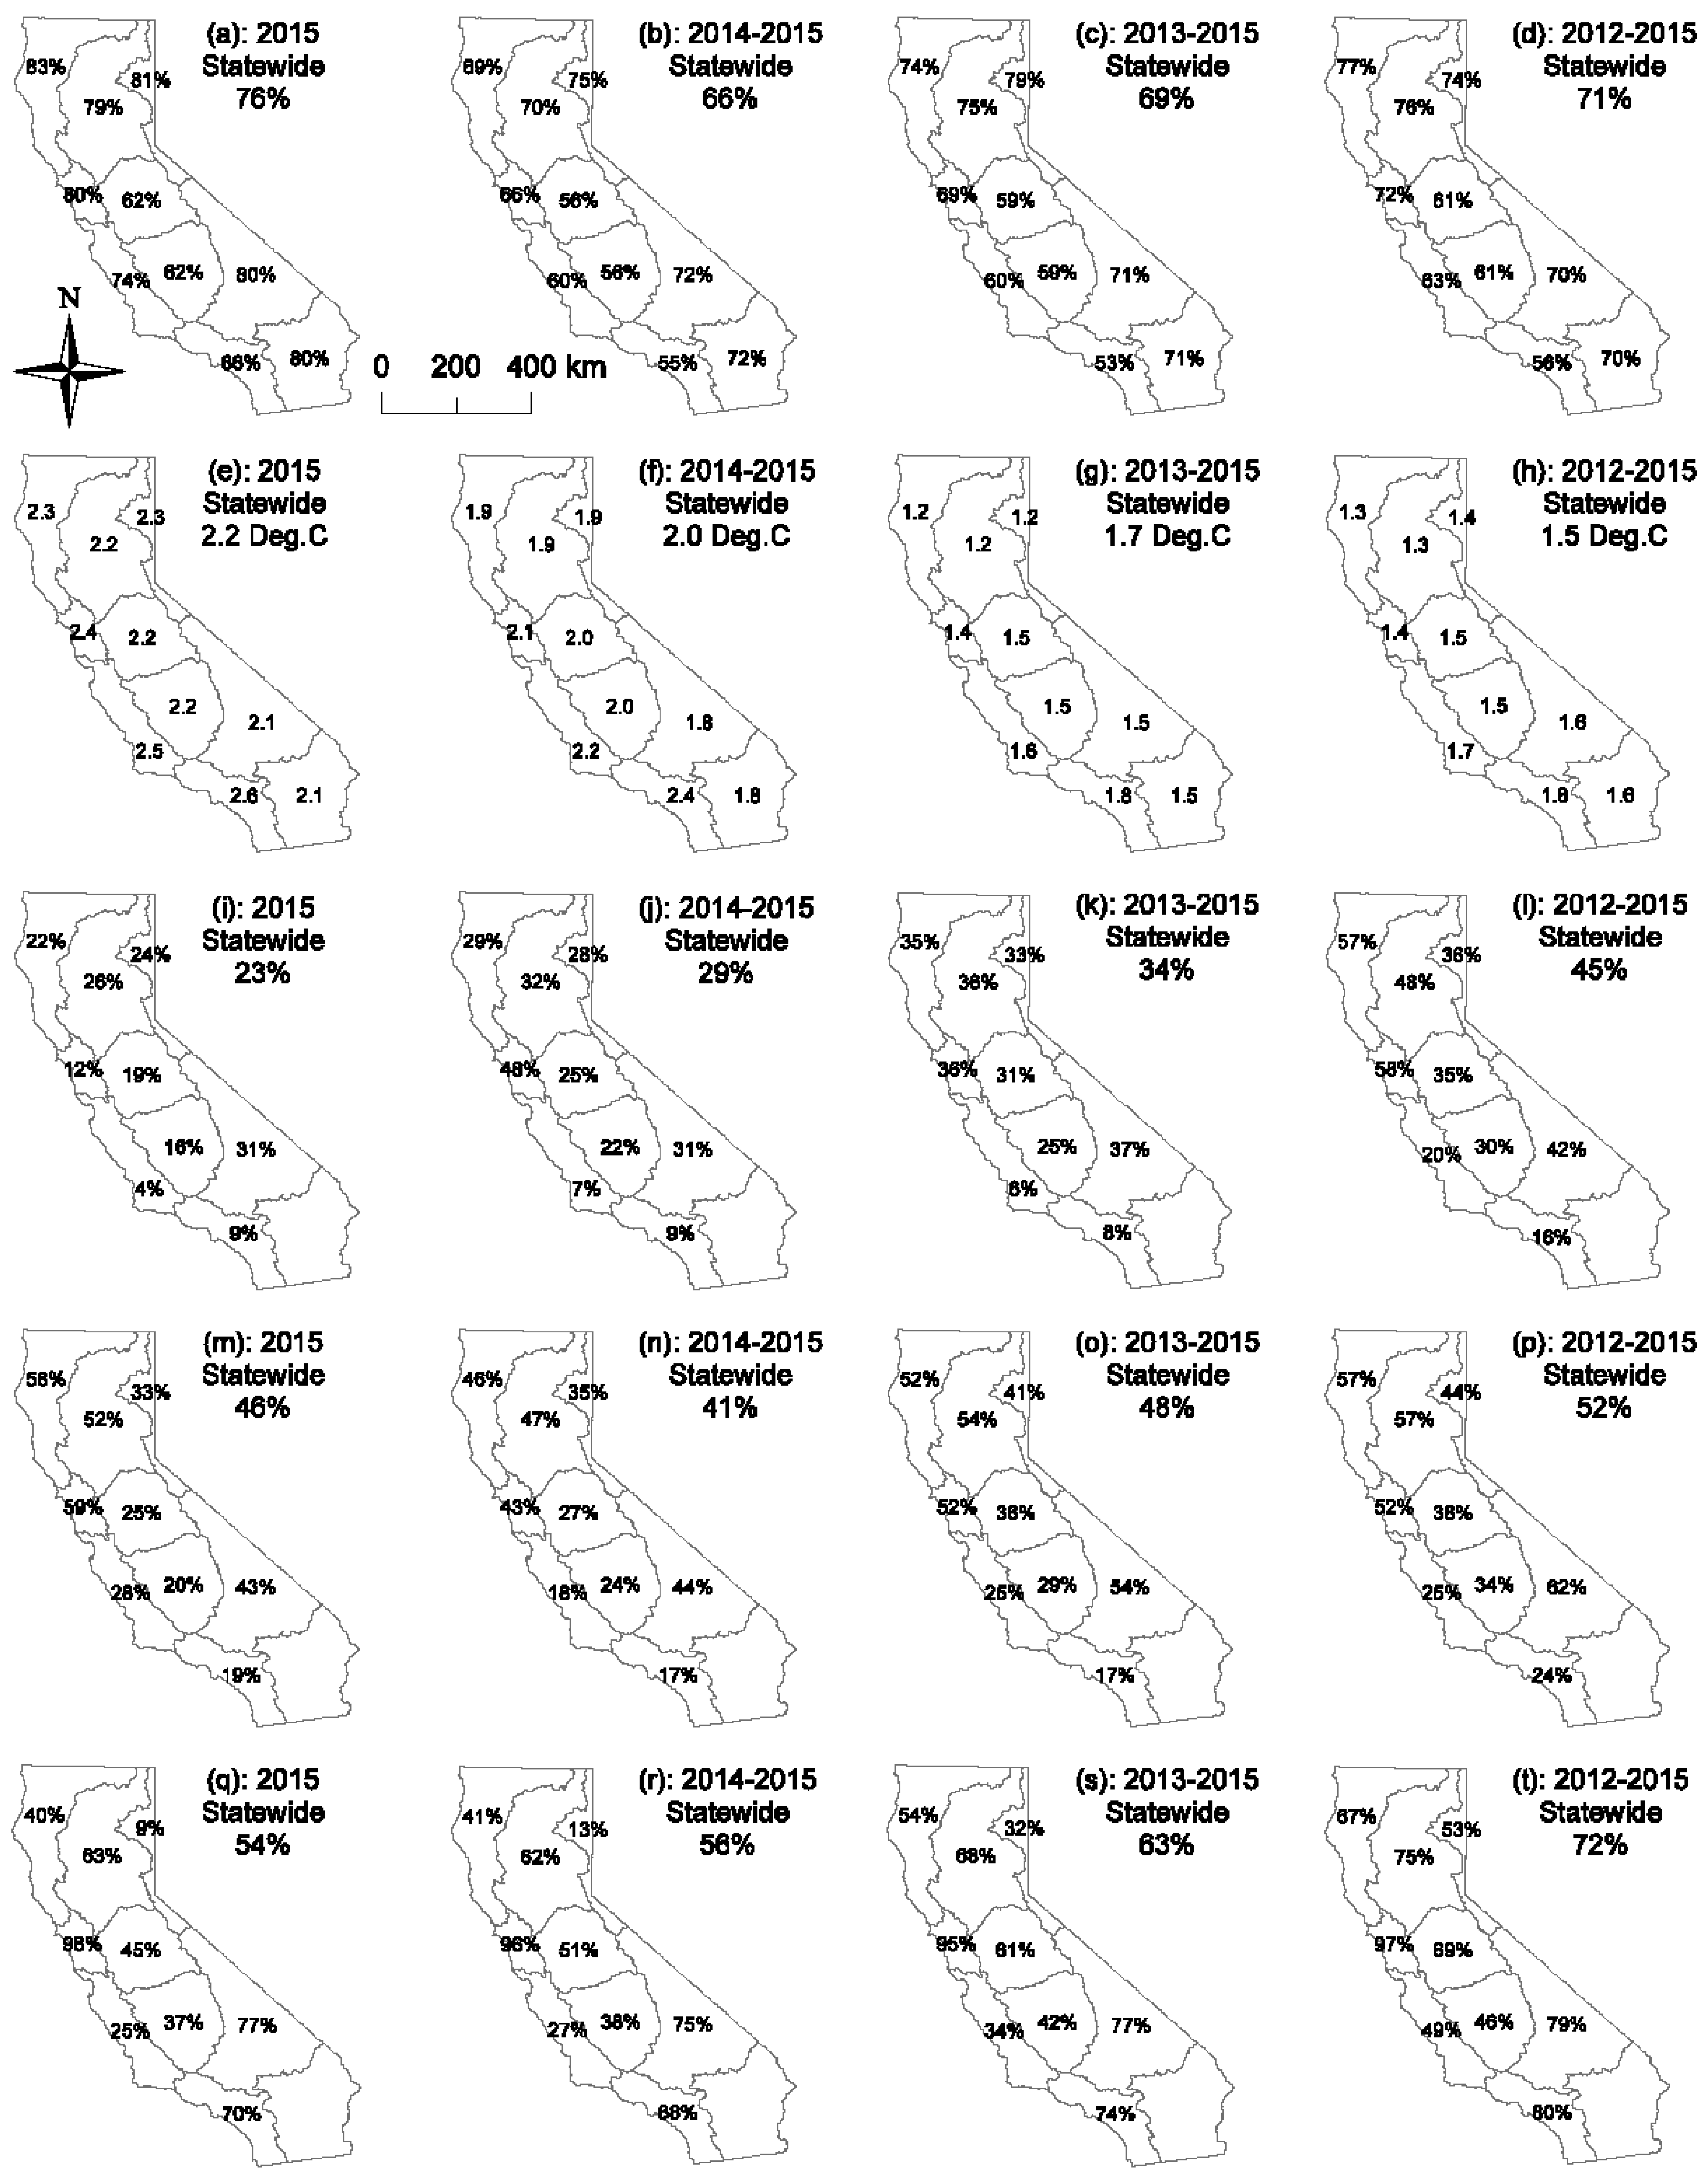
To investigate the spatial characteristics of the 2012–2015 drought, precipitation, temperature, AJ and annual FNF, and reservoir storage (September) are compared to the average conditions at the (hydrologic) regional scale in the driest one- to four-year sub-periods within 2012–2015 (
Figure 9). It should be highlighted that the Colorado Region depends on the Colorado River for the majority of its water resources. The full natural flow and reservoir storage data of this region are normally not collected by CDWR and thus are not presented in this study.
It is clear that all regions observe less than average (percent of average less than 100%) precipitation during the 2012–2015 drought (
Figure 9a–d). Particularly, both the SJQ region and the TUL region have the lowest percent of average among all regions at the one-year level (
Figure 9a). At two- to four-year levels, the South Coast Region tops the list with percent of average values consistently less than 60%, followed by the SJQ Region and the TUL region (
Figure 9c,d). The Central Coast Region is the next driest region following those three regions in all four periods. In comparison, three northern regions (North Coast, Sacramento, and North Lahontan) have distinctly higher percent of average (mostly above 70%) in all four periods considered, indicating that these regions have relatively less significant shortage in precipitation during the drought.
It is also evident that all regions have higher than average temperature in the past four years (
Figure 9e–h). Particularly, the temperatures of all regions in 2015 exceed their corresponding long-term averages by an amount over 2 °C consistently (
Figure 9e). Among all regions, the South Coast Region observes the most significant increases (above the long-term average) in temperature at all four temporal levels investigated, followed by the Central Coast Region. In comparison, temperature increases in the Central Valley regions are relatively milder. For instance, in 2015, the temperature of the South Coast region is 2.6 °C higher than the long-term average, while it is 2.2 °C for three Central Valley regions (
Figure 9e).
It is noticeable that all regions observe less than one third of their average AJ FNF in 2015 (
Figure 9i). This is most likely caused by record high temperature (
Figure 9e), record low statewide snowpack conditions (
Figure 2), below average precipitation (
Figure 9a), and increased evapotranspiration (induced from high temperature) in 2015. At one- to three-year levels, the Central Coast Region has the lowest percent of average of AJ FNF (
Figure 9i–k). The South Coast Region has the second lowest percent of average. The specific percent of average values of these two regions are persistently below 10%. At the four-year level (2012–2015), however, the South Coast Region observes the lowest AJ FNF (16% of average), followed by the Central Coast Region (20% of average). In general, the TUL region and the SJQ region also have significantly lower than average AJ FNF. Their percent of average values rank fourth (TUL) and fifth (SJQ) lowest in 2015 (
Figure 9i), respectively. The corresponding ranks are third and fourth, respectively, at other three temporal scales (
Figure 9j–l). The two wettest regions (North Coast and Sacramento) have relatively higher percent of average values in AJ FNF. In comparison to AJ FNF, all regions normally have higher percent of average values in annual FNF (
Figure 9m–p). The difference is the most remarkable in 2015 (
Figure 9m) when the statewide percent of average of annual FNF is twice of that for AJ FNF (46% versus 23%). These two regions with the lowest percent of average in AJ FNF (Central Coast: 4%; South Coast: 9%) have much higher percent of average values for annual FNF (Central Coast: 28%; South Coast: 19%). It is evident that the South Coast Region has the lowest percent of average values consistently at four temporal scales considered. The Central Coast Region has the second lowest percent of average values at two- to four year levels (
Figure 9n–p). The TUL region also observes significantly less than average annual FNF, ranking second at the one-year level (2015) and third at two- to four-year levels. Similar to the case for the AJ FNF, the two wettest regions (North Coast and Sacramento) have relatively higher percent of average values in annual FNF. At the four-year level (2012–2015), both regions observe 57% (versus 24% of the South Coast Region) of average annual FNF.
Looking at reservoir storage (September), the North Lahontan Region has the lowest percent of average values (the TUL region ranks third) at one- to three- year levels while the TUL region has the lowest percent of average (North Lahontan region ranks third) at the four-year level. The Central Coast region and the North Coast region rank second and fourth, respectively, at all four temporal levels. In contrast, the San Francisco region reservoir storages are nearly at the average (ranging from 95% to 98% of average) in all four periods investigated.
In general, large differences are observed across different regions and different temporal scales. Water year 2015 tends to be the hottest year for all regions with the lowest AJ FNF recorded for every region. During the four-year period (2012–2015), all regions also have higher than normal temperature along with significant shortages in precipitation, AJ FNF, annual FNF, and reservoir storage. On average, the shortage in AJ FNF is the most significant. Judging by precipitation, the South Coast Region is the driest during the 2012–2015 drought, followed by the San Joaquin Region and TUL region. Assessing by temperature, the South Coast Region is the hottest during the drought with the Central Coast Region ranked second. Looking at streamflow runoff, the South Coast Region, Central Coast Region, and TUL region observe the most deficiencies. Measuring by reservoir storage, the North Lahontan Region, Central Coast Region, and TUL region generally have the most severe conditions.
Statewide, the percent of average values of precipitation, AJ FNF, annual FNF, and reservoir storage at four-year level are generally the highest comparing to their corresponding counterparts at other three temporal scales. The above average temperature is also the lowest at the four-year level. Those observations indicate that drought severity conditions are relatively milder in a longer period. This is due to the fact that drought conditions vary year to year and the severity is normally averaged out when looking over a longer period.


