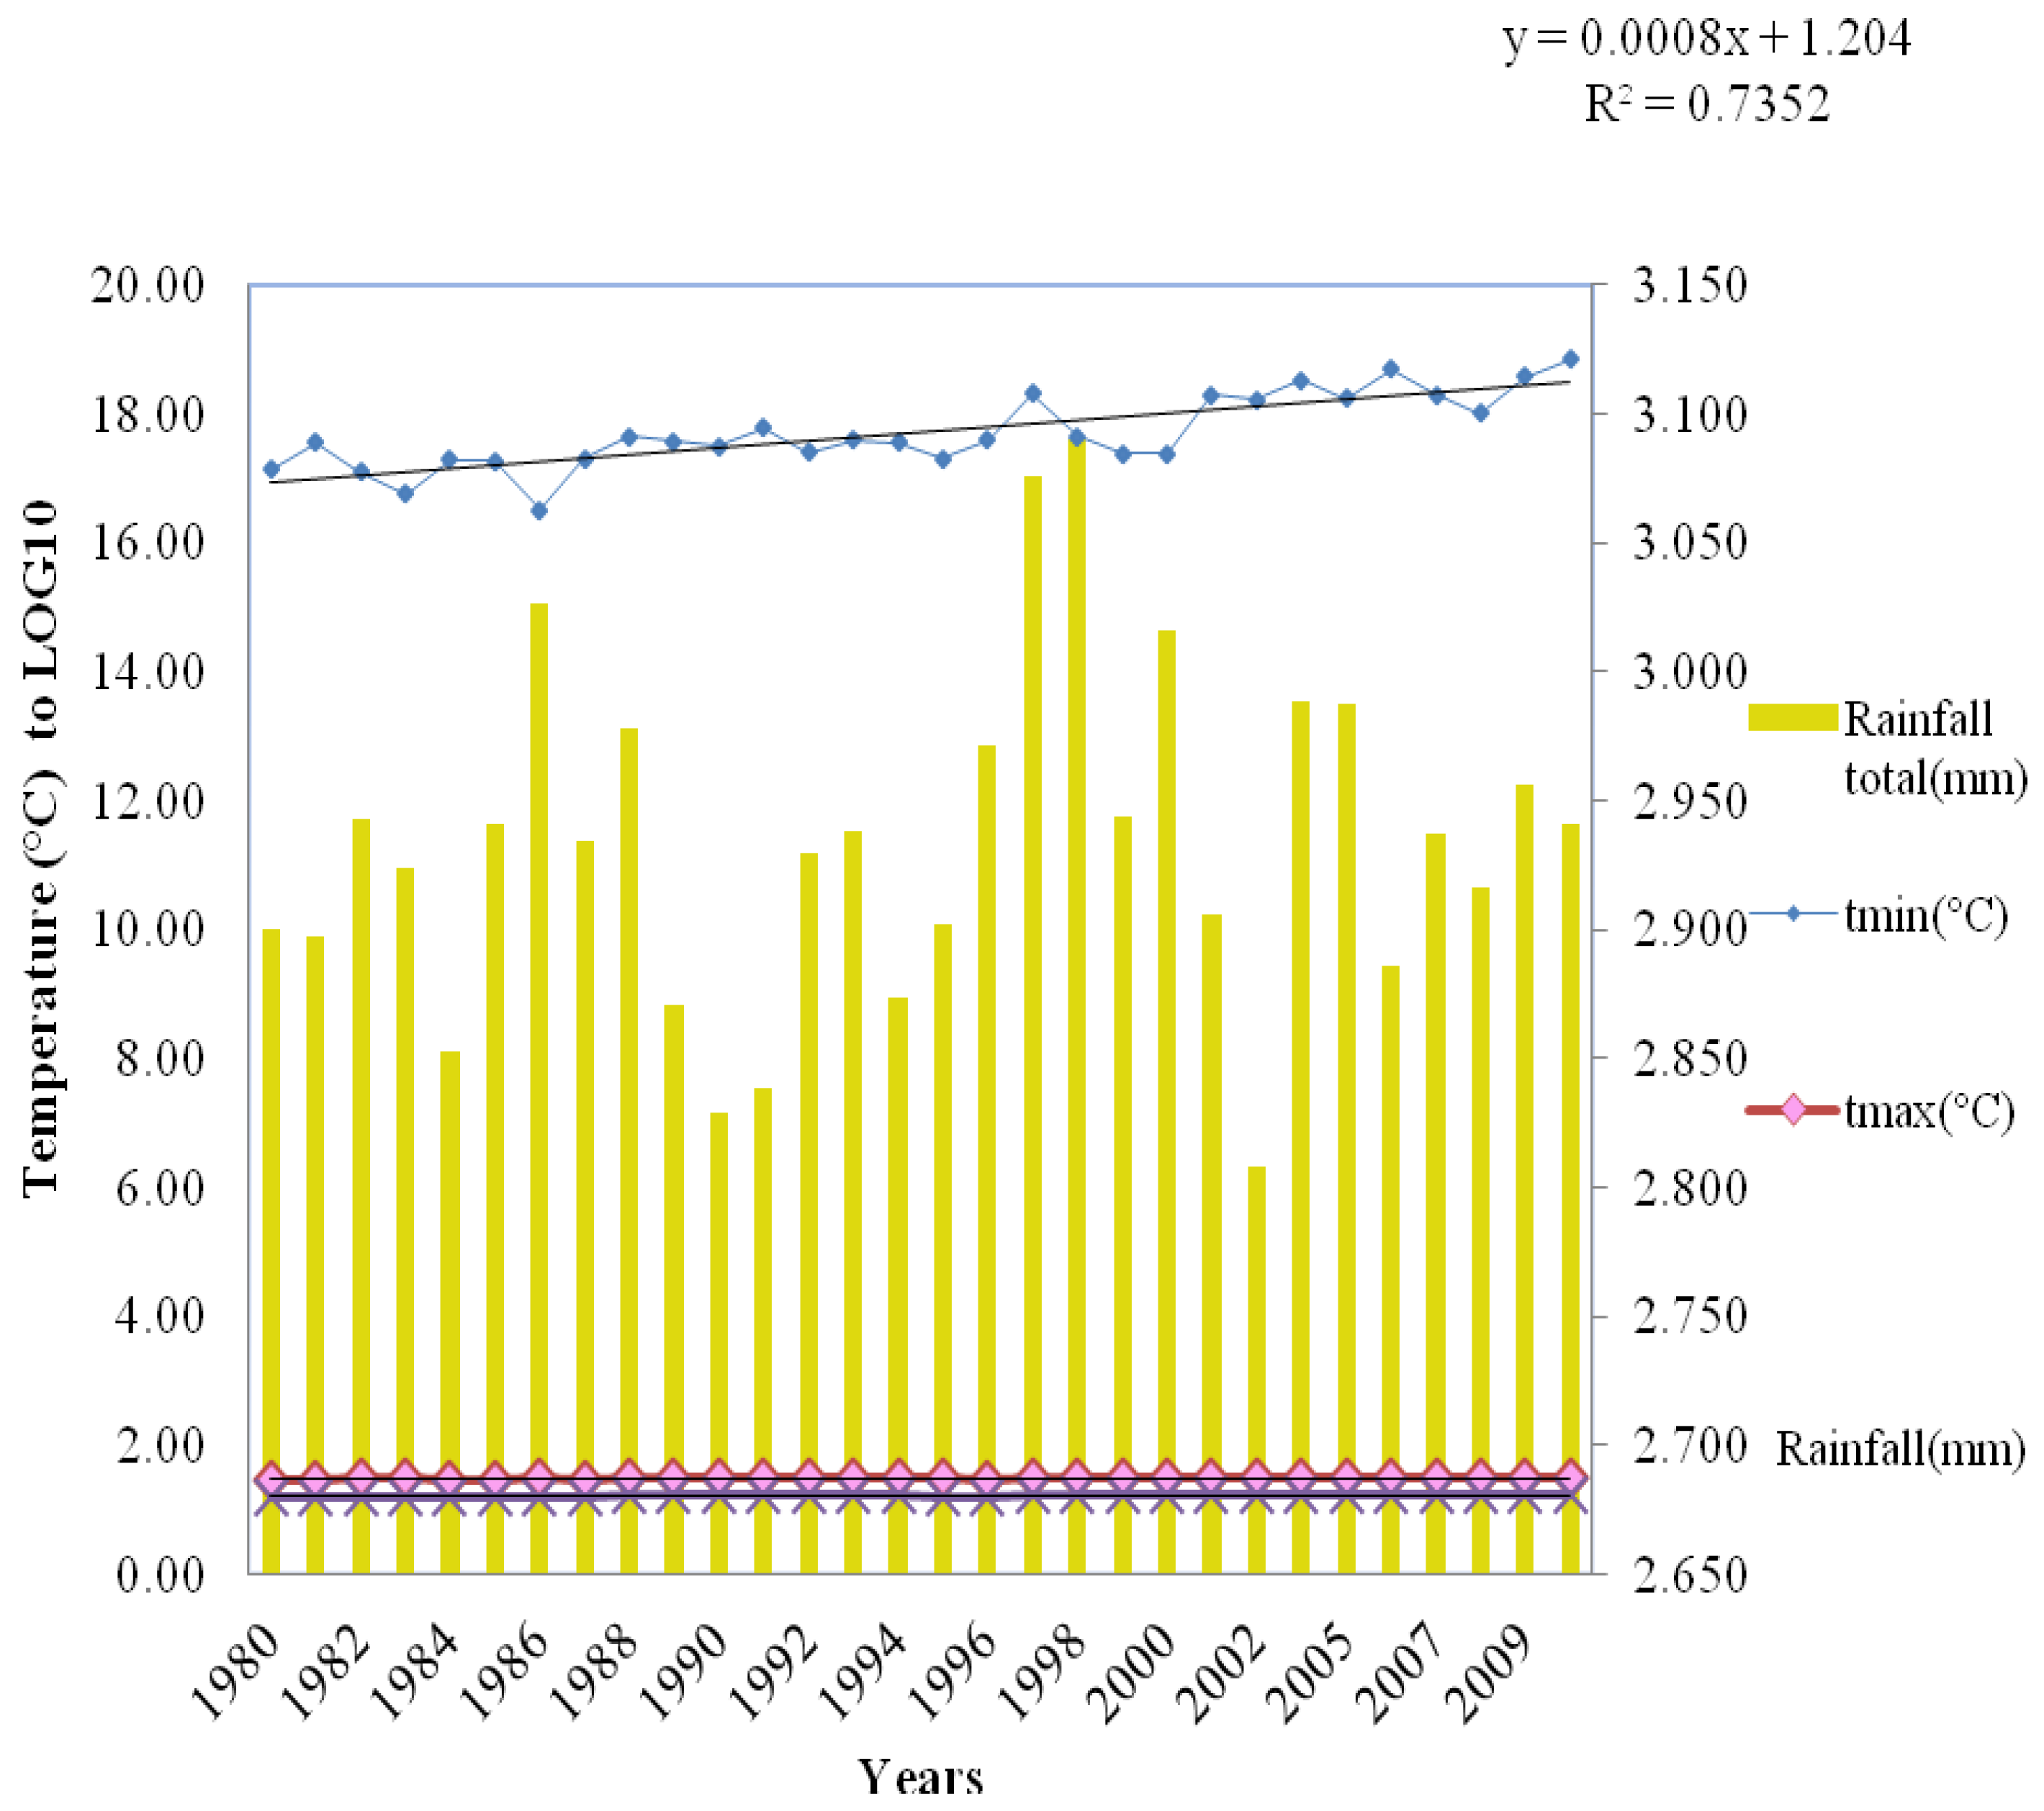
3.1. Weather Trends and Time Series Data for Climatic Changes Detection in the Study Area
Since 1980–2009, the average surface temperature across the region changed from a maximum of 30 °C to 32 °C (
Figure 2). The equation in
Figure 2 (y = 0.0451x + 23.372) illustrates a change in mean temperature over time and R
2 = 0.7332 indicating that 73.3% of the total variation in temperature (y) has a linear relationship between x = years and y = temperature (as described by the regression equation). Therefore, there is a significant change over the 30 years in the average temperature implying occurrences in climatic changes. This average temperature has risen more quickly since the late 1960s, shifting weather patterns and causing more extreme climate events, which are currently affecting the society and ecosystems. For example, in the period of 1997 to 1998, as illustrated in
Figure 2, there were El Nino rains ranging between 1200 mm to 1400 mm, which affected the lowlands in the study area with floods spreading in Karusandara sub-county, Kasese district.
In the past 30 years, farmers who experienced and observed changes in climate (
Figure 2) were subsequently probed on how they employed adaptation practices to buffer climate change impacts. Also, in the process of adaptation, various barriers affect communities to practice and implement adaptation programs in their major livelihood enterprises as illustrated (
Figure 3);
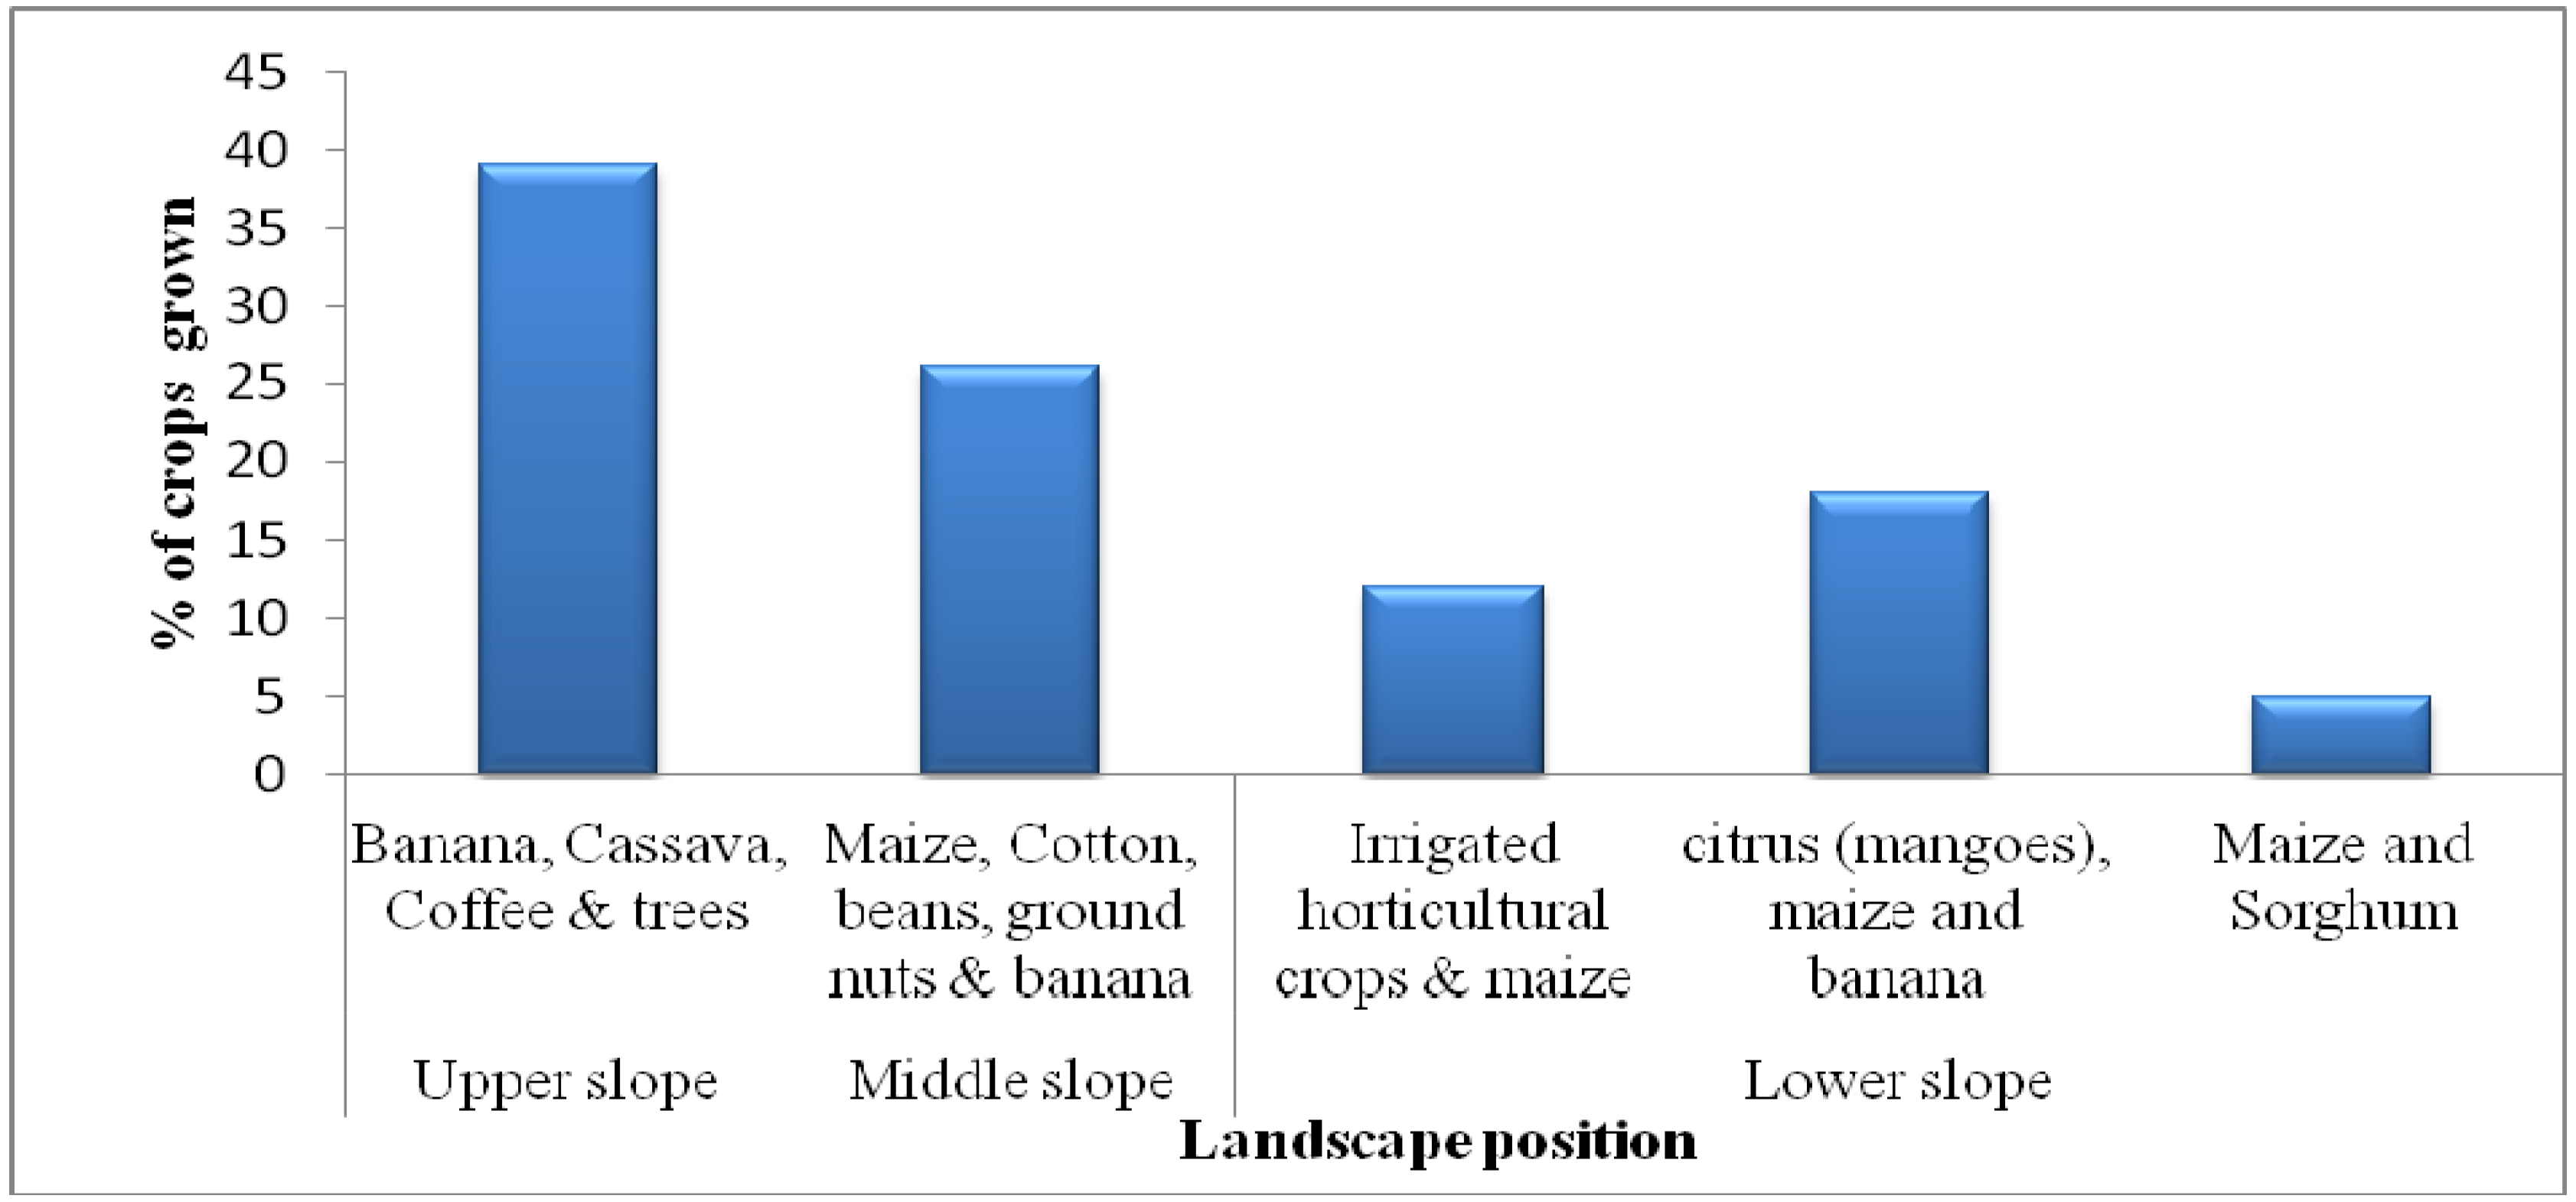
Crops grown in the study area differed according to the landscape position, as indicated in
Figure 4, depending on the favourable soils, climate, and elevation at a given location along the mountain slopes. In the upper slopes, banana and coffee were integrated with cassava, sweet potato, and maize. A similar intercropping strategy was also found in the mid slopes (1000–1450) and intercropped with annuals like maize, tomatoes, and a very small number of cotton. In the Mubuku Irrigation Scheme (mid-slope), farmers had adopted irrigated horticultural crops and improved maize varieties (Longe 6H maize) as a seasonal adaptation practice. During the field study, it was found out that agricultural land uses in Kasese also included the growing of perennial crops (banana and coffee) and annuals (beans, groundnuts, maize, sorghum, sweet potatoes, millet, cassava, Irish potato, and fruit trees). It was also revealed that these crops are grown at different locations along the mountain slopes (landscape positions), as illustrated in
Figure 4.
3.2. Empirical Model Results and Discussion
In this paper, the multinomial logistic regression (MNL) choice model was employed to analyze the determinants of farmer adaptation practices in southwestern Uganda.
Model results for MNL indicating the drivers of using the different climate change adaptation practices are shown in
Table 2,
Table 3,
Table 4,
Table 5 and
Table 6. For soil and water conservation, flood shocks and the existence of farm inputs were the most significant factors influencing their use. For crop variety, landscape position, crop yield, farm income, and household size were the most significant factors for use of new varieties. Change in planting date was influenced by drought shocks and their impacts, crop yield, farm income, and landscape position. Adoption of furrow irrigation was influenced by the age and experience of the farmer. Flood shocks negatively influenced the adoption of Soil Water and Conservation, while farm inputs had a positive effect. Only crop yield and household income had a positive effect on the adoption of crop variety and planting date, respectively. Drought shocks and landscape position had opposite effects in the adoption of tree planting/agroforestry. For furrow irrigation, experience had a negative effect while age had a positive effect, this is because smallholder farmers deploy irrigation as a new farm technology regardless to their experience and this is a government program implemented by the agricultural extension department for communities to adopt in the area.
Shock floods were negatively related to the adoption of soil conservation practices as a climate change adaptation practice though being statistically significant (p ≤ 0.05). The results were contrary to expectation as farmers affected by shock floods were expected to adopt soil conservation practices. The occurrence of shock floods decreased the probability of adopting soil conservation practices by a factor of 0.433.
The use of farm inputs showed a positive relationship to the adoption of soil conservation practices and was significant (p ≤ 0.01). This showed that farmers that used farm inputs like fertilizers, improved seeds, and herbicides, were more likely to take up soil conservation practices as compared to their counterparts. Farm inputs increased the probability of adopting soil conservation practices by a factor of 0.29.
Household size was negative though statistically significant (p ≤ 0.05) to the adoption of crop varieties as a climate change adaptation practice. This indicated that if the size of the household increased by one member, the chance of adoption of different crop varieties reduced by a factor of 0.077.
Landscape position was also negatively related to the adoption of crop varieties. However, it was statistically significant (p ≤ 0.05). The position of crop varieties on the upper, middle, or lower slopes decreased the probability of the adoption of crop varieties by a factor of 0.206.
There was a positive and significant (p ≤ 0.01) relationship between crop yield and adoption of crop varieties as a climate change adaptation practice. Crop yield increased the probability of adopting crop varieties by a factor of 0.005. This is because some crop varieties are drought, pest, and disease resistant, therefore the farmer does not incur losses to pests or diseases, something that leads to increased crop yield.
Farm income on the other hand, had a negative relationship with the adoption of crop varieties, although being statistically significant (p ≤ 0.01). A marginal effect of 0.178 indicated an increase in farm income by one unit deceased the odds of that household to adopt crop varieties by 0.178.
The results revealed that shock drought was negatively related to the adoption of changing planting dates as a climate change adaptation practice, though being statistically significant (p ≤ 0.05). An experience with shock drought decreased the probability of adopting changing planting dates by 7.97.
Results of shock were also negatively related to the adoption of changing planting dates and this was also statistically significant (p ≤ 0.05).
Landscape position was also negatively related to the adoption of changing planting dates even though being statistically significant (p ≤ 0.05).
There was a negative relationship between crop yield and the adoption of changing planting dates, although the results were statistically significant (p ≤ 0.05). An increase in crop yield decreased the probability of adopting changing planting dates by a factor of 1.52.
Farm income showed a positive relationship to the adoption of changing planting dates and was statistically significant (p ≤ 0.05). An increase in the farm income increased the probability of adopting changing planting dates by a factor of 1.74.
The relationship between shock drought and adoption of planting trees/agroforestry as a climate change adaptation practice was positive and statistically significant (p ≤ 0.05). The odds in favor of farmers who experienced shock drought increased by 0.004 as compared to those who did not experience shock drought. This implies that farmers who experience shock drought are more aware of its dangers and are therefore more willing to adopt mitigation strategies.
Landscape position however, had a negative relationship on the adoption of planting trees/agroforestry even though being statistically significant (p ≤ 0.05). Planting trees on a particular landscape position decreased the probability of adopting planting trees by a factor of 6.08.
The age of the farmer showed a positive relationship to the adoption of furrow irrigation and was significant (p ≤ 0.05). This indicates that older farmers were more likely to adopt furrow irrigation as a climate change adaptation practice compared to their counterparts. Being older increased the probability of adopting furrow irrigation by a factor of 0.014.
Experience in farming was negatively related to the adoption of furrow irrigation although being statistically significant (p ≤ 0.01). The marginal effect of 0.013 indicated that an increase in the farming experience by one unit decreased the odds of that household to adopt furrow irrigation.


