Article

Analysis of Temperature Change in Uzbekistan and the Regional Atmospheric Circulation of Middle Asia during 1961–2016

by
Bakhtiyar M. Kholmatjanov
1,2,
Yuriy V. Petrov
2,
Temur Khujanazarov
3,*,
Nigora N. Sulaymonova
1,
Farrukh I. Abdikulov
2 and
Kenji Tanaka
3
1
Hydrometeorological Research Institute, Center of Hydrometeorological Service of the Republic of Uzbekistan, Tashkent 100052, Uzbekistan
2
Faculty of Physics, National University of Uzbekistan, Tashkent 100174, Uzbekistan
3
Disaster Prevention Research Institute, Kyoto University, Kyoto 611-0011, Japan
*
Author to whom correspondence should be addressed.
Climate 2020, 8(9), 101; https://doi.org/10.3390/cli8090101
Submission received: 6 August 2020 / Revised: 11 September 2020 / Accepted: 17 September 2020 / Published: 18 September 2020
(This article belongs to the Section Climate and Environment)

Abstract

:
Climate change and shrinking of the Aral Sea have significantly affected the region’s temperature variations. Observed interannual changes in Uzbekistan’s air temperature compared to the duration of synoptic weather types (SWT) in Middle Asia were analyzed. Nonparametric Mann–Kendall statistical test and climate trends coefficients were used to identify trend characteristics of observed temperature from 1961–2016 to the baseline period of 1961–1990. The results showed increasing temperature trends average to 1 °C in warm and cold half years over Uzbekistan. The 1991–2016 decadal temperature trend ranged from 0.25 °C/decade in the northwest to 0.52 °C/decade in the center, especially pronounced in the oasis and Aral Sea zones. There were also significant changes in the structure of regional SWT. The main difference in the structure of SWT in Middle Asia relative to the baseline period was expressed in a decrease of cold mass invasion duration from 113.4 to 76.1 days and an increase in low-gradient baric field duration from 65.8 to 134.6 days. The process of anthropogenic warming, which began in Uzbekistan in the 1960s of the twentieth century, has accelerated from the mid-1970s with a higher mean annual air temperature than the baseline period’s climate normals (1961–1990) and is associated with changes in the regional SWT over Middle Asia.

Graphical Abstract

1. Introduction

Analysis of the global meteorological observations has shown that during 1951–2003, air temperatures increased all year round, and precipitation indices tended to change to wetter conditions over most landscapes [1]. The Intergovernmental Panel on Climate Change’s Fifth Assessment Report AR5 [2] has pointed to the rising trend in the observed temperatures and marked Central Asia as one of the significant impact zones, with one of the highest average increase in temperatures. Extreme values of air temperature and precipitation, coupled with increasing anthropogenic pressure on natural resources, have dramatically impacted the climate of the whole area of Middle Asia in the second half of the twentieth century. Giese et al. [3] concluded that the warming trend, on average of almost 2–3 °C, has been especially pronounced in the plains and valleys, while less so in mountainous regions for the long-term temperature trends in Middle Asia from 1950 to 2000. Several researchers have pointed out an upward temperature trend in Middle Asia after 1990 [3,4,5]; however, due to a shortage of available observed data, such analysis has been limited in Uzbekistan after the 2000s. This period also corresponds with the most significant changes to Central Asian environmental conditions: maximum expansion of the irrigated agricultural lands and consequential drying up of the Aral Sea. The arid and semi-arid plains of Central Asia are especially vulnerable to warming as one of the primary sources of water is snow/glacier melting over the mountain’s regions. One of the consequences of warming would be impacts on the glaciers, which provides a significant amount of water in the warm half of the year. The total volume of glaciers present in the Tien Shan mountains has already been gradually reduced [6,7] and significantly impacted the water supply in the plains and valleys. According to their scenarios, there would be a shortage of water within a few decades, especially in the small rivers during the dry and hot summer season [8]. Therefore, it is essential to analyze climatic conditions in the current century and anthropogenic impact on climate change in the region.
The regional synoptic weather types (SWT) patterns over Middle Asia and adjacent areas are diverse and have a specific variability in time. The various scale of atmospheric circulation has a crucial impact on the observed extreme of air temperature values and precipitation in different Central Asian landscapes [9,10,11,12,13]. Based on the landscapes’ geographical features, Middle Asia’s territory is divided into the western and eastern parts. The western part (part of Turanian lowlands) is represented by desert and steppe, with elevation not exceeding 100–250 m above sea level. The eastern part is occupied by the Tien Shan and Pamir mountain systems, where individual peaks reach an elevation of more than 7000 m. The Turanian lowlands (the west side of Middle Asia), due to its geographical features, are open to cold invasions from the north and northwest throughout the year, reinforcing continental features of the climate; and from the west, more precisely, west–northwest, to the invasions of moist air from the Atlantic Ocean. The influx of moisture from the Indian Ocean, the closest moisture reservoir, is isolated by the thick wall of the Himalayas, the Hindu Kush, the Pamir, and Tien Shan mountain range from the south and the southeast. Changes in the regional circulation define the primary source of the temperature trend and point to their future impact over the entire territory of Uzbekistan.
The analysis of the large-scale changes in atmospheric circulation for 1956–1980 and 1981–2015 by Wen et al. [14] showed that climate change in Gansu and Northwest China was due to anticyclonic circulation and rapid warming in the Eurasian continent. Taking into account shared climatic and geographical features, it is essential to review changes in the regional atmospheric circulation of Middle Asia to determine the formation of climate and weather from a dynamic point of view that depends on the physical and geographical conditions of the landscape. The complexity of the synoptic processes in Middle Asia and their changes spatially and temporally will have a significant impact on future climate change conditions in the region.
This research aims to analyze climatic variations and trends of the observed temperatures and regional atmospheric circulation to understand the climate change impact on ecosystem function and natural resource sustainability for further focus on water resources available over the territory of Uzbekistan. The regional synoptic processes assessment from 1961–2016 was based on synoptic weather types [15], officially accepted by the Center of Hydrometeorological Service of the Republic of Uzbekistan (UzHydromet).
The objectives of this paper were:
  • to analyze air temperature trends of the current period 1991–2016 compared to the climate normals of the baseline period 1961–1990 and define spatial and temporal changes to the air temperature in Uzbekistan.
  • to assess changes in the regional SWT of Middle Asia over Uzbekistan and analyze climatic variations and trends connected to the atmospheric circulations as one of the main factors of climate change in Uzbekistan.
The rest of this paper is structured as follows. Section 2 describes the study area, data processing, and methodology for analysis; the SWT classification used by the UzHydromet and their description are also included. Results are presented in Section 3 for the air temperature and changes in regional synoptic processes that occurred from 1961 to 2016. Current observed climate change analysis in Uzbekistan is limited in the literature; here, we provide this information to the international community. The discussion and summary are given in Section 4 and Section 5, respectively.

2. Materials and Methods

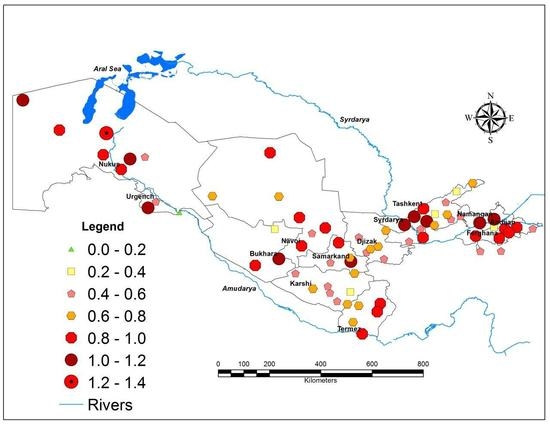
2.1. Study Area and Data Collection

The study area covered the whole territory of Uzbekistan, an area of 448,978 km2 (37°13′–45°36′ N, 56°00′–73°10′ E) located within the Irano-Turannian lowlands of the Central Asian region. Uzbekistan is a double landlocked country that is extremely diverse in physical and geographical conditions. Most of the country is arid and semi-arid plains (80%) that border mountains (20%) from the south, southeast, and east [16].
Uzbekistan is divided into 14 climatic regions by meteorological fluctuations (Figure 1) [17]. The Ustyurt, Northern Kyzylkum, Central Kyzylkum, and Southern Kyzylkum regions are characterized as desert zones. Eight regions—Aralian, Lower Amu Darya, Zeravshan, Southeastern Kyzylkum, Southern Upper Amu Darya, Jizzakh, Tashkent, and Ferghana—comprise oasis zones. The Northern Upper Amu Darya and Western Tien Shan regions are characterized as foothills and mountainous zones. There are 86 meteorological observation stations currently operating in Uzbekistan, and air temperature data from 69 stations were used for this analysis. Station data were collected from 1961 to 2016, except for Oygaing and Termez stations, where observation started in 1963 and 1964, respectively. The most representative meteorological stations located evenly across the territory of the republic for each of the 14 regions were determined and chosen for the analysis. The choice of stations was based on the analysis of the duration, continuity, and homogeneity of the observation series. These were major stations with the longest observation record and showed relatively common climatic conditions to the representative zone.
The daily data from the UzHydromet published handbook “Calendar of Synoptic Weather Types of Middle Asia” [18,19] were used to assess changes in the statistical characteristics of SWT duration in Middle Asia. Statistical characteristics of SWT duration for the baseline climate period were taken from Inogamova et al. [17]. All datasets were manually processed and prepared from the historical catalogs and checked for observation data continuity and homogeneity for the analysis under The World Meteorological Organization (WMO) guidelines.

2.2. Synoptic Weather Types Classification

The regional atmospheric circulation and the SWT classification was first suggested by Giorgio and Bugaev [20]. This classification was further broadened by Bugaev et al. [21] and Sarymsakov et al. [22]. Bugaev, founder of the Middle Asian Tashkent Institute of Weather Forecasters and World Weather Watch under WMO, defined the SWT in Middle Asia into 11 major types in the monograph “Synoptic processes of Middle Asia” [15]. In the early 1960s, Inagamova et al. [23] updated the classification by introducing additional SWT over Middle Asia, increasing them to 15. Nowadays, the following types are considered [24]: 1—South Caspian cyclone, 2—Murgab cyclone, 3—Upper Amu Darya cyclone, 4—Wide outflow of warm air, 5—North-west cold wave invasion, 6—Northern cold wave invasion, 7—Wave activity on the cold front, 8—Slow moving cyclone over Middle Asia, 9—Southwest periphery of anticyclone, 9a—Southeast periphery of anticyclone, 9b—South periphery of anticyclone, 10—Western invasion, 11—Summer thermal depression, 12—Low gradient field of high pressure, 13—Low gradient field of low pressure, 14—Western cyclone, 15—Diving cyclone. Although there are 17 main SWTs, some of them are rare and occur once in several years. The main SWT of Middle Asia is shown in Figure 2 for warm and cold half years; a short description of all processes is given in Appendix A, Table A1.
The basic principle of the classification is the position of the upper-level frontal zones over the Northern Hemisphere, which determines the development of synoptic processes; it is a qualitative conclusion from the hydrodynamic theory of pressure change in the analysis of the synoptic position transformations. It falls into a statistical-stochastic approach to the study of the dynamic climatology of Middle Asia. The inclusion of the orography helps distinguish the representation of the main types of circulation from all their variety as one of the most critical factors that create regional features of synoptic processes in Middle Asia.
Such generalization in the classification of the synoptic processes does not fully represent all complexity of atmospheric flows and details of the synoptic processes development; to a certain extent, it is a simplified scheme. Of course, this highlights the subjectivity of classification, especially in controversial cases with deviations from one type to another that is smothered by simplified classification. On the other hand, Uzbekistan’s orography variation from the east to west, with different climatic zones, makes this process extremely difficult with constant changes in weather types within even climatic zones. Nevertheless, synoptic processes over the territory of Uzbekistan should be considered as a part of much broader atmospheric circulations of Middle Asia, as these bigger scale atmospheric circulations cause the main impact on the temperature and precipitation in the region. We do not address the subjectivity of the synoptic weather type classification in this paper and used official classification for the analysis.
UzHydromet publishes actual SWT in Middle Asia in the daily and monthly catalogs. The catalog includes daily data for 00, 06, 12, and 18 UTC based on analyzing a large amount of aerosynoptic conditions data and input from the meteorological stations and satellite maps. First, analysis of the 500 hPa absolute baric topography map, the macro-synoptic situation over the Eurasian continent is estimated, and the upper-level frontal zone location is determined. At the next stage, a surface synoptic map is analyzed, and the actual location of an atmospheric object (a cyclone and its frontal zone, an anticyclone and its periphery, an atmospheric cold invasion front, etc.) relative to the territory of Central Asia is determined. The identified SWT is then entered into the daily catalog. For each subsequent synoptic period, the procedure is repeated, and the identified SWT is entered into the calendar of synoptic processes. The duration of a specific type of SWT in Central Asia in the operational practice of Uzhydromet is determined as follows. If the process was registered in the calendar in one synoptic period, its duration was 0.25 days, in two periods—0.5 days, in three periods—0.75 days, in four periods—1 day, etc. This method is widely used to describe the actual weather and assess the climate variability in Uzbekistan in relation to the conditions of regional atmospheric circulation [15,23,24,25]. The catalog of SWT in Middle Asia can be used for synoptic, synoptic-statistical, climatological, agrometeorological, hydrological, and other scientific research and development.

2.3. Study Methods

Meteorological data were processed using standard statistical methods recommended by WMO [26]. The nonparametric Mann–Kendall statistical (MK) test is used to identify and evaluate trends in the temperature time series in Uzbekistan as well as the duration of SWT [27,28]. The MK test is widely used in scientific research to analyze trends in long-term meteorological series [9,12,14,29,30,31,32,33]. For this reason, the description of the MK test was not included in the manuscript. In this research, the trend is assumed to be statistically significant if the level of significance is more than 95%.
For the trend analysis, meteorological datasets were divided into two parts, the present period from 1991 to 2016 and the baseline period of 1961–1990. The MK test and climate trend coefficients were applied for both the present and baseline periods, separately, and the entire observed period of 1961–2016. Results were compared to the climate normals of the long-term mean air temperatures for the baseline period (1961–1990) published by UzHydromet [34]. Additionally, data were divided into cold half-year (CH), which included months between November and April, and warm-half year (WH) between May and October, to better understand the annual impact on the synoptic patterns and temperature variations. The month division to warm and cold half-year was based on the thermal criteria given by the Uzhydromet and WMO. This classification is officially approved and used for annual weather catalogs. Decadal, monthly, and annual mean value analysis of all representative stations for temperature and the SWT duration trends were prepared.

3. Results

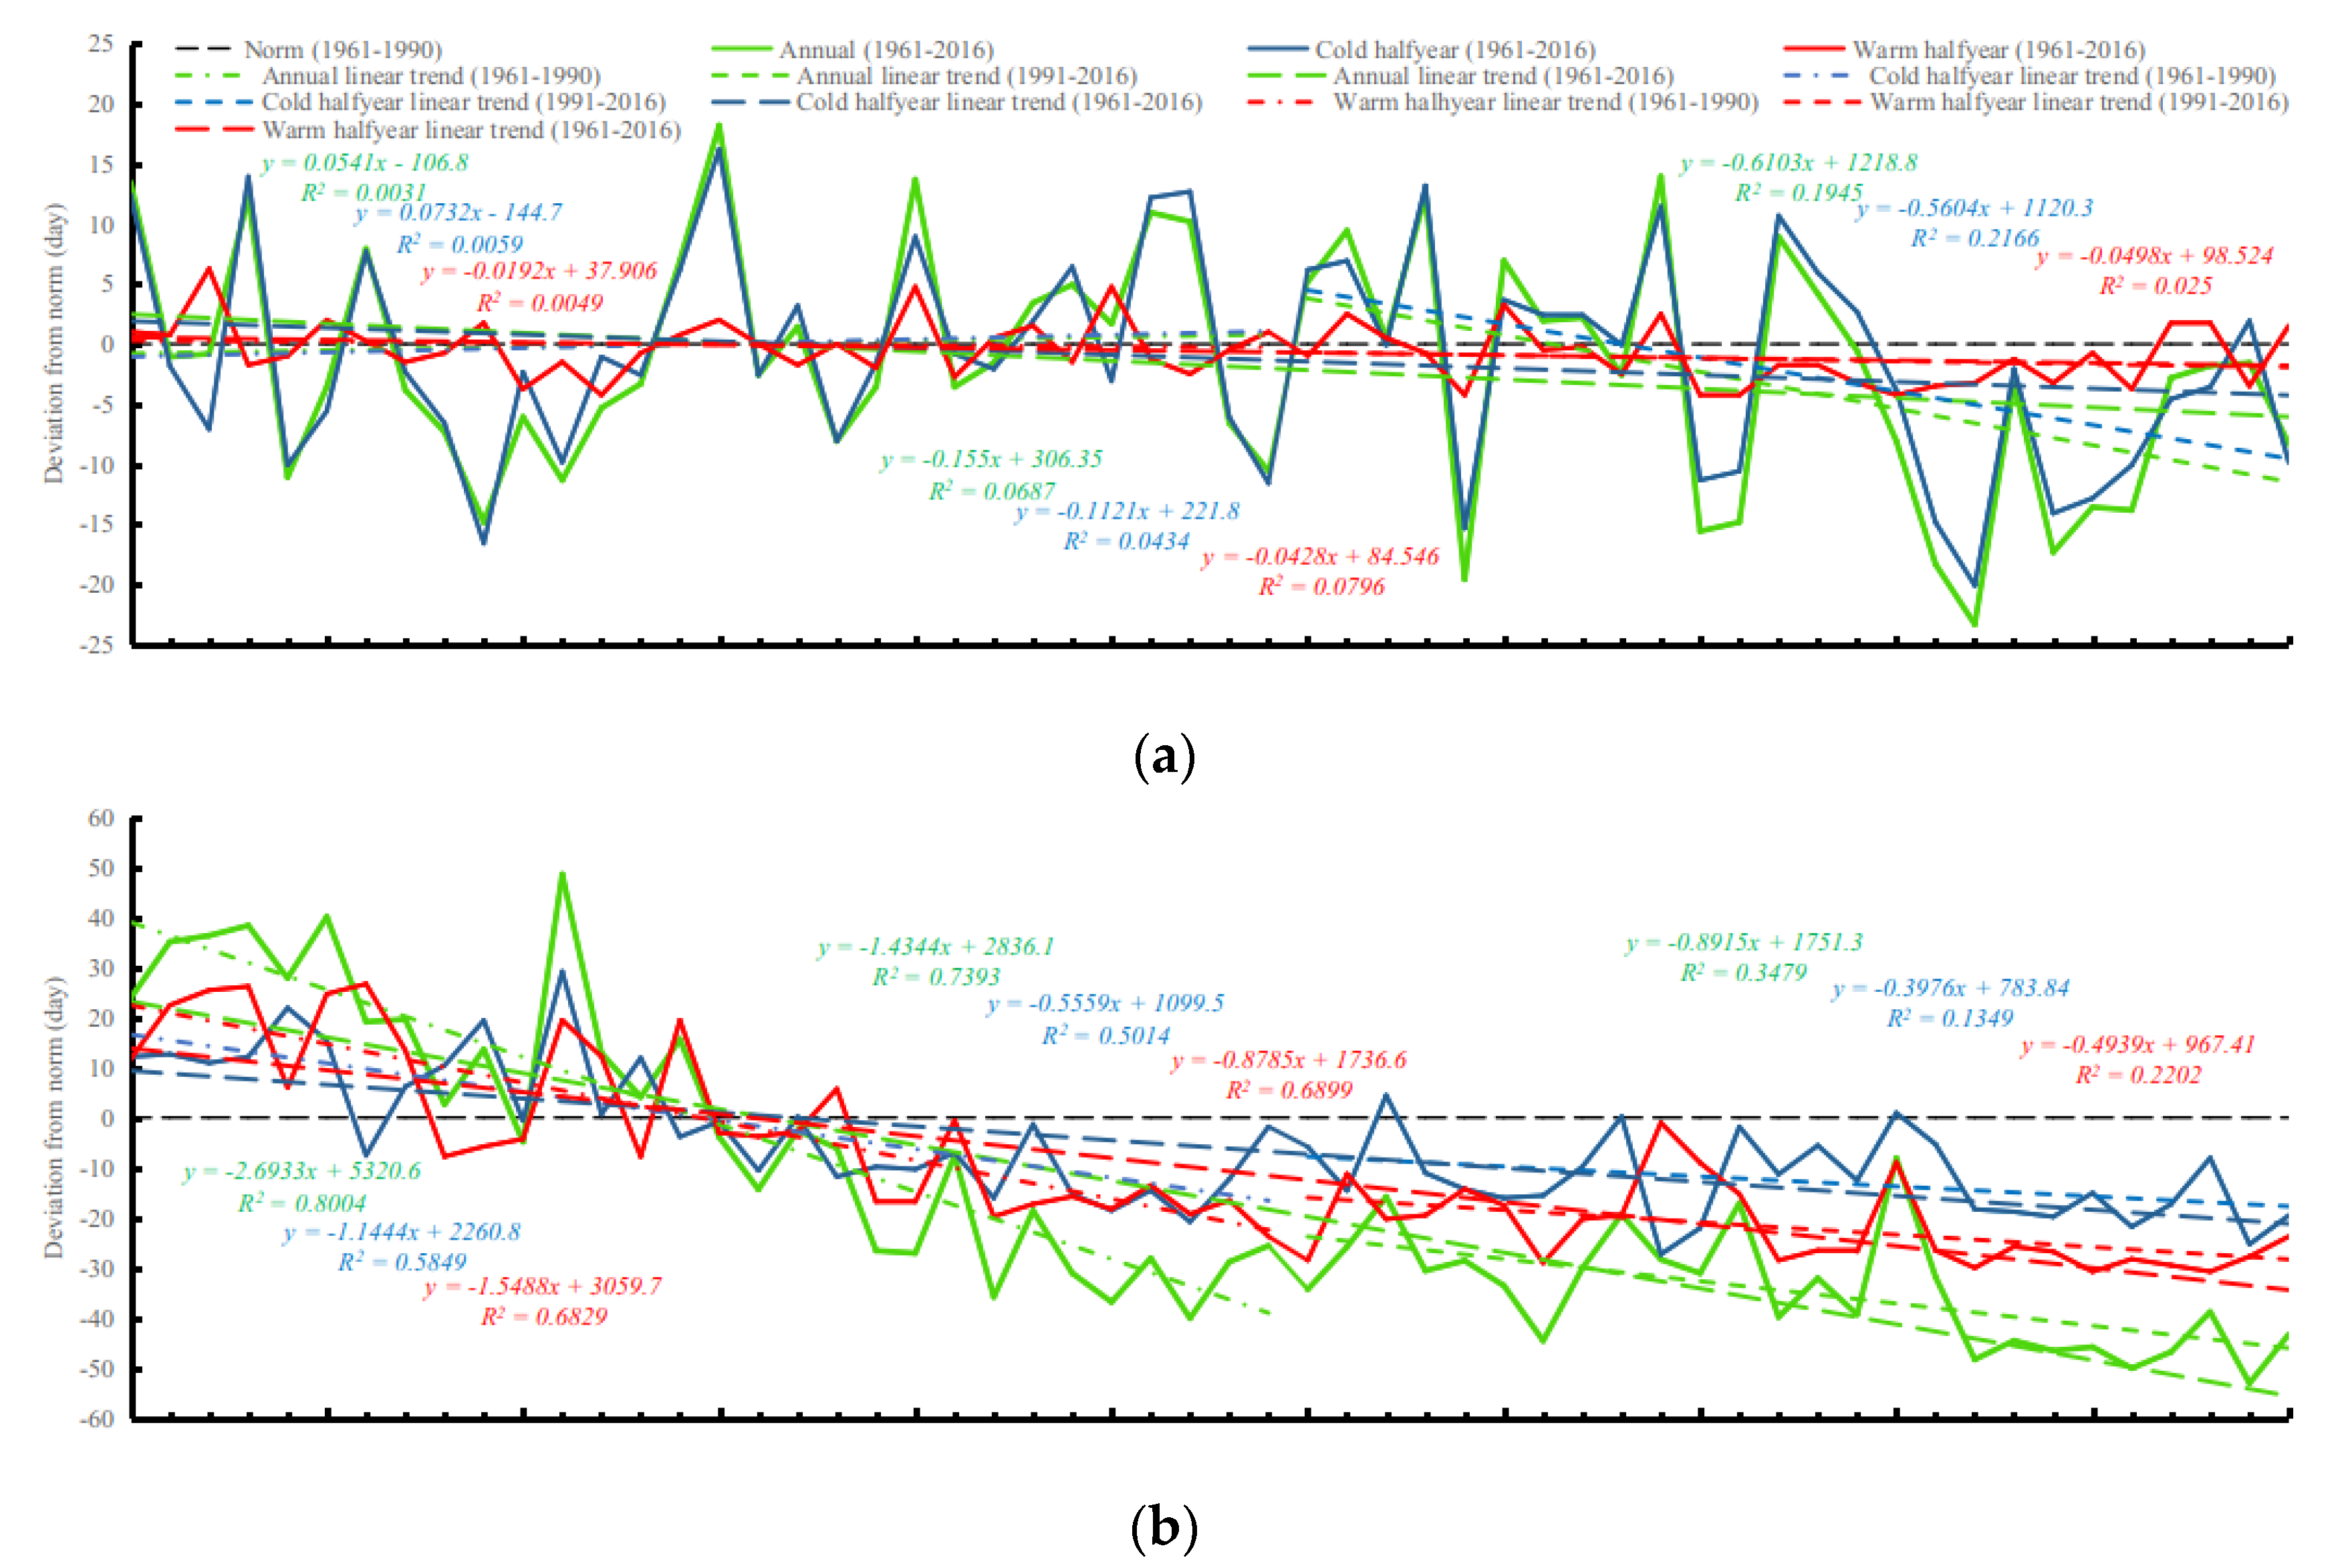
3.1. Air Temperature Trends

The results showed that the air temperature change in Uzbekistan is uneven, both spatially and temporally. Perennial monthly, semi-annual, and annual mean temperature values from 1961–2016 showed warming compared to the baseline period 1961–1990 at the representative stations in all climatic regions of Uzbekistan (Figure 3). Overall, the most significant increase in the long-term mean temperature values (to 1.0 °C and more) was observed in the cold half of the year, mainly in January, February, and March over most of Uzbekistan’s territory. Results show that winter and spring are becoming comparatively warmer on average to 1.3 °C to the baseline period across the entire Uzbekistan territory (Figure 3a). Except for October, with an average increase of 1.12 °C, temperature rise in other months of the autumn season was relatively smaller, on average 0.58 °C. The most significant increase in temperatures for the summer season was observed in June and August at 0.7 °C and 0.94 °C, respectively (Figure 3c).
The extent of temperature variations in all 69 meteorological stations over the territory of Uzbekistan on long-term mean temperatures for the entire observation period (1991–2016) compared to the baseline period (1961–1990) is shown in Figure 4.
The overall warming trend has been observed all over Uzbekistan, especially pronounced in the northwest region (Karakalpakiya, Chimbay), the climatic region closest to the former dry bottom of the Aral Sea. Spatially, the largest annual increase (more than 1.0 °C warming) in the long-term mean air temperature was observed in the northwest zone of Uzbekistan (Karakalpakiya, Ustyurt, Chimbay), and the southern, central, and western oasis zones (Kyzylkum, Termez, Samarkand, Bukhara, Ferghana) (Figure 4c). A moderate increase (0.6 °C) in the long-term mean air temperature was observed in the desert and northeast zone (southeastern Kyzylkum, Djizakh, and the western Tien Shan) (Figure 4a). The cold half-year, as stated above, had the highest added impact to temperature increase, especially in the first three months (January, February, March) of the year (northwest 1.75 °C; desert 1.15 °C; oasis, center 1.36 °C; northeast 1.35 °C; oasis, west 1.56 °C) (Figure 3a). For the cold half-year in the long-term mean air temperature, the largest increase (more than 1.0 °C) was observed in the northwest regions (Karakalpakiya, Chimbay), and the oasis in the central and west part (southeastern part of the Kyzylkum desert, the western part of the Tashkent region and in the Ferghana Valley) (Figure 3b). The lowest increase values (0.4–0.6 °C) were observed in the desert (Central Kyzylkum) and mountainous regions (Western Tien Shan and Northern Upper Amu Darya climatic regions). For the warm half-year, the largest temperature increase (more than 1.0 °C) was observed in the northwest (the Aral Sea) and oasis zones (the middle zone of the Southeastern Kyzylkum, the western part of the Southern Upper Amu Darya, the western part of the Tashkent region and the northern and southern foothills of the Fergana Valley) (Figure 3c), with the absolute maximum of the observed long-term mean temperature in the Aral Sea area. Desert and mountainous zones (the Central Kyzylkum, the Southeastern Kyzylkum, Djizakh, and the Western Tien Shan regions) observed the lowest temperature increase in summer. The absolute highest increase in warm half-year temperature values was observed in the months of August, September, and October, while the hottest months were usually July and August. The regions close to the Aral Sea and oasis zones showed a significant increase in temperature in both cold half-year and warm half-year (Figure 3a,b and Figure 4c; Table A2), compared to the less populated zones in the desert and mountainous areas.
The interannual temperature change and linear trends for the baseline (1961–1990) and present periods (1991–2016) for 14 representative stations were prepared. Figure 5 shows graphs of the interannual temperature changes at the representative desert, oasis, and mountain meteorological stations. It is evident that the warming process that began in the baseline climate period continues today, and in some cases have a much steeper increasing trend. It is necessary to point out that the linear trends of all stations intersect climate normals of the baseline period (1961–1990) in the mid-1970s of the twentieth century and continue to increase.
Trend temperature increments for the baseline, present, and entire observed periods, including decadal mean, are calculated based on the obtained linear regression equations (Figure 5). The nonparametric statistical MK test showed that the temperature change within the baseline period did not have a high level of significance throughout the territory of Uzbekistan. In contrast, the air temperature trends in the present 1991–2016 period had a level of significance of more than 95% at the following stations: in oasis zones 1.15 °C (Samarkand 1.34 °C, Termez 1.03 °C, and Ferghana 1.10 °C); and in the northeast 1.26 °C (Tashkent 1.35 °C, Oygaing 1.17 °C). The same was true for the entire observed period of 1961–2016; temperature trends at Karakalpakiya, Chimbay, Samarkand, Bukhara, Termez, Tashkent, Oygaing, and Fergana had a high level of significance of more than 95%. The decadal temperature trends in the baseline period ranged from the lowest 0.20 °C/decade in Ayakagitma to the highest 0.42 °C/decade in Bukhara. For the present period (1991–2016), the decadal temperature trend varied from the lowest 0.25 °C/decade in Urgench to 0.52 °C/decade in Samarkand and Tashkent (Figure 6). However, Bukhara station showed a slightly decreasing rate in the decadal temperature trend, while Termez station, the most southern part of Uzbekistan, remained unchanged.

3.2. Changes in the Regional Atmospheric Circulation of Middle Asia

The trends in regional atmospheric circulation across the Middle Asia climatic zone were analyzed to define interannual changes in the SWT duration. Durations of the SWT identify a course of change to a long-term climate. Analysis of these processes could, therefore, represent the circulating causes of climate change in Uzbekistan. The mean long-term duration of SWT for the cold and warm six months and the whole year represents the climate formation dynamics in Middle Asia.
In the cold half-year of the baseline period (1961–1990), anticyclonic group processes (types 9, 9a, 9b) dominated for 64.8 days (35.8%) on a long-term mean. Cold invasions (types 5, 6, 10) were observed over 43.7 days (24.1%) on average. They were followed by southern cyclones (types 1, 2, 3) 26.9 days (14.8%) on average. Low-gradient fields of high and low pressure (types 12, 13) had a total duration of 16.5 days during this period, which amounted to 9.1% of the cold half-year. Wave activity on the cold front (type 7) and slow-moving cyclone (type 8) had a total duration of 12.7 days (7.0%) and 9.8 days (5.4%), respectively. The remaining SWT (4, 11, 14, 15) lasted less than four days. A comparison of changes in the SWT duration between climate normals of the baseline period (1961–1990) and the present period 1991–2016 is shown in Figure 7.
In the warm half-year of the baseline period (1961–1991), cyclonic activity duration decreased to 3.9 days or 2.1%. The cold invasions became more protracted and mostly occurred in the summer; they were observed in 37.9% of the warm six months. The second most occurring types were low-gradient baric fields (28.5%), followed by anticyclones (22.4%) (Table 1).
Slight changes to the cold invasion’s duration were observed in the cold half-year of the present period (1991–2016) (Figure 7). However, the total anticyclonic activity duration did not change much (61.0 days and 33.6%). Variations to the total duration of southern cyclones were also small. On the other hand, the total duration of cold invasions decreased significantly, on average, up to the eight days compared to the baseline period or 35.5 days (19.6%). A decisive role was played by the shortening of northwestern and northern invasion; their total duration was halved. Another significant change was observed in the increased duration (almost three-fold) of low-gradient baric fields; the total duration has increased to 42.9 days (23.7%) from the baseline period of 16.5 days.
In the warm half-year of the present climate period (1991–2016), the main changes occurred in the structure of cold invasions and low-gradient baric fields. The total duration of cold invasions in the warm half-year decreased to 40.6 days (22.1%), and the low-gradient fields of high and low pressure increased almost twice to 91.7 days or 49.8%. Thus, the latter became the predominant type of SWT in the warm half-year of the present climatic period (1991–2016). As a result of these changes, the major shift in the total duration of the processes to the whole year occurred from cold invasions (113.4 days in the baseline period, 76.1 days in the present) toward low-gradient fields of high and low pressure (68.8 and 134.6 days, respectively).
Note that the above duration characteristics of the SWT in Middle Asia were averaged over a long time and do not represent their time dynamics. One of the methods to analyze the total duration of SWT is checking their interannual changes. The interannual changes of the total duration of SWT in Middle Asia are shown in Figure 8, where there was a deviation of the present and entire observed period from the climate normals of the baseline climate period (1961–1990). This technique was applied to assess changes in the total duration of SWT. Since the durations of SWT 3, 4, 8, 11, 14, and 15 types were insignificant, no trend changes were evaluated for them.
In order to assess changes to the total duration of the group of southern cyclones types 1, 2, and 3, trends of their cumulative total duration of the baseline (1961–1990) and present climatic periods (1991–2016) were calculated (Figure 8a). There was a small variation in trends in the baseline period, but in the present period, all cumulative total duration trends tended to decrease to negative values with a low level of significance (Table 2). Although the cumulative total duration of the group of southern cyclones in the present period remained below the average of the baseline period, a steady increase was seen over the past few years. It was associated with changes in the duration of the South Caspian cyclone.
The northwestern and northern cold invasions (types 5 and 6) and the closely related wave activity on the cold front (type 7) in the baseline (1961–1990) and present climatic periods (1991–2016) show that the cumulative total duration of these types of SWT tended to steadily decrease from the very beginning of the baseline period (Figure 8b). The mid-1970s of the last century was a tipping point (i.e., the annual total duration of these processes became less than the mean of the baseline climate period). The decrease in the total duration of this group’s processes in the warm and cold half-year was approximately the same. These changes showed a very high level of significance (95% for the cold half-year, 99% for the warm half-year and the whole year) (Table 2). There was a decreasing tendency in the cumulative total duration of these SWTs in the present period. However, the rate of decline is slowing. In general, for the entire study period of 1961–2016, change trends had a very high level of significance (99.9%) due to the rather sharp decrease in the duration of wave activity on the cold front (type 7).
The interannual change in the group’s total duration consisting of anticyclones (types 9, 9a, and 9b) showed increasing trends with a low level of significance for the baseline period (Figure 8c, Table 2). In the present period, this has changed to the opposite direction. The interannual course of the cumulative total duration of the group of anticyclones for the whole period 1961–2016 tended to be smaller with a low level of significance. The western invasion (type 10) decreased for both half-years in the baseline period (1961–1990) (Figure 8d) with a low level of significance (Table 2). In the present period (1991–2016), it decreased in the warm half-year and in general over the year. However, in the cold half-year, it increased and has been above the climate normals of the baseline period (1961–1990) over the past two decades, with a low level of significance.
The most significant changes were in the total duration of low-gradient fields of high (type 12) and low (type 13) pressure (Figure 8e, Table 2). The cumulative duration of this group’s processes shows a steady increase in the total duration of type 12 in the warm and type 13 in the cold half-year. The tipping point again happened in the mid-1970s of the twentieth century, when it passed the baseline climate period’s mean value. The level of significance of these changes was within 99% in the baseline 1961–1990 and present 1991–2016 periods. The cumulative total duration of this group of processes for the entire period of observation (1961–2016), both in half-year and in the whole year, showed significant growth trends (the level of significance was 99.9%).
In the present period (1991–2016), the overall duration of groups of synoptic processes such as southern cyclones and anticyclones did not change relative to the climate normals of the baseline period of 1961–1990. Groups associated with cold air invasions tended to decrease slightly but were stable within the limits of the climate normals of the baseline period 1961–1990. In general, the duration of the western invasion tended to decrease significantly over the year. However, in the cold half-year, it steadily increased. Finally, there was also a significant increase in the duration of low-gradient fields of high and low pressure in both the warm and cold half-year.

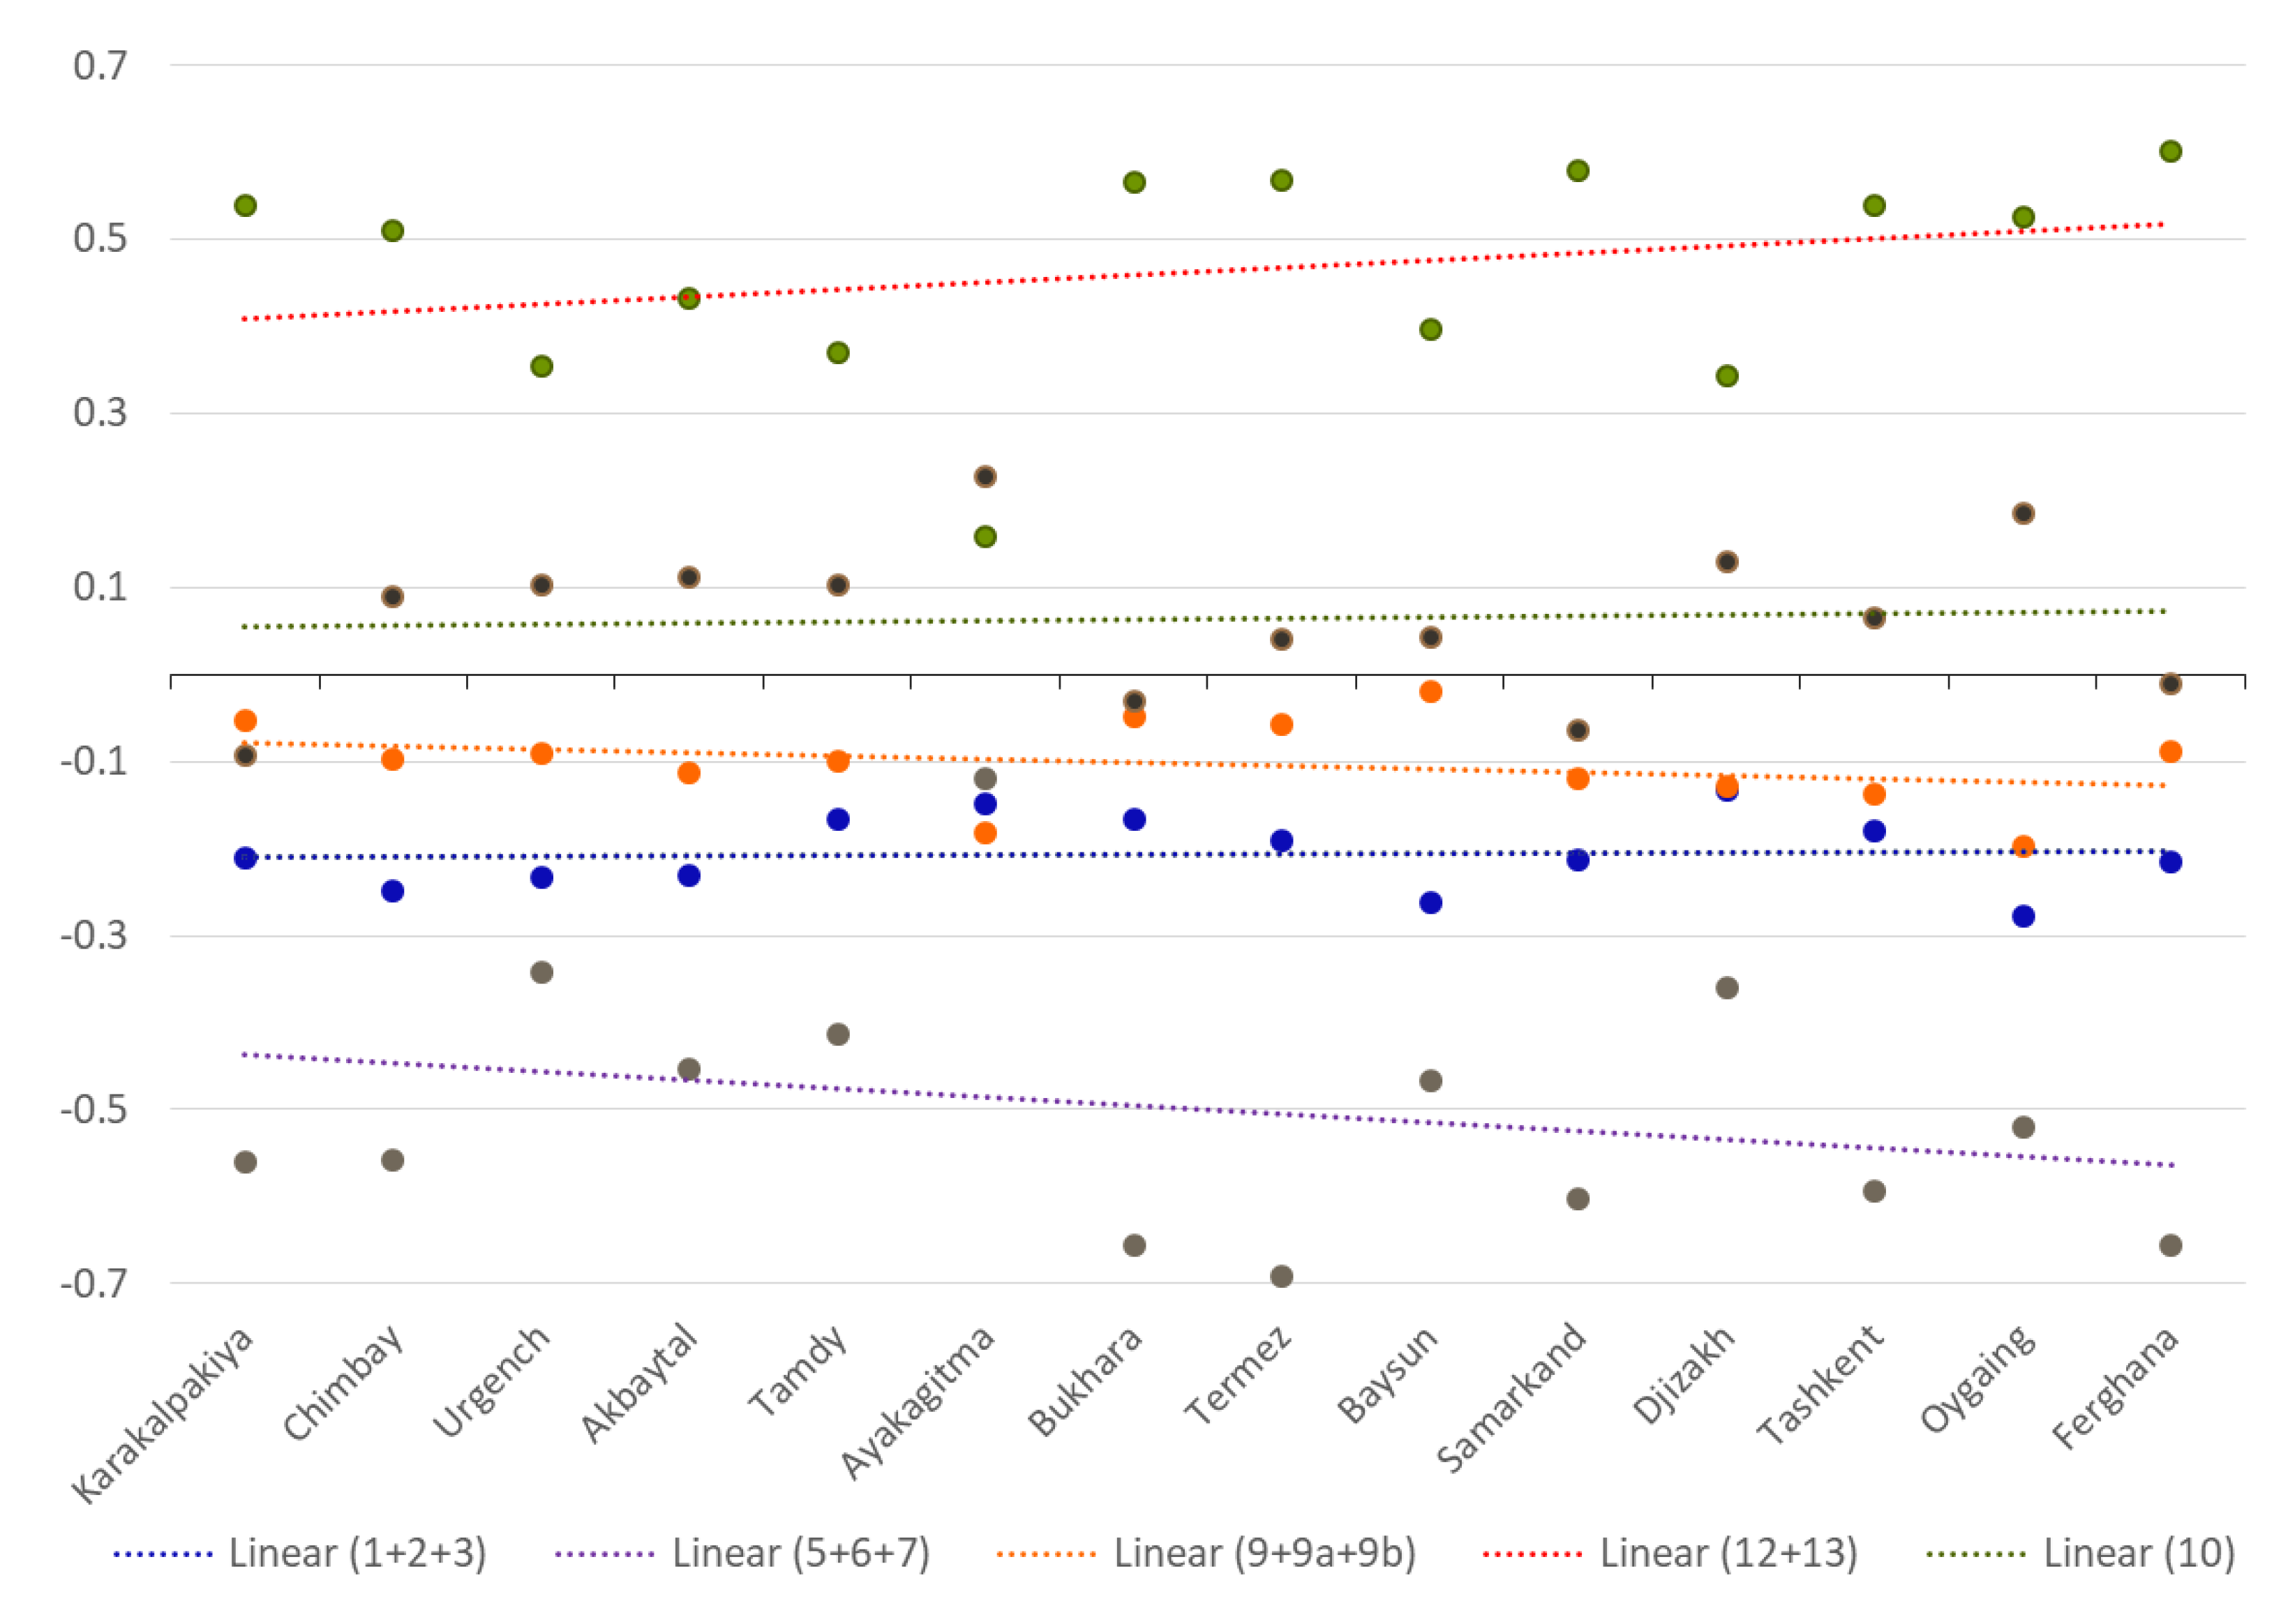
3.3. Correlation Analysis of the Air Temperature and SWT

The Pearson correlation coefficient (PCC) was used to analyze the air temperature and SWT duration correlation. The PCC is commonly used to measure the linear correlation between two sets of variables, in this case, the relationship of the distribution of the mean annual air temperature and SWT durations over Uzbekistan territory. PCC is a linear correlation value and shows a positive or negative linear correlation between −1 and +1.
Mean annual year temperature values over 1961–2016 were compared to the SWTs total durations during the year shown in the Figure 9. Advection of the cold airflows from the north and northwest in SWT (5, 6, 7) showsa negative correlation (PCC from −0.34 to −0.69) and positive correlation for the anticyclonic group (SWT 12,13) (PCC from 0.34 to 0.60). Interestingly, SWT 10, from the same group of advection of the cold airflows from the north and northwest, and anticyclonic group for 9, 9a, 9b SWT showed no correlation with almost the same duration during the year with SWT 5, 6, 7. The same was true for the group of cyclones from south SWT 1, 2, 3, which also showed no correlation.
The duration of the northwestern (type 5) and northern (type 6) invasions, and the wave activity on the cold front (type 7) were at their possible minimum values in the present period 1991–2016, relative to the baseline period of 1961–1990. From the circulation point of view, reduction in the North Atlantic (type 5), Arctic (type 6), and the cold front of the SWT 7 durations over the year caused a decrease in masses of cold air moving into Middle Asia. In turn, the SWT 12 and 13 duration increased with the formation of a low-gradient baric field with slightly cloudy weather (Figure 7). The air mass over the region rapidly transformed in response to the radiation factor, and the surface heat day-by-day directly affected air temperature near the surface.

4. Discussion

This research showed that the most significant temperature changes, exceeding 1.0 °C relative to the baseline climatic period, occurred over Uzbekistan in the cold half-year, mainly in January, February, March, and October. Warming trends were especially pronounced in the northwest part and almost all oasis zones over Uzbekistan, showing added anthropogenic impact compared to trends of the less-populated desert and mountainous zones. Trends in the mean annual temperature in Tashkent were 1.35 °C, 1.34 °C in Samarkand, 1.17 °C in Oygaing, 1.10 °C in Fergana, and 1.03 °C in Termez throughout 1991–2016, with a significance level of more than 95%. For the entire study period of 1961–2016, the temperature change at the Karakalpakiya, Chimbay, Samarkand, Bukhara, Termez, Tashkent, Oygaing, and Fergana stations had a high level of significance (more than 95%). The rate of warming in Uzbekistan shows high spatial variability; warming rates were greater in the present climate (1991–2016) than in the baseline period (1961–1990) and varied from 0.25 °C/decade in Urgench to 0.52 °C/decade in Samarkand and Tashkent. These values exceeded the trends of the global average surface temperature increase (0.21 °C/decade) including different regions of China (from 0.05 °C/decade to 0.49 °C/decade, and average in China 0.27 °C/decade) [14,29,30,35]. Ayakagitma, a station in the desert zone, showed a negative decadal trend for −0.20 °C/decade, which is due to the station’s location in the Ayakagitma depression zone, a relatively low area surrounded by high land. The values of the Oygaing station located in the glacial zone tended to have high trends compared to neighboring mountain zones. In typical glacial zones of China—Altai, Tien Shan, Kilian, western and eastern Kunlun, Tanggul, and the Himalayas—the mean annual air temperature over the past 58 years (1960–2017) has tended to increase at a rate of 0.38 °C/decade, 0.31 °C/decade, 0.33 °C/decade, 0.26 °C/decade, 0.37 °C/decade, 0.63 °C/decade, and 0.47 °C/decade, respectively [36].
Large-scale changes in atmospheric circulation analysis by Wen et al. [14] showed that climate change in Gansu and Northwest China is associated with increased anticyclonic circulation and rapid warming on the Eurasian continent. The regional circulation of the atmosphere over Middle Asia is an integral part of the general circulation of the Northern Hemisphere and is changing under the influence of global climate warming in the Northern Hemisphere. The major shift in the total annual duration of the SWT occurred from the interchange of cold invasions to low-gradient fields of high and low pressure, while durations of the remaining SWT groups were unchanged. Trends in the group of cold invasions (types 5, 6, and 7) and low-gradient baric fields (types 12 and 13) had a very high significance level (99.9%) over the entire period (1961–2016) in both warm and cold half-years. A combined analysis of the structure of SWT of Middle Asia and the temperature regime showed that the leading cause of climate warming in Uzbekistan is connected to anthropogenic and circulation factors. The air temperature increase in the baseline period was associated with a reduction in the duration of the northwestern and northern invasion and a significant increase in the low-gradient fields of high- and low-pressure durations. The low-gradient baric fields continued the warming trend in the present climatic period, and the northwestern and northern invasions are at the minimum duration value of the baseline period 1961-1990. These circumstances point to the possible contribution of the warm half-year to the warming trend in subsequent periods in Uzbekistan.
Drying up of the Aral Sea and consequently created saline desert could have probably influenced the circulation process. Uzbekistan’s northern region (Ustyurt, Chimbay) has observed the largest increase in temperature both for the warm and cold half-year. Decrease in the northern (northern, northwestern) cold invasions have reduced the number of cold days, and possibly precipitation in the region. These processes accelerate the increase of days with extreme temperatures and reduce the natural vegetation cover that will negatively affect the desert ecosystems.
Although significant changes have been found in the northern part of Uzbekistan, it should be noted that this region has an insufficient density of meteorological observations to identify spatial features of climate change, especially the Ustyurt and the Northern Kyzylkum. These areas are remote and less populated, and according to Holmes et al. [37], this could alter outcomes of analysis as the same condition is seen in western China (deserts and plains). A denser observation network could provide additional data for analysis of the temperature regime changes in relation to the circulation conditions in the Central Asian region, which is undoubtedly of great importance in preventing and mitigating the adverse effects of climate change on the sustainable use and management of natural resources, especially water availability in the region.

5. Conclusions

Characteristics of interannual changes in air temperature in Uzbekistan, as well as the duration of SWT in Middle Asia, was analyzed using the nonparametric statistical MK test and the coefficients of climatic trends to identify changing rate. All regions showed an increase in the mean long-term monthly air temperature relative to the baseline period. Changes in air temperature in Uzbekistan had high spatio-temporal variability; a portion of the cold half-year in annual mean air temperature increase was more significant than that of the warm half-year. Climate warming is characterized by increasing air temperature on average to 1 °C in both warm and cold half-years over Uzbekistan for the period of 1991–2016. Decadal temperature changes in the present climatic period have increased relative to the baseline period and range from 0.22 °C/decade in the desert zone to 0.52 °C/decade in oasis zones.
The major shift in the duration of SWT in Middle Asia relative to the baseline period occurred from cold invasions, which have decreased to a total of 37.3 days toward low-gradient fields of high and low pressure, which increased to a total of 65.8 days. The trend in the total duration of cold invasions (types 5, 6, and 7) in the present period 1961–1990 had a very high level of significance (95% for a cold half-year and 99% for the warm half-year and whole year). However, the decreasing trend of cold invasions duration slowed down in the present (1991–2016). The level of significance in changes of low-gradient baric fields was within 99% in the baseline (1961–1990) and present period (1991–2016) and reached its maximum value of 99.9% in the whole observed period (1961–2016).
The geographical distribution of air temperature deviations was mosaic and mesoscale and is due to the peculiarities of the physical and geographical conditions of the climatic regions of Uzbekistan (relief, hydrography, soil type, etc.). Even within a relatively uniform landscape, climatic changes are quite complicated, both in time and meteorological values. The process of modern warming, which began in Uzbekistan in the 1960s of the twentieth century, intensified from the mid-1970s with higher values than the climate normals of the baseline period (1961–1990) and is associated with changes in regional SWT over Middle Asia. The anthropogenic impact on the temperature increase in Uzbekistan needs to be studied, as it has been shown that the oasis areas showed the highest increment in air temperature increase compared to less populated areas.

Author Contributions

Conceptualization, methodology, validation, analysis, writing, visualization, B.M.K.; Analysis, writing, supervision, Y.V.P.; Analysis, writing, visualization, T.K.; Supervision, K.T.; Data collection, analysis, N.N.S. and F.I.A. All authors have read and agreed to the published version of the manuscript.

Funding

This research was funded by the UNDP Program for preparing Uzbekistan to access the resources of the Green Climate Fund (GCF) (00096908).

Acknowledgments

The authors are grateful to the anonymous reviewers and the corresponding editor for their helpful and constructive comments and suggestions for improving the manuscript.

Conflicts of Interest

The authors declare no conflict of interest.

Appendix A

Table A1. Synoptic weather type classification by the UzHydromet. Source: Bugaev, Inogamova et al. [15,16,17].
GroupCodeTypeDescription
Cyclones from the south and southwest1South Caspian cycloneDevelops in the south of the Caspian Sea, a well-formed baric system with heavy precipitation in mountainous areas, winds in a desert area, and rising temperatures in winter.
2Murgab cycloneDevelops over Turkmenistan in Murgab and Tedgen basins, mild and wet cyclone with strong winds, heavy precipitation, thunderstorms in spring
3Upper Amu Darya cycloneDevelops over Afghanistan and Tajikistan, very slow and mostly over a high mountainous area, with warm airflow, strong winds in the mountainous regions
4Wide outflow of warm airWarm air from the southern regions of the European territory of the Russian Federation, Western Kazakhstan, and Middle Asia, with southwestern and southern flows in the troposphere. This air can be either tropical or temperate air, with warm air and dry conditions.
Advection of cold airflow from the north and northwest5Northwest cold wave invasionThe Arctic or temperate air masses from the north-west through the southeastern part of Russia’s European territory, Western Kazakhstan and Usturt, cause a sharp change in weather. Mainly cold with precipitation and strong winds in winter. Frosts in autumn and spring, cold weather with precipitation over the mountainous area
6Northern cold wave invasionThe Arctic or middle-latitudes air from the north through the Urals, Western Siberia, and Kazakhstan. With severe cold weather and almost no precipitation in winter. Rainfalls in mountainous areas in summer.
7Wave activity on the cold frontA quasi-stationary front of the invasion of a cold air mass from the Middle East. A series of cyclonic waves develop over Turkmenistan and the north-east of Middle Asia, with unstable temperatures and wet conditions.
8Slow moving cyclone over Middle AsiaThis cyclone usually covers the entire troposphere with its circulation, the center is in the north of Central Asia, but its formation in other regions is not excluded. Cool in summer with rainfall in mountainous areas, cold temperatures in winter.
10Western invasionThe middle-latitudes air, less arctic air, from the west, coming through the Caucasus ridges and the Caspian Sea, with cool temperatures, strong winds, and rainfalls in summer and winter.
15Diving cycloneDevelop over the northern seas (Norwegian Sea, Barents, Kara) and move from north to south. Cold weather with precipitation and strong windsAnticyclonic weather.
Anticyclonic
weather
9Southwest periphery of anticycloneThe periphery of the Siberian high anticyclone. Usually clear and dry weather and low winds.
9aSoutheast periphery of anticycloneThe stationary anticyclonic process above the Usturt plateau, the Lower Volga region, or Western Kazakhstan. Cold and clear weather in winter, cool in summer.
9bSouth periphery of anticyclonePart of Siberian high anticyclone covering the eastern regions of Russia’s European territory, the Volga region, Western Kazakhstan. Mostly cold and dry conditions with cool and clear conditions in summer.
11Summer thermal depressionEmerge from the southeast of Middle Asia, a frontless low-pressure area with a well-pronounced cyclonic circulation in the lower troposphere. Clear, dry, hot, and hazy weather on plains.
12Low gradient field of high pressureAn area of high pressure uniting the Siberian anticyclone with the anticyclone over the European territory of Russia. Cold, dry, and clear weather with light winds.
13Low gradient field of low pressureThe low-pressure area with meridional orientation over Central Asia. Dry and warm weather conditions with low rainfall. Local heavy rainfall in summer due to convective clouds.
Mid-latitude
cyclone
14Western cycloneStrong winds, precipitations in mountainous areas.
Table A2. Long-term mean air temperature (°C) at the representative stations of Uzbekistan for the present period (1991–2016) compared to the baseline climatic period (1961–1990) by month. CH—Cold Half-Year (November–April), WH—Warm Half-Year (May–October).
StationsIIIIIIIVVVIVIIVIIIIXXXIXIICHWHAnnual
Karakalpakiya1.32.52.31.30.71.90.51.50.62.0−0.4−0.61.11.21.2
Chimbay0.82.12.41.61.11.30.51.30.71.40.0−0.11.11.11.1
Urgench1.11.41.70.60.10.2−0.50.40.10.8−0.2−0.10.70.20.5
Akbaytal1.01.71.70.80.70.8−0.11.10.71.50.00.00.90.80.8
Tamdi1.21.41.50.70.50.6−0.10.90.61.20.0−0.20.80.60.7
Samarkand1.61.71.30.80.90.90.81.41.41.40.80.31.11.11.1
Ayakagitma0.70.50.70.00.10.4−0.30.50.20.5−0.2−0.20.30.20.2
Bukhara1.51.41.40.70.71.10.61.61.41.50.60.31.01.21.1
Termez1.51.20.90.70.71.00.81.21.51.20.60.10.81.10.9
Baysun1.01.31.20.60.30.00.00.51.00.90.40.20.80.50.6
Djizakh1.61.71.10.20.30.30.00.60.40.70.50.30.90.40.6
Tashkent1.51.51.40.40.60.50.31.01.01.00.50.10.90.70.8
Oygaing1.11.21.40.30.70.50.00.00.60.61.50.21.00.40.7
Ferghana1.61.71.40.30.30.40.61.21.31.10.90.61.10.81.0
Table A3. Characteristics of mean annual temperature change at the representative stations in Uzbekistan.
StationPeriodTemperature TrendStationPeriodTemperature Trend
ΔT, °CΔT/Decade
Karakalpakiya1961–19901.010.34 Bukhara1961–19901.250.42
1991–20161.330.51 1991–20160.960.37
1961–20162.32 *0.41 1961–20162.11 *0.38
Chimbay1961–19900.920.31 Termez1964–19901.200.40
1991–20161.090.42 1991–20161.03 *0.40
1961–20162.01 *0.36 1964–20161.88 *0.34
Urgench1961–19900.480.16 Baysun1961–19900.590.20
1991–20160.650.25 1991–20161.250.48
1961–20160.950.17 1961–20161.290.23
Akbaytal1961–19900.460.15 Djizakh1961–19900.110.04
1991–20160.830.32 1991–20160.700.27
1961–20161.620.29 1961–20161.180.21
Tamdi1961–19900.210.07 Tashkent1961–19900.760.25
1991–20160.900.34 1991–20161.35 *0.52
1961–20161.250.22 1961–20161.81*0.32
Samarkand1961–19900.650.22 Oygaing1963–19900.320.11
1991–20161.34 *0.52 1991–20161.17 *0.45
1961–20162.03 *0.36 1963–20161.39 *0.25
Ayakagitma1961–1990−0.59−0.20 Ferghana1961–19900.940.31
1991–20160.980.38 1991–20161.10 *0.42
1961–20160.500.09 1961–20161.91 *0.34
* Significance level more than 95% (p < 0.05).
Table A4. Mean long-term duration of synoptic weather types (number of days) over Middle Asia.
PeriodSynoptic Weather TypesΣ
1234567899a9b101112131415
Cold half-year1961–199014.710.51.73.614.14.112.79.844.32.817.725.50.010.65.93.10.1181.2
1991–201613.210.51.40.27.11.69.35.440.03.217.826.80.029.413.51.80.0181.3
Warm half-year1961–19902.71.10.10.720.211.52.98.818.95.616.838.04.019.832.60.30.0184.0
1991–20161.90.90.20.48.52.61.55.015.37.916.329.51.830.461.30.60.0184.0
Annual1961–199017.411.61.84.334.315.615.618.663.28.434.563.54.030.438.53.40.1365.2
1991–201615.111.41.60.615.64.210.810.455.311.134.156.31.859.874.82.40.0365.3

References

  1. Alexander, L.V.; Zhang, X.; Peterson, T.C. Global observed changes in daily climate extremes of temperature and precipitation. J. Geophys. Res. 2006, 111, D05109. [Google Scholar] [CrossRef] [Green Version]
  2. IPCC (The Intergovernmental Panel on Climate Change). Climate Change 2014: Synthesis Report. Contribution of Working Groups I, II and III to the Fifth Assessment Report of the Intergovernmental Panel on Climate Change; IPCC: Geneva, Switzerland, 2014; p. 151. [Google Scholar]
  3. Giese, E.; Mossig, I.; Rybski, D.; Bunde, A. Long-term analysis of air temperature trends in Central Asia. Erdkunde 2007, 61, 186–202. [Google Scholar] [CrossRef]
  4. Aizen, V.B.; Aizen, E.M.; Melack, J.M.; Dozier, J. Climate and hydrologic changes in the Tien Shan, Central Asia. J. Clim. 1997, 10, 1393–1404. [Google Scholar] [CrossRef]
  5. Bolch, T. Climate Change and GlacieHr Retreat in Northern Tien Shan (Kazakhstan/Kyrgyzstan) Using Remote Sensing Data. Glob. Planet. Chang. 2006, 56, 1–12. [Google Scholar] [CrossRef]
  6. Farinotti, D.; Longuevergne, L.; Moholdt, G.; Duethmann, D.; Mölg, T.; Bolch, T.; Vorogushyn, S.; Güntner, A. Substantial Glacier Mass Loss in the Tien Shan over the Past 50 Years. Nat. Geosci. 2015, 8, 716–722. [Google Scholar] [CrossRef]
  7. Annina, S.; Bolch, T.; Stoffel, M.; Solomina, O.; Beniston, M. Climate Change Impacts on Glaciers and Runoff in Tien Shan (Central Asia). Nature Climate Change. Nat. Clim. Chang. 2012, 2, 725–731. [Google Scholar]
  8. Chen, Y.; Li, W.; Deng, H.; Fang, G.; Li, Z. Changes in Central Asia’s Water Tower: Past, Present and Future. Sci. Rep. 2016, 6, 35458. [Google Scholar] [CrossRef]
  9. Chen, Y.; Deng, H.; Li, B.; Li, Z.; Xu, C. Abrupt change of temperature and precipitation extremes in the arid region of Northwest China. Quat. Int. 2014, 336, 35–43. [Google Scholar] [CrossRef]
  10. Aizen, E.M.; Aizen, V.B.; Melack, J.M.; Nakamura, T.; Ohta, T. Precipitation and atmospheric circulation patterns at mid-latitudes of Asia. Int. J. Climatol. 2001, 21, 535–556. [Google Scholar] [CrossRef]
  11. Liu, Y.; Chen, S.; Sun, H.; Gu, D.; Xue, J.; Lei, J.; Zeng, X.; Lv, G. Does the long-term precipitation variations and dry-wet conditions exist in the arid areas? A case study from China. Quat. Int. 2019, 519, 3–9. [Google Scholar] [CrossRef]
  12. Shao, Y.; Mu, X.; He, Y.; Sun, W.; Zhao, G.; Gao, P. Spatiotemporal variations of extreme precipitation events at multi-time scales in the Qinling-Daba mountains region, China. Quat. Int. 2019, 525, 89–102. [Google Scholar] [CrossRef]
  13. Petrov, Y.; Kholmatjanov, B.M.; Asatov, A.P. Current Warming in Middle Asia and Atmospheric Circulation Change Development. Curr. J. Appl. Sci. Technol. 2015, 12, 1–7. [Google Scholar] [CrossRef]
  14. Wen, X.; Wu, X.; Gao, M. Spatiotemporal variability of temperature and precipitation in Gansu Province (Northwest China) during 1951–2015. Atmos. Res. 2017, 197, 132–149. [Google Scholar] [CrossRef]
  15. Bugaev, V.A.; Gorgio, V.A.; Kozik, E.M.; Petrosyanc, M.A.; Pshenichniy, A.Y.; Romanov, N.N.; Chernysheva, O.A. Synoptic Processes of Middle Asia; Academy of Sciences of UzSSR: Tashkent, Uzbekistan, 1957; p. 477. (In Russian) [Google Scholar]
  16. Babushkin, L.N.; Kogay, N.A. Physico-geographical zoning of the Uzbek SSR. In Proceedings of Tashkent State University; TashSU Press: Tashkent, Uzbekistan, 1964; Volume 231, pp. 5–247. (In Russian) [Google Scholar]
  17. Spektorman, T.Y.; Nikulina, S.P. Climate monitoring, climate change assessment on the territory of the Republic of Uzbekistan. Information on the execution by Uzbekistan of its obligations under the UN Framework Convention on Climate Change. Bulletin 2002, 5, 486. (In Russian) [Google Scholar]
  18. Inagamova, S.I. Calendar of Synoptic Weather Types of Middle Asia; NIGMI: Tashkent, Uzbekistan, 1993; Volume 3, p. 56. (In Russian) [Google Scholar]
  19. Inagamova, S.I. Calendar of Synoptic Weather Types of Middle Asia; NIGMI: Tashkent, Uzbekistan, 2013; Volume 4, p. 66. (In Russian) [Google Scholar]
  20. Giorgio, V.A.; Bugayev, V.A. Classification of the atmospheric circulation in Middle Asia. Meteorol. Hydrol. 1936, 6, 72–74. (In Russian) [Google Scholar]
  21. Bugayev, V.A. Climate in Middle Asia and Kazakhstan; Academy of Science of the Uzbek SSR: Tashkent, Uzbekistan, 1946; p. 24. (In Russian) [Google Scholar]
  22. Sarimsakov, T.A.; Giorgio, V.A.; Bugayev, V.A. Statistical characteristics of synoptic situations for the cold period over the Middle Asia. Newsl. USSR Acad. Sci. 1947, 6, 451–464. (In Russian) [Google Scholar]
  23. Inagamova, S.I.; Voynova, T.A.; Kazaryans, E.S. Short-Term Weather Forecast Guide; Part II. Vol. 3. Middle Asia; Hydrometeoizdat: Leningrad, Russia, 1986; p. 322. (In Russian) [Google Scholar]
  24. Inagamova, S.I.; Mukhtarov, T.M.; Mukhtarov, S.T. Features of Synoptic Processes of Middle Asia; SANIGMI: Tashkent, Uzbekistan, 2002; p. 486. (In Russian) [Google Scholar]
  25. Mamadjanova, G.; Wild, S.; Walz, M.A.; Leckebusch, G.C. The Role of Synoptic Processes in Mudflow Formation in the Piedmont Areas of Uzbekistan. Nat. Hazards Earth Syst. Sci. 2018, 18, 2893–2919. [Google Scholar] [CrossRef] [Green Version]
  26. WMO (World Meteorological Organization). Guidelines on the Calculation of Climate Normals (WMO/TD-No. 1203); WMO: Geneva, Switzerland, 2017. [Google Scholar]
  27. Mann, H.B. Nonparametric tests against trend. Econometrica 1945, 13, 124–259. [Google Scholar] [CrossRef]
  28. Kendall, M.G. Rank Correlation Methods; Griffin: London, UK, 1975. [Google Scholar]
  29. Yang, H.; Yang, D.; Hu, Q.; Lv, H. Spatial variability of the trends in climatic variables across China during 1961–2010. Theor. Appl. Climatol. 2014, 120, 773–783. [Google Scholar] [CrossRef]
  30. Tian, Q.; Yang, S. Regional climatic response to global warming: Trends in temperature and precipitation in the Yellow, Yangtze and Pearl River basins since the 1950s. Quat. Int. 2016, 440, 1–11. [Google Scholar] [CrossRef]
  31. Yao, J.; Yang, Q.; Mao, W.; Zhao, Y.; Xu, X. Precipitation trend—elevation relationship in arid regions of the China. Glob. Planet. Chang. 2016, 143, 1–9. [Google Scholar] [CrossRef]
  32. Zhang, M.; Chen, Y.; Shen, Y.; Li, Y. Changes of precipitation extremes in arid Central Asia. Quat. Int. 2017, 436, 16–27. [Google Scholar] [CrossRef]
  33. Kholmatjanov, B.M.; Petrov, Y.V.; Jaloliddinov, B.M. Trends and Variability of Air Temperature and Precipitation from 1961 to 2016 in the Kyzylkum Desert. Eur. Sci. Rev. 2018, 9–10, 91–96. [Google Scholar] [CrossRef]
  34. Belorussova, G.O. Long-Term Average Values of Weather Elements at Stations of the Republic of Uzbekistan; NIGMI: Tashkent, Uzbekistan, 2003; p. 17. (In Russian) [Google Scholar]
  35. Li, Z.; Chen, Y.; Li, W.; Deng, H.; Fang, G. Potential impacts of climate change on vegetation dynamics in Central Asia. J. Geophys. Res. Atmos. 2015, 120, 12345–12356. [Google Scholar] [CrossRef]
  36. Liu, Y.; Wang, N.; Zhang, J.; Wang, L. Climate change and its impacts on mountain glaciers during 1960–2017 in western China. J. Arid Land 2019, 11, 537–550. [Google Scholar] [CrossRef] [Green Version]
  37. Holmes, J.A.; Cook, E.R.; Yang, B. Climate change over the past 2000 years in Western China. Quat. Int. 2009, 194, 91–107. [Google Scholar] [CrossRef]
Figure 1. Climatic regions of Uzbekistan and the distribution of meteorological observation stations.
Climate 08 00101 g001
Figure 2. The regional synoptic weather types (SWT) of Middle Asia in (a) cold and (b) warm half-years. The width of the circulation type is based on occurrence frequency during the year. Adapted from Inogamova et al. [23,24].
Climate 08 00101 g002
Figure 3. Long-term mean air temperature (°C) increment compared to the baseline period over representative stations (see Appendix A: Table A2). Monthly long-term mean air temperatures for (a) the cold half-year; (b) the warm half-year; (c) annual, cold and warm averages.
Climate 08 00101 g003aClimate 08 00101 g003b
Figure 4. Average long-term air temperature variations in Uzbekistan for the 1991–2016 period compared to the baseline 1961–1990 period (in °C). (a) Annual, (b) cold half-year, (c) warm half-year.
Climate 08 00101 g004aClimate 08 00101 g004b
Figure 5. Interannual temperature change at the desert (a,b), oasis (ce), and mountain (f) meteorological stations. (a) Karakalpakia; (b) Tamdi; (c) Tashkent; (d) Termez, (e) Ferghana, (f) Oygaing.
Climate 08 00101 g005aClimate 08 00101 g005b
Figure 6. Characteristics of the mean annual temperature change trend at the representative stations in Uzbekistan to the baseline period. * Significance level of 95% for 1991–2016, ** Significance level of 95% for 1961–2016. (see Appendix A: Table A3).
Climate 08 00101 g006
Figure 7. The difference in SWT duration over Middle Asia (see Appendix A: Table A4) between the baseline (1961–1990) and present (1991–2016) periods.
Climate 08 00101 g007
Figure 8. Deviation from the climate normals of the baseline period 1961–1990 of the total cumulative duration of SWT 1, 2, 3 (a), 5, 6, 7 (b), 9, 9a, 9b (c), 10 (d), 12, 13 (e).
Climate 08 00101 g008aClimate 08 00101 g008b
Figure 9. Pearson correlation of the main SWT and the mean air temperature for 1961–2016.
Climate 08 00101 g009
Table 1. Classification of SWT over Middle Asia during the warm and cold half-year in the percentage of days over 1961–1990 years.
NameTypeCold Half-Year in % (November–April)Warm Half-Year in % (May–October)
South Caspian 18.111.47
Murgab cyclone25.790.60
Upper Amu Darya30.940.05
The wide outflow of warm air41.990.38
Northwestern cold wave57.7810.98
Northern cold wave62.266.25
Wave activity on the cold front77.011.58
Slow-moving cyclone85.414.78
Southwestern924.4510.27
Southeastern9a1.553.04
Southern9b9.779.13
Western invasion1014.0720.65
Summer thermal depression110.002.17
Low gradient field of high pressure125.8510.76
Low gradient field of low pressure133.2617.72
Western cyclone141.710.16
Diving cyclone150.060.00
Table 2. Characteristics of trends in the total duration of groups of SWT in Middle Asia.
TypeGroupSeasonTrend Increment, ΔN (Day)
1961–1990 1991–2016 1961–2016
1 + 2 + 3ICold half-year2.1−14.0−6.2
Warm half-year−0.6−1.2−2.4
Annual1.6−15.3−8.5
5 + 6 + 7IICold half-year−33.2 *−9.9−30.6 ***
Warm half-year−44.9 **−12.3−48.3 ***
Annual−78.1 **−22.3−78.9 ***
9 + 9a + 9bIIICold half-year18.7−26.7−6.8
Warm half-year7.6−18.3−4.6
Annual26.2−44.9−11.5
10IVCold half-year−9.811.42.1
Warm half-year−5.9−18.6 *−17.7
Annual−15.7−7.2−15.5
12 + 13VCold half-year27.5 **48.4 *57.4 ***
Warm half-year52.6 **66.0**86.4 ***
Annual80.1 **109.9**144.0 ***
* Significance level greater than 95% (p < 0.05), ** Significance level of changes greater than 99% (p < 0.01), *** Significance level greater than 99.9% (p < 0.001).

