Article

Synoptic Climatology of Lake-Effect Snow Events off the Western Great Lakes

Department of Geosciences, Mississippi State University, 75 B. S. Hood Road, Starkville, MS 39762, USA
*
Author to whom correspondence should be addressed.
Climate 2021, 9(3), 43; https://doi.org/10.3390/cli9030043
Submission received: 18 February 2021 / Revised: 4 March 2021 / Accepted: 4 March 2021 / Published: 5 March 2021
(This article belongs to the Special Issue Extreme Weather Events)

Abstract

:
As the mesoscale dynamics of lake-effect snow (LES) are becoming better understood, recent and ongoing research is beginning to focus on the large-scale environments conducive to LES. Synoptic-scale composites are constructed for Lake Michigan and Lake Superior LES events by employing an LES case repository for these regions within the U.S. North American Regional Reanalysis (NARR) data for each LES event were used to construct synoptic maps of dominant LES patterns for each lake. These maps were formulated using a previously implemented composite technique that blends principal component analysis with a k-means cluster analysis. A sample case from each resulting cluster was also selected and simulated using the Advanced Weather Research and Forecast model to obtain an example mesoscale depiction of the LES environment. The study revealed four synoptic setups for Lake Michigan and three for Lake Superior whose primary differences were discrepancies in a surface pressure dipole structure previously linked with Great Lakes LES. These subtle synoptic-scale differences suggested that while overall LES impacts were driven more by the mesoscale conditions for these lakes, synoptic-scale conditions still provided important insight into the character of LES forcing mechanisms, primarily the steering flow and air–lake thermodynamics.

1. Introduction

The North American Great Lakes have multiple effects on the weather and climate of the neighboring landscape [1,2,3,4,5]. Climatologically, the lakes act as a modulator of annual temperature due to their enormous heat capacity that ultimately results in warmer winters and cooler summers. During the North American cool season, synoptic-scale conditions often interact with air masses modified by the lakes to create bands of lake effect snow (LES) near the shorelines of each lake. Previous work [6] offered the first comprehensive examination on the atmospheric conditions conducive to LES formation and included characteristics such as: (1) presence of a strong polar air mass over lake surface, (2) large thermal and moisture contrast between the lake surface and the atmosphere, and (3) large area of open fetch. On the extreme side, the destabilization of continental polar air masses traversing over the lakes via massive vertical heat and moisture fluxes result in severe lake-effect snow (LES) storms that produces copious amounts of winter precipitation downwind of the lakes [7,8,9,10]. This area downwind of the lakes affected by LES is known as the ‘snow belt’ region as annual snowfall maps reveal that these elongated areas receive substantially higher snowfall compared to areas more inland, with up to 50% of their annual snowfall coming from LES (Figure 1). The unique shape of these snow belts is a consequence of the elongation of snow bands that tend to form during LES events.
The mesoscale and local dynamics of LES have been studied thoroughly and are generally well understood, though new field experiments such as the Ontario Winter Lake- effect Systems (OWLeS) field campaign are providing additional insight on the influence of secondary LES factors such as land breeze circulations, frictional convergence, orographic uplift [11,12,13,14,15,16,17].
LES is primarily driven by instability resulting from vertical thermal gradients between the lake and atmosphere, which frequently results in the production of convective available potential energy (CAPE) [18]. Two measures that have been frequently used as proxies for quantifying this instability in the context of LES: the surface-850 mb temperature difference and the presence/strength of a low-level capping inversion [8,9,13,19,20,21]. An empirically based minimum threshold for the surface-850 mb temperature difference of 13 °C has been used to establish a minimum instability threshold for lake-effect convection. The near-surface vertical wind profile (below the capping inversion) also plays a key role in LES formation as it determines snow band morphology and dictates the amount of lake surface (fetch) air parcels will interact with as they traverse the lake, and thus the amount of heat and moisture air parcels acquire [22,23,24]. Several different types of snow bands have been observed with LES activity including long-lake axis parallel (LLAP), broad coverage, shoreline parallel, and mesovorticies [8,9]. Moderate wind speeds in this low-level flow regime (10–20 m s−1) have been shown to be the most conducive to LES formation as speeds that are too fast result in disorganized convection due to directional shear and speeds that are too slow limit turbulent mixing between the atmosphere and lake [10].
The essential local and mesoscale ingredients for LES formation are well-known (described above), but the synoptic-scale conditions conducive to LES remains a topic of continuing research. Past studies have identified a broad large-scale pattern that, in some form, is present during most LES events off the Great Lakes. This pattern consists of a mean sea level pressure structure featuring an eastward cyclone and westward anticyclone (i.e., dipole) and an upper-level low pressure system located close to the Hudson Bay (Figure 2). The evolution of this broad scale pattern is unique as conditions typically associated with this setup are clear and calm. Initially, a cold front linked with a mid-latitude cyclone (typically an Alberta Clipper [25]) travels over the Great Lakes, which results in a decrease in surface air temperatures and pressure rises. These pressure rises bring in west-northwesterly flow that support LES formation. Differences in position and strength of this dipole structure are largely responsible for different snow band morphologies [3,26,27]. Importantly, the ideal set up for maximum LES clearly is sensitive to the given lake orientation. For example, the synoptic scale environment
Conducive to LES formation off Lake Erie will consist of a dipole structure that is oriented parallel to Lake Erie such that a cyclone exists northeast of the lake with an anticyclone to the southwest [27]. However, the same structure over Lake Michigan would result in a broad coverage band event which has a larger coverage area but is less impactful snowfall amounts due to less fetch [9]. Additionally, cold air advection (CAA) and differential anticyclonic vorticity advection (DAVA) occur as continental polar air masses (high pressure systems) travel from the west-southwest into the Great Lakes basin and can suppress LES convection. Previous studies have shown [9,28] that shortwaves within this large-scale flow can overcome these obstacles and enhance LES convection in some cases.
As LES in the Lake Erie and Ontario region tends to be the most impactful for large population centers in the United States, LES is often studied off these lakes and many previous studies have developed synoptic climatologies for the conditions preceding LES in this basin [3,26,27,29]. The work in [3,27] employed statistical analysis techniques such as principal component analysis (PCA) and average linkage cluster analysis (CA) on observational and reanalysis data for the cold season (November–March) to establish a synoptic climatology for these lakes. In [27] an updated climatology was presented by constructing a k-means CA using a repository of past LES cases over Lakes Erie and Ontario and further linked the synoptic and mesoscale conditions via numerical simulations. Finally, [29] constructed a composite analysis from 29 LES cases over the southern Ontario region (the area most impacted from LES off of Lake Huron). They found that an upper-level low pressure system over the Hudson Bay and associated strong northwesterly flow supported LES in the Lake Erie/Ontario impact region.
LES off the western Great Lakes has received considerably less attention from the research community and differs significantly from the eastern Great Lakes in terms of LES morphology and impacts due to differences in geographical and physical characteristics. The southern shore of Lake Superior is among the snowiest regions in the United States, largely a result of LES. With an average depth of 149 m and a water surface area of 82,097 km2, Lake Superior seldom has large ice concentrations as annual peak ice cover rarely exceeds 50% [30]. Combined with the lake’s enormous breadth (257 km) and extended periods of north-northwesterly flow, this creates a conducive environment for broad coverage snow band formation. Lake Superior is also 563 km long and oriented zonally, which when combined with westerly flow results in persistent LLAP band formation and substantial annual snowfall over southern Ontario, Canada.
The other western Great Lake that has been infrequently assessed for LES impacts, Lake Michigan, differs notably from the other Great Lakes in terms of size, orientation, and depth, which results in different LES morphologies and impacts. On average, Lake Michigan is 60 m shallower than Lake Superior (89 m), which should result in higher average annual ice cover. However, Lake Michigan’s orientation and latitude allow warmer air masses to heat the lake during the winter months, limiting ice growth. Additionally, the meridional orientation has a negative impact on LES severity owing to the prevailing midlatitude westerly flow over Lake Michigan’s short axis (190 km), such that LES events off this lake typically have broad coverage and relatively low snowfall totals. Despite all of these advances, no study has specifically addressed the precursors to LES in the western Great Lakes region (Lake Michigan and Superior). These lakes have unique geographic attributes which imply unique synoptic scale conditions will be necessary for LES off these lakes. In this study, we will use past LES cases off Lake Michigan and Superior to identify synoptic-scale structures most conducive for LES in the western Great Lakes. These synoptic patterns will then be linked with associated mesoscale conditions via numerical weather prediction model simulations (as in [27]). Section 2 describes the datasets and methodology employed to establish the synoptic climatology, while Section 3 presents the results and analysis from the synoptic composites and numerical simulations. Section 4 features a discussion about the possible links between the synoptic-scale and mesoscale characteristics for each composite as well as conclusions.

2. Materials and Methods

2.1. Data

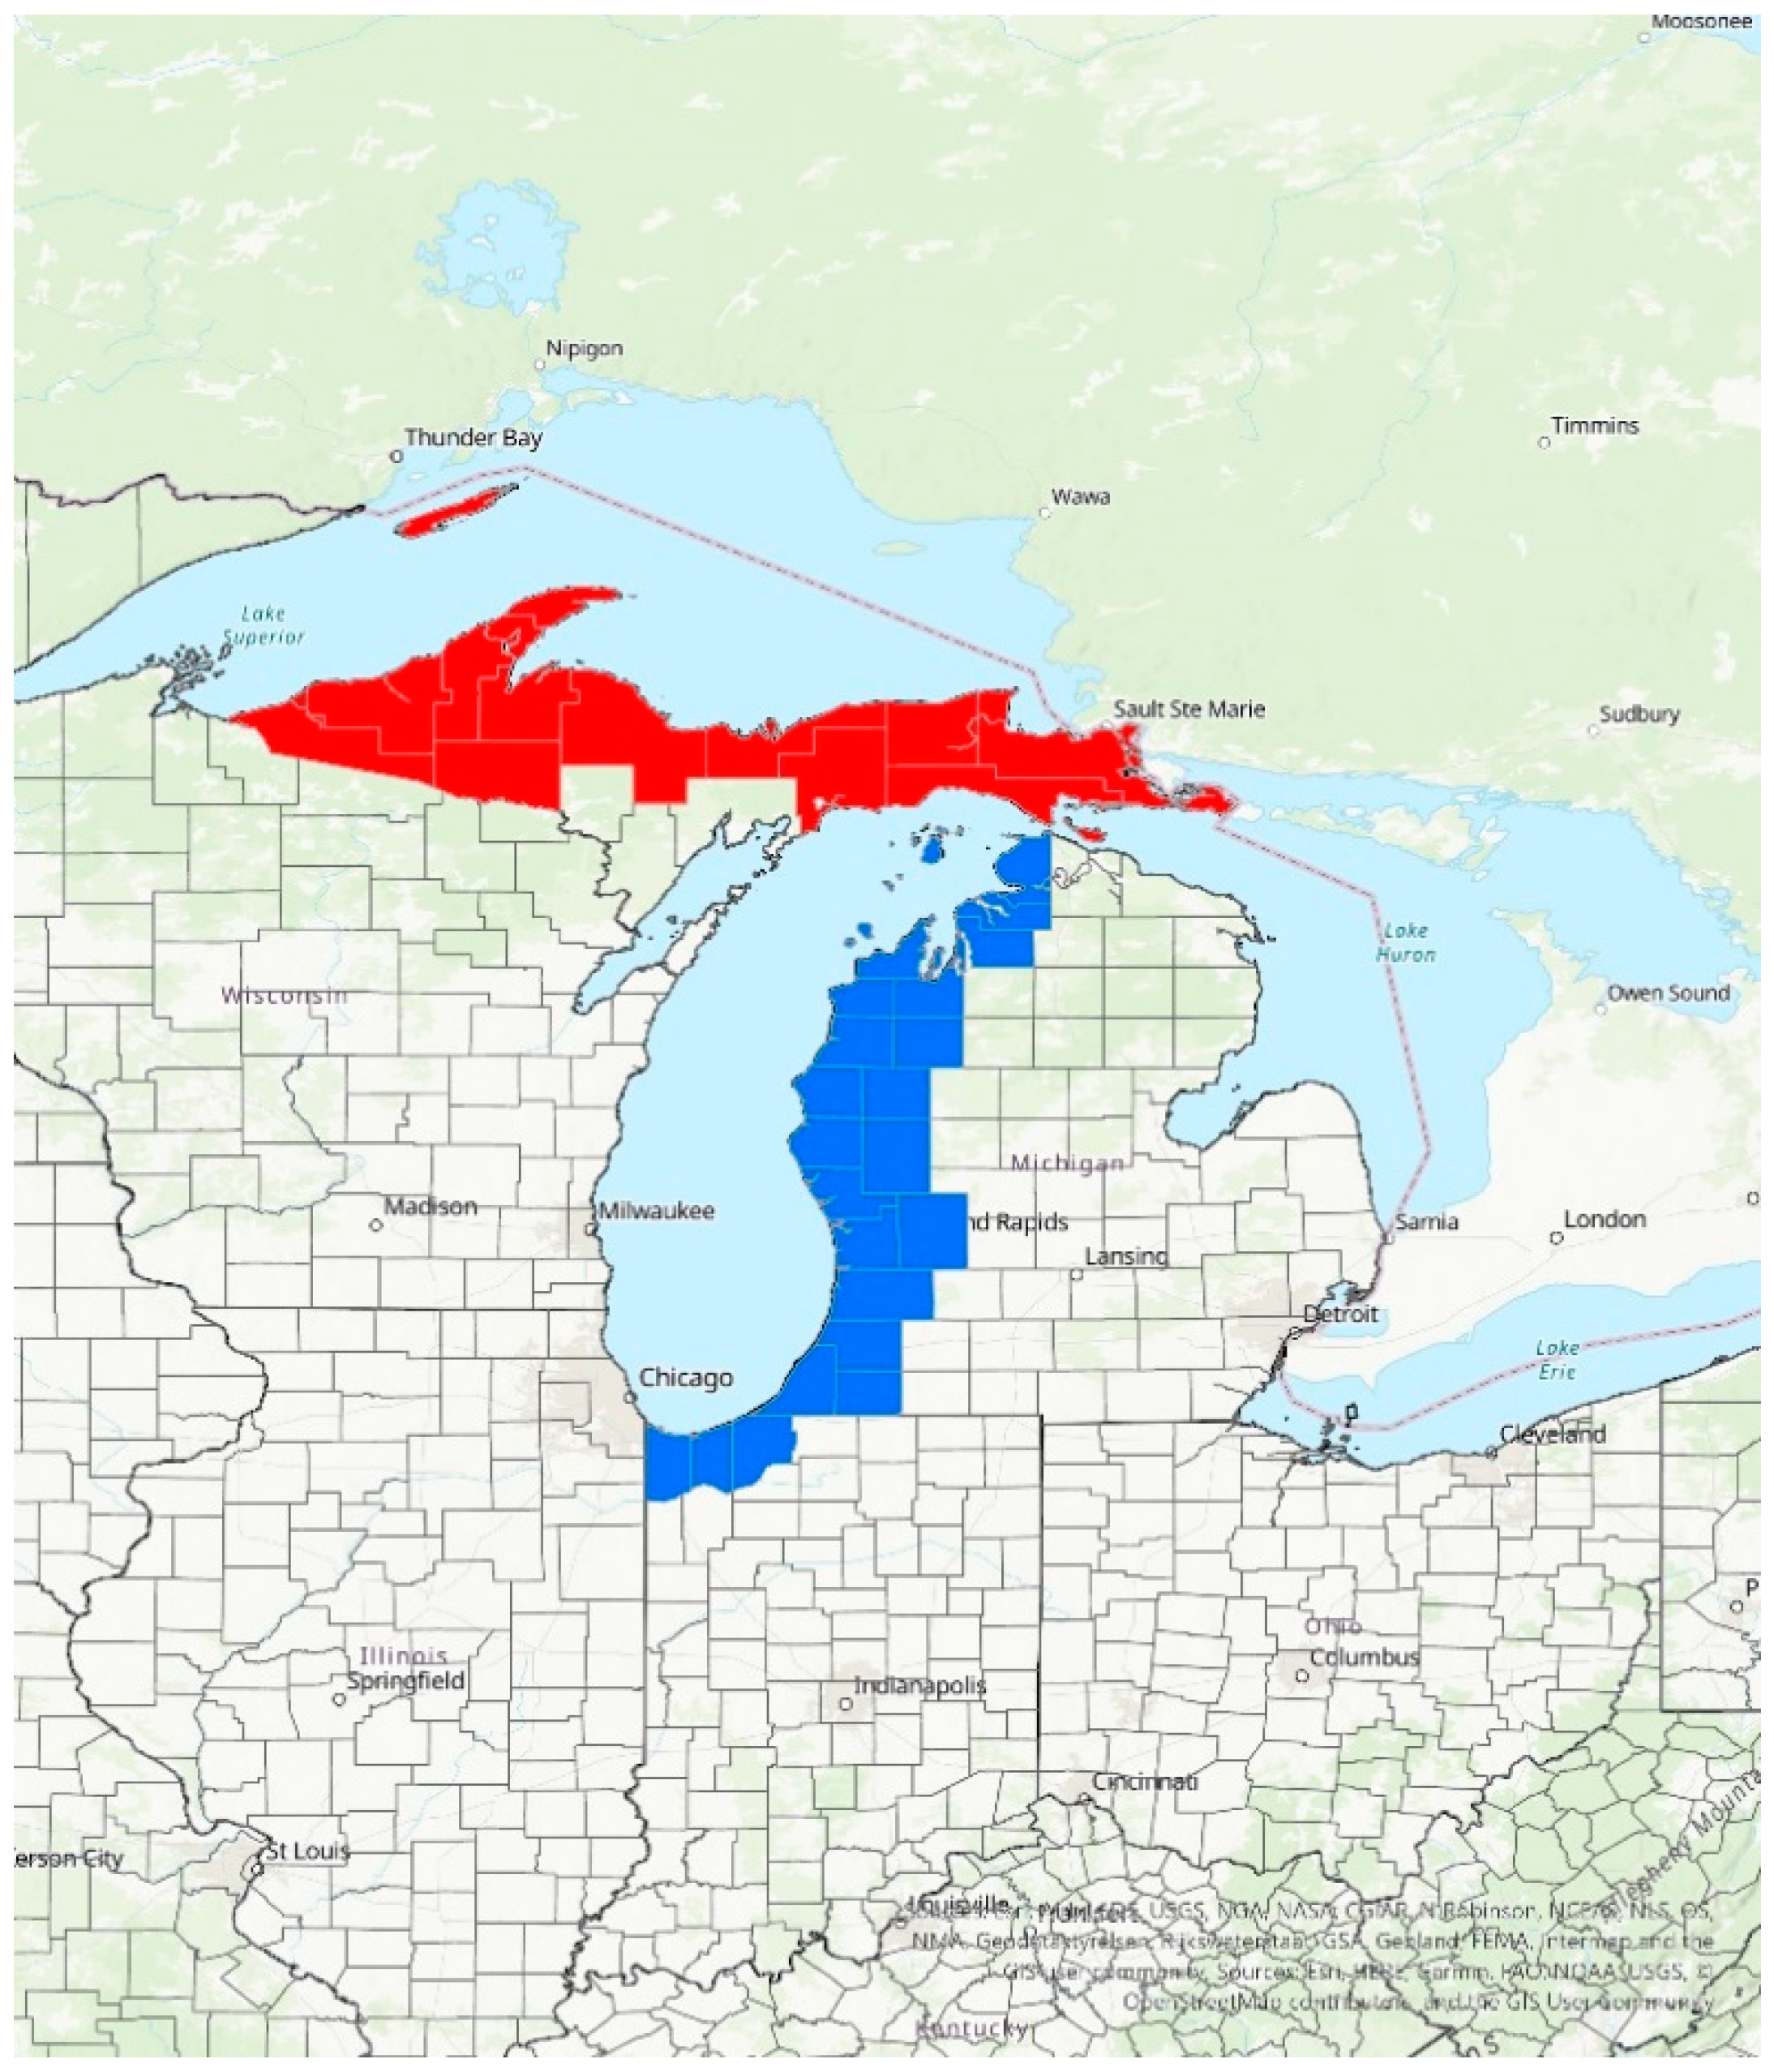
The synoptic climatology of western Great Lakes LES events required a case set of LES events from which composite structures could be derived. Lake Michigan and Lake Superior LES cases were identified using the National Oceanic and Atmospheric Administration (NOAA) Storm Event Database [31]. This archive features a repository of past LES cases within U.S territory and includes a general synopsis of each event (including start and end times), impact county/zone information, deaths, injuries, property and crop damage estimates, and snowfall totals recorded from each event. A storm was described in the database as “lake-effect” based on an official National Weather Service (NWS) directive [32] requiring the presence of convective snow bands off the lee of a lake and snow accumulations to meet or exceed locally defined 12 and/or 24-h warning criteria (6–8 inches within 12 h and 8–10 inches within 24 h). These data are county-level, so all LES events within the counties highlighted in Figure 3 were included for each lake. Cases that started within six hours of another case’s end time were eliminated to remove redundancy within the data (roughly 76% of cases for Lake Michigan included these redundancies and 65% of Lake Superior cases). In total, 106 unique Lake Michigan LES events and 101 Lake Superior events were retained from 1997–2014.
Once all LES cases for both lakes were identified, a reanalysis dataset that portrays mesoscale atmospheric characteristics was needed to represent the underlying conditions for all the LES cases previously identified. The North American Regional Reanalysis (NARR) dataset [33] was used for this purpose as it covers the full study period (1997–2014) at 3-h temporal intervals and is provided on a spatially continuous 32-km Lambert Conformal grid with 30 vertical levels. A subset of the NARR domain, centered on the Great Lakes region, was retained that comprised 16,232 gridpoints. As LES events seldom span over time scales of more than two days, 48 h (17 timesteps) of NARR data was extracted from each case relative to the end time of each LES event identified by the NOAA Storm Event Database. Like [27], conditions at 42 h (14 NARR timesteps) prior to the end time and 6 h (2 NARR timesteps) after the end time for each LES were extracted. This approach allowed for investigating the temporal evolution of the LES events as well as their characteristics at the time of peak LES activity. Base-state atmospheric surface variables including mean sea level pressure, 10 m u- and v-wind, and 2 m temperature and specific humidity were extracted (6 total fields) to depict surface conditions for each LES event. Isobaric data (1000 mb, 925 mb, 850 mb, 700 mb, 500 mb, 300 mb, and 250 mb) for base-state variables (including u- and v-wind, temperature, geopotential height and specific humidity) were also retained.

2.2. Climatology Development Methodology

The primary objective of this work was to develop a synoptic climatology, like [27], for the Lake Michigan and Lake Superior basins. As such, the statistical methods largely followed those in [27]. Specifically, as the spatial dimension on the retained NARR data was large, a T-mode unrotated principal component analysis (PCA) was used to reduce the dimension to a smaller set of principal components (PCs) and describe relationships among LES cases, which is a primary advantage of T-mode analysis. The 15th timestep (valid time) was used to construct the PCA for each lake’s dataset to offer an objective temporal reference frame for comparing variability among the LES cases. Finally, a non-hierarchal k-means cluster analysis (CA) was constructed on the resulting PC loadings (Figure 4) for each dataset to group LES cases with similar synoptic structures into a user defined number of clusters. Like [27], the optimal number of PCs and clusters to retain were unknown and had to be selected manually. These values were selected by calculating silhouette coefficients s [34] for various PC-cluster combinations. The silhouette coefficient represents how accurately members (LES cases) of a cluster are grouped relative to their respective cluster by analyzing separation and cohesion, where separation characterizes the closest distance between two members of different clusters and cohesion is computed as the average distance of all members within a cluster to the cluster’s center. Ideal CAs minimize separation and maximize cohesion to obtain clearly distinguished clusters. The configuration with the highest average silhouette coefficient s ¯   and the lowest frequency of negative silhouette coefficients (which are misclustered cases) was used for the CA. All possible permutations of 2–10 PCs and 2–10 clusters were tested (81 total). These tests revealed that the optimal configuration for Lake Michigan featured two PCs (19.68% of variance explained) and four clusters ( s ¯ = 0.37 with 0 misclustered cases), while for Lake Superior, two PCs (21.51% of variance explained) with three clusters was the best configuration ( s ¯ = 0.40 with 0 misclustered cases) (Table 1 and Table 2). Bootstrap resampled 95% confidence intervals on s ¯ revealed that these PC-cluster configurations were significantly higher than other possible combinations for both lakes, supporting our selection.
For Lake Michigan, LES cases were relatively evenly distributed among the different cases (Figure 4—N1 = 32, N2 = 24, N3 = 25, N4 = 25). Lake Superior cases were less evenly distributed (N1 = 43, N2 = 27, N3 = 31), suggesting one spatial pattern was the predominant synoptic-scale LES mechanism. When assessing the temporal structure of the case distribution for each lake (Figure 5), no major patterns were observed as almost all LES events occurred in the December-February timeframe. Only one cluster for each lake had a slightly greater temporal spread in their case sets: Cluster 3 from Lake Michigan (cases spread from November–April) and Cluster 2 from Lake Superior (cases spread from October–April). These resulting clusters were used to construct composite maps of all NARR fields by averaging all base-state fields for all member cases in each cluster. Each resulting composite portrays a synoptic setup conducive to LES off each lake. Finally, snowfall information from [31] was included from each cluster and 95% bootstrap confidence intervals were constructed from these snowfall data to assess differences in LES impacts.

2.3. Numerical Simulation

The 32-km grid spacing within the NARR renders mesoscale features like low-level convective clouds, coastline location, etc., challenging to render. However, numerical weather prediction (NWP) models can simulate these mesoscale processes within a larger synoptic-scale setup, offering finer grid spacing and more detail into the physical processes comprising the mesoscale environment. We utilized the Advanced Weather Research and Forecast Model (WRF-ARW) version 4.0 [35], a non-hydrostatic mesoscale NWP model, to portray the mesoscale environments of each of the synoptic setups by selecting one LES case from each cluster to initialize the model. The selected cases (Table 3 and Table 4) were identified as the case with the maximum s within each cluster (not shown). Though differences between the numerical projections were starker than the synoptic composites as only one case was simulated per cluster, each case most strongly matched the associated composite among all meteorological fields.
Each simulation featured two domains (one parent and one nested) at 12 and 4 km resolution, respectively and was run over the same 48-h period as the case selected (Figure 6). The parent domain captured the synoptic setup for the selected case while the nested domains provided higher resolution depictions of the mesoscale environments in which LES is occurring. The model parameterizations selected (Table 5) were based off past studies that have been able to accurately project LES using WRF-ARW [27,36,37,38]. Note that no convective scheme was used for the nested 4-km domain so that the model explicitly resolved convection. Additionally, lake surface temperatures (LSTs) were manually altered in each simulation to match observations recorded from the Great Lakes Surface Environmental Analysis (GLSEA) to ensure accurate depiction of vertical heat fluxes off the lakes. GLSEA is a product from [30] that features NOAA Advanced Very High Resolution Radiometer (AVHRR) derived lake surface water temperature composited with ice concentration data from the National Ice Center (NIC). The GLSEA has been used frequently in past LES research to initialize WRF [39,40,41,42]. Finally, each of the simulations were visually compared with Next Generation Weather Radar (NEXRAD) data from three different radar stations located in the western Great Lakes Basin to determine if the WRF-ARW properly characterized the LES character of each event (i.e., snow band morphologies). This analysis (not shown) revealed that WRF-ARW successfully captured the general characteristics of each LES test case. These simulations, in conjunction with the synoptic composite fields described above, provided a robust characterization of the LES environment for each lake basin.

3. Results

3.1. Lake Michigan

3.1.1. Synoptic Composites

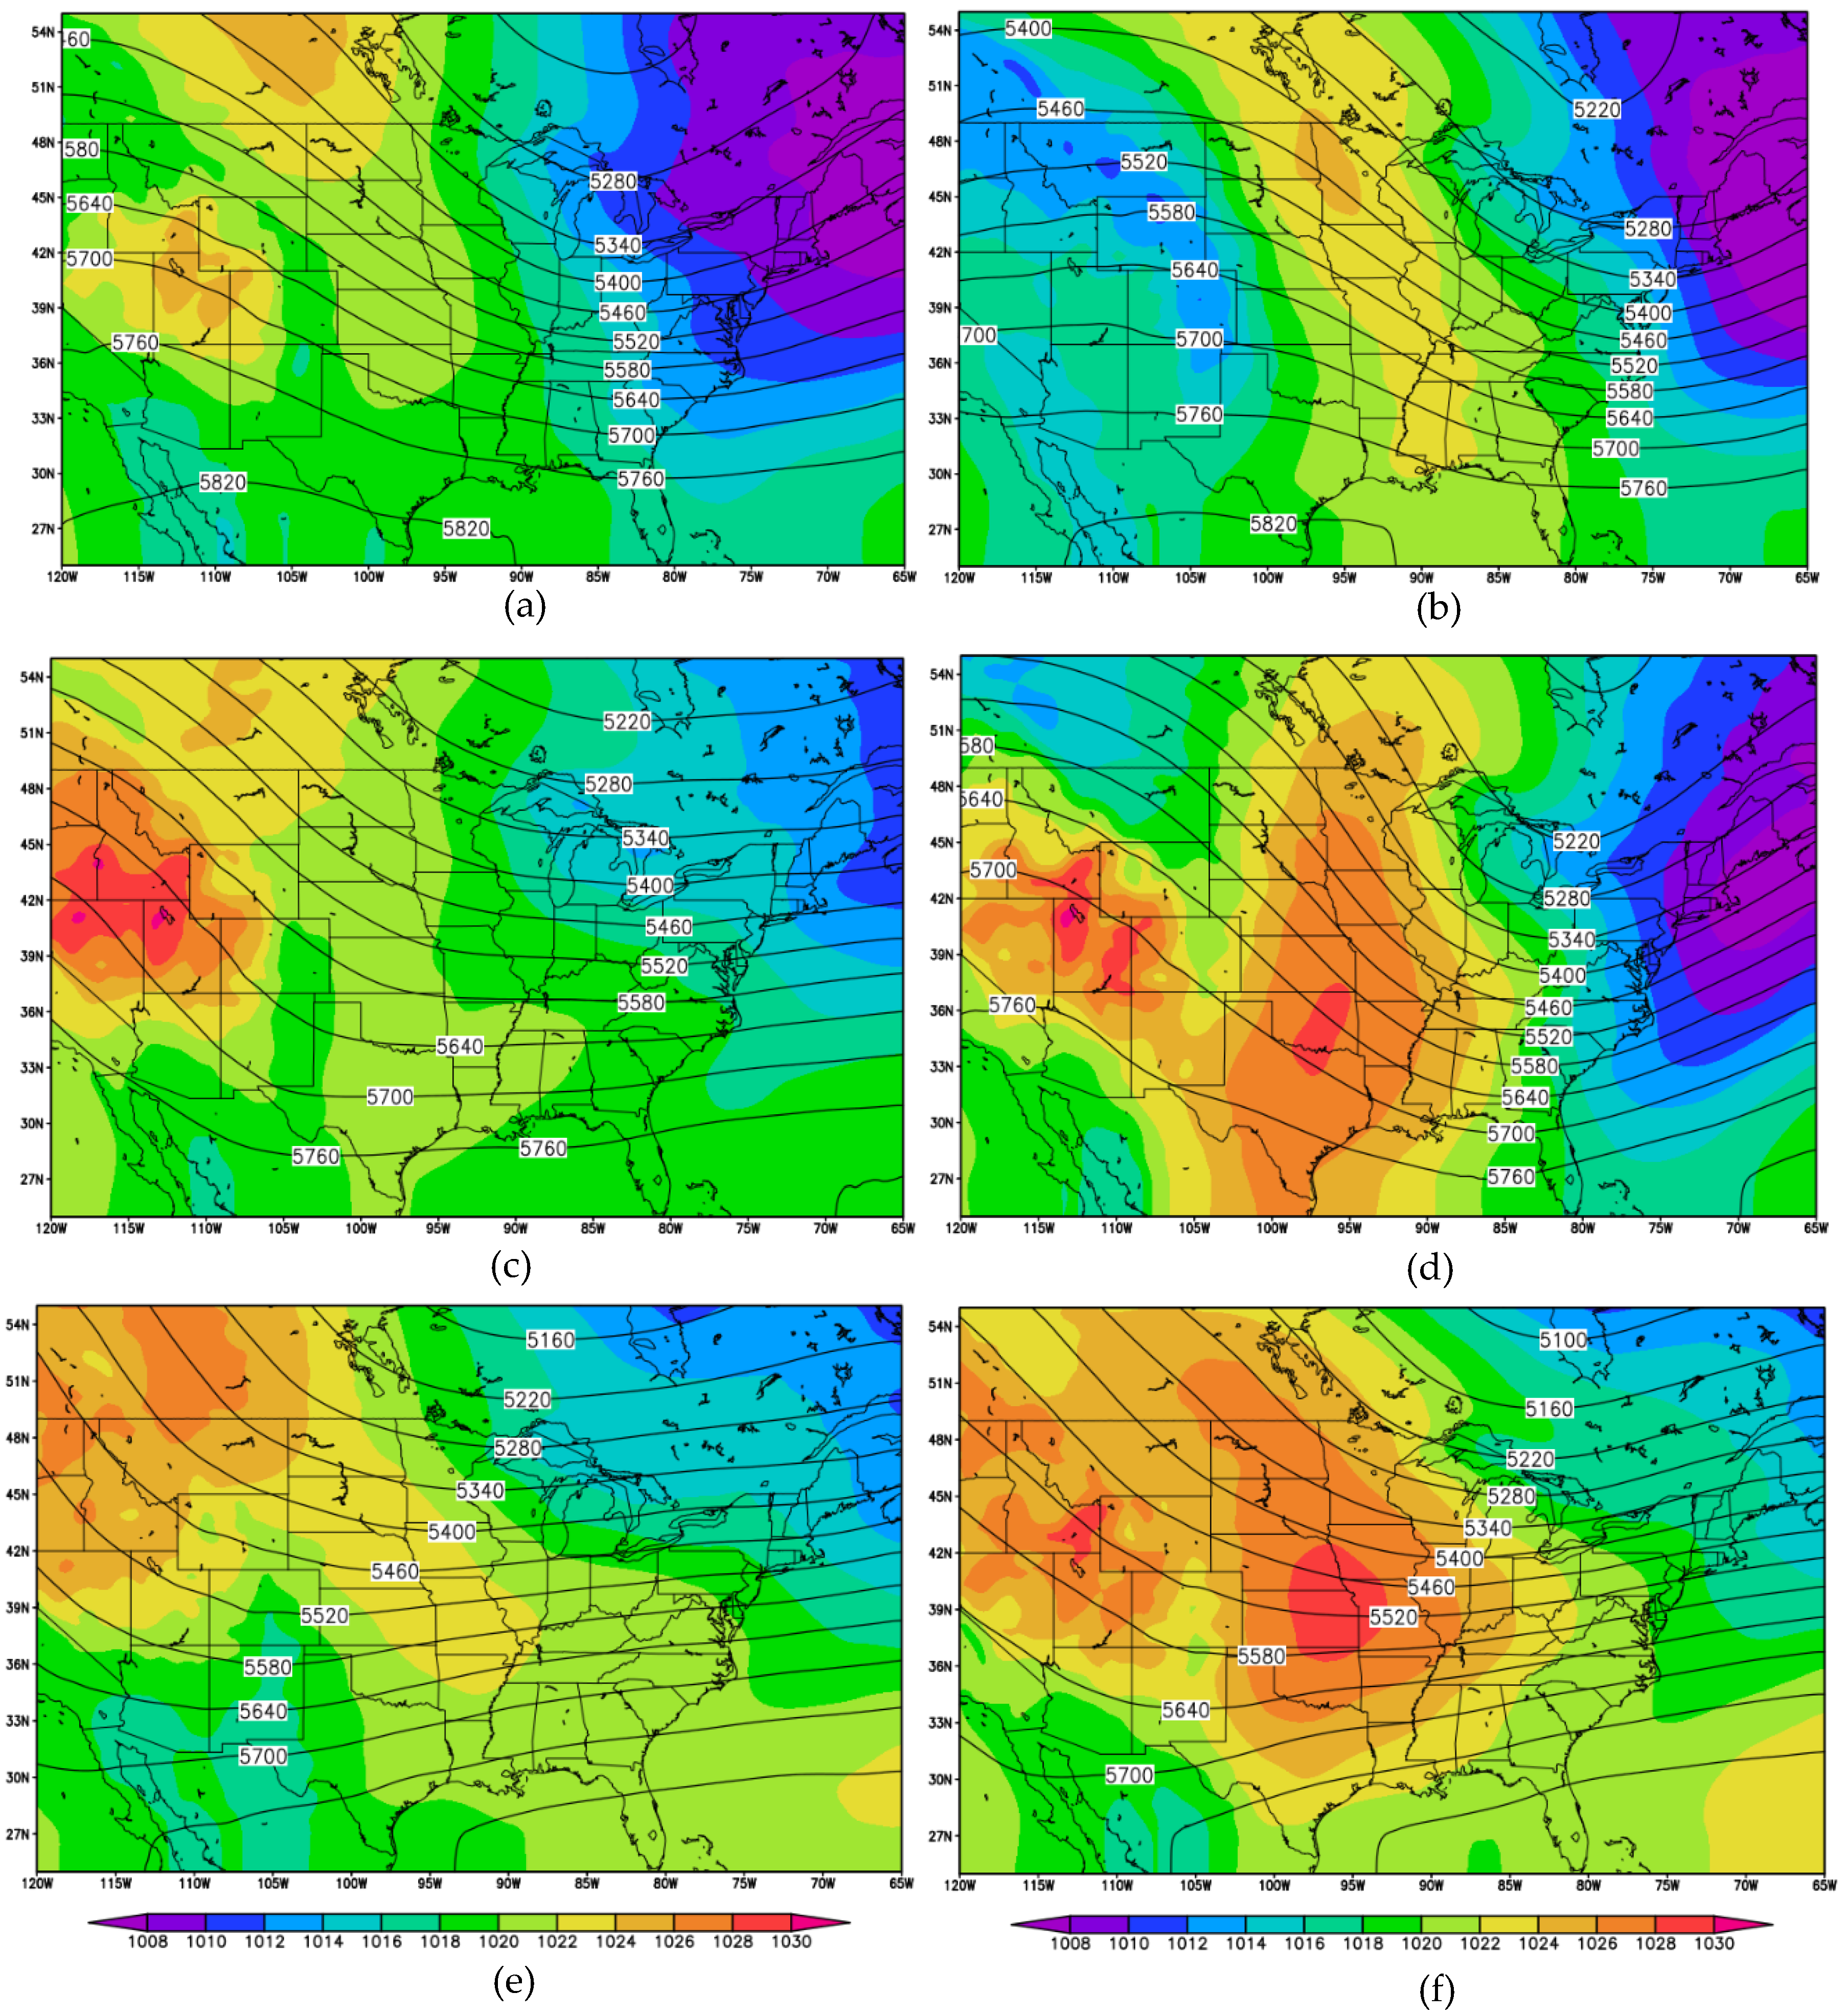
The Lake Michigan Cluster 1 composites revealed a broad neutral 500 mb trough over the western Great Lakes Basin that remained stationary the first 18 h (not shown) with a closed circulation present near the Hudson Bay (Figure 7a). This upper-level low pressure structure was identified previously as being linked with LES across the Great Lakes [25,26].
A surface cyclone was also evident over Lake Huron initially, though this circulation became dissipated within the first 12 h of the analysis time (not shown). Instead, the upper-level trough deepened over the next 24 h, attaining a positive tilt that shifted towards a neutral tilt with associated differential cyclonic vorticity advection (DCVA) (an important large-scale forcing mechanism for severe LES events [50]). A ridge built in behind the trough over the central U.S. and the associated DAVA helped establish a strong surface anticyclone that created the dipole structure needed for the LES. The resulting pressure gradient between these two pressure systems intensified as the anticyclone propagated toward the Great Lakes, ultimately leading to faster winds (5 m s−1 increase) over the lakes. This evolution eventually helped establish moderate wind speeds (5–10 m s−1) with a northwesterly direction that helped support enhanced LES due to moisture plume transport off Lake Superior and a reinvigoration of snow plumes over Lake Michigan [51,52].
The Cluster 2 composite initially (t = 0 h) revealed a neutrally tilted 500 mb trough over central Great Lakes along with a ridge located in proximity to the western U.S. coast (Figure 7c). This trough-ridge pattern resulted in a surface cyclone present over the New England coast and a broad area of high pressure over the Rocky Mountains into the northern Great Plains. The 500 mb trough deepened after this initial time while maintaining its neutral tilt, such that the associated surface cyclone strengthened as well. DAVA occurred concurrently over the western Great Lakes as the ridge propagated toward the region, which helped develop a surface anticyclone like in Cluster 1′s composite. These pressure systems combined to produce a flow pattern that matched Cluster 1 closely, though it did result in a more northerly component to the flow pattern and slightly faster wind speeds (4–5 m s−1 faster).
The upper-level flow patterns seen in Cluster 3 closely match those seen in both Clusters 1 and 2. Initially (t = 0 h), a large-scale upper-level low pressure system was observed southwest of Hudson Bay that intensified and propagated eastward throughout the analysis period (Figure 7e). The associated trough maintained a neutral tilt with a slight shift towards a negative tilt near the end of the composite LES event. Congruently, a 500 mb ridge propagated into the western Great Lakes region, with the associated DAVA developing a weak surface anticyclone (central pressure = 1022 mb). The anticyclone propagated in from the central U.S.-Canadian border southeastward towards Minnesota. Finally, the upper-level low pressure system helped develop a weak surface cyclone that remained nearly stationary over New England. Ultimately, this weaker dipole resulted in lower magnitude pressure gradients and slower wind speeds over the lake (0–5 m s−1), though the surface pressure field’s orientation closely matched Cluster 1.
Cluster 4 upper-level fields (Figure 7g,h) revealed a broad and shallower low-pressure system (higher geopotential heights) with an associated positively tilted 500 mb trough west of the Great Lakes basin. This system helped maintain a closed low-pressure circulation over eastern Lake Superior at the initial time (t = 0 h) that propagated slightly eastward towards Lake Huron while only slightly deepening. Interestingly, this circulation dissipated by 36-h into the analysis period (not shown), instead being embedded into the large-scale flow. Unlike the other clusters, an initially evident closed area of high pressure over the southeastern U.S. (central pressure of 1022 mb) was observed at t = 0 h that eventually was embedded within a larger high-pressure system over the western U.S. This larger system propagated rapidly towards the central U.S. while slightly strengthening (+2 mb). The resulting orientation of the dipole structure led to a unique LES wind field, namely westerly flow for a majority of the composite timesteps with only a slight northwesterly shift in the last 6 h of the analysis. The general lack and eastward displacement of a weak surface cyclone suppressed the pressure gradient across the Lake Michigan region, resulting in flow of roughly 5 m s−1 through the analysis period.

3.1.2. Mesoscale Analysis

Simulations from the Cluster 1 and 2 test cases (Table 3) showed a convectively unstable environment over northeast Lake Michigan (Figure 8b,d). For Cluster 1, surface CAPE values peaked at 200 J kg−1 six hours after initialization with lapse rates up to 14 °C km−1. The northwesterly flow over the lake resulted in three small cells located in the lee of the northeast Lake Michigan coast as evidenced by simulated composite reflectivity.
However, the low water surface temperatures (3 °C) combined with slow winds (0–5 m s−1) resulted in suppressed enthalpy (combined sensible and latent heat) fluxes (300–350 W m−2) and minimal precipitation production (Figure 8a). More convective activity was observed with Cluster 2 as three prominent broad coverage bands formed in southern Lake Michigan. Enthalpy fluxes ranged from 350–400 W m−2 during convective activity and PBL heights peaked at 1.2 km (Figure 8c).
The mesoscale environment for Cluster 3 was most thermodynamically conducive of all the WRF-ARW simulations for Lake Michigan that featured the highest LSTs (8 °C), highest enthalpy fluxes (500 W m−2), and unstable lapse rates (10–12 °C km−1). In addition to an unstable PBL, the wind profile was also conducive to LES as north-northwesterly winds were present across the lake during peak convective activity allowing for long residence times for air parcels traveling over the lake to acquire heat and moisture from the lake surface (Figure 8e). This resulted in a pronounced northwest-southeast oriented LLAP snow band that was the most distinct of all cluster simulations considered.
The Cluster 4 simulation was the least favorable for LES development as extremely low water surface temperatures (0.8 °C), the lowest lapse rates (7–8 °C km−1), and a shallow PBL (1 km) were observed. This resulted in the lowest enthalpy fluxes (200–250 W m−2) and the lowest surface CAPE values (10–15 J kg−1) of all the clusters (Figure 8g). These weak mesoscale thermodynamics resulted in only light LES produced collocated where the CAPE and energy fluxes maximized (along the central axis of Lake Michigan). The sole LES conducive characteristic to Cluster 4 was the northerly wind regime (5–10 m s−1) which led to a LLAP band though it was extremely weak compared to the LLAP produced in Cluster 3.

3.1.3. Meteorological Differences among Lake Michigan Composites

When assessing the primary differences among the Lake Michigan composites, several key outcomes were revealed. To quantify these differences, average Pearson correlations for all possible pairwise combinations of clusters (e.g., cluster 1 and 2, cluster 1 and 3, etc.) for each considered composite field (MSLP, 500 mb height, 850 mb height, and 2-m temperature) were computed at all 17 analysis times. These results quantified (Figure 9) quantified the degree of global similarities in time for each of the presented fields. In general, the results for Lake Michigan showed two primary spatial structures from within the larger group of 4 clusters, as the average correlation between Clusters 1 and 4 (r = 0.82) and Clusters 2 and 3 (r = 0.94) were maximized with these pairs. We discuss differences among these paired patterns below.
The primary distinguishing factor between these pairs of clusters (Clusters 1 and 4 versus Clusters 2 and 3) was the upper-level support, as the trough presented in Clusters 1 and 4 allowed for initial DCVA and QG uplift to occur over Lake Michigan. This additional synoptic-scale forcing enhanced LES convection in these composites. Clusters 1 and 4 also both featured closed surface low-pressure systems originating over the Great Lakes Basin that dissipated over time, as well as surface anticyclones propagating from Alberta/Saskatchewan, Canada towards the central Great Plains. Subtle differences were observed between Clusters 1 and 4 as well, primarily in the strength and position of the surface anticyclone. Cluster 1′s anticyclone was positioned further south and was slightly stronger (2 mb higher central pressure) than Cluster 4, which produced a more northwesterly flow and faster winds across the lake for Cluster 1. These impacts resulted in more conducive thermodynamic ingredients for LES in Cluster 1, as described previously.
Clusters 2 and 3 contrasted the other primary pattern described above as they both featured a stationary surface cyclone along the Atlantic Coast near Maine that strengthened throughout the analysis period. This strengthening was triggered by an evolving upper-level trough and associated upper-level QG dynamic support. Clusters 2 and 3 also showed anticyclogenesis west of the study domain that helped establish the surface dipole structure. Some differences existed in Clusters 2 and 3 though (like Clusters 1 and 4) that were primarily related to the location and strength of the surface anticyclone. Specifically, the anticyclone in Cluster 2 which much stronger (8 mb higher central pressure) than for Cluster 3 and was displaced farther south. It was also coupled with a slightly stronger (2 mb) surface cyclone east of the study region that led to stronger north-northwesterly surface flow. The more northerly shift in this pattern resulted in longer fetch and greater air parcel destabilization relative to Cluster 3′s environment. Other minor differences were observed as well, as the geopotential wavetrain was more amplified in Cluster 2′s composite and the cyclone deepening rate was faster in Cluster 2 as well (6 mb versus 2 mb over the study period). Thus, while similar, some subtle differences helped isolate the unique structures within Clusters 2 and 3.
While two primary synoptic-scale structures resulted from the correlation-based analysis, the mesoscale conditions among the 4 clusters were more distinct. As stated previously, Cluster 3′s mesoscale thermodynamics were most conducive for LES, a result attributed to the timing of the LES event for Cluster 3′s simulations (November) and the associated higher LSTs over Lake Michigan early in the active LES period [30]. In context of the synoptic setup, pure northerly winds were observed for the Cluster 3 simulation as well which led to long amounts of fetch for air parcels to destabilize. However, Clusters 1 and 4 also featured northerly winds but did not possess pronounced air mass destabilization as evidenced by lower lapse rates (2–5 °C km−1 lower), a shallower boundary layer (800 m difference), and suppressed convection, likely a result of a colder lake temperatures and subsequently lower energy fluxes. These results show the importance of the synoptic-scale in establishing basic structures but that the mesoscale environment is most important for final LES development. Importantly, snowfall observations recorded from [31] revealed no significant difference (p ≤ 0.05) between the different clusters such that the dynamic considerations provided herein made statistically non-significant differences in the final LES impacts. This is expected since the database considered herein was derived from only strong LES events as defined by the NWS directive described previously.

3.2. Lake Superior

3.2.1. Synoptic Composites

The Lake Superior Cluster 1 composite (Figure 10a) initially showed a broad upper-level low pressure anomaly with primarily zonal flow over the Great Lakes Basin coupled with an amplified ridge over the western U.S. This pattern produced a low surface pressure anomaly over Lake Huron and anticyclogenesis over the Rocky Mountains that triggered a generally weak, zonal pressure gradient across the Great Lakes. Over time this upper-level trough deepened and attained a positive tilt, producing DCVA with cyclogenesis over Lakes Huron and Ontario. A ridge west of the area produced DAVA over the western Great Lakes (including Lake Superior) also produced surface anticyclogenesis that propagated eastward over time (Figure 10b). As the upper level pattern propagated eastward, the surface dipole pattern attained an optimal LES position by the end of the analysis period, evidenced by northerly winds across Lake Superior.
The Cluster 2 composite initially showed a neutral phase 500 mb trough centered south of the Hudson Bay that strengthened over the analysis period and ultimately attained a negative phase east of the study region (Figure 10c). The associated DCVA from this trough provided additional cyclone strengthening along the Northeast U.S. coast. Additionally, like Cluster 1, high surface pressure was present over the western U.S. and into Alberta and Saskatchewan due to a 500-mb height maximum over the Great Basin. This 500-mb ridge and its associated DAVA anticyclone strengthening (4 mb increase in central pressure) and subsidence over Lakes Superior and Michigan which is an unfavorable environment for LES. However, the associated surface pressure dipole structure created a wind field like Cluster 1′s pattern with north-northwesterly winds over the western half of Lake Superior and northerly winds over the eastern half. The resulting fetch was sufficient to overcome prohibitive synoptic-scale forcing and result in a Lake Superior LES event (Figure 10d).
For Cluster 3, the initial (t = 0 h) upper-level pattern was primarily zonal with no Rossby wave features evident in the Great Lakes region and a very weak height trough in the western U.S. Some evidence of 500-mb ridging was also present over the eastern Pacific which resulted in a surface high pressure system west of the Rocky Mountains (Figure 10e). After 24-h of the analysis period this wave couplet began to amplify, eventually triggering a deeper trough with cyclogenesis over Lake Superior (not shown). This amplification also triggered DAVA over the central U.S. later in the study period, resulting in surface anticyclogenesis over the Plains and eventually a strong (1028 mb) high pressure region over the central U.S. The resulting surface pressure dipole produced a wind field that was directionally distinct from Clusters 1 and 2, beginning with a northerly orientation that shifted west-northwesterly at the LES event peak time. This wind field typically results LLAP bands resulting from long fetch and rigorous convection, ultimately producing large amounts of snowfall impacting the Keweenaw Peninsula and Isle Royale Island, MI, and southern Ontario, Canada.

3.2.2. Mesoscale Analysis

Each of the three test cases for the Lake Superior clusters revealed unique mesoscale environments that impacted different areas and exhibited unique PBL thermodynamic and momentum profiles, as well as overall conduciveness for LES. A cursory view of the thermodynamic profiles for Cluster 1 revealed a relatively unstable PBL with low-level lapse rates near 10 °C km−1, high surface CAPE values (55–60 J kg−1) and a deep PBL (1600 m) (Figure 11b). Convective activity manifested as multiple broad coverage snow bands with the most prominent band extending over the south central Lake Superior shoreline. This snow band morphology was attributed to the northerly flow regime as air parcels flowed across Lake Superior’s short axis which resulted in prominent horizontal roll convection. The instability of the environment combined with moderate air flow over the lake resulted in high enthalpy fluxes (1400 W m−2) and enhanced air mass modification.
Lake Superior’s Cluster 2 simulation showed little convective activity, ultimately revealing the least conducive LES environment of the three Lake Superior clusters. This was evidenced by the weaker thermodynamic characteristics, specifically with low enthalpy fluxes (500 W m−2) and weaker than dry-adiabatic lapse rates (8–9 °C km−1Figure 11d). The north/northeasterly flow regime (5–10 m s−1) and low surface CAPE (35–40 J kg−1) also suppressed convective activity as air parcels did not acquire significant amounts of heat and moisture from the lake surface, ultimately inhibiting snow band formation.
Cluster 3′s mesoscale environment appeared most favorable for LES, and the simulation produced a pronounced LLAP band that originated over central Lake Superior (not shown). Cluster 3′s boundary layer profiles were supportive of strong LES convection as environmental lapse rates were superadiabatic (10–12 °C km−1) with enthalpy fluxes reaching 600 W m−2 and strong westerly winds (10–15 m s−1) throughout the duration of the simulation (Figure 11e,f). Cluster 3′s simulation also revealed a unique low-level convergence zone over the central lake axis where the LLAP snow band originated. This feature has been previously identified with LLAP snow bands over the eastern Great Lakes and can aid LES formation via additional rising air [9,14]. This convergence zone coupled with the strong environmental lapse rates were the primary reasons why this environment was deemed more conducive for LES.

3.2.3. Meteorological Differences among Lake Superior Composites

After the same average correlation analysis done for Lake Michigan was conducted on the Lake Superior composites, the results once again revealed that surface patterns were the primary differences among the clusters (Figure 12). This was most apparent in the MSLP fields as the average correlations decreased dramatically over time with the MSLP (0.83 at t = 0 h versus 0.64 at t = 48 h). The structure of the surface pressure dipole, upper-level fields, and surface wind fields were most similar between Clusters 1 and 2 (r = 0.77), as both had a zonally oriented surface pressure gradient across Lake Superior that resulted in primarily northerly winds. The main differences in these clusters’ surface characteristics were the position and strength of the surface anticyclone, as Cluster 1′s anticyclone was stronger (4 mb) than Cluster 2′s, resulting in faster flow across the lake in Cluster 1′s environment. Additionally, small shifts in the positioning of the cyclones and anticyclones for Clusters 1 and 2 produced a northerly flow on the western half of Lake Superior for Cluster 1 but a pure north-northwesterly flow across the entire lake for Cluster 2. North-northwesterly flow was also seen on the eastern half of Lake Superior in Cluster 1, resulting in a surface convergent boundary which acted as an additional lifting mechanism not seen in Cluster 2. The upper-level features were also slightly displaced farther west in Cluster 1 relative to cluster 2, which led to the differences in surface patterns discussed above.
Cluster 3′s pattern was very distinct among the 3 clusters as evidenced by its low average correlation with the other patterns (r = 0.68). The most notable differences were the westerly near-surface wind field, which was a consequence of the dramatic modification of the dipole structure for Cluster 3 (Figure 10d). Specifically, this composite revealed a broad area of low-pressure centered northeast of New Brunswick, Canada that strengthened and remained quasi-stationary throughout the duration of the analysis period. This strengthening increased cyclonic flow while a strong (1028 mb) surface anticyclone propagated into the central U.S., resulting in a meridional pressure gradient not seen in Clusters 1 and 2. This modified pressure gradient produced the more westerly flow over the lake that produced the LLAP LES morphology as air parcels were able to travel the entire length of Lake Superior. For this cluster, air mass destabilization and snowfall production were maximized as parcels had maximum residence time over the lake, and the LES impacts were most pronounced over the southern Ontario, Canada region.
The distinctions among each cluster’s synoptic characteristics had major impacts on the resulting mesoscale environments for Lake Superior LES. Clusters 1 and 2 featured light to moderate precipitation over the southern Lake Superior shores (as expected with the north-northwesterly flows seen in those clusters) while Cluster 3′s simulation featured a strong LLAP band over the eastern half of Lake Superior parallel to the lake’s central axis. The long residence times of the parcels over the lake was the primary reason for these major differences as parcels were able to attain additional energy as they traversed the lake from west to east. This result supports those for Lake Michigan that the mesoscale conditions ultimately drive the final LES evolution even though the synoptic precursors can offer some differences into the environments characterizing LES.
Interestingly, the median snowfall totals, as recorded by [31] for each of the three clusters, were roughly equal at 12 inches (and the differences were not significant at p = 0.05), which suggests the overall impacts from these different setups were roughly similar. However, this is more than likely an artifact of how [31] records snowfall observations. Areas most impacted by LLAP LES events off Lake Superior are located in southern Ontario, Canada and [31] only records snowfall the occurs in the U.S. LLAP Lake Superior events most likely result snowfall that far exceeds that of broad coverage events but because of where the snowfall occurred, the records from [31] do not exhibit this pattern.

4. Conclusions

The objective of this research was to develop a synoptic climatology that characterizes conditions favorable for LES development over Lakes Michigan and Superior and to link those synoptic conditions with their associated mesoscale environments. All composites revealed a common dipole structure that has been previously seen in Great Lakes LES studies [3,26,27], though minor discrepancies in the formation, strength, and position of the dipole led to some composites being more conducive for LES over others.
For Lake Michigan, four composites were developed that generally featured two synoptic-scale patterns:
  • An upper-level trough-ridge pattern centered across the Great Lakes region with an associated surface dipole structure from a mid-latitude cyclone off the New England coast and an anticyclone over the Great Plains (Clusters 1 and 4). This pattern was enhanced by DCVA from the mid-level trough west of the study region. The predominant flow regime in this pattern was westerly across Lake Michigan.
  • A static low-pressure system in the northeastern Atlantic that strengthens via DCVA from an upper level synoptic-scale trough and an associated anticyclone that propagates across the Midwest (Clusters 2 and 3). Synoptic-scale forcing mechanisms were minimal with this composite, and the predominant flow regime was northwesterly, contrasting the results of the first synoptic-scale pattern.
Previous studies have shown that upper-level support plays a minor role in LES formation relative to the surface wind field, which is more responsible for fetch and snow band morphology [27,53]. As such, the second Lake Michigan synoptic structure appeared more conducive to LES formation, a result supported by the higher average snowfall rates for cases in these clusters (12.96 inches versus 12.42 inches). Additionally, the mesoscale results aligned with this outcome as Cluster 3′s pattern showed a more conducive thermodynamic setup for LES while Cluster 4 showed the weakest thermodynamic characteristics of the four composites (though it had synoptic-scale support for LES). These results suggest that the mesoscale conditions are most important for LES formation and the synoptic-scale conditions are secondary controls for Lake Michigan LES (though they are primary drivers of the initial LES setup). As LES is a mesoscale phenomenon, the result is also not unexpected, but this research is to the authors knowledge the first to explicitly link the importance of the mesoscale and synoptic-scale in this context for Lake Michigan.
For Lake Superior, three composites were developed that also generally exhibited two synoptic-scale structures:
  • A mid-latitude cyclone off the northeast U.S. coupled with an anticyclone over the central U.S. that resulted in northerly flow over Lake Superior (Clusters 1 and 2).
  • Broad surface low pressure structure in the northeast Atlantic coupled with a strong anticyclone over the lower Great Plains that produced westerly winds over Lake Superior (Cluster 3).
As the primary differences were in the wind fields, the unique structures resulted in distinct snow band morphologies and LES severity, which was further seen in the WRF-ARW simulations. In the Cluster 3 simulation, snowfall estimates were highest (4.72 inches) due to the flow across the long axis of the lake that caused parcels to access continual sources of thermodynamic energy across the fetch. These results, like Lake Michigan, suggest that the mesoscale environment is the primary driver for LES events themselves, though the synoptic conditions are still important for establishing the large-scale LES pattern. Importantly, the distribution of cases among the Lake Superior clusters suggested that the first global synoptic pattern associated with Clusters 1 and 2 was by far most dominant, comprising 69% of LES events in the database. This result is expected as cases taken from [31] were primarily from the southern Lake Superior shore which was the primary impact area for cases associated with this global synoptic pattern.
Overall, the results of this study offer new insights into the character of LES events in the infrequently studied western Great Lakes. This work also offers a deeper understanding into the large-scale dynamics associated with western Great Lakes LES and how these dynamics translate into deviations in the mesoscale structures. Ultimately, this insight can aid local forecasters to predict LES with greater lead times, which can potentially reduce the hazardous impacts associated with LES by offering additional time to prepare for impactful events. In future work, we plan to identify Great Lakes winter storms that do not produce LES to establish a new statistical classifier that can help identify environments conducive for LES with lead times up to 48 h, which could have dramatic forecasting impacts. Ultimately, this work helped link the synoptic and mesoscale character of LES events in the western Great Lakes and serves as a first step into building a larger predictive scheme for Great Lakes LES.

Author Contributions

Conceptualization, A.M. and J.W.; methodology, A.M.; software, J.W.; validation, J.W. and A.M.; formal analysis, J.W.; investigation, J.W.; resources, J.W.; data curation, J.W. and A.M.; writing—original draft preparation, J.W.; writing—review and editing, A.M.; visualization, J.W.; supervision, J.W.; project administration, A.M. All authors have read and agreed to the published version of the manuscript.

Funding

This work was supported by NOAA award #NA19OAR4590411.

Data Availability Statement

Data can be found in the references cited in the manuscript.

Acknowledgments

We wish to thank two anonymous reviewers for their valuable contributions to help improving this manuscript.

Conflicts of Interest

The authors declare no conflict of interest.

References

  1. Changnon, S.A.; Jones, D.M.A. Review of the influences of the Great Lakes on weather. Water Res. Res. 1972, 8, 360–371. [Google Scholar] [CrossRef]
  2. Eichenlaub, V.L. Weather and Climate of the Great Lakes Region; University of Notre Dame Press: Notre Dame, IN, USA; 335p.
  3. Suriano, Z.J.; Leathers, D.J. Synoptically classified lake-effect snowfall trends to the lee of Lakes Erie and Ontario. Clim. Res. 2017, 74, 1–13. [Google Scholar] [CrossRef]
  4. Xiao, C.; Lofgren, B.M.; Wang, J. WRF-based assessment of the Great Lakes’ impact on cold season synoptic cyclones. Atmos. Res. 2018, 214, 189–203. [Google Scholar] [CrossRef]
  5. Shi, Q.; Xue, P. Impact of Lake Surface Temperature Variations on Lake Effect Snow Over the Great Lakes Region. J. Geophys. Res. Atmos. 2019, 124, 12553–12567. [Google Scholar] [CrossRef]
  6. Wiggin, B.L. Great Snows of the Great Lakes. Weatherwise 1950, 3, 123–126. [Google Scholar] [CrossRef]
  7. Rothrock, H.J. An Aid in Forecasting Significant Lake Snows; ESSA Tech. Memo. WBTM CR-30, NOAA/NWS; National Weather Serivce: Kansas City, MO, USA, 1969; 18p. [Google Scholar]
  8. Niziol, T.A. Operational Forecasting of Lake Effect Snowfall in Western and Central New York. Weather Forecast. 1987, 2, 310–321. [Google Scholar] [CrossRef]
  9. Niziol, T.A.; Synder, W.R.; Waldstreicher, J.S. Winter Weather Forecasting throughout the Eastern United States. Part IV: Lake Effect Snow. Weather Forecast. 1995, 10, 61–77. [Google Scholar] [CrossRef] [Green Version]
  10. Sousounis, P.J. Lake-Effect Storms. Encycl. Atmos. Sci. 2003, 1104–1115. [Google Scholar] [CrossRef]
  11. Campbell, L.S.; James Steenburgh, W. The OWLeS IOP2b lake-effect snowstorm: Mechanisms contributing to the Tug Hill precipitation maximum. Mon. Weather Rev. 2017, 145, 2461–2478. [Google Scholar] [CrossRef]
  12. Kristovich, D.A.R.; Clark, R.D.; Frame, J.; Geerts, B.; Knupp, K.R.; Kosiba, K.; Laird, N.F.; Metz, N.D.; Minder, J.R.; Sikora, T.D.; et al. The Ontario Winter Lake-Effect Systems field campaign: Scientific and educational adventures to further our knowledge and prediction of lake-effect storms. Bull. Am. Meteorol. Soc. 2017, 98, 315–332. [Google Scholar] [CrossRef]
  13. Holroyd, E.W. Lake-effect cloud bands as seen from weather satellites. J. Atmos. Sci. 1971, 28, 1165–1170. [Google Scholar] [CrossRef] [Green Version]
  14. Minder, J.R.; Bartolini, W.M.; Spence, C.; Hedstrom, N.R.; Blanken, P.D.; Lenters, J.D. Characterizing and constraining uncertainty associated with surface and boundary layer turbulent fluxes in simulations of lake-effect snowfall. Weather Forecast. 2020, 35, 467–488. [Google Scholar] [CrossRef]
  15. Steenburgh, W.J.; Campbell, L.S. The OWLeS IOP2b lake-effect snowstorm: Shoreline geometry and the mesoscale forcing of precipitation. Mon. Weather Rev. 2017, 145, 2421–2436. [Google Scholar] [CrossRef]
  16. Minder, J.R.; Letcher, T.W.; Campbell, L.S.; Veals, P.G.; Steenburgh, W.J. The evolution of lake-effect convection during landfall and orographic uplift as observed by profiling radars. Mon. Weather Rev. 2015, 143, 4422–4442. [Google Scholar] [CrossRef]
  17. Villani, J.P.; Jurewicz, M.L., Sr.; Reinhold, K. Forecasting the Inland Extent of Lake Effect Snow Bands Downwind of Lake Ontario. J. Oper. Meteorol. 2017, 5, 53–70. [Google Scholar] [CrossRef]
  18. Markowski, P.; Richardson, Y. Mesoscale Meteorology in Midlatitudes; Wiley-Blackwell: Hoboken, NJ, USA, 2011; p. 407. [Google Scholar]
  19. Kunkel, K.E.; Westcott, N.E.; Kristovich, D.A.R. Assessment of Potential Effects of Climate Change on Heavy Lake-Effect Snowstorms Near Lake Erie. J. Great Lakes Res. 2002, 28, 521–536. [Google Scholar] [CrossRef]
  20. Steiger, S.M.; Hamilton, R.; Keeler, J.; Orville, R.E. Lake-effect thunderstorms in the lower great lakes. J. Appl. Meteorol. Clim. 2009, 48, 889–902. [Google Scholar] [CrossRef] [Green Version]
  21. Steiger, S.M.; Schrom, R.; Stamm, A.; Ruth, D.; Jaszka, K.; Kress, T.; Rathbun, B.; Frame, J.; Wurman, J.; Kosiba, K. Circulations, bounded weak echo regions, and horizontal vortices observed within long-lake-axis-parallel-lake-effect storms by the doppler on wheels. Mon. Weather Rev. 2013, 141, 2821–2840. [Google Scholar] [CrossRef]
  22. Forbes, G.S.; Merritt, J.H. Mesoscale vortices over the Great Lakes in wintertime. Mon. Weather Rev. 1984, 112, 377–381. [Google Scholar] [CrossRef] [Green Version]
  23. Hjelmfelt, M.R. Numerical study of the influence of environmental conditions on lake-effect snowstorms over Lake Michigan. Mon. Weather Rev. 1990, 118, 138–150. [Google Scholar] [CrossRef] [Green Version]
  24. Laird, N.F.; Kristovich, D.A.R.; Walsh, J.E. Idealized model simulations examining the mesoscale structure of winter lake-effect circulations. Mon. Weather Rev. 2003, 131, 206–221. [Google Scholar] [CrossRef] [Green Version]
  25. Mercer, A.E.; Richman, M.B. Statistical differences of quasigeostrophic variables, stability, and moisture profiles in North American storm tracks. Mon. Weather Rev. 2007, 135, 2312–2338. [Google Scholar] [CrossRef] [Green Version]
  26. Ellis, A.W.; Leathers, D.J. A synoptic climatological approach to the analysis of lake-effect snowfall: Potential forecasting applications. Weather Forecast. 1996, 11, 216–229. [Google Scholar] [CrossRef] [Green Version]
  27. Wiley, J.; Mercer, A. An Updated Synoptic Climatology of Lake Erie and Lake Ontario Heavy Lake-Effect Snow Events. Atmosphere 2020, 11, 872. [Google Scholar] [CrossRef]
  28. Campbell, L.S.; Steenburgh, W.J.; Veals, P.G.; Letcher, T.W.; Minder, J.R. Lake-effect mode and precipitation enhancement over the Tug Hill Plateau during OWLeS IOP2b. Mon. Weather Rev. 2016, 144, 1729–1748. [Google Scholar] [CrossRef]
  29. Liu, A.Q.; Moore, G.W.K. Lake-effect snowstorms over southern Ontario, Canada, and their associated synoptic-scale environment. Mon. Weather Rev. 2004, 132, 2595–2609. [Google Scholar] [CrossRef]
  30. NOAA Great Lakes Environmental Research Laboratory. Available online: https://www.glerl.noaa.gov/education/ourlakes/lakes.html (accessed on 5 February 2020).
  31. Storm Events Database. Available online: https://www.ncdc.noaa.gov/stormevents/ (accessed on 29 January 2020).
  32. National Weather Service Instruction 10-1605. Available online: http://www.nws.noaa.gov/directives/sym/pd01016005curr.pdf (accessed on 15 March 2020).
  33. Mesinger, F.; DiMego, G.; Kalnay, E.; Mitchell, K.; Shafran, P.C.; Ebisuzaki, W.; Jović, D.; Woollen, J.; Rogers, E.; Berbery, E.H.; et al. North American Regional Reanalysis. Bull. Am. Meteorol. Soc. 2006, 87, 343–360. [Google Scholar] [CrossRef] [Green Version]
  34. Rousseeuw, P.J. Silhouettes: A graphical aid to the interpretation and validation for cluster analysis. J. Comput. Appl. Math. 1987, 20, 53–65. [Google Scholar] [CrossRef] [Green Version]
  35. Skamarock, W.C.; Klemp, J.B.; Dudhia, J.; Gill, D.O.; Liu, Z.; Berner, J.; Wang, W.; Powers, J.G.; Duda, M.G.; Barker, D.M.; et al. A Description of the Advanced Research WRF Model Version 4; No. NCAR/TN-556+STR; Corporation for Atmospheric Research: Boulder, CO, USA, 2019. [Google Scholar] [CrossRef]
  36. Shi, J.J.; Tao, W.K.; Matsui, T.; Cifelli, R.; Hou, A.; Lang, S.; Tokay, A.; Wang, N.Y.; Peters-Lidard, C.; Skofronick-Jackson, G.; et al. WRF simulations of the 20–22 January 2007 snow events over eastern Canada: Comparison with in situ and satellite observations. J. Appl. Meteorol. Climatol. 2010, 49, 2246–2266. [Google Scholar] [CrossRef] [Green Version]
  37. Wright, D.M.; Posselt, D.J.; Steiner, A.L. Sensitivity of lake-effect snowfall to lake ice cover and temperature in the great lakes region. Mon. Weather Rev. 2013, 141, 670–689. [Google Scholar] [CrossRef] [Green Version]
  38. Mallard, M.S.; Nolte, C.G.; Bullock, O.R.; Spero, T.L.; Gula, J. Using a coupled lake model with WRF for dynamical downscaling. J. Geophys. Res. Atmos. 2014, 119, 7193–7208. [Google Scholar] [CrossRef]
  39. Trumpickas, J.; Shuter, B.J.; Minns, C.K. Potential Changes in Future Surface Water Temperatures in the Ontario Great Lakes as a Result of Climate Change. Clim. Chang. Res. Note Ont. For. Res. Inst. 2008, 7, 1–8. [Google Scholar]
  40. Cordeira, J.M.; Laird, N.F. The influence of ice cover on two lake-effect snow events over Lake Erie. Mon. Weather Rev. 2008, 136, 2747–2763. [Google Scholar] [CrossRef] [Green Version]
  41. Xiao, C.; Lofgren, B.M.; Wang, J.; Chu, P.Y. Improving the lake scheme within a coupled WRF-lake model in the Laurentian Great Lakes. J. Adv. Model. Earth Syst. 2016, 8. [Google Scholar] [CrossRef] [Green Version]
  42. Fujisaki-Manome, A.; Fitzpatrick, L.E.; Gronewold, A.D.; Anderson, E.J.; Lofgren, B.M.; Spence, C.; Chen, J.; Shao, C.; Wright, D.M.; Xiao, C. Turbulent heat fluxes during an extreme lake-effect snow event. J. Hydrometeorol. 2017, 18, 3145–3163. [Google Scholar] [CrossRef]
  43. Tao, W.-K.; Simpson, J. Goddard cumulus ensemble model. Part I: Model description. Terr. Atmos. Ocean. Sci. 1993, 4, 35–72. [Google Scholar] [CrossRef]
  44. Mellor, G.L.; Yamada, T. Development of a turbulence closure model for geophysical fluid problems. Rev. Geophys. 1982, 20, 851–875. [Google Scholar] [CrossRef] [Green Version]
  45. Ek, M.B.; Mitchell, K.E.; Lin, Y.; Rogers, E.; Grunmann, P.; Koren, V.; Gayno, G.; Tarpley, J.D. Implementation of Noah land surface model advances in the National Centers for Environmental Prediction operational mesoscale Eta model. J. Geophys. Res. Atmos. 2003, 108, 1–16. [Google Scholar] [CrossRef]
  46. Dudhia, J. Numerical study of convection observed during the Winter Monsoon Experiment using a mesoscale two-dimensional model. J. Atmos. Sci. 1989, 46, 3077–3107. [Google Scholar] [CrossRef]
  47. Mlawer, E.J.; Taubman, S.J.; Brown, P.D.; Iacono, M.J.; Clough, S.A. Radiative transfer for inhomogeneous atmospheres: RRTM, a validated correlated-k model for the longwave. J. Geophys. Res. Atmos. 1997, 102, 16663–16682. [Google Scholar] [CrossRef] [Green Version]
  48. Kain, J.S.; Fritsch, J.M. The role of the convective “trigger function” in numerical prediction of mesoscale convective systems. Meteorol. Atmos. Phys. 1993, 49, 93–106. [Google Scholar] [CrossRef]
  49. Janjic, Z.I. The Surface Layer in the NCEP Eta MODEL. In Proceedings of the 11th Conference on Numerical Weather Prediction, Norfolk, VA, USA, 19–23 August 1996; American Meteorological Society: Boston, MA, USA, 1996; pp. 354–355. [Google Scholar]
  50. Notaro, M.; Zarrin, A.; Vavrus, S.; Bennington, V. Simulation of heavy lake-effect snowstorms across the great lakes basin by RegCM4: Synoptic climatology and variability. Mon. Weather Rev. 2013, 141, 1990–2014. [Google Scholar] [CrossRef]
  51. Rose, B.L. The Role of Upstream Lakes in Determining Downstream Severe Lake-Effect Snowstorms. Ph.D. Thesis, University of Illinois at Urbana—Champaign, Champaign, IL, USA, 2000; 182p. [Google Scholar]
  52. Rodriguez, Y.; Kristovich, D.A.R.; Hjelmfelft, M.R. Lake-to-lake cloud bands: Frequencies and locations. Mon. Weather Rev. 2007, 135, 4202–4213. [Google Scholar] [CrossRef]
  53. Metz, N.D.; Bruick, Z.S.; Capute, P.K.; Neureuter, M.M.; Ott, E.W.; Sessa, M.F. An investigation of cold-season short-wave troughs in the Great Lakes region and their concurrence with lake-effect clouds. J. Appl. Meteorol. Climatol. 2019, 58, 605–614. [Google Scholar] [CrossRef]
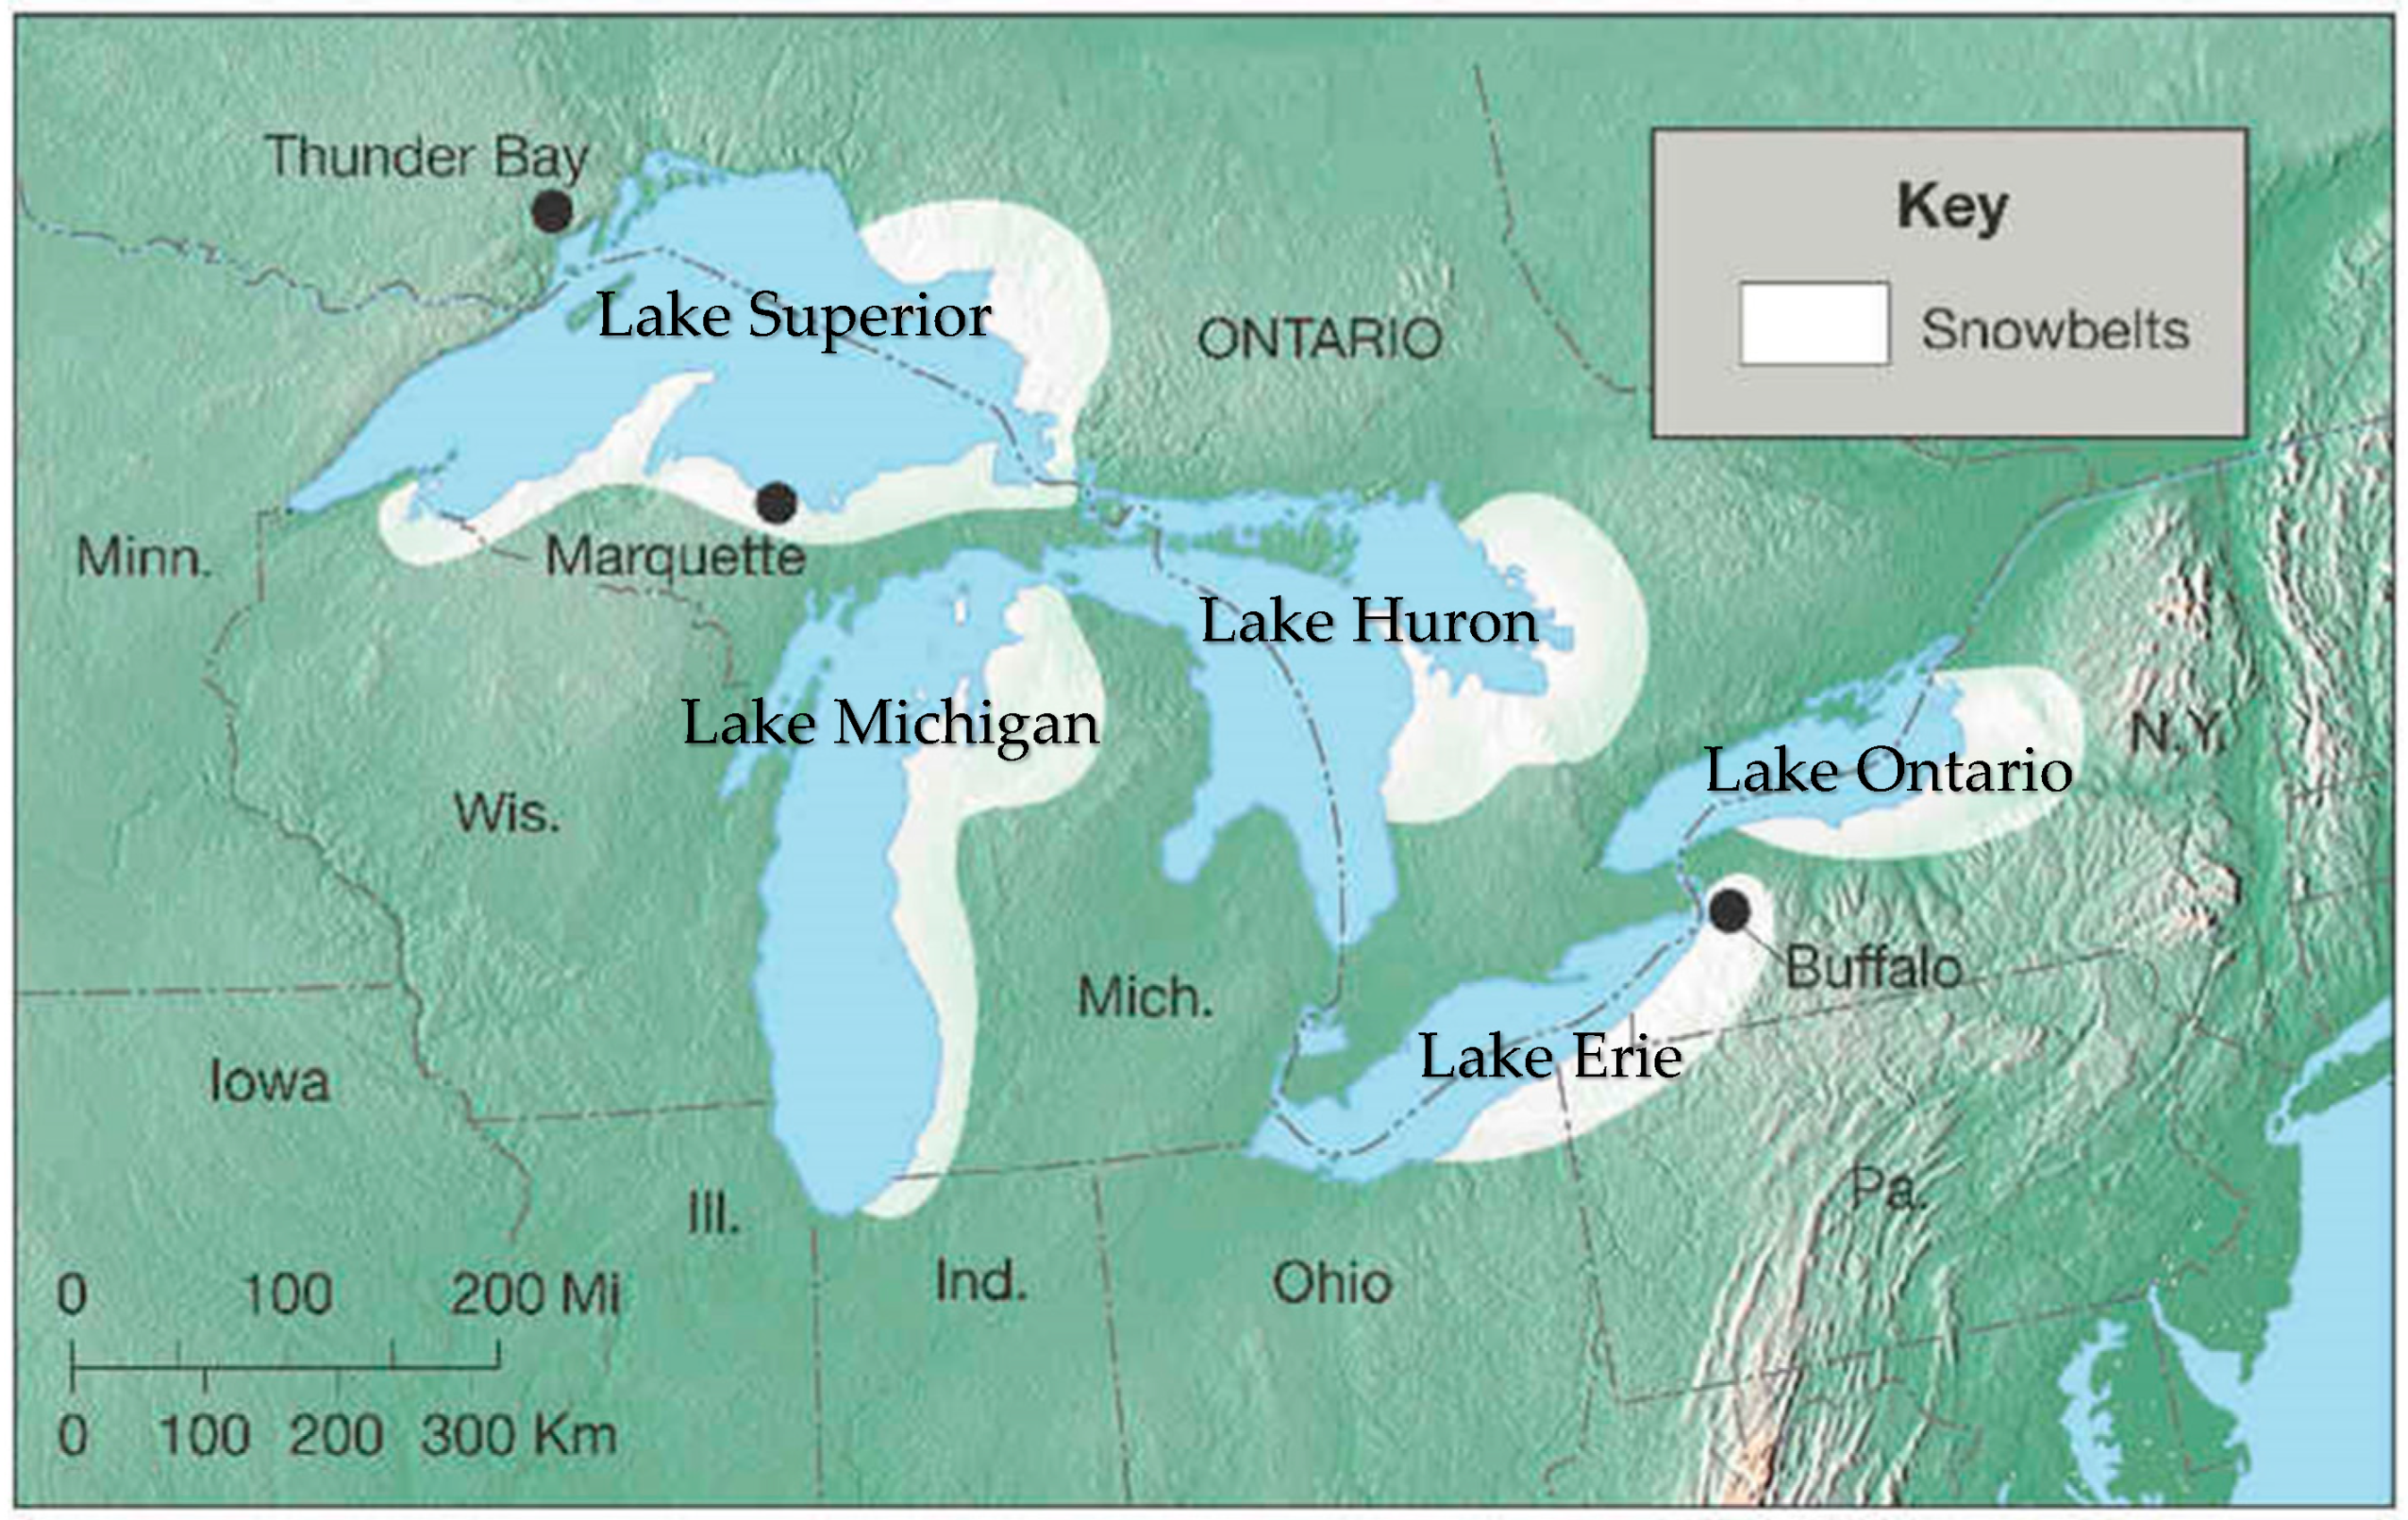
Figure 1. North American Great Lakes Snowbelt region highlighting areas that are affected by LES every winter. Image taken from Dept. of Geography at Hunter College, City University of New York.
Climate 09 00043 g001
Figure 2. From Figure 4 of [25] showing the typical synoptic scale patterns conducive to LES formation. Left shows sea level pressure (mb) and right shows 850-mb height (m, solid) and 850-mb temperature (°C, dashed).
Climate 09 00043 g002
Figure 3. Counties used to identify LES cases from the NOAA Storm Events Database. Counties highlighted in blue were used for identifying Lake Michigan cases and the red counties were used for the Lake Superior cases.
Climate 09 00043 g003
Figure 4. Scatterplot of the first two PC loading vectors for Lake Michigan (left) and Lake Superior (right).
Climate 09 00043 g004
Figure 5. Seasonal distribution of LES cases among different clusters for Lake Michigan (top) and Lake Superior (bottom).
Climate 09 00043 g005
Figure 6. Domain configuration for the WRF-ARW simulations. Spatial resolutions for the parent domain and the nested domain (d02) were 12 and 4 km, respectively.
Climate 09 00043 g006
Figure 7. Lake Michigan 500 mb geopotential height (contours; m) and mean sea-level pressure (MSLP) (shaded; mb) composites at t = 0 h for Cluster 1 (a), Cluster 2 (c), Cluster 3 (e), and Cluster 4 (g) and t = 42 h for Cluster 1 (b), Cluster 2 (d), Cluster 3 (f), and Cluster 4 (h).
Climate 09 00043 g007
Figure 8. WRF-ARW simulated enthalpy flux (W m−2)/10-m surface winds (m s−1) for Cluster 1 (a), Cluster 2 (c), Cluster 3 (e), and Cluster 4 (g); Surface-850 lapse rate (°C km−1)/925 mb winds (m s−1) for Cluster 1 (b), Cluster 2 (d), Cluster 3 (f), and Cluster 4 (h). Simulations taken form peak LES activity. A half and full wind bard represents 5 and 10 m s−1, respectively.
Climate 09 00043 g008
Figure 9. Average Pearson correlation coefficients between each listed spatial field for all four Lake Michigan clusters.
Climate 09 00043 g009
Figure 10. Lake Superior 500 mb geopotential height (contours; m) and mean sea-level pressure (MSLP) (shaded; mb) composites at t = 0 h for Cluster 1 (a), Cluster 2 (c), and Cluster 3 (e) and t = 42 h for Cluster 1 (b), Cluster 2 (d), and Cluster 3 (f).
Climate 09 00043 g010
Figure 11. WRF-ARW simulated enthalpy flux (W m−2)/10-m surface winds (m s−1) and for Cluster 1 (a), Cluster 2 (c), and Cluster 3 (e); surface-850 lapse rate (°C km−1)/925 mb winds (m s−1) during peak LES activity for Cluster 1 (b), Cluster 2 (d), and Cluster 3 (f). A half and full wind bard represents 5 and 10 m s−1, respectively.
Climate 09 00043 g011
Figure 12. Average Pearson correlation coefficients between each listed spatial field for all three Lake Superior clusters.
Climate 09 00043 g012
Table 1. Variance explained for each of the PCs 2 through 6 and silhouette coefficients while using four clusters for Lake Michigan.
PC 2PC 3PC 4PC 5PC 6
Individual Variance Explained9.17%7.69%5.91%4.95%4.59%
Cumulative Variance Explained19.68%27.37%33.28%38.23%42.82%
Silhouette Coefficient Using Four Clusters0.370.300.240.200.16
Table 2. Same as Table 1, but for Lake Superior.
PC 2PC 3PC 4PC 5PC 6
Individual Variance Explained8.79%7.61%5.34%4.99%4.25%
Cumulative Variance Explained21.51%29.12%34.46%39.45%43.70%
Silhouette Coefficient Using Three Clusters0.400.260.220.200.16
Table 3. Test cases used for WRF-ARW simulations for Lake Michigan.
Cluster 1Cluster 2Cluster 3Cluster 4
Event Start2014-01-02 6:30 CST2008-01-24 0:00 EST1997-11-15 18:00 EST2008-02-27 17:00 EST
Event End2014-01-03 0:00 CST2008-01-24 15:00 EST1997-11-16 10:00 EST2008-02-28 18:00 EST
Duration17.5 h15 h16 h25 h
Silhouette Coefficient0.620.580.590.63
Highest Snowfall Total Recorded (in.)13.78.6189
WRF-ARW Simulation Duration48 h48 h48 h48 h
Table 4. Test cases used for WRF-ARW simulations for Lake Superior.
Cluster 1Cluster 2Cluster 3
Event Start2005-12-10 20:00 EST2005-12-30 10:00 EST2008-01-21 15:00 CST
Event End2005-12-11 18:00 EST2005-12-31 7:00 EST2008-01-23 0:00 CST
Duration22 h21 h33 h
Silhouette Coefficient0.590.640.61
Highest Snowfall Total
Recorded (in.)
111212
WRF-ARW Simulation Duration48 h48 h48 h
Table 5. WRF-ARW parameterizations used for this study (same as [27]).
ParameterizationScheme/Model
MicrophysicsGoddard microphysics scheme [43]
Planetary Boundary LayerMellor-Yamada-Janjic [44]
Land Surface ModelNoah Land Surface Model [45]
Shortwave Radiation PhysicsDudhia shortwave scheme [46]
Longwave Radiation PhysicsRapid Radiative Transfer Model [47]
Cumulus SchemeKain-Fritsch * [48]
Surface Layer PhysicsEta similarity [49]
* No cumulus scheme was used for the 4 km nested domain.
Publisher’s Note: MDPI stays neutral with regard to jurisdictional claims in published maps and institutional affiliations.