Hydro-Meteorological Trends in an Austrian Low-Mountain Catchment
Abstract
:1. Introduction
2. Materials and Methods
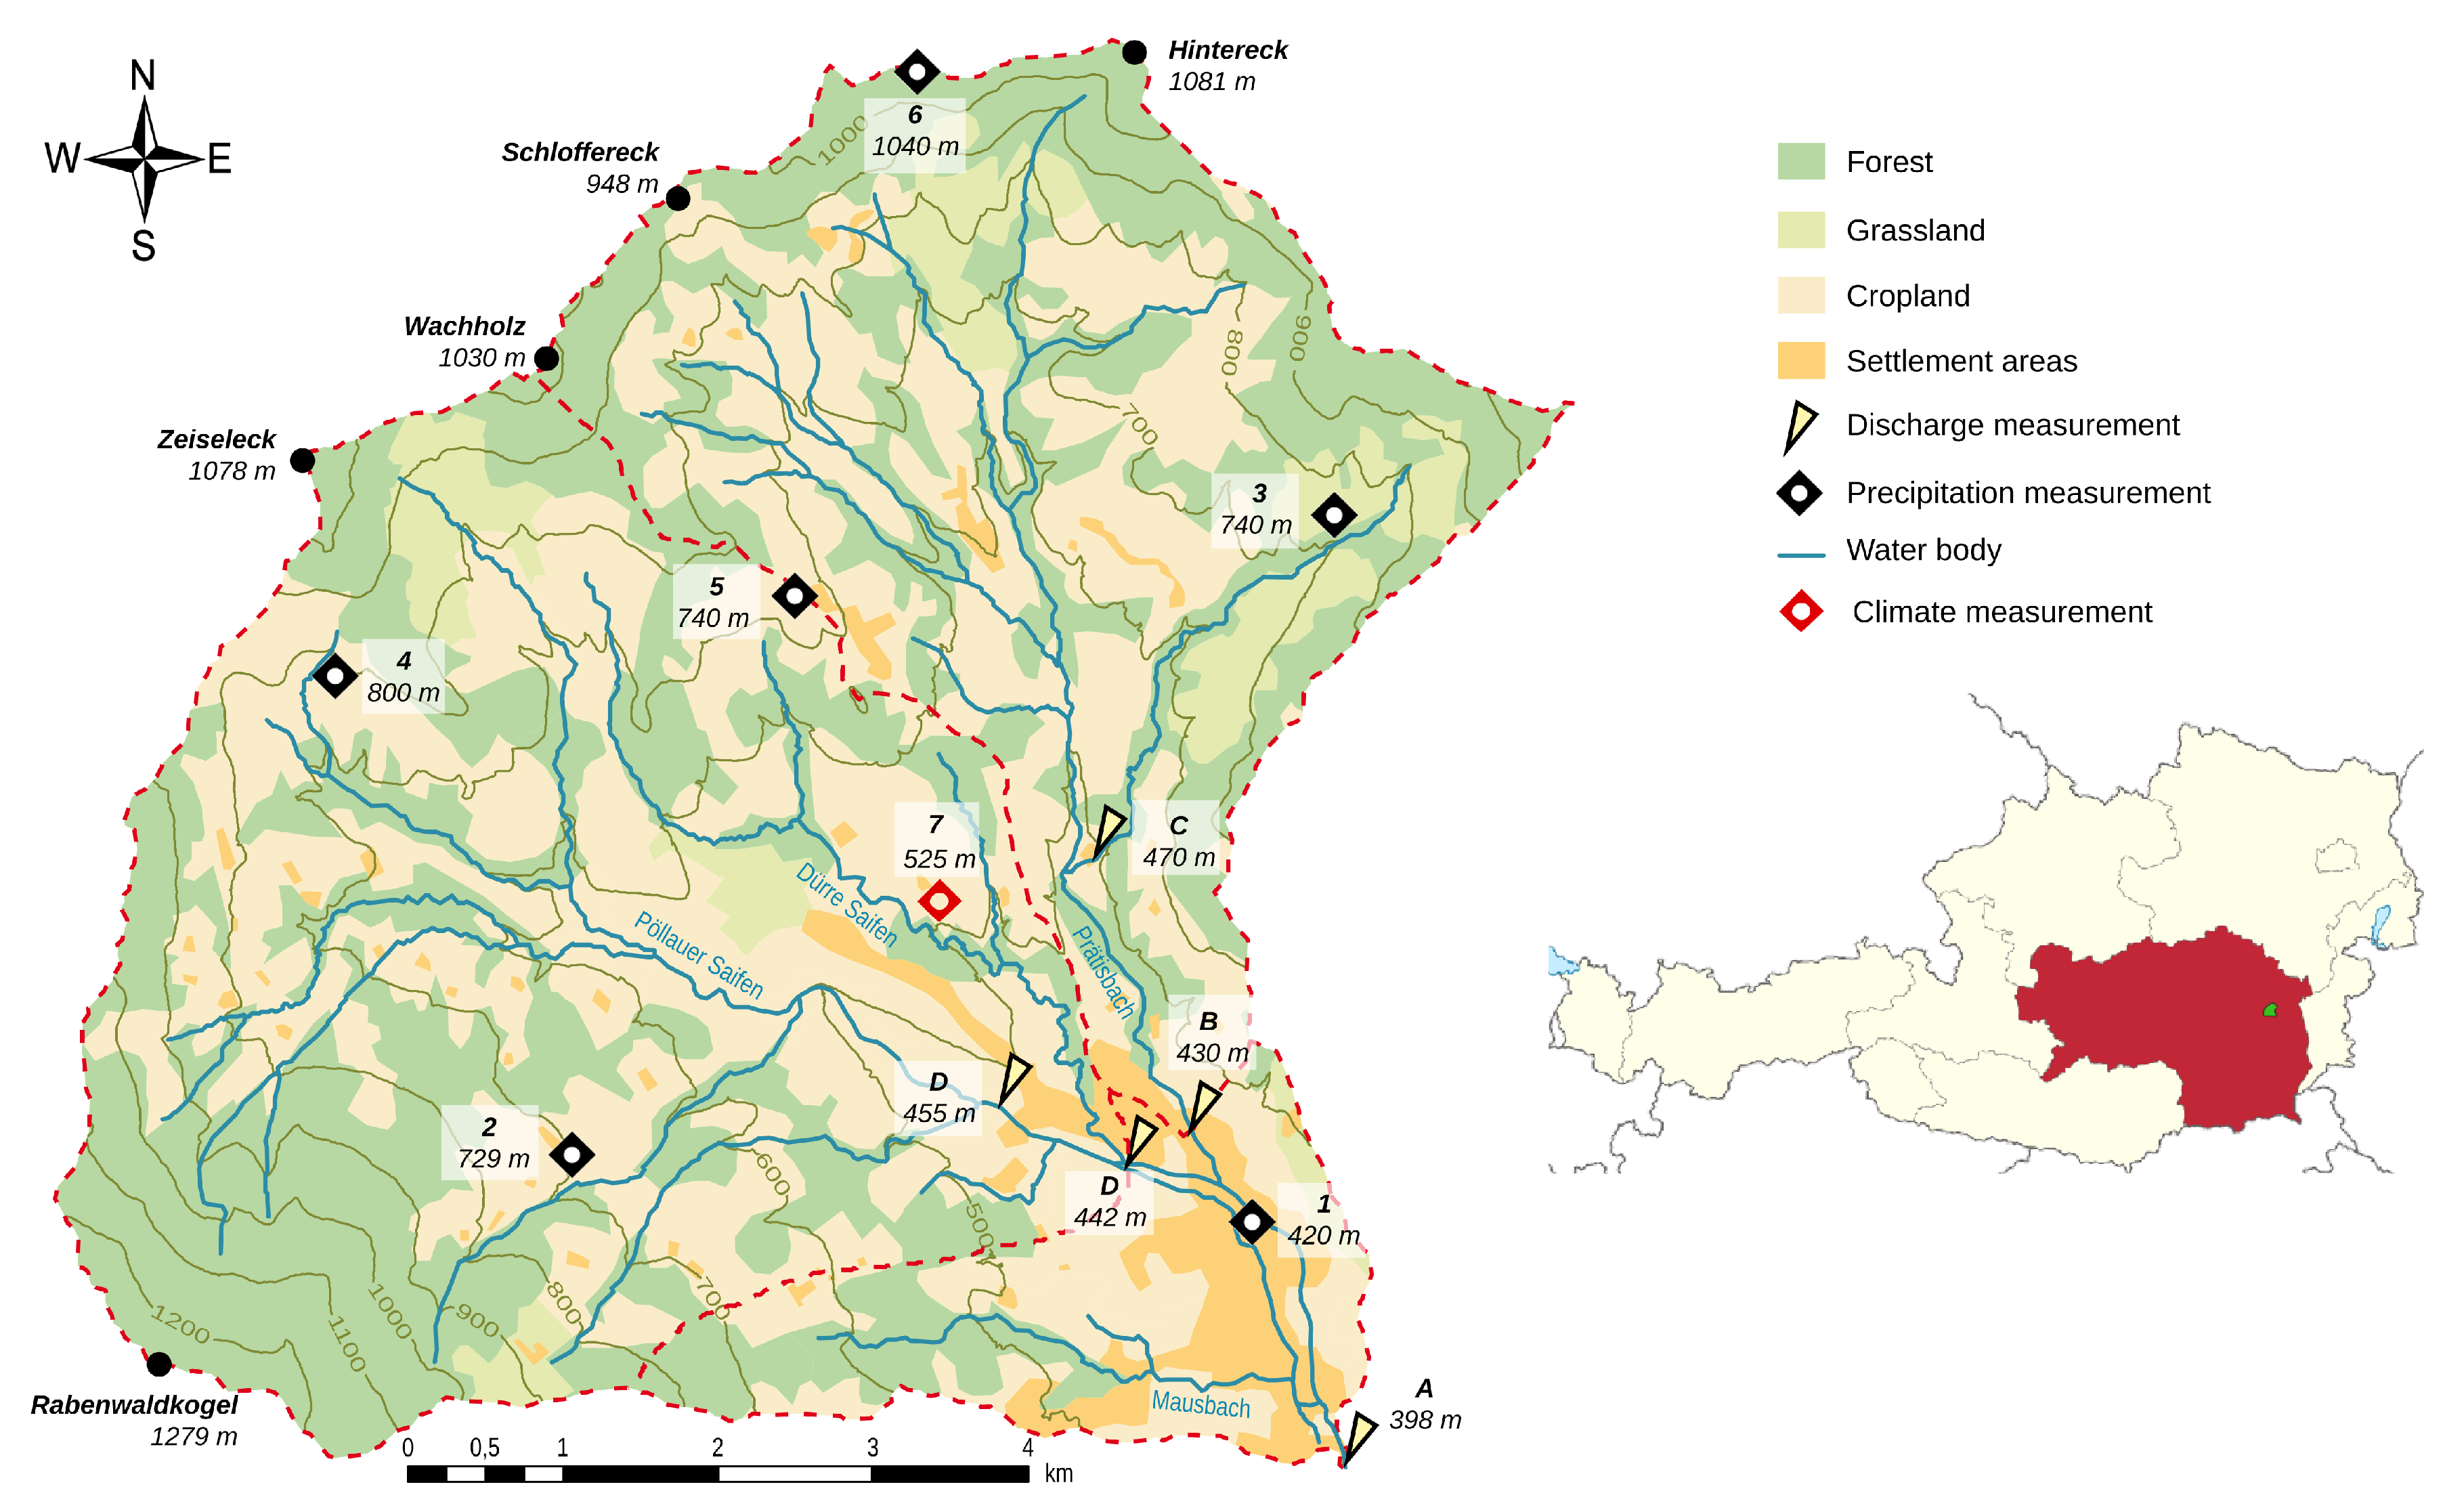
2.1. Hydrological Research Catchment Pöllau
2.2. Data
2.3. Data Validation
2.4. Data Analysis
3. Results
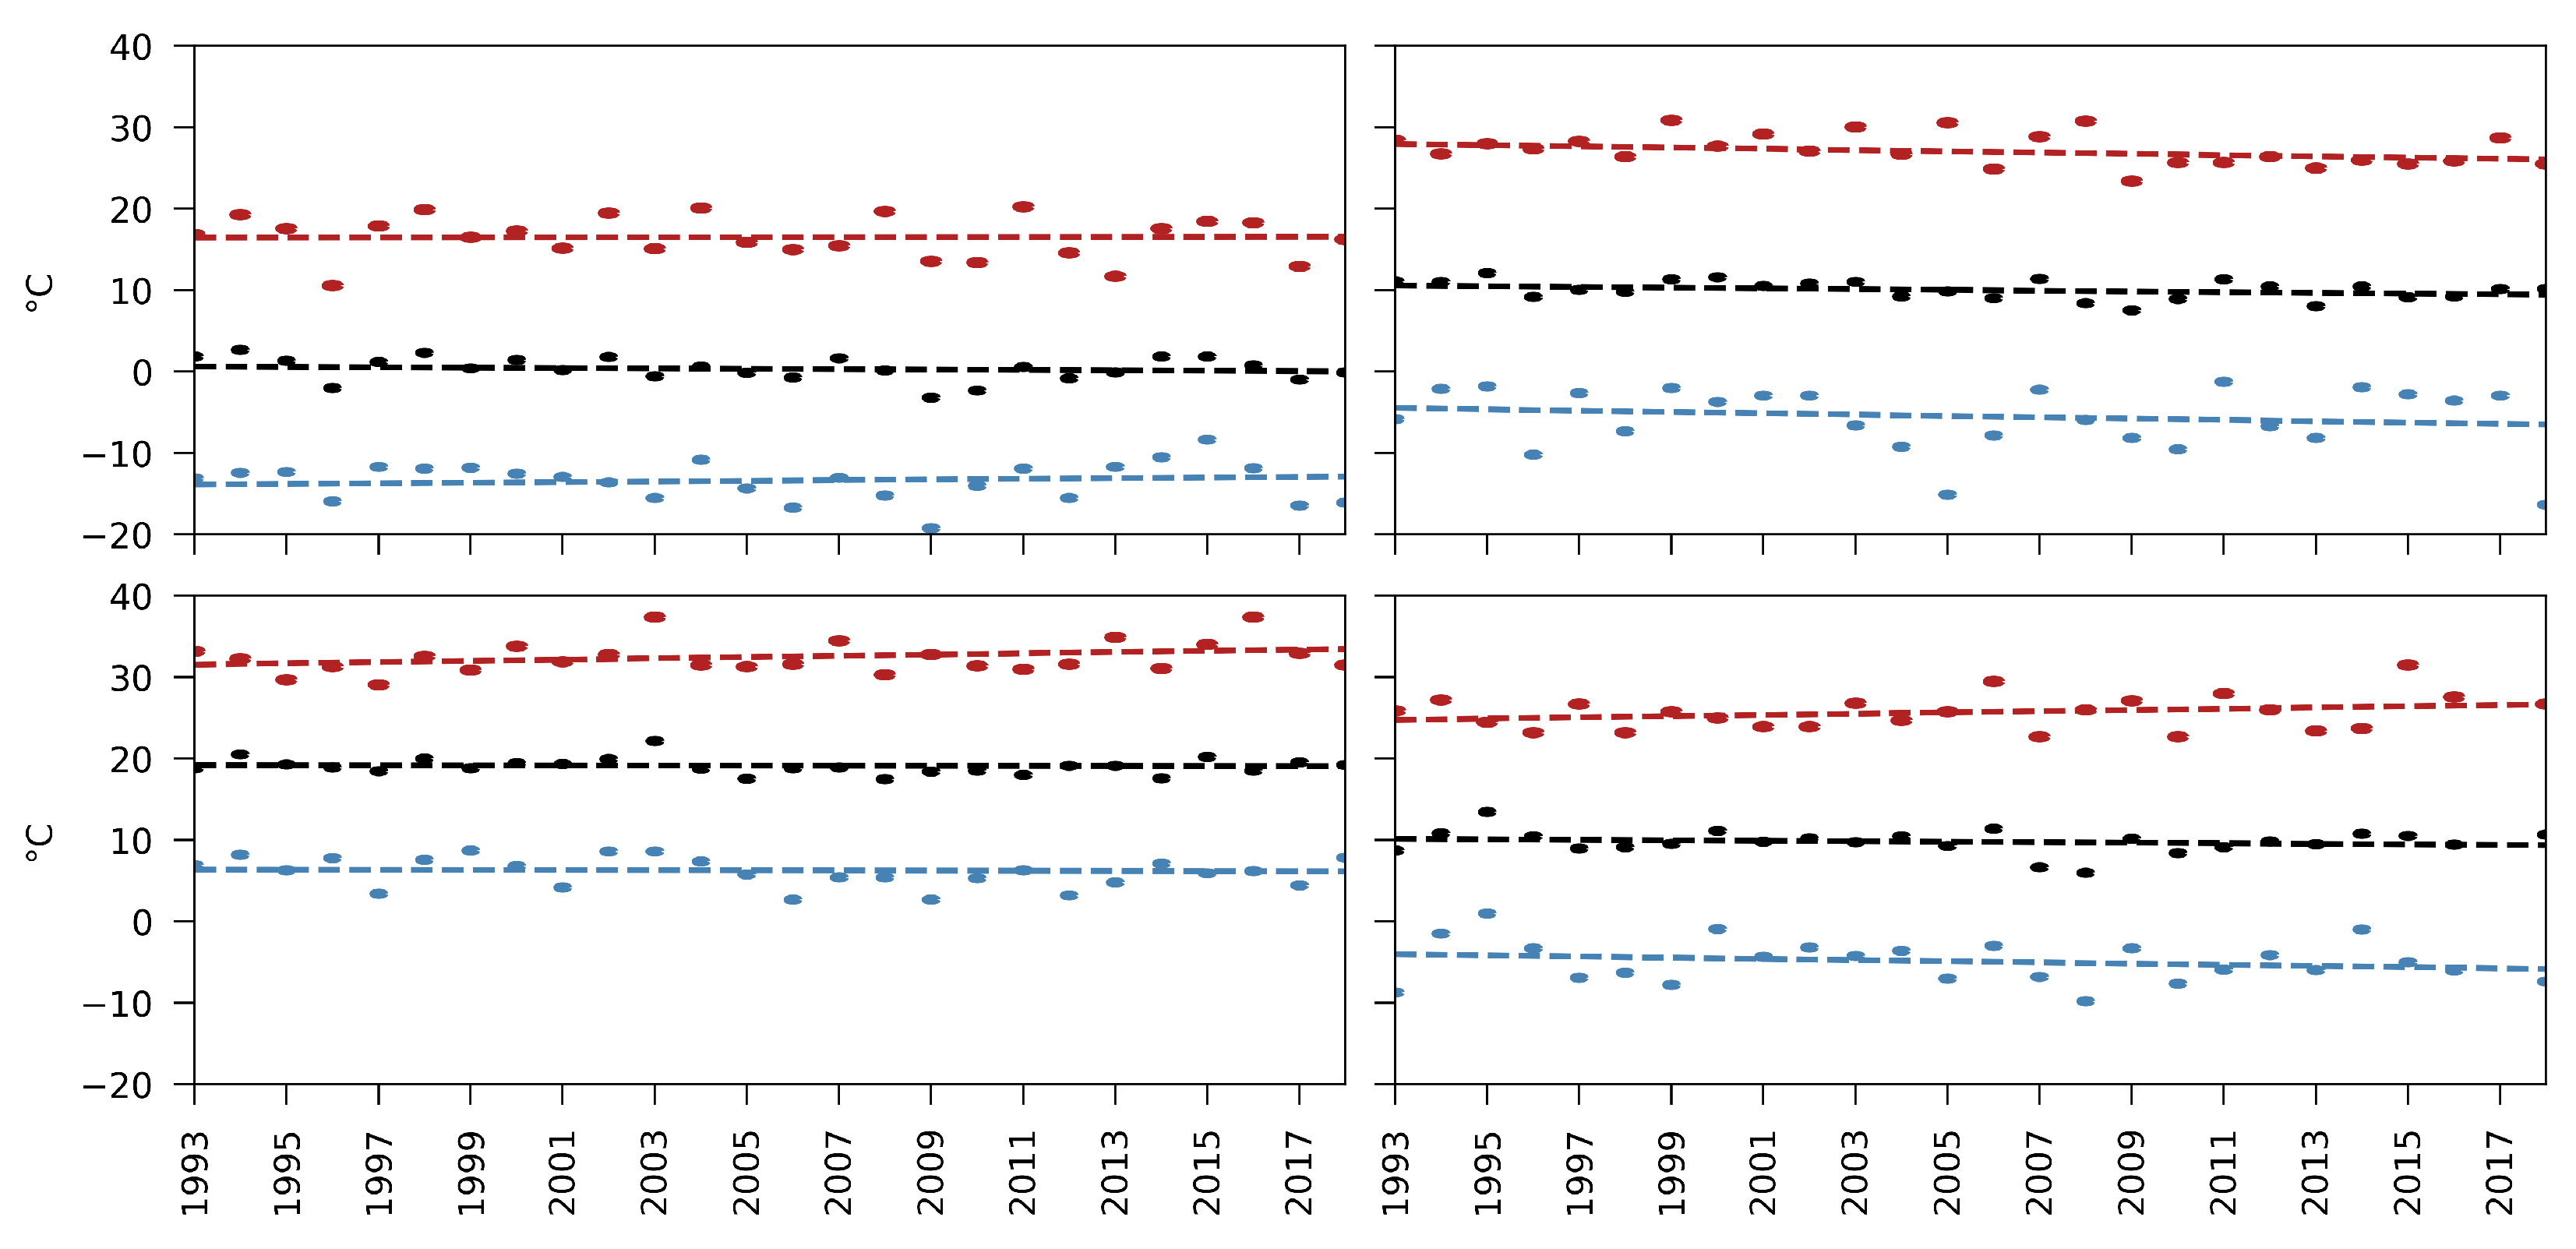
3.1. Temperature Trends
3.2. Precipitation Trends
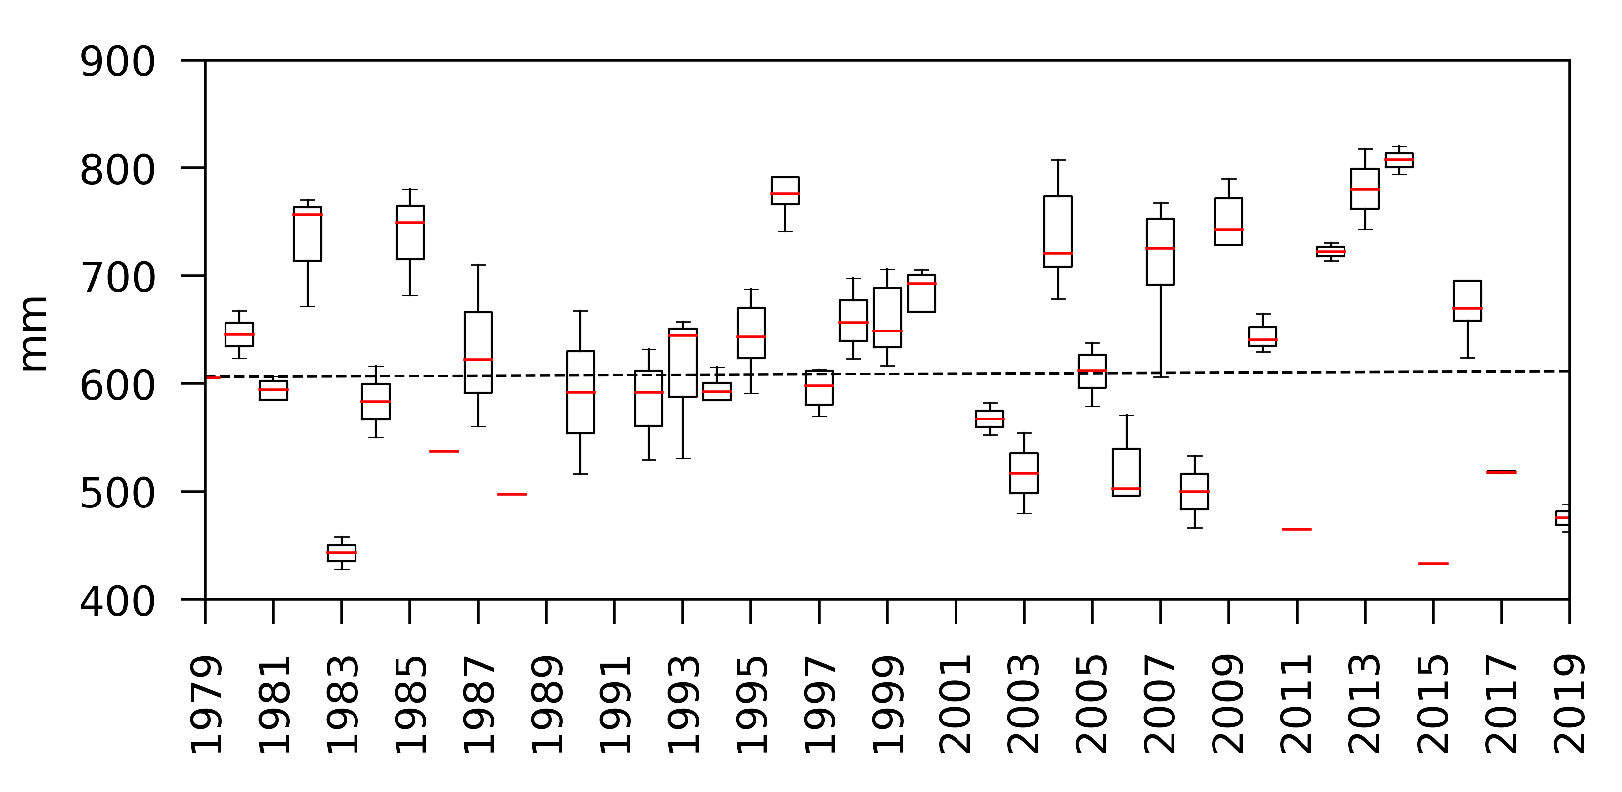
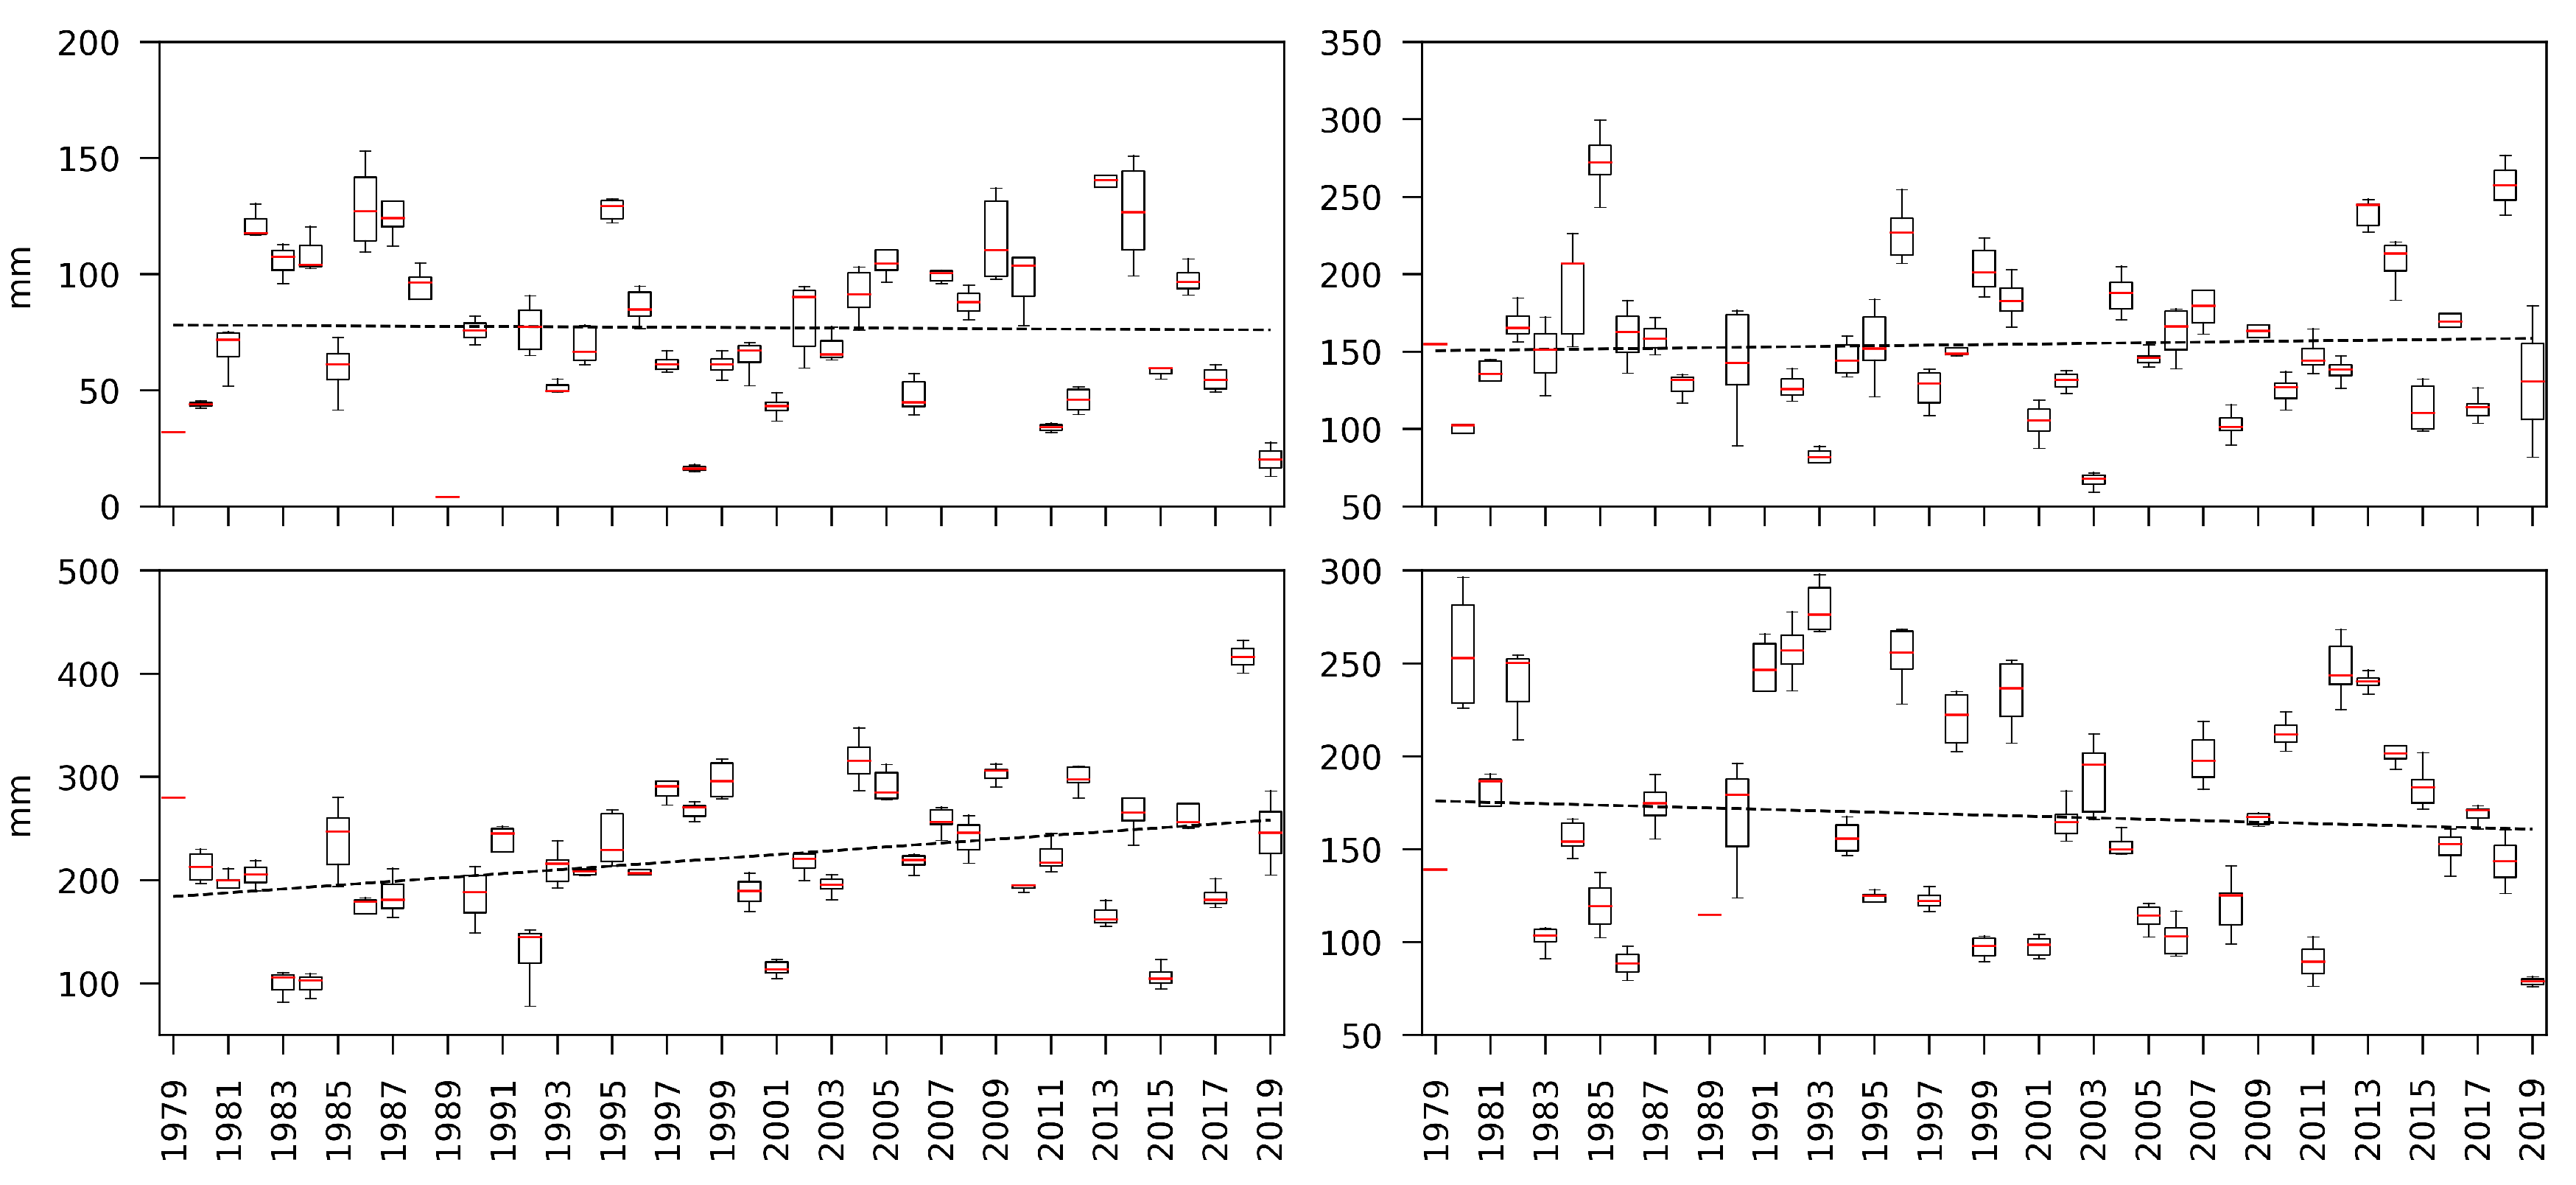
3.2.1. Precipitation Depth
3.2.2. Wet Days
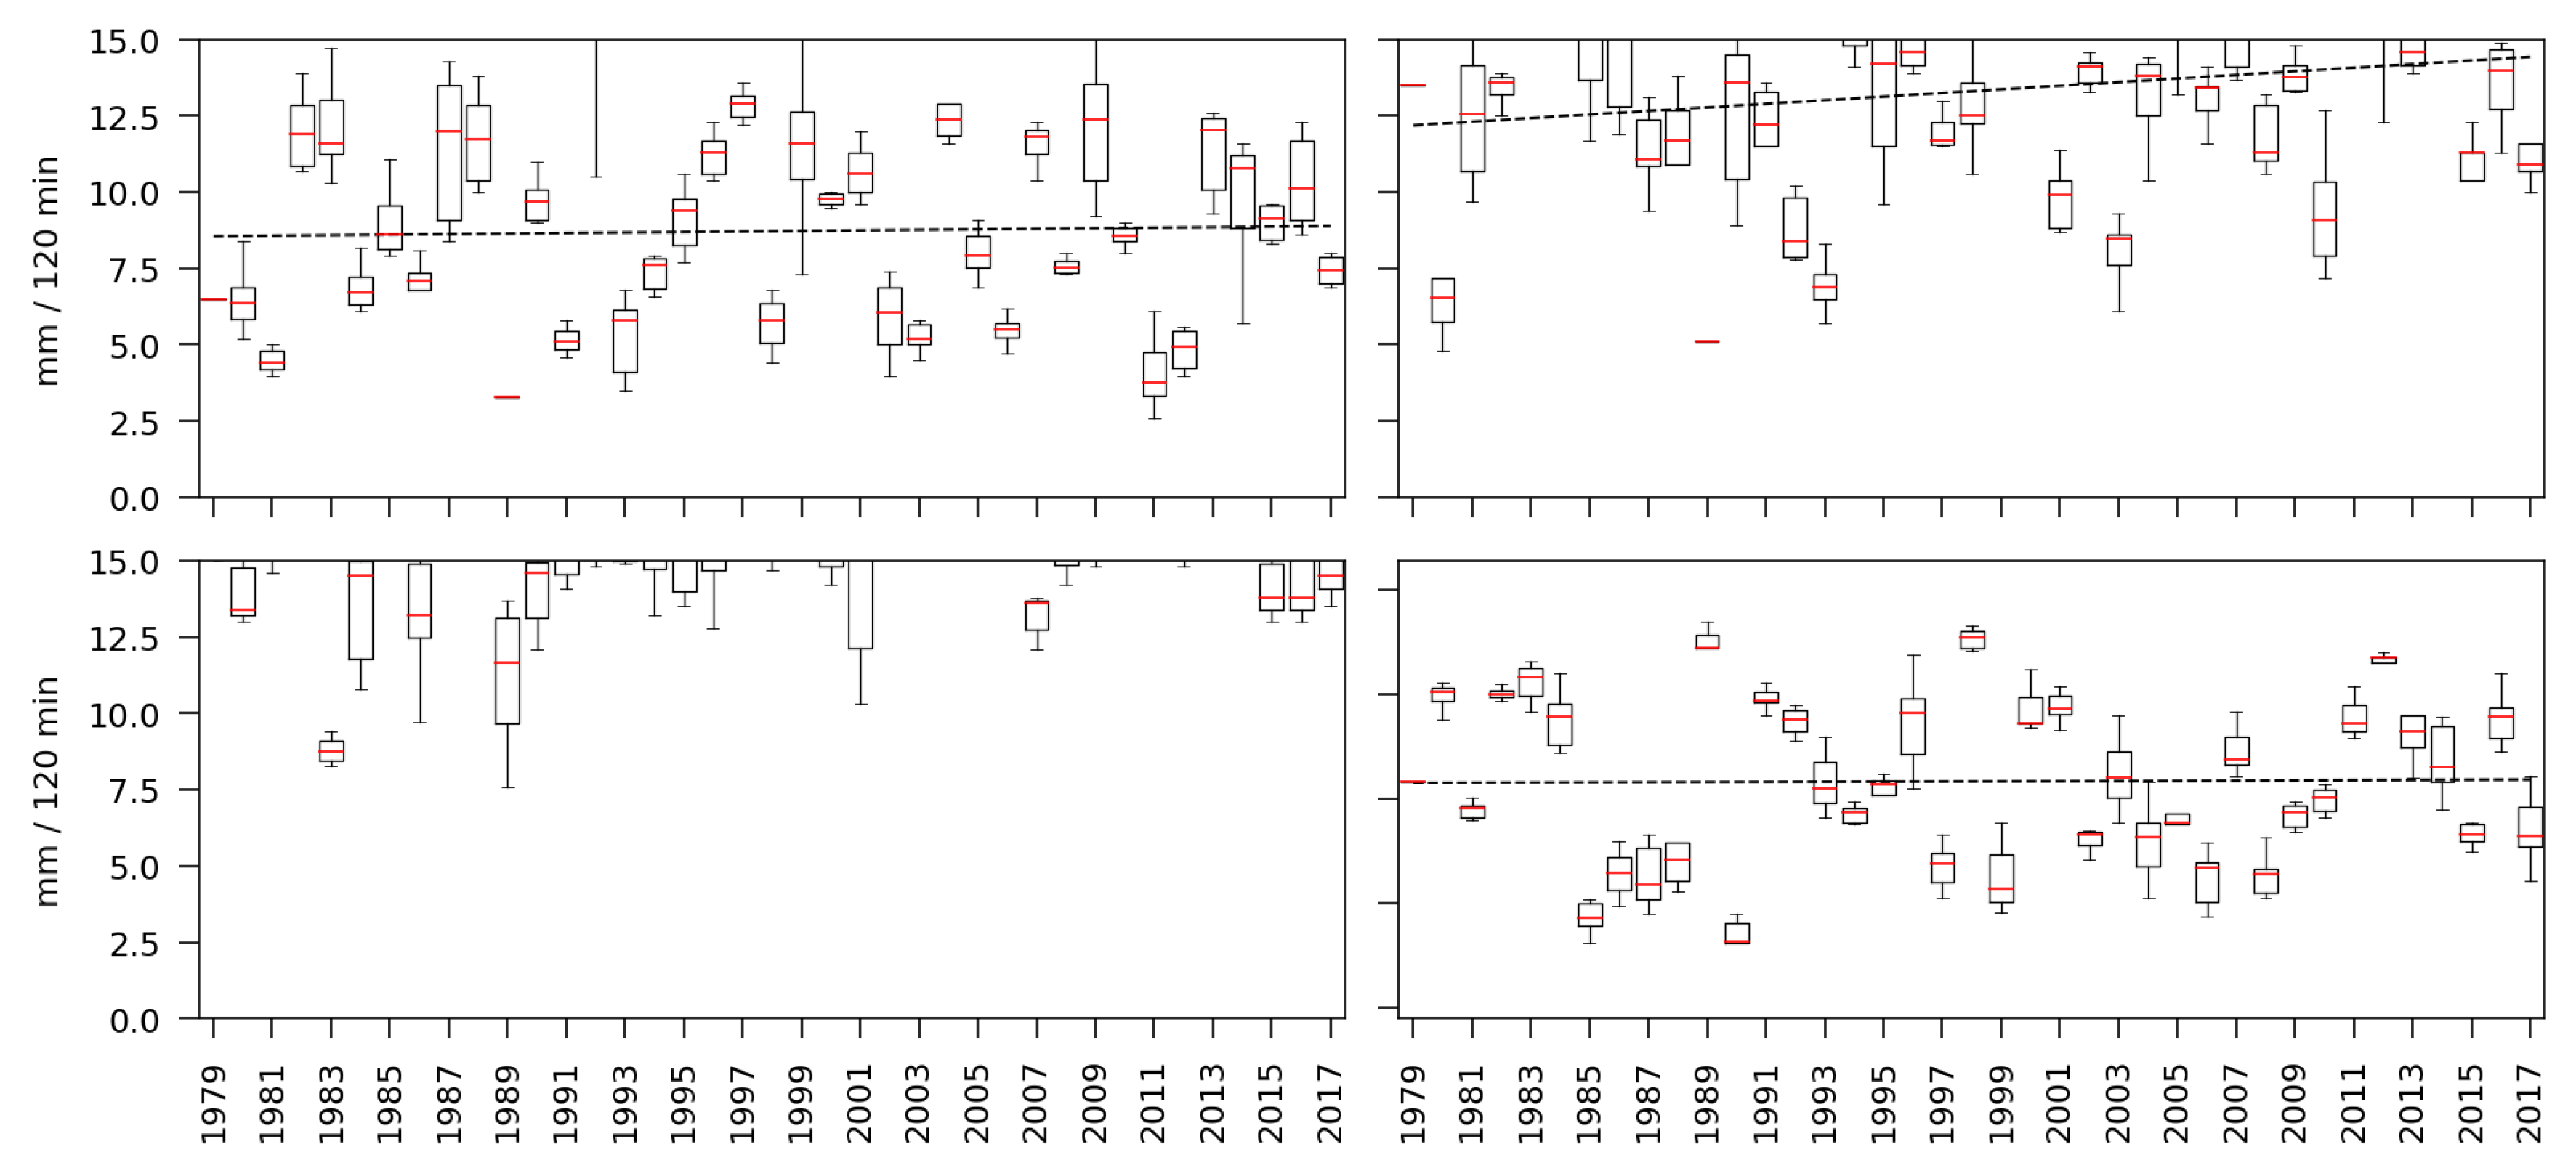
3.2.3. Precipitation Intensities
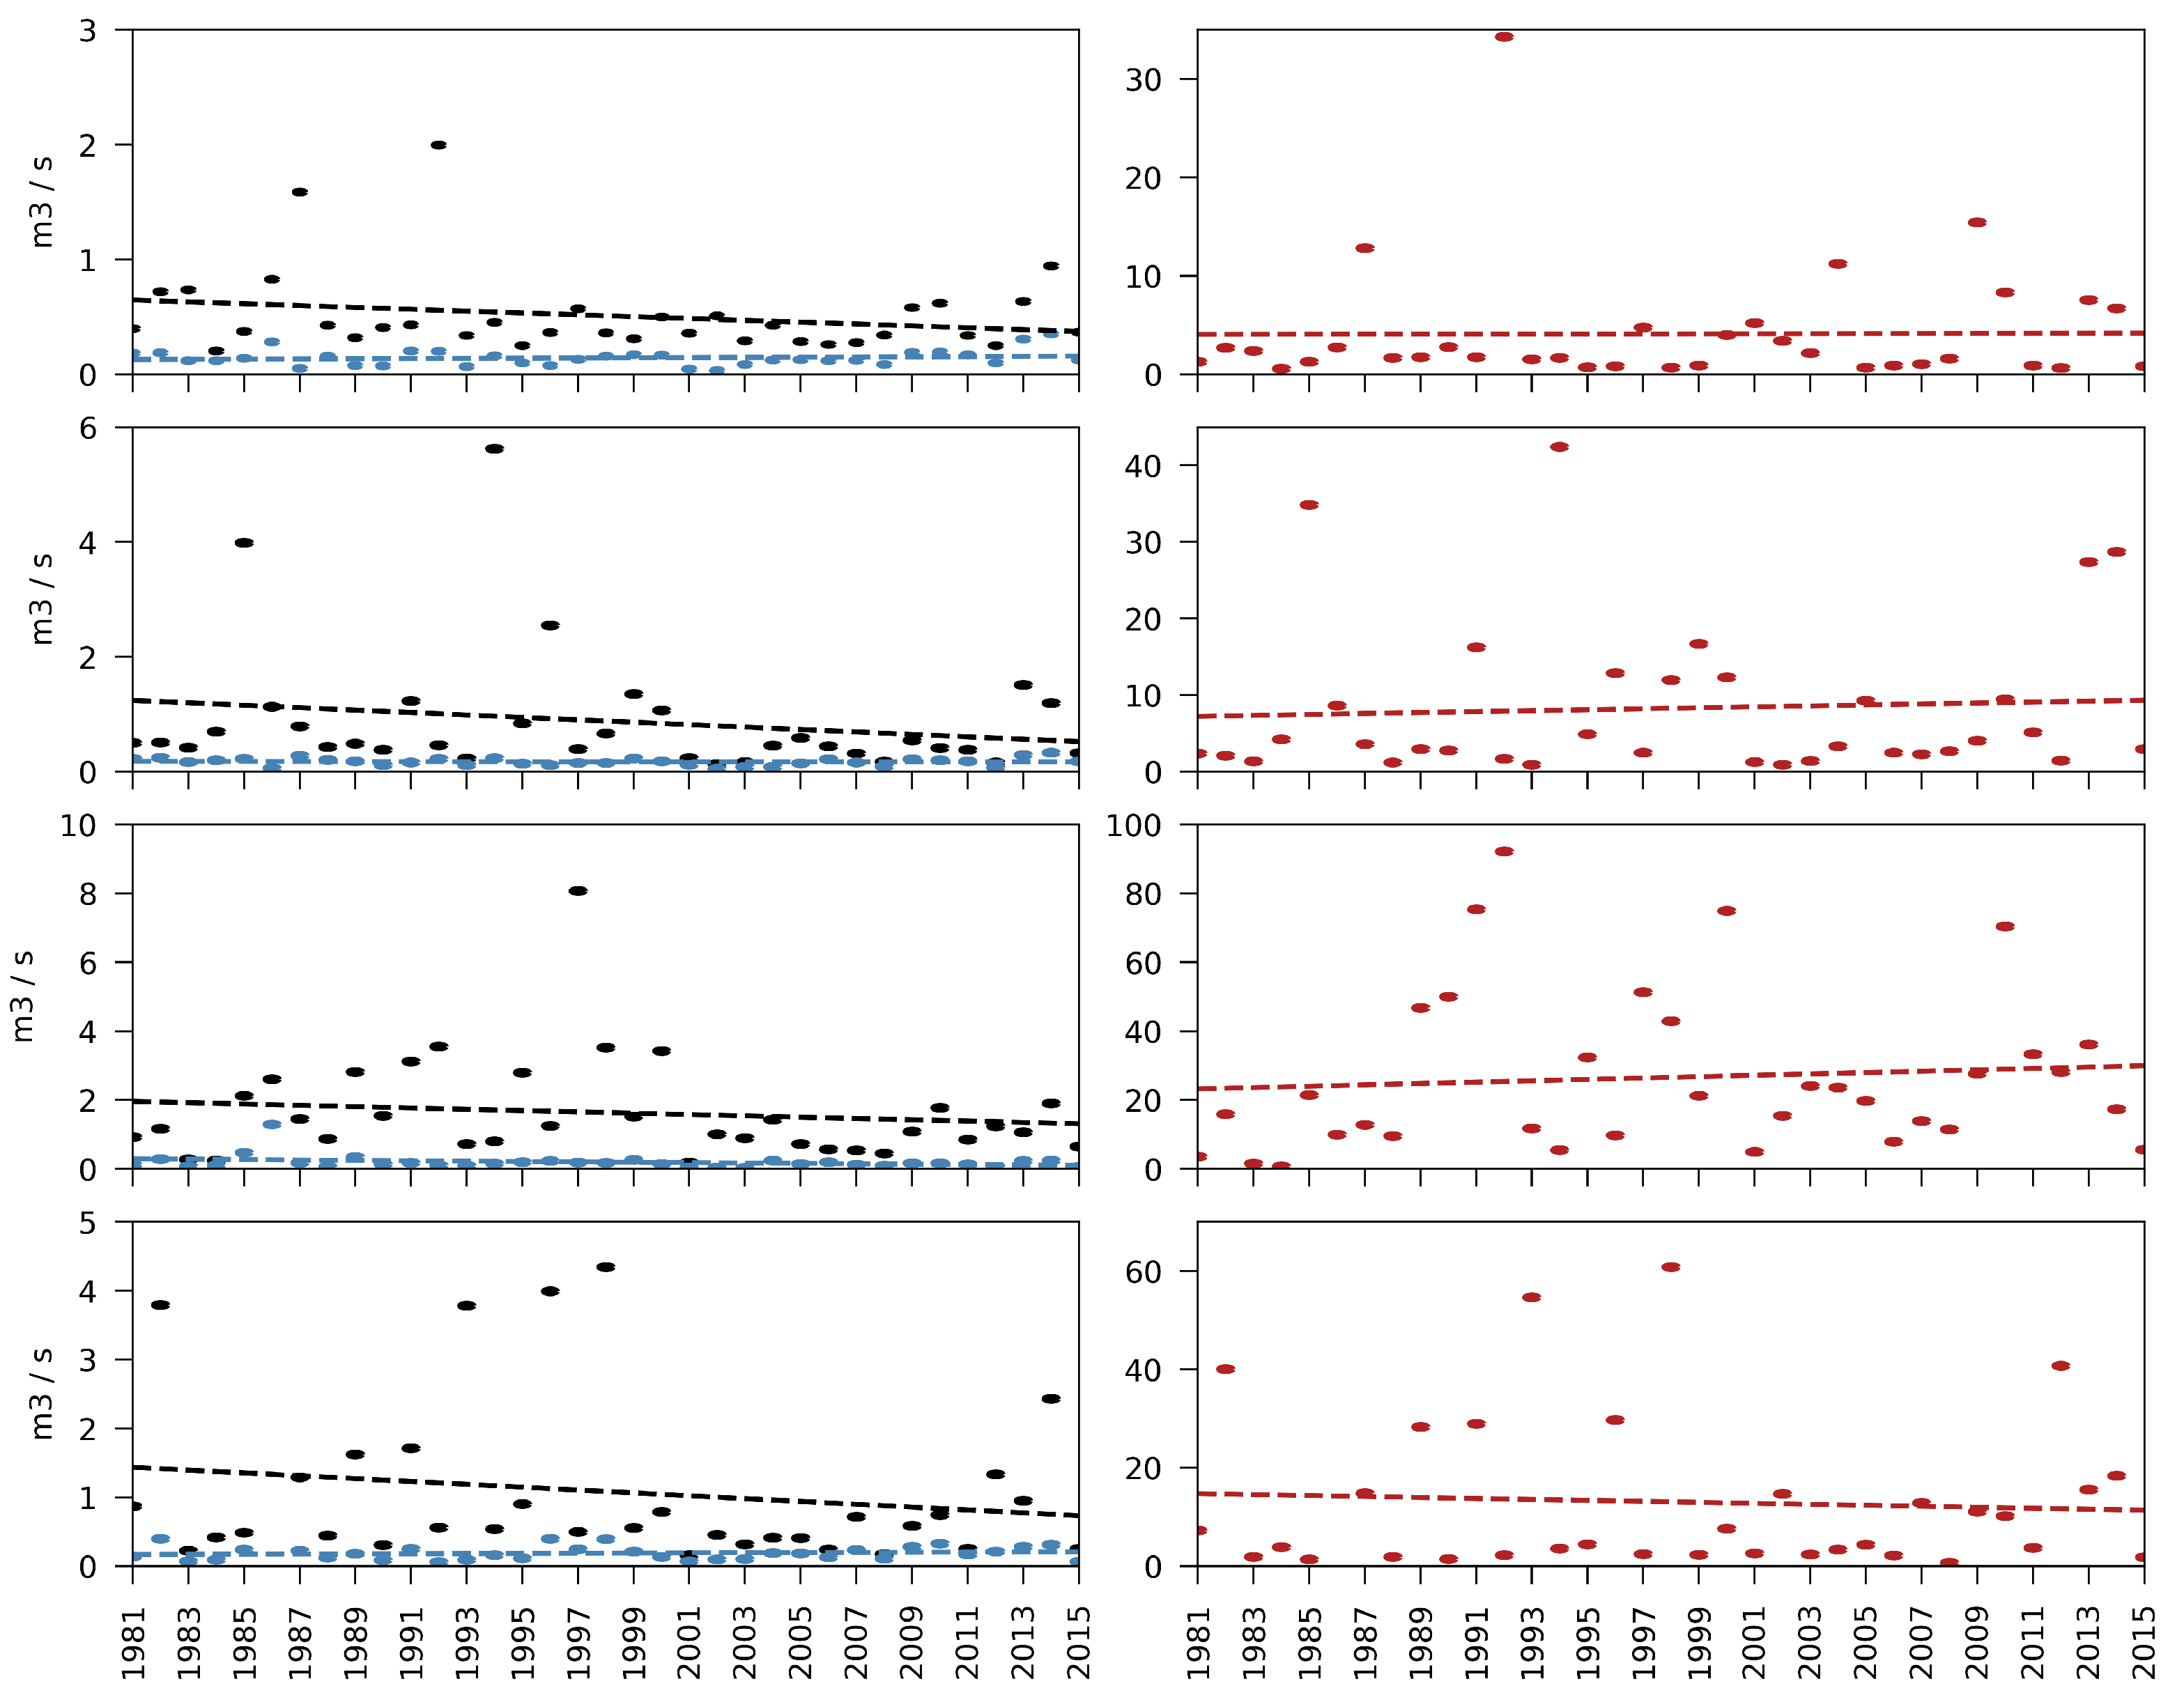
3.3. River Flow Trends
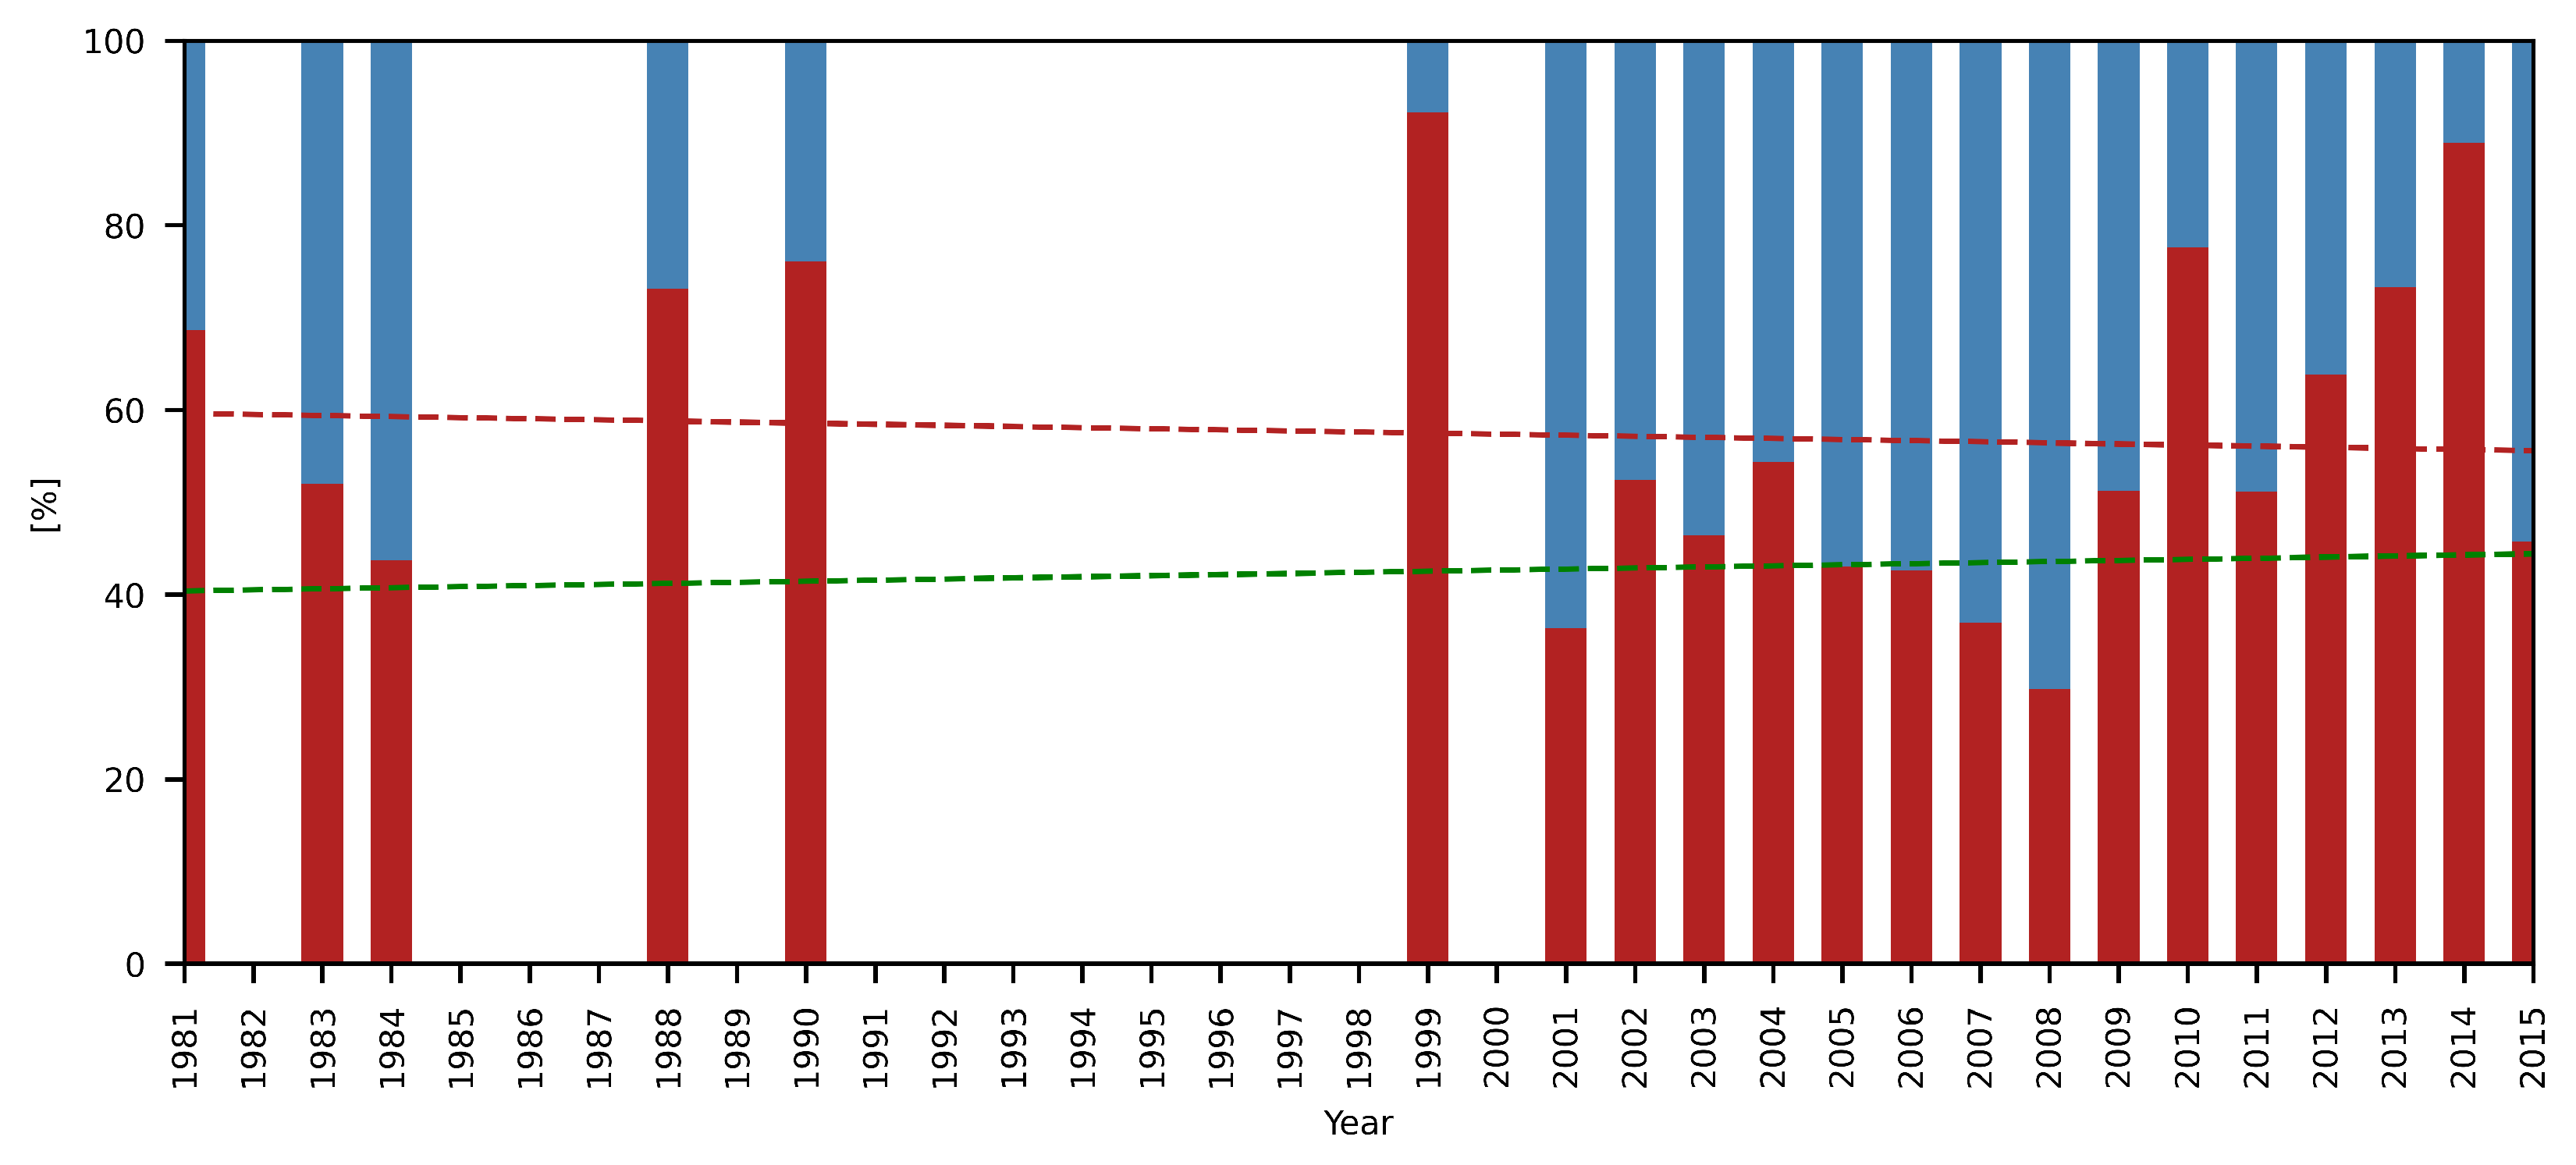
3.4. Water Balance and Evapotranspiration
4. Discussion
5. Conclusions
- The decreasing trend of long-term mean annual temperatures in the catchments shows that climate change impacts can vary at the regional scale.
- The observed precipitation trends are in line with large-scale assessments, including the study catchment. However, precipitation recordings during the cold season were hampered by missing rain scale heaters. For a full assessment of precipitation developments and especially seasonal changes, heated rain scales should be used.
- Climate data observations such as global radiation, relative humidity, wind speed or soil moisture are of substantial importance to assess the drivers for the change in climate variables. Thus, a comprehensive monitoring is required to assess not only if but also why climate variables are changing.
- The impact of increasing precipitation intensities is seen in larger river flow maxima during spring and summer.
- Actual catchment evapotranspiration (AET) remained constant, while potential catchment evapotranspiration (PET) increased 1981–2019. It is to be noted that AET was computed based on river runoff that was not fully available for a significant number of years, hampering the assessment.
- The analysis of hydro-meteorological variable trends can be supported by numerical modeling approaches to evaluate the variations in hydrological and meteorological processes in more detail. This numerical assessment is currently conducted for the catchment Pöllau.
Author Contributions
Funding
Institutional Review Board Statement
Informed Consent Statement
Data Availability Statement
Acknowledgments
Conflicts of Interest
References
- IPCC. Climate Change 2014: Synthesis Report. Contribution of Working Groups I, II and III to the Fifth Assessment Report of the Intergovernmental Panel on Climate Change; Technical Report; IPCC: Geneva, Switzerland, 2014. [Google Scholar]
- IPCC. Global Warming of 1.5 °C. An IPCC Special Report on the Impacts of Global Warming of 1.5 °C above Pre-Industrial Levels and Related Global Greenhouse Gas Emission Pathways, in the Context of Strengthening the Global Response to the Threat of Climate Change, Sustainable Development, and Efforts to Eradicate Poverty; OCLC: 1056192590; Technical Report; IPCC: Geneva, Switzerland, 2018. [Google Scholar]
- IPCC. Climate Change 2013: The Physical Science Basis. Contribution of Working Group I to the Fifth Assessment Report of the Intergovernmental Panel on Climate Change; Reporter: IPCC; Technical Report; Cambridge University Press: Cambridge, UK; New York, NY, USA, 2013. [Google Scholar]
- USGCRP. Climate Science Special Report: Fourth National Climate Assessment, Volume I; Technical Report; U.S. Global Change Research Program: Washington, DC, USA, 2017.
- Steger, C.; Kotlarski, S.; Jonas, T.; Schär, C. Alpine snow cover in a changing climate: A regional climate model perspective. Clim. Dyn. 2013, 41, 735–754. [Google Scholar] [CrossRef] [Green Version]
- Olefs, M.; Koch, R.; Schöner, W.; Marke, T. Changes in Snow Depth, Snow Cover Duration, and Potential Snowmaking Conditions in Austria, 1961–2020—A Model Based Approach. Atmosphere 2020, 11, 1330. [Google Scholar] [CrossRef]
- Bender, E.; Lehning, M.; Fiddes, J. Changes in Climatology, Snow Cover, and Ground Temperatures at High Alpine Locations. Front. Earth Sci. 2020, 8, 100. [Google Scholar] [CrossRef]
- Gardner, A.S.; Moholdt, G.; Cogley, J.G.; Wouters, B.; Arendt, A.A.; Wahr, J.; Berthier, E.; Hock, R.; Pfeffer, W.T.; Kaser, G.; et al. A Reconciled Estimate of Glacier Contributions to Sea Level Rise: 2003 to 2009. Science 2013, 340, 852–857. [Google Scholar] [CrossRef] [PubMed] [Green Version]
- Brugnara, Y.; Brunetti, M.; Maugeri, M.; Nanni, T.; Simolo, C. High-resolution analysis of daily precipitation trends in the central Alps over the last century. Int. J. Climatol. 2012, 32, 1406–1422. [Google Scholar] [CrossRef]
- Brunetti, M.; Maugeri, M.; Nanni, T.; Auer, I.; Böhm, R.; Schöner, W. Precipitation variability and changes in the greater Alpine region over the 1800–2003 period. J. Geophys. Res. Atmos. 2006, 111. [Google Scholar] [CrossRef]
- Trenberth, K. Changes in precipitation with climate change. Clim. Res. 2011, 47, 123–138. [Google Scholar] [CrossRef] [Green Version]
- Arnell, N.W.; Gosling, S.N. The impacts of climate change on river flow regimes at the global scale. J. Hydrol. 2013, 486, 351–364. [Google Scholar] [CrossRef]
- Blöschl, G.; Hall, J.; Parajka, J.; Perdigão, R.A.P.; Merz, B.; Arheimer, B.; Aronica, G.T.; Bilibashi, A.; Bonacci, O.; Borga, M.; et al. Changing climate shifts timing of European floods. Science 2017, 357, 588–590. [Google Scholar] [CrossRef] [Green Version]
- Blöschl, G.; Viglione, A.; Merz, R.; Parajka, J.; Salinas, J.L.; Schöner, W. Auswirkungen des Klimawandels auf Hochwasser und Niederwasser. Österreichische Wasser und Abfallwirtschaft 2011, 63, 21–30. [Google Scholar] [CrossRef]
- Luterbacher, J.; Dietrich, D.; Xoplaki, E.; Grosjean, M.; Wanner, H. European Seasonal and Annual Temperature Variability, Trends, and Extremes Since 1500. Science 2004, 303, 1499–1503. [Google Scholar] [CrossRef] [PubMed] [Green Version]
- Hu, Z.; Chen, X.; Chen, D.; Li, J.; Wang, S.; Zhou, Q.; Yin, G.; Guo, M. “Dry gets drier, wet gets wetter”: A case study over the arid regions of central Asia. Int. J. Climatol. 2019, 39, 1072–1091. [Google Scholar] [CrossRef]
- Latif, M. Uncertainty in climate change projections. J. Geochem. Explor. 2011, 110, 1–7. [Google Scholar] [CrossRef] [Green Version]
- Li, L.J.; Zhang, L.; Wang, H.; Wang, J.; Yang, J.W.; Jiang, D.J.; Li, J.Y.; Qin, D.Y. Assessing the impact of climate variability and human activities on streamflow from the Wuding River basin in China. Hydrol. Process. 2007, 21, 3485–3491. [Google Scholar] [CrossRef]
- Chaouche, K.; Neppel, L.; Dieulin, C.; Pujol, N.; Ladouche, B.; Martin, E.; Salas, D.; Caballero, Y. Analyses of precipitation, temperature and evapotranspiration in a French Mediterranean region in the context of climate change. Comptes Rendus Geosci. 2010, 342, 234–243. [Google Scholar] [CrossRef]
- Girvetz, E.H.; Zganjar, C.; Raber, G.T.; Maurer, E.P.; Kareiva, P.; Lawler, J.J. Applied Climate-Change Analysis: The Climate Wizard Tool. PLoS ONE 2009, 4, e8320. [Google Scholar] [CrossRef] [Green Version]
- Cannarozzo, M.; Noto, L.V.; Viola, F. Spatial distribution of rainfall trends in Sicily (1921–2000). Phys. Chem. Earth Parts A B C 2006, 31, 1201–1211. [Google Scholar] [CrossRef]
- Blöschl, G.; Montanari, A. Climate change impacts—Throwing the dice? Hydrol. Process. 2009. [Google Scholar] [CrossRef]
- Famiglietti, J.S.; Rodell, M. Water in the Balance. Science 2013, 340, 1300–1301. [Google Scholar] [CrossRef]
- Blaschke, A.P.; Merz, R.; Parajka, J.; Salinas, J.; Blöschl, G. Auswirkungen des Klimawandels auf das Wasserdargebot von Grund- und Oberflächenwasser. Österreichische Wasser und Abfallwirtschaft 2011, 63, 31–41. [Google Scholar] [CrossRef]
- Kumar, P. Seasonal rain changes. Nat. Clim. Chang. 2013, 3, 783–784. [Google Scholar] [CrossRef]
- Zhang, S.; Hua, D.; Meng, X.; Zhang, Y. Climate change and its driving effect on the runoff in the “Three-River Headwaters” region. J. Geogr. Sci. 2011, 21, 963. [Google Scholar] [CrossRef]
- Chen, Z.; Chen, Y.; Li, B. Quantifying the effects of climate variability and human activities on runoff for Kaidu River Basin in arid region of northwest China. Theor. Appl. Climatol. 2013, 111, 537–545. [Google Scholar] [CrossRef]
- Wang, H.; Stephenson, S.R. Quantifying the impacts of climate change and land use/cover change on runoff in the lower Connecticut River Basin. Hydrol. Process. 2018, 32, 1301–1312. [Google Scholar] [CrossRef]
- McCabe, G.J.; Wolock, D.M. Temporal and spatial variability of the global water balance. Clim. Chang. 2013, 120, 375–387. [Google Scholar] [CrossRef]
- Vicente-Serrano, S.M.; Azorin-Molina, C.; Sanchez-Lorenzo, A.; Revuelto, J.; López-Moreno, J.I.; González-Hidalgo, J.C.; Moran-Tejeda, E.; Espejo, F. Reference evapotranspiration variability and trends in Spain, 1961–2011. Glob. Planet. Chang. 2014, 121, 26–40. [Google Scholar] [CrossRef] [Green Version]
- Elferchichi, A.; Giorgio, G.A.; Lamaddalena, N.; Ragosta, M.; Telesca, V. Variability of Temperature and Its Impact on Reference Evapotranspiration: The Test Case of the Apulia Region (Southern Italy). Sustainability 2017, 9, 2337. [Google Scholar] [CrossRef] [Green Version]
- Maček, U.; Bezak, N.; Šraj, M. Reference evapotranspiration changes in Slovenia, Europe. Agric. For. Meteorol. 2018, 260–261, 183–192. [Google Scholar] [CrossRef]
- Calanca, P.; Roesch, A.; Jasper, K.; Wild, M. Global Warming and the Summertime Evapotranspiration Regime of the Alpine Region. Clim. Chang. 2006, 79, 65–78. [Google Scholar] [CrossRef]
- McVicar, T.R.; Roderick, M.L.; Donohue, R.J.; Li, L.T.; Van Niel, T.G.; Thomas, A.; Grieser, J.; Jhajharia, D.; Himri, Y.; Mahowald, N.M.; et al. Global review and synthesis of trends in observed terrestrial near-surface wind speeds: Implications for evaporation. J. Hydrol. 2012, 416–417, 182–205. [Google Scholar] [CrossRef]
- Feng, H.; Zhang, M. Global land moisture trends: Drier in dry and wetter in wet over land. Sci. Rep. 2015, 5, 18018. [Google Scholar] [CrossRef]
- Maier, R.; Krebs, G.; Pichler, M.; Muschalla, D.; Gruber, G. Spatial Rainfall Variability in Urban Environments—High-Density Precipitation Measurements on a City-Scale. Water 2020, 12, 1157. [Google Scholar] [CrossRef] [Green Version]
- Kirchengast, G.; Kabas, T.; Leuprecht, A.; Bichler, C.; Truhetz, H. WegenerNet: A Pioneering High-Resolution Network for Monitoring Weather and Climate. Bull. Am. Meteorol. Soc. 2013, 95, 227–242. [Google Scholar] [CrossRef]
- Bergmann, H. Experimentelle Hydrologische Forschung in der Steiermark; Technical Report; Das Hydrologische Versuchsgebiet Pöllau: Graz, Austria, 1981. [Google Scholar]
- Bergmann, H. A Hydrological Research Basin in Austria: Planning and Aims. In Proceedings of the International Symposium On Hydrological Research Basins, Bern, Switzerland, 21–23 September 1982; pp. 23–30. [Google Scholar]
- Ruch, C.; Vasvári, V.; Harum, T. Hydrologisches Versuchsgebiet Pöllau—25 Jahre Beobachtung. Beiträge zur Hydrogeologie 2006, 55, 45–58. [Google Scholar]
- Krebs, G.; Weidemann, S.; Fuchs, R.; Muschalla, D. Hydrologisches Versuchsgebiet Pöllau—Hydrometeorologische Langzeitbetrachtungen. Wasserland Steiermark 2017, 1, 22–26. [Google Scholar]
- OTT Pluvio2—Regenmesser/Niederschlagsmesser—OTT HYDROMET CH. Available online: https://www.ott.com/de-at/produkte/meteorologie-29/ott-pluvio2-l-regenmesser-niederschlagsmesser-1520/ (accessed on 27 July 2021).
- European Environment Agency. © European Union, Copernicus Land Monitoring Service. Page, f.ex. in 2018: “© European Union, Copernicus Land Monitoring Service 2018, European Environment Agency (EEA)”. 2021. Available online: https://cds.climate.copernicus.eu/ (accessed on 27 July 2021).
- Yue, S.; Wang, C. The Mann-Kendall Test Modified by Effective Sample Size to Detect Trend in Serially Correlated Hydrological Series. Water Resour. Manag. 2004, 18, 201–218. [Google Scholar] [CrossRef]
- Theil, H. A Rank-Invariant Method of Linear and Polynomial Regression Analysis. In Henri Theil’s Contributions to Economics and Econometrics: Econometric Theory and Methodology; Advanced Studies in Theoretical and Applied Econometrics; Raj, B., Koerts, J., Eds.; Springer: Dordrecht, The Netherlands, 1992; pp. 345–381. [Google Scholar] [CrossRef]
- Sen, P.K. Estimates of the Regression Coefficient Based on Kendall’s Tau. J. Am. Stat. Assoc. 1968, 63, 1379–1389. [Google Scholar] [CrossRef]
- Alemu, Z.A.; Dioha, M.O. Climate change and trend analysis of temperature: The case of Addis Ababa, Ethiopia. Environ. Syst. Res. 2020, 9, 27. [Google Scholar] [CrossRef]
- Mahmood, R.; Jia, S.; Zhu, W. Analysis of climate variability, trends, and prediction in the most active parts of the Lake Chad basin, Africa. Sci. Rep. 2019, 9, 6317. [Google Scholar] [CrossRef] [PubMed] [Green Version]
- Peng, S.; Gang, C.; Cao, Y.; Chen, Y. Assessment of climate change trends over the Loess Plateau in China from 1901 to 2100. Int. J. Climatol. 2018, 38, 2250–2264. [Google Scholar] [CrossRef]
- Merabtene, T.; Siddique, M.; Shanableh, A. Assessment of Seasonal and Annual Rainfall Trends and Variability in Sharjah City, UAE. Adv. Meteorol. 2016, 2016, e6206238. [Google Scholar] [CrossRef] [Green Version]
- Hersbach, H.; Bell, B.; Berrisford, P.; Biavati, G.; Horányi, A.; Muñoz Sabater, J.; Nicolas, J.; Peubey, C.; Radu, R.; Rozum, I.; et al. ERA5 Hourly Data on Single Levels from 1979 to Present. 2018. Available online: https://cds.climate.copernicus.eu/ (accessed on 27 July 2021).
- De Bruin, H.A.R.; Trigo, I.F.; Bosveld, F.C.; Meirink, J.F. A Thermodynamically Based Model for Actual Evapotranspiration of an Extensive Grass Field Close to FAO Reference, Suitable for Remote Sensing Application. J. Hydrometeorol. 2016, 17, 1373–1382. [Google Scholar] [CrossRef]
- Easterling, D.; Horton, B.; Jones, P.; Peterson, T.; Karl, T.; Parker, D.; Salinger, M.; Razuvayev, V.; Plummer, N.; Jamason, P.; et al. Maximum and Minimum Temperature Trends for the Globe. Science 1997, 277, 364–367. [Google Scholar] [CrossRef] [Green Version]
- Ghasemi, A.R. Changes and trends in maximum, minimum and mean temperature series in Iran. Atmos. Sci. Lett. 2015, 16, 366–372. [Google Scholar] [CrossRef]
- Folland, C.K.; Karl, T.R.; Salinger, M.J. Observed climate variability and change. Weather 2002, 57, 269–278. [Google Scholar] [CrossRef]
- Kromp-Kolb, H.; Nakicenovic, N.; Steininger, K.; Gobiet, A.; Formayer, H.; Köppl, A.; Prettenthaler, F.; Stötter, J.; Schneider, J. Österreichischer Sachstandsbericht Klimawandel 2014; Verlag der Österreichischen Akademie der Wissenschaften: Vienna, Austria, 2014. [Google Scholar]
- Easterling, D.R.; Wehner, M.F. Is the climate warming or cooling? Geophys. Res. Lett. 2009, 36. [Google Scholar] [CrossRef] [Green Version]
- Gobiet, A.; Kotlarski, S.; Beniston, M.; Heinrich, G.; Rajczak, J.; Stoffel, M. 21st century climate change in the European Alps—A review. Sci. Total. Environ. 2014, 493, 1138–1151. [Google Scholar] [CrossRef]
- Brunetti, M.; Lentini, G.; Maugeri, M.; Nanni, T.; Auer, I.; Böhm, R.; Schöner, W. Climate variability and change in the Greater Alpine Region over the last two centuries based on multi-variable analysis. Int. J. Climatol. 2009, 29, 2197–2225. [Google Scholar] [CrossRef]
- Yong, B.; Ren, L.; Hong, Y.; Gourley, J.J.; Chen, X.; Dong, J.; Wang, W.; Shen, Y.; Hardy, J. Spatial–Temporal Changes of Water Resources in a Typical Semiarid Basin of North China over the Past 50 Years and Assessment of Possible Natural and Socioeconomic Causes. J. Hydrometeorol. 2013, 14, 1009–1034. [Google Scholar] [CrossRef] [Green Version]





| Area | 58.3 km |
| Land-use | forest 43.8%, grass- and cropland 51.8%, settlement 4.4% |
| Stream density | 1.87 km km or 0.0019 m m |
| Geology | Crystalline basement rock 82.7%, tertiary hill country 12.7%, quaternary deposits 4.3% |
| Elevation range | 398–1279 m.a.s.l |
| Discharge characteristics | Q 0.04 ms; Q 92.14 ms; Q 0.49 ms; Mean runoff coefficient 0.31 (1979–2004) |
| Station | Altitude | Observed Variables | Data Availability |
|---|---|---|---|
| A | 398 | WL, WT | 1980– |
| B | 415 | WL, WT | 1980– |
| C | 418 | WL, WT | 1988–1997, 2000–2007 |
| D | 455 | WL, WT | 1997–2005, 2018– |
| 1 | 424 | P | 1979– |
| 2 | 729 | P | 1980– |
| 3 | 740 | P | 1980– |
| 4 | 800 | P | 1980– |
| 5 | 740 | P | 1980– |
| 6 | 1040 | P | 1980– |
| 7 | 525 | P, T, p, rH, Ra, ST, SM, WS, WD | 1980– |
| Land-Cover | 1990 | 2000 | 2006 | 2012 | 2018 | Δ1990–2018 | |
|---|---|---|---|---|---|---|---|
| Discontinuous urban fabric | (km2) | 2.21 | 2.48 | 2.48 | 2.51 | 2.51 | 0.30 |
| Mixed forest | 9.34 | 9.19 | 9.19 | 9.19 | 9.19 | −0.15 | |
| Coniferous forest | 16.30 | 16.16 | 16.16 | 16.18 | 16.18 | −0.12 | |
| Agricultural areas and pastures | 30.05 | 30.07 | 30.07 | 30.02 | 30.02 | −0.03 | |
| Discontinuous urban fabric | (%) | 3.8 | 4.3 | 4.3 | 4.4 | 4.4 | 0.6 |
| Mixed forest | 16.1 | 15.9 | 15.9 | 15.9 | 15.9 | −0.2 | |
| Coniferous forest | 28.2 | 28.0 | 28.0 | 28.0 | 28.0 | −0.2 | |
| Agricultural areas and pastures | 51.9 | 51.9 | 51.9 | 51.8 | 51.8 | −0.1 |
| Assessment Period | Variable | Unit | Y-W Trend | p-Value | T-S Slope |
|---|---|---|---|---|---|
| Annual | mean air temperature | (C) | decrease | 1.4E-03 | −3.1E-02 |
| minimum air temperature | (C) | no trend | 2.3E-01 | 2.7E-02 | |
| maximum air temperature | (C) | increase | 1.2E-03 | 6.3E-02 | |
| precipitation depth | (mm) | no trend | 9.3E-02 | 6.0E-01 | |
| annual wet days | (days) | no trend | 7.1E-01 | −7.7E-02 | |
| precipitation intensity | (mm/60 min) | no trend | 5.7E-01 | 4.0E-04 | |
| precipitation intensity | (mm/120 min) | no trend | 4.3E-01 | 5.0E-03 | |
| precipitation intensity | (mm/240 min) | no trend | 5.9E-01 | 7.0E-03 | |
| mean river flow | (ms) | decrease | 4.2E-03 | −2.4E-02 | |
| minimum river flow | (ms) | increase | 5.2E-03 | 1.0E-03 | |
| maximum river flow | (ms) | no trend | 7.3E-01 | −1.1E-01 | |
| actual evapotranspiration | (mm) | no trend | 7.1E-01 | 1.3E-01 | |
| potential evapotranspiration | (mm) | increase | 0.0E00 | 1.4E00 | |
| Winter | mean air temperature | (C) | decrease | 1.1E-02 | −3.7E-02 |
| minimum air temperature | (C) | no trend | 2.2E-01 | −1.5E-02 | |
| maximum air temperature | (C) | no trend | 6.5E-01 | 2.8E-02 | |
| precipitation depth | (mm) | no trend | 4.5E-01 | −1.5E-01 | |
| precipitation intensity | (mm/60 min) | increase | 5.5E-04 | 1.7E-02 | |
| precipitation intensity | (mm/120 min) | no trend | 5.8E-02 | 9.0E-03 | |
| precipitation intensity | (mm/240 min) | no trend | 1.8E-01 | 1.4E-02 | |
| mean river flow | (ms) | decrease | 3.2E-03 | −5.0E-03 | |
| minimum river flow | (ms) | no trend | 4.6E-01 | 3.0E-04 | |
| maximum river flow | (ms) | no trend | 1.8E-01 | −9.0E-03 | |
| Spring | mean air temperature | (C) | decrease | 2.6E-05 | −4.7E-02 |
| minimum air temperature | (C) | decrease | 1.1E-02 | −4.6E-02 | |
| maximum air temperature | (C) | decrease | 3.0E-04 | −9.9E-02 | |
| precipitation depth | (mm) | no trend | 3.4E-01 | 2.8E-01 | |
| precipitation intensity | (mm/60 min) | increase | 3.1E-04 | 1.1E-02 | |
| precipitation intensity | (mm/120 min) | increase | 7.1E-03 | 2.5E-02 | |
| precipitation intensity | (mm/240 min) | increase | 1.0E-02 | 4.9E-02 | |
| mean river flow | (ms) | decrease | 1.1E-03 | −9.0E-03 | |
| minimum river flow | (ms) | no trend | 2.4E-01 | -9.0E-04 | |
| maximum river flow | (ms) | increase | 3.0E-02 | 3.6E-02 | |
| Summer | mean air temperature | (C) | no trend | 7.9E-01 | −1.0E-03 |
| minimum air temperature | (C) | no trend | 2.3E-01 | −3.4E-02 | |
| maximum air temperature | (C) | increase | 7.5E-05 | 6.3E-02 | |
| precipitation depth | (mm) | increase | 2.5E-06 | 2.1E00 | |
| precipitation intensity | (mm/60 min) | no trend | 1.3E-01 | 3.4E-03 | |
| precipitation intensity | (mm/120 min) | increase | 0.0E00 | 5.2E-02 | |
| precipitation intensity | (mm/240 min) | increase | 1.6E-05 | 5.4E-02 | |
| mean river flow | (ms) | no trend | 2.0E-01 | −1.1E-02 | |
| minimum river flow | (ms) | no trend | 1.5E-01 | −1.5E-03 | |
| maximum river flow | (ms) | increase | 4.4E-02 | 3.6E-01 | |
| Autumn | mean air temperature | (C) | no trend | 8.5E-01 | −5.0E-03 |
| minimum air temperature | (C) | decrease | 6.2E-03 | −6.9E-02 | |
| maximum air temperature | (C) | increase | 1.0E-03 | 6.4E-02 | |
| precipitation depth | (mm) | no trend | 5.0E-01 | −2.8E-01 | |
| precipitation intensity | (mm/60 min) | no trend | 7.9E-01 | −8.1E-17 | |
| precipitation intensity | (mm/120 min) | no trend | 2.1E-01 | −5.0E-03 | |
| precipitation intensity | (mm/240 min) | no trend | 7.8E-01 | −4.2E-04 | |
| mean river flow | (ms) | no trend | 1.6E-01 | 7.3E-03 | |
| minimum river flow | (ms) | increase | 8.0E-03 | 1.7E-03 | |
| maximum river flow | (ms) | no trend | 2.8E-01 | 2.9E-02 |
Publisher’s Note: MDPI stays neutral with regard to jurisdictional claims in published maps and institutional affiliations. |
© 2021 by the authors. Licensee MDPI, Basel, Switzerland. This article is an open access article distributed under the terms and conditions of the Creative Commons Attribution (CC BY) license (https://creativecommons.org/licenses/by/4.0/).
Share and Cite
Krebs, G.; Camhy, D.; Muschalla, D. Hydro-Meteorological Trends in an Austrian Low-Mountain Catchment. Climate 2021, 9, 122. https://doi.org/10.3390/cli9080122
Krebs G, Camhy D, Muschalla D. Hydro-Meteorological Trends in an Austrian Low-Mountain Catchment. Climate. 2021; 9(8):122. https://doi.org/10.3390/cli9080122
Chicago/Turabian StyleKrebs, Gerald, David Camhy, and Dirk Muschalla. 2021. "Hydro-Meteorological Trends in an Austrian Low-Mountain Catchment" Climate 9, no. 8: 122. https://doi.org/10.3390/cli9080122
APA StyleKrebs, G., Camhy, D., & Muschalla, D. (2021). Hydro-Meteorological Trends in an Austrian Low-Mountain Catchment. Climate, 9(8), 122. https://doi.org/10.3390/cli9080122


