Article

What Matters in the Effectiveness of Airborne Collision Avoidance Systems? Monte Carlo Simulation of Uncertainties for TCAS II and ACAS Xa

Safety & Human Performance, Royal Netherlands Aerospace Centre NLR, 1059 CM Amsterdam, The Netherlands
Aerospace 2023, 10(11), 952; https://doi.org/10.3390/aerospace10110952
Submission received: 2 August 2023 / Revised: 12 October 2023 / Accepted: 9 November 2023 / Published: 11 November 2023
(This article belongs to the Section Air Traffic and Transportation)

Abstract

:
TCAS II is a rule-based airborne collision avoidance system (ACAS) that is used in current commercial air transport operations, and ACAS Xa is a new optimization-based system. Operational validation studies have mainly used deterministic simulations of ACAS performance using various sets of encounters. Recently a new approach was developed, which employs Monte Carlo (MC) simulation of agent-based models to evaluate the impact of sensor errors and pilot response variability. This paper contrasts the results of both approaches in a comparison of TCAS II and ACAS Xa for various types of synthetic encounters. It was found that conventional estimates of near mid-air collision (NMAC) probabilities are often lower than the estimates achieved using MC simulation, and that the biases in the P(NMAC) estimates are consistently larger for ACAS Xa than for TCAS II. Contributions to unresolved risk are largest for pilot performance, then for encounter types, and finally for sensor errors. The contribution of non-responding pilots is much larger than the differences between TCAS II and ACAS Xa. It is concluded that the agent-based MC simulation overcomes the limitations in traditional evaluation of altimetry errors and pilot response, providing an independent means to effectively analyze the robustness of ACASs.

1. Introduction

Airborne collision avoidance systems (ACASs) form one of the last safety barriers for avoiding mid-air collisions, together with maneuvering based on within-last-minute visual acquisition of the threat aircraft and providence. An ACAS for commercial aircraft operations provides the cockpit crew with traffic advisories (TAs) regarding nearby aircraft that pose a threat, and resolution advisories (RAs) for vertical rates (e.g., Climb, Descend, Level-Off) that are needed to avoid a potential collision within the last minute before the closest point of approach with a threat aircraft. In a worldwide survey of 3800 pilots, 36.5% of the respondents indicated that they had experienced one or more RAs is the last five years [1]. It has been estimated, using RA downlink data that in core European airspace, that RAs occur 3.4 times per day, or once every 7259 flight hours [2].
Traffic Alert and Collision Avoidance System II (TCAS II) version 7.1 [3] is the commercially available ACAS implementation that is required for current commercial air transport operations in ICAO Annex 10, Volume IV [4]. ACAS Xa is a newly developed ACAS for large commercial operations [5,6], which is intended as a successor of TCAS II, providing largely the same types of (vertical) RAs and cockpit displays. Key objectives for its development are improved collision avoidance, less unnecessary RAs, and effective use of additional surveillance means.
An effective ACAS must handle large numbers of encounter geometries well, be robust against sensor errors in the ACAS input, and be robust for variability in pilot response to ACAS RAs. While ACAS operational validation has profited from the development of Bayesian network models [7,8] that represent characteristics of encounter geometries, the analysis of the impact of sensor errors and pilot performance has lagged behind. In particular, ACAS validation studies have mainly used deterministic simulation of ACAS performance for encounter sets [9,10]. The impact of altimetry errors has been evaluated by postprocessing of deterministic simulations. Evaluation of pilot performance variability has mostly been limited to deterministic simulation of cases where pilots of one of the aircraft in an encounter do not respond to RAs. As a way forward, an agent-based model that systematically captures uncertainties in ACAS input and pilot performance was developed [11]. This forms the basis for a simulation tool called CAVEAT (Collision Avoidance Validation and Evaluation Tool), which supports the use of Monte Carlo (MC) simulation for the evaluation ACASs in stochastic encounter scenarios [12].
The purpose of this paper is to analyze the types of new results that can be attained by MC simulation of agent-based models for ACAS encounter scenarios in comparison with the traditional techniques for analysis of altimetry errors and pilot response probability. This leads to the following key questions:
  • What is the added value of MC simulation of uncertainties in ACAS performance?
  • Given the various types of uncertainties in encounters, sensor error, and pilot performance, what matters in the effectiveness of ACAS performance?
These questions are addressed in a use case that compares the performance of TCAS II v7.1 with a development version of ACAS Xa for the key safety metric of near mid-air collision (NMAC) probability. The use case in this paper purposefully has a limited scope and does not include the broadness of encounters, types of flights and transponder modes, means of surveillance, and the variety of metrics that would be needed in a complete validation study. The new types of methods and the insights resulting from this use case are presented to support such future operational validation studies, e.g., for the latest version of ACAS Xa [6].
This paper is structured as follows. Section 2 provides more detailed background on TCAS II and ACAS Xa, on encounter geometries, sensor errors, and pilot response variability, and on operational validation studies for ACAS. Section 3 describes the methods applied in the use case, including the encounters, simulation scenarios, and P(NMAC) estimation approaches. Section 4 presents numerous simulation results for the defined encounter-scenarios. Section 5 provides a detailed discussion of the results. Section 6 presents a concise overview of the conclusions and recommendations.

2. Background

2.1. Airborne Collision Avoidance Systems

TCAS II version 7.1 [3] is the commercially available ACAS implementation that is used in current commercial air transport operations. In TCAS II, mode C and mode S secondary surveillance radar transponders of nearby aircraft are interrogated. Based upon the replies received, the system tracks the slant range, altitude, and bearing of surrounding traffic. Using this information and a set of fixed rules for alert generation, TCAS II provides its vertical rate advisories. Principally, the TCAS II logic estimates the time to the closest point of approach (CPA) between the ownship and an intruder, based on the measurements of the range and the closure rate in the encounter. It uses an altitude-dependent sensitivity level, which determines threshold values for this estimated time, ranging from 15 s at low altitudes to 35 s at high altitudes, as well as thresholds for the expected horizontal and vertical distances at CPA. More detailed explanations of the TCAS II logic can be found in [13,14], in addition to the full specification in the minimum operational performance standards (MOPS) [3,15].
ACAS Xa is a newly developed ACAS [5,6], which is intended to be a successor of TCAS II. ACAS Xa includes a Surveillance and Tracking Module (STM), which uses enhanced tracking algorithms that correlate surveillance data from multiple sensors, including the transponder-based data also used by TCAS II, but also allowing to use Global Navigation Satellite Systems (GNSS)-based ownship position estimates and Automatic Dependent Surveillance-Broadcast (ADS-B) data. The largest innovation in ACAS Xa is found in its Threat Resolution Module (TRM), which uses optimized decision logic stored in look-up tables to determine its advisories given probabilistic estimates of ownship and intruder states from the STM. The optimized decision logic tables have been determined off-line using a partially observable Markov decision process model (POMDP) and dynamic programming [16,17]. This optimization process uses (1) probabilistic dynamic models for pilot response and aircraft movements, (2) a reward function with an extensive set of cost components for close proximities and types of advisories, and (3) dynamic programming to maximize the reward function, leading to state-action values that are stored in large look-up tables. For the provision of advisories ACAS Xa extends these precomputed actions with coordination rules for complementary advisories, and with online costs for required system performance, e.g., low altitude inhibitions of descend RAs and RA transition penalties.
Given a perfect model in a finite Markov decision process, dynamic programming is guaranteed to lead to an optimal deterministic policy, which maximizes the reward function. Dynamic programming can be seen as off-line reinforcement learning for completely known systems. Reinforcement learning is an artificial intelligence (AI) approach where a machine learns what to do so as to maximize a reward signal for a typically not completely known system [18]. Likewise, in the ACAS Xa application, the system is not exactly known. Applied models of aircraft movements and pilot response include epistemic and aleatory uncertainty, and there is no finite state space, but aircraft moving in a time-space continuum, which is approximated using (large numbers of) discretized states. Furthermore, it is not known beforehand what a suitable reward function is. The ACAS Xa development has involved an iterative process in which the operational and safety impact of attained ACAS performance has been evaluated in simulations for particular encounter sets, leading to the adaptation of the reward function [17,19] and ACAS Xa algorithms. For instance, while early in the development (negative) rewards were assigned only to near collisions and to issuing initial, strengthening and reversal RAs, later in the development considerably more reward components were found to be needed to achieve acceptable performance, where the reward components may depend on particular vertical separations and closure rates (see e.g., Table 10-2 in [17]). As such, the achieved alerting logic in ACAS Xa depends on the POMDP model, the discretization grid, the reward components, the encounters, and settings used in simulations of the dynamic programming optimized logic, the judgement of the simulated performance, and the adaptations of the reward function in the iterations.

2.2. Uncertainties Influencing ACAS Effectiveness

An ACAS needs to effectively support mid-air collision avoidance in the context of a range of uncertainties that may complicate achieving this objective:
  • It must be able to function effectively for a large number of encounter geometries;
  • It must be robust against sensor errors in the ACAS input; and
  • It must be able to handle variability in pilot response to ACAS RAs.

2.2.1. Encounter Geometries

In the context of ACAS, encounters describe trajectories of (typically) pairs of aircraft within the last minute before CPA up to about 10 s after CPA. An encounter of a pair of aircraft can be characterized by a range of aspects, including the vertical miss distance (VMD), horizontal miss distance (HMD), relative heading and bearing when the aircraft are at CPA, and the altitude, airspeed, vertical rate, turn rate, and acceleration during the encounter. For the development and evaluation of ACAS, a series of encounter models have been developed by the MIT Lincoln Laboratory in recent years [7,20,21,22,23,24]. These models use Bayesian networks, which describe probabilistic relations between the characteristic variables of an encounter given particular air spaces, types of aircraft, and the potential influence of air traffic control. Using such networks various interdependent probability distributions can be represented, e.g., the likelihood of rates of climb/descent given an altitude layer and a VMD range. Large sets of USA radar data were used to tune the parameters of these Bayesian models. For instance, the development of an encounter model for cooperative aircraft used data from 180 radars over 90 days, including 5.8 million encounters [24]. Building on this approach, and using European radar data, a recent encounter model for European airspace was developed in [8].

2.2.2. Sensor Errors

Errors exist in the sensor data that are used by an ACAS for its surveillance and the generation of its advisories. This implies that, even for exactly the same trajectories in an encounter, there exists some level of uncertainty in the generated ACAS advisories and their timing. The prime sensor data that are used both by TCAS II and ACAS Xa are the pressure altitudes and the transponder-based measurements of the slant range and bearing of the intruder with respect to the ownship. Pressure altitude errors include static and variable errors due to the condition of flush ports or static probes, and the transmission and conversion of air pressure by the transducer. The transponder-based measurement errors depend on reply delay and jitter in signal delay differences between the applied antennas on the aircraft. Minimum performance requirements that set bounds on these sensor errors are provided in the MOPS for TCAS II [3] and ACAS Xa [5,6]; they are the same for both ACASs. For instance, pressure altimetry errors must be within 135 ft at sea level to 285 ft at FL 400 on a 99.7% probability basis, and range measurements should have an error not exceeding 50 ft RMS jitter and 125 ft bias for mode S reports.

2.2.3. Pilot Response

ICAO operational procedures for ACAS alerts (§III-3-3-2 of [25]) specify that pilots shall not maneuver their aircraft in response to TAs only, but prepare for appropriate action if an RA occurs. In the event of an RA, pilots are required to respond immediately by following the RA as indicated, unless doing so would jeopardize the safety of the aircraft. Pilots must follow the RA even if there is a conflict between the RA and an air traffic control (ATC) instruction. The ICAO standard pilot model for ACAS evaluation (§4.4.2.5 of [4]) assumes that pilots respond with a delay of 5 s to an initial RA and a delay of 2.5 s to subsequent (modified) RAs. If a change in vertical rate is required, this standard model assumes an acceleration towards the required vertical rate of 0.25 g, except for (modified) reversed-sense or increased-rate RAs, where an acceleration of 0.35 g is applied.
ACAS resolution advisories are not always followed by pilots. This has, for instance, contributed to the Überlingen mid-air collision in 2002 [26], and “ACAS RA not followed” is still recognized as a contributor to airborne collision risk in recent safety reviews [27]. Several studies have analyzed in detail the probability of pilot response to RAs.
  • An analysis of downlinked TCAS RA’s in recorded radar data by the TCAS RA Monitoring System (TRAMS) for the years 2008–2016 is presented in [28]. The relevant TRAMS data concern the terminal area of 20 large airports in the US. The analysis considered encounters where the first RA was Climb or Descend, based on a set of 80,955 encounters. Excluding parallel approach encounters, the overall response probability found in this data set is 0.62 overall, 0.58 for climb RAs, and 0.69 for descend RAs. This dataset was used for the development of a Bayesian network model for pilot response to resolution advisories [28].
  • In [29] the pilot responses to 1176 downlinked RAs in European airspace were analyzed. Using analysis Method B from [30], which includes a category for weak responses, it was found that initial RAs were not followed or reacted to in the opposite sense in 10% of the cases at 8 s after the RA. For Climb or Descend RAs, these cases occurred more frequently: 27% of the cases. Weak responses (the pilot has made an adjustment in vertical speed in the required direction, but it is insufficient in vertical speed or acceleration to fulfil the requirement) occurred in 31% of the cases. The compliance with subsequent RAs was found to be considerably better than for initial RAs.
  • A survey was conducted to analyze the frequency of RAs experienced by pilots and cases where RAs were not followed [1]. A total of 3800 pilots from 95 countries participated in the survey. A share of 36.5% of the respondents indicated that they had experienced one or more RAs is the last five years. A part of 14.7% of the pilots reported that they had been in a situation where it was not possible to follow an RA, or an RA was not precisely followed. The most important reasons indicated for not following an RA were “decision not to follow due to visual acquisition and/or avoidance of the conflicting traffic” (45%), “short duration RA (RA terminated before a response could be taken)” (15%), “proximity to the ground” (11%). Based on the survey data it was estimated that around 11% of RAs are not followed.
The downlinked RAs in the above studies provide data with a time discretization that depends on the radar update time, typically 4 s. An analysis of airborne-recorded data for a limited set of 79 RAs in the period 2002–2004 from four European airlines [31] provides more detailed insights into the timing and acceleration in pilot responses. Overall, the mean delays in this dataset are close to the ICAO standard response model of 5 s for initial RA, but a bit longer than the standard delay for modified RAs; the standard deviation is about 1.5 s. The observed accelerations are mostly below those of the standard model, with a standard deviation of about 0.04 g.

2.3. Operational Validation Studies for ACAS

Since ACAS is an important safety barrier in commercial aviation, new ACAS types need to be validated rigorously under a variety of operational conditions and must outperform earlier versions in a sufficient manner to be accepted for implementation in avionics and operations. Such operational validations were performed for adaptations of TCAS II, and they are even more important for the validation of ACAS Xa, considering the drastically new principles applied in its advisory logic.
The key approach in ACAS operational validation studies has been the comparison of metrics of simulated ACAS performance for a new system and a legacy system using various sets of encounters. Herein a distinction is made between metrics and encounter sets for the analysis of safety versus operational suitability. In safety analysis, key metrics include the probability of a near mid-air collision P(NMAC), i.e., the situation that two aircraft approach within 100 ft vertically and 500 ft horizontally, and the risk ratio, i.e., the NMAC probability with ACAS relative to the NMAC probability without ACAS. So here, the focus is on the prime ACAS purpose: avoiding mid-air collisions. In operational suitability analysis, key metrics concern rates of RAs in general, of specific RAs (like strengthening, crossing, reverse), of complex RA sequences, as well as having sufficient time between advisories. Here the focus is on the impact of an ACAS on operations and on the trust of pilots in the effectiveness of the advisories. Different encounter sets are used for the analyses of safety and operational suitability. For safety analysis, sets of model-based (synthetic) encounters are used where CPAs are small and include NMAC events. For instance, in an operational validation study of ACAS Xa [9] seven types of encounter sets were used, including encounters generated using the Bayesian network approach described in Section 2.2.1, and in a study of a proposed change in ACAS Xa [10] encounters generated using a Bayesian network of European data were applied. The encounter sets typically have subsets for altitude layers and for cases where both aircraft in an encounter have ACAS or only one of the aircraft has ACAS. Typical numbers of encounters in these subsets are in the order of 10 5 to 10 6 . For operational suitability analysis sets of radar data as well as sets of model-based encounters are used, which describe encounters with exceedances of air traffic control separation standards but not very close to NMAC conditions. The sizes of these sets are more limited, but may still be in the order of 10 5 .
The principal approach in the ACAS operational validation studies is simulation of the RAs generated by the ACASs for the trajectories in an encounter and the adaptation of the trajectories following the RAs using the ICAO standard pilot response model (see Section 2.2.3). The prime way to represent pilots that do not respond to RAs is by using simulations where pilots of one of the aircraft do not react to the RAs, leading to a NMAC probability P ( N M A C ) 0 % . Next, the NMAC probability for a given pilot response probability R is calculated as P ( N M A C ) R = R P ( N M A C ) 100 % + ( 1 R ) P ( N M A C ) 0 % , where P ( N M A C ) 100 % is the NMAC probability for the case that the pilots of both aircraft always respond [9]. This means that the underlying pilot response model assumes that the pilot responds in the same way to each RA in an encounter, and that the timing and strength of response are according to the standard model. It also means that situations where the pilots of both aircraft do not respond are not included in the statistics.
The prime way to evaluate the impact of altimetry bias is by postprocessing of the simulated VMD for cases where the HMD is smaller than 500 ft. Given probability distributions for the altimeter error (e.g., Gaussian [3] or double exponential [4]), simulated VMD values larger than 100 ft also contribute to some extent to the NMAC probability. This postprocessing approach will be explained in more detail in Section 3.3.2. The impacts of other sensor errors, e.g., for slant range measurements or for GNSS-based position measurements, are typically not evaluated in ACAS operational validation studies.
The results of the operational validation studies of ACAS Xa [9,10] indicate that, overall, ACAS Xa outperforms TCAS II in the safety as well as in the operational acceptability metrics. For instance, the results of a recent study [10] indicate that ACAS Xa provides a safety benefit of 16% to 24% if pilots follow the RAs, a safety benefit of 47% if one of the pilots does not follow, and a reduction in the overall number of RAs by about 60%. Notwithstanding this general improvement, some specific areas were also found where the performance of ACAS Xa is less than that of TCAS II.

3. Methods

The use case in this study is completely based on simulation of synthetically generated encounters. Section 3.1 describes the generation of the various types of encounter sets used in the simulations. Section 3.2 describes the simulation environment and various types of scenarios for representing the ACAS equipment, sensor errors and pilot responses. Section 3.3 describes the types of simulation, P(NMAC) estimation, and postprocessing of altimetry errors.

3.1. Encounter Generation

3.1.1. Aircraft Trajectories

The generation of encounters between two aircraft i and j is based on aircraft trajectories that can be curved both in the horizontal and vertical planes:
s ˙ t , k = v t , k v t , k x v t , k y v t , k z = v k sin ( χ 0 , k + ω t , k t ) v k cos ( χ 0 , k + ω t , k t ) v 0 , k z + a t , k z t
where k { i , j } , s t , k and v t , k are the 3D position and speed at time t , v k is a constant ground speed, χ 0 , k is a course at time t = 0 , v 0 , k z is a vertical rate at time t = 0 , ω t , k is a rate of turn that is piecewise constant ω t , k { 0 , ω k } , and a t , k z is a vertical acceleration that is piecewise constant a t , k z { 0 , a k z } . The aircraft have CPA at time t = 0 , when aircraft i is at s 0 , i = 0 , 0 , s 0 , i z with particular vertical and horizontal miss distances d i , j V M D and d i , j H M D . The following types of trajectories are used:
  • Straight trajectories, where ω k = 0 and a k z = 0 .
  • Trajectories with a vertical rate change, where the speed in the vertical plane consists of three phases: an initial vertical rate v k z , ini , then changing with acceleration a k z > 0 from time t k z , and a final vertical rate v k z , end :
    v t , k z = v k z , ini t < t k z v k z , ini + a k z sgn ( v k z , end v k z , ini ) ( t t k z ) t k z t < t k z + | v k z , end v k z , ini | / a k z v k z , end t t k z + | v k z , end v k z , ini | / a k z
    Here the sign function assures that the vertical rate is either increased or decreased in line with the difference between the initial and final vertical rates.
  • Trajectories with a horizontal turn, where the size of the aircraft groundspeed v k is constant and the course consists of three phases: an initial course χ k ini , then turning with rate of turn ω k from time t k h , and final course χ k end , where T k h is the duration of a turn depending on the initial and final courses, and the rate of turn:
    χ t , k = χ k ini t < t k h f wrap 360 ( χ k ini + ω k ( t t k h ) ) t k h t < t k h + T k h χ k end t t k h + T k h
  • Trajectories with both a vertical rate change and horizontal turn, which is a combination of cases 2 and 3, assuming independent maneuvering in the horizontal and vertical planes.

3.1.2. Sets of Encounters

Eight sets of encounters are generated with N E n c = 50 , 000 encounters in each set. The sets represent the combinations of the following aspects: (1) leading to an NMAC, or not; (2) including vertical rate changes, or not; and (3) including horizontal turns, or not. These encounter sets are not meant to be models for encounters in specific airspaces, but they basically represent the inclusion or exclusion of types of variability in encounters.
The sets of encounters are generated using random sampling of parameters from uniform distributions (between a minimum and maximum). The general settings that apply to all of these sets are the following:
  • The altitude of aircraft i at CPA is s 0 , i z = 12 , 000 ft (flight level 120). This is a typical altitude in a terminal maneuvering area (TMA) where aircraft may be climbing, descending, turning, and levelling off.
  • The course of aircraft i is always χ 0 , i = 0 deg. The course of aircraft j at time t = 0 is in the interval χ 0 , j [ 15 , 345 ] deg.
  • The ground speeds of both aircraft are in the interval v k [ 250 , 300 ] knots.
  • The following vertical speed regimes are used: level flight with v t , k z = 0 , climb with v t , k z [ 1200 , 2500 ] fpm, descent with v t , k z [ 3000 , 2000 ] fpm.
  • There is no wind.
  • Each encounter starts at time t = 75 s and ends at time t = 15 s, implying a total duration of 90 s.
Encounters leading to NMAC events and encounters not leading to NMAC events (but close to it) are specified by the following vertical and horizontal miss distances:
  • NMAC encounters: d i , j V M D [ 0 , 90 ] ft and d i , j H M D [ 0 , 500 ] ft.
  • No NMAC encounters: d i , j V M D [ 110 , 500 ] ft and d i , j H M D [ 0 , 2500 ] ft.
In encounters with straight trajectories (vertical acceleration a k z = 0 and rate of turn ω k = 0 ), in 50% of the cases an aircraft is flying level, in 25% of the cases an aircraft is climbing, and in 25% of the cases an aircraft is descending. As such, sets with straight encounters include all combinations of aircraft flying level, climbing, or descending.
In encounters with vertical rate changes, either one or both of the aircraft include a vertical acceleration a k z 0 . The initial vertical rate v k z , ini and final vertical rate v k z , end are chosen from one of the speed regimes (level flight, climb, descent). The acceleration for a vertical rate change is chosen as a k z [ 0.05 , 0.35 ] g. The time of the start of a vertical rate change is chosen as t k z [ 40 , 10 ] s. The following combinations and frequencies of vertical rate changes are used:
  • Aircraft i: level (25%), continuous climb (12.5%), continuous climb (12.5%), level to climb (12.5%), level to descend (12.5%), climb to level (12.5%), descend to level (12.5%);
  • Aircraft j: level to climb (25%), level to descend (25%), climb to level (25%), descend to level (25%).
In encounters with horizontal turns, either one or both or the aircraft include a rate of turn ω k 0 . Course changes are chosen as ± [ 30 , 90 ] deg (right or left turns). The rate of turn is chosen as ω k [ 2 , 4 ] deg/s. The time of the start of a turn is chosen as t k h [ 50 , 20 ] s. The following combinations and frequencies are used:
  • Aircraft i: straight (50%), left turn (25%), right turn (25%);
  • Aircraft j: left turn (50%), right turn (50%).
At the start of encounters, there should be sufficient distance between the aircraft. The ground speeds, time before CPA, and minimum course difference of 15 deg imply that the horizontal distance at the start of the encounter is larger than 1.35 nautical miles, if there are no horizontal turns. In the case of horizontal turns, sufficient distance is not assured and encounters with an initial vertical distance below 800 ft in combination with an initial horizontal distance below 1 nautical mile are filtered out. It has been assured that the remaining sets have 50,000 encounters.

3.2. Simulation Scenarios

3.2.1. Simulation Environment

The simulation environment that was used in this study is CAVEAT, which has been developed by NLR and everis/NTT-Data for EUROCONTROL as a means of simulation and analysis of ACAS in aircraft encounters [32]. Such encounters can be single encounters or sets of encounters, which may stem directly from radar data, or that are synthetically generated using an encounter model. CAVEAT employs an agent-based modelling approach, which includes sensor error models representing errors in ACAS input signals and models for pilot performance variability [11,33]. Monte Carlo simulation can be used to evaluate the impact of sensor errors and pilot performance variability for single encounters or sets of encounters. In this context, a scenario describes the settings of the parameters of the model components, and an encounter-scenario is its combination with an encounter. Key settings for the ACAS equipment, sensor errors, and pilot performance are provided next.

3.2.2. ACAS Equipment and Surveillance Data

Regarding the ACAS equipment, two types of scenarios are considered:
  • TCAS II. Both aircraft in an encounter are equipped with TCAS II v7.1. This is the current standard ACAS used in commercial civil aviation as defined in [3]. The C++ library of the TCAS II algorithms stem from InCAS version 3.3. It was developed by the MITRE Corporation and subsequently adjusted for EUROCONTROL by Evosys to accommodate version 7.1.
  • ACAS Xa. Both aircraft in an encounter are equipped with ACAS Xa. This a newly developed ACAS for commercial civil aviation developed in the ACAS X program as defined in [5,6]. The C++ library of the ACAS Xa algorithms was developed by NTT-Data in cooperation with NLR for EUROCONTROL. It is based on the algorithms in the MOPS [5] plus some changes as part of the continuing ACAS Xa development; it is not yet the version of the latest update of the MOPS [6].
In both the TCAS II and the ACAS Xa scenarios the aircraft have mode S transponders, which employ 25 ft altitude quantization, and which are used for measurements of the slant range and bearing with respect to the intruder. Although ACAS Xa allows the use of ADS-B data, it is assumed that ADS-B In/Out is not employed. As such, in both ACAS scenarios the same surveillance information is available for the provision of the advisories.

3.2.3. Sensor Errors

The ACAS input data that are relevant in the encounter-scenarios presented in this study are the pressure altitude and the slant range and bearing measurements of each aircraft. Next the error models for these elements are described concisely.
The pressure altimetry model represents static (bias) and variable (jitter) error components [11,33]. The bias is chosen from a zero-mean normal distribution with an altitude-dependent standard deviation, based on requirements in the ACAS MOPS [3,5]. For FL 120 as applied in the encounters the value of this standard deviation is about 54 ft. The jitter is represented by a first-order autoregressive process with Gaussian noise, having a standard deviation of about 5 ft and an autocorrelation factor of 0.88.
The transponder-based slant range measurement model represents the slant range of an intruder as measured by the ownship. It includes an error model that describes static and variable error components, which depend on the mode of the transponder signaling [11]. For the scenarios in this paper, the bias component is chosen from a normal distribution with a standard deviation of 125 ft [3,5]. The jitter component is Gaussian white noise with a standard deviation of 50 ft [3,5], i.e., without correlations between subsequent range measurements.
Bearing is the angle of another aircraft in the horizontal plane measured clockwise from the longitudinal axis of the own aircraft. The error in transponder-based bearing measurement is Gaussian white noise with a standard deviation that depends on the elevation angle with respect to the intruder and the transponder signaling mode [11,33]. For the scenarios in this paper, the standard deviations of the noise are 12 to 18 degrees [3,5], depending on the elevation angle.
Based on these error models, the following conditions for sensor errors are defined for both aircraft in the scenarios:
  • E0: There are no sensor errors; altitude, slant range and bearing are exactly known.
  • E1: There are sensor errors according to the standard settings described above.
  • E2: There are only biases in the pressure altitude, while there are no errors in the other components.
  • E3: There are sensor errors according to the standard settings described above, except for the bias in the pressure altitude, which is absent.

3.2.4. Pilot Response Variability

The simulations include scenarios with deterministic and stochastic pilot response models. The deterministic pilot model represents the ICAO standard pilot response model, in which the pilot responds to each RA; the pilot responds with a delay of 5 s to initial RAs and with a delay of 2.5 s to subsequent RAs; and, in the case of vertical rate changes, the pilot applies an acceleration of 0.25 g, except for reversal or increase RAs, where 0.35 g is applied.
The stochastic pilot model includes the following types of variability:
  • There is a probability P i n i that the pilot responds to an initial RA.
  • There is a conditional probability P s u b , 1 that the pilot responds to a subsequent RA given that the pilot responded to a previous RA.
  • There is a conditional probability P s u b , 2 that the pilot responds to a subsequent RA given that the pilot did not respond to a previous RA.
  • The response delay is composed of a constant preparation delay of 2.5 s for initial RAs only, and a stochastic action delay chosen from a lognormal distribution [34] with a mean of 2.5 s and a standard deviation of 1.5 s for any RA. This implies that the mean delay is 5 s for initial RAs and 2.5 s for subsequent RAs.
  • The vertical acceleration applied by the pilot is chosen from a lognormal distribution with a mean of 0.25 g or 0.35 g (for reversal/increase RAs) and a standard deviation of 0.04 g.
Based on these pilot response models, the following conditions are defined in the scenarios:
  • PP: Both aircraft have standard (deterministic) pilot response.
  • PN: AC1 has standard (deterministic) pilot response, while AC2 has no pilot response.
  • P1: Both aircraft have pilot response with stochastic delay and acceleration, and with response probability parameters P i n i = 0.9 , P s u b , 1 = 1 , and P s u b , 2 = 0 . This represents a “stubborn” pilot who sticks to an initial decision to respond or not.
  • P2: Both aircraft have pilot responses with stochastic delay and acceleration, and with response probability parameters P i n i = 0.9 , P s u b , 1 = 0.95 , and P s u b , 2 = 0.90 . This represents a “reconciliating” pilot who may adapt the response mode.
  • P3: Both aircraft have pilot responses with stochastic delay and acceleration, and they always respond to RAs ( P i n i = 1 , P s u b , 1 = 1 , P s u b , 2 = 0 ).

3.3. Simulation and P(NMAC) Estimation

3.3.1. Simulation Runs

Simulations of the encounter sets with N E n c = 5 10 4 encounters per set are performed in two ways:
  • Deterministic simulation. In these simulations all settings are chosen to represent deterministic scenarios. Each encounter is simulated once, meaning that there are N R u n = 5 10 4 simulation runs per set.
  • Monte Carlo simulation. These simulations include one or more settings that imply stochastic behavior in the scenarios. Each encounter is simulated N M C = 20 times using different realizations of the stochastic variables. This implies that there are N R u n = 10 6 simulation runs per set.
The postprocessing of simulation results for this paper is focused on the key metric for ACAS safety analysis: the probability of an NMAC event P(NMAC). The principal method for estimating P(NMAC) in this paper is the following counting-based approach. In the simulations the vertical miss distance d i , j V M D and the horizontal miss distance d i , j H M D are calculated in each run. An NMAC occurs in a run if d i , j V M D < 100 ft and d i , j H M D < 500 ft. The number of NMAC events for an encounter set is N N M A C . The counting-based NMAC probability estimate and its 95% confidence interval are determined as shown in [35]:
P N M A C = N N M A C / N R u n C 95 % = P N M A C ± 1.96 P N M A C ( 1 P N M A C ) / N R u n if   P N M A C > 0 [ 0 ,   3 / N R u n ] if   P N M A C = 0

3.3.2. Altimetry Error Postprocessing

Instead of using MC simulation, a common approach to evaluate the impact of altimetry errors on P(NMAC) estimates in ACAS operational validation studies is based on deterministic simulations and the following altimetry error postprocessing (AEP) approach. Given two aircraft i and j with altitudes s t , i z and s t , j z . It is assumed that the pressure altimetry system of the aircraft induces constant errors (bias), leading to altitude estimates:
s ^ t , i z = s t , i z + ε i s ^ t , j z = s t , j z + ε j
where the errors ε i and ε j are independent and chosen from a suitable probability distribution, such as a normal distribution [3,5] or a double exponential distribution [4]. The VMD between the aircraft based on the real altitudes and the measured altitudes are d i , j V M D and d ^ i , j V M D , respectively. They differ by a combined altimetry error ε i j :
d i , j V M D = s t , i z s t , j z = s ^ t , i z s ^ t , j z ( ε i ε j ) = d ^ i , j V M D ε i j
If the altimetry errors are chosen from zero mean normal distributions with standard deviations σ i , z and σ j , z , then the combined error ε i j is distributed normally with standard deviation σ i j , z = ( σ i , z ) 2 + ( σ j , z ) 2 . Now, the probability that the real VMD is within a NMAC range ϑ nmac (=100 ft) given a particular measured VMD is
P ( ϑ nmac < d i , j V M D ϑ nmac | d ^ i , j V M D ) = F N ( ϑ nmac ; d ^ i , j V M D , σ i j , z ) F N ( ϑ nmac ; d ^ i , j V M D , σ i j , z )
with F N ( ; μ , σ ) , a cumulative normal probability distribution. Figure 1 shows this P(NMAC) distribution for bias altimetry errors according to the ACAS MOPS [3,5] for a range of flight levels. The distribution gets broader for larger flight levels, as a result of increasing standard deviations of altimetry errors at higher altitude. The peak value of P(NMAC) at d ^ i , j V M D = 0 decreases from 0.88 at sea level to 0.54 at FL 400. Lowest values of P(NMAC) in the depicted graphs at d ^ i , j V M D = ± 400 ft are 1.2 × 10⁻⁶ at FL 0 and 1.3 × 10⁻² at FL 400.
Using the same principle, P(NMAC) estimates can be derived for other altimetry error probability distributions. A P(NMAC) estimate based on double exponential distributions, as employed in [4], finds its origin in [36], see also Section 9.5 of [10]. The tails of the double exponential distribution are longer with respect to the normal distribution of Figure 1, implying that larger measured VMDs have more impact on the P(NMAC) estimate.
In the altimetry error postprocessing results in this paper, the normal distribution at FL 120 is applied, in line with the altitude of CPA in the encounters and the sensor error models applied in MC simulations. This facilitates direct comparison of the estimates by the altimetry error postprocessing with the counting-based P(NMAC) estimates. For encounter sets the averages over all P(NMAC) estimates are provided.

4. Results

Numerous simulation results for the encounter-scenarios defined in Section 3 are presented next. Section 4.1 presents results for the various kinds of encounter variability and sensor errors. Section 4.2 compares results of altimetry error postprocessing with MC simulation results. Section 4.3 provides results for resolved versus induced NMAC events. Section 4.4 presents results of the various pilot response models. Section 4.5 provides an overall comparison of contributions to unresolved P(NMAC) estimates.

4.1. Sensor Errors and Encounter Variability

Table 1 shows the probability estimates of the remaining NMAC events in the various types of NMAC encounters (Section 3.1) for three types of scenarios for sensor errors (Section 3.2.3): no errors (E0), only altimetry bias (E2), all sensor errors (E1). In these encounter scenarios, the pilots of both aircraft are always responding according to the ICAO standard response model.
For the set of encounters with straight trajectories (no vertical rate change, no horizontal turn), Table 1 shows that there are basically no remaining NMAC events for both ACASs. Both ACASs support collision avoidance very effectively and their performance is robust against sensor errors.
For the set of encounters with horizontal turns but without vertical rate changes, the results show that the collision avoidance of ACAS Xa is much more effective than of TCAS II. For ACAS Xa in the case without sensor errors, no remaining NMAC events were found, and in the cases with sensor errors, P(NMAC) ≈ 5 × 10⁻⁵, meaning that about 19,999 out of 20,000 NMAC encounters are resolved successfully. For TCAS II, P(NMAC) ≈ 2 × 10⁻³ (499 out of 500 NMAC encounters are resolved successfully) and the performance for these encounters is not sensitive to sensor errors. An example of an encounter where a collision is avoided when using ACAS Xa, but not when using TCAS II, is shown in Figure 2. In this encounter AC001 is climbing and making a right turn, while AC002 is flying level and making a left turn, leading to a VMD of 16 ft and an HMD of 79 ft at time 12:00:00. TCAS II provides the first TAs about 45 s before CPA, and a second TA to AC002 only 6 s before CPA, but all first RAs are only about 5 s before CPA, which is not timely enough to avoid a collision (effectuated VMD is 0 ft). ACAS Xa provides a TA for AC001 60 s before CPA, and a TA for AC002 only 6 s before CPA. The Climb (CL) RA provided by ACAS Xa to AC002 matches the RA by TCAS II, but the sequence of RAs for the climbing AC001 avoid the collision. First, there is a Level Off (LO) RA 27 s before CPA, then a Clear of Conflict (COC) at 45 before CPA, then there are subsequent LO and Descend (DE) RAs, which all by all lead to a VMD of 456 ft. This kind of performance is also seen in other encounters with horizontal turns: TCAS II provides RAs too late to avoid a collision, while ACAS Xa provides RAs to a climbing or descending aircraft, such that a collision is avoided. The optimization of ACAS Xa thus seems to have led to a behavior where RAs are triggered for other combinations of relative speeds and positions than the rules applied in TCAS II, such that it is more sensitive for horizontal turns.
For the set of encounters with vertical rate changes but without horizontal turns, Table 1 shows that here the large majority of NMAC events can also be avoided, but the differences in performance between TCAS II and ACAS Xa are more modest. The remaining NMAC events are often hard-to-solve encounters, e.g., both aircraft flying level and about 10 s before CPA one starts to climb and the other to descend, thus leaving very little time to react to initial RAs and avoid an NMAC. For the vertical rate change encounters, sensor errors have a considerable impact on the collision avoidance effectiveness, leading to an increase in P(NMAC) of about 70% for TCAS and of 120% for ACAS Xa. These increases are almost completely due to the bias in the altimetry sensors. Overall, in the encounter scenario with vertical rate changes only, and with all sensor errors, P(NMAC) is about 11% less for ACAS Xa than for TCAS II.
For the set of encounters including both vertical rate changes and horizontal turns, the largest P(NMAC) estimates are achieved, reflecting the larger complexity of these encounters. Sensor errors have a considerable impact on the performance, leading to an increase in P(NMAC) of about 25% for TCAS and 75% for ACAS Xa for the “all sensor errors” case. Overall, in the scenario with all sensor errors, P(NMAC) is about 13% less for ACAS Xa than for TCAS II.
The P(NMAC) estimates in Table 1 for the cases with only altimetry bias versus all sensor errors are about the same for TCAS II in all encounter sets, and for ACAS Xa in the encounters without horizontal turns. For ACAS Xa we have the remarkable finding that, in the encounter sets with horizontal turns, the P(NMAC) values are smaller if all sensor errors are included rather than only altimetry bias. This indicates that the errors in the slant range and bearing measurements help to reduce the collision risk in these encounter sets. In principle different measurements can trigger different types and timings of RAs, which may be more or less effective in preventing NMAC events. Indeed, in individual runs (like those in Figure 2) cases exist where errors in the slant range and bearing measurements contributed to NMAC events, as well as where they prevented NMAC events. Overall, more NMAC events were prevented than contributed to.
Figure 3 shows histograms of the relative frequencies of the VMD for encounter-scenarios with all sensor errors (E1 of Section 3.2.3) and standard pilot response for the four sets of encounters. It can be observed that ACAS Xa tends to achieve larger VMDs than TCAS II for all types of encounters. It is most prominent for encounters with straight trajectories, where the mean VMD for TCAS II is 870 ft and for ACAS Xa is 1079 ft. Here both distributions have considerable tails; ACAS Xa induces even a VMD of more than 2000 ft in 3.3% of the cases. Excessively large VMDs are not desirable, since they may lead to conflicts with other traffic. The forms of the VMD distributions become less skewed if there is more variability in the encounters. In particular, the likelihood of small VMDs is increasing (which is in line with increase in NMAC probability observed in Table 1) and the likelihood of large VMDs is decreasing. These shifts are more prominent for ACAS Xa than for TCAS II. For instance, for encounters including horizontal turns and vertical rate changes, the mean VMD is 795 ft for TCAS II (versus 870 ft for straight trajectories), whereas the mean VMD is 839 ft for ACAS Xa (versus 1079 ft for straight trajectories).

4.2. Altimetry Error Postprocessing

The results in Table 2 and Table 3 provide comparisons of P(NMAC) estimates based on NMAC event counting in MC simulation including altimetry errors versus probability estimates achieved by altimetry error postprocessing (AEP) of VMD observations as explained in Section 3.3.2. The same Gaussian altimetry bias distribution is used in all cases.
Table 2 is based on simulations of encounter scenarios where are only altimetry biases (E2, N R u n = 10 6 ) and where there are no sensor errors (E0, N R u n = 5 10 4 ). The results show that the estimates achieved by AEP are mostly below the 95% confidence intervals of the counting-based estimates achieved in the MC simulation. Only for the cases where both aircraft have straight trajectories do the AEP estimates fall within the 95% confidence interval, which is facilitated by the wide intervals due to the very small numbers of observed NMAC events. Comparison of the P(NMAC) estimates for the ACAS types in scenarios E0 and E2 in Table 2 shows that the relative differences are considerably larger for ACAS Xa than for TCAS II. For instance, in encounters with horizontal turns but without vertical rate change, the AEP-based P(NMAC) is 5.3% lower for TCAS, but even 38.8% lower for ACAS Xa. So, in these results there are consistently larger differences in the P(NMAC) estimates for ACAS Xa if altimetry error postprocessing is used.
The results in Table 3 concern MC-simulated encounter scenarios that include errors in all sensors (E1, N R u n = 10 6 ) and encounter scenarios without altimetry biases but including all other sensor errors (E3, N R u n = 10 6 ). AEP to account for the altimetry biases is performed for set E3. For straight trajectories (almost) no NMAC events occurred and the point estimates for the postprocessing are in the 95% confidence intervals. For the other cases, the point estimates following the postprocessing are below the counting-based point estimates, and in four cases they are below the lower boundaries of the 95% confidence interval. The biases due to AEP are larger for ACAS Xa than for TCAS II.

4.3. Resolved versus Induced NMAC Events

Table 4 compares the probabilities of the remaining NMAC events in NMAC encounters with the probabilities of induced NMAC events in No NMAC encounters. The table also shows the percentages of the probabilities of induced NMAC events versus non-resolved NMAC events. These results were attained with a scenario including all sensor errors and with pilots (always) responding according to the ICAO pilot response model.
The results show that, in the encounters with straight trajectories no NMAC events were induced, confirming the very effective performance of both ACASs for such encounters. In the encounters including vertical rate changes and/or horizontal turns, NMAC events were induced in the encounter sets that did not originally include them. For TCAS II the percentages of induced versus non-resolved NMAC events are in the range of 4.7% to 8.6%. For ACAS Xa, these percentages are consistently larger, ranging from 7.6% to 21.3%. In addition, for encounters including vertical rate changes, the probabilities of induced NMACs are higher for ACAS Xa then for TCAS II. Although ACAS Xa is more effective for resolving NMAC encounters for these types of trajectories, the overall performance of ACAS Xa versus TCAS II for these cases thus depends on the likelihoods of NMAC versus No NMAC encounters and the specific characteristics of the encounter sets.

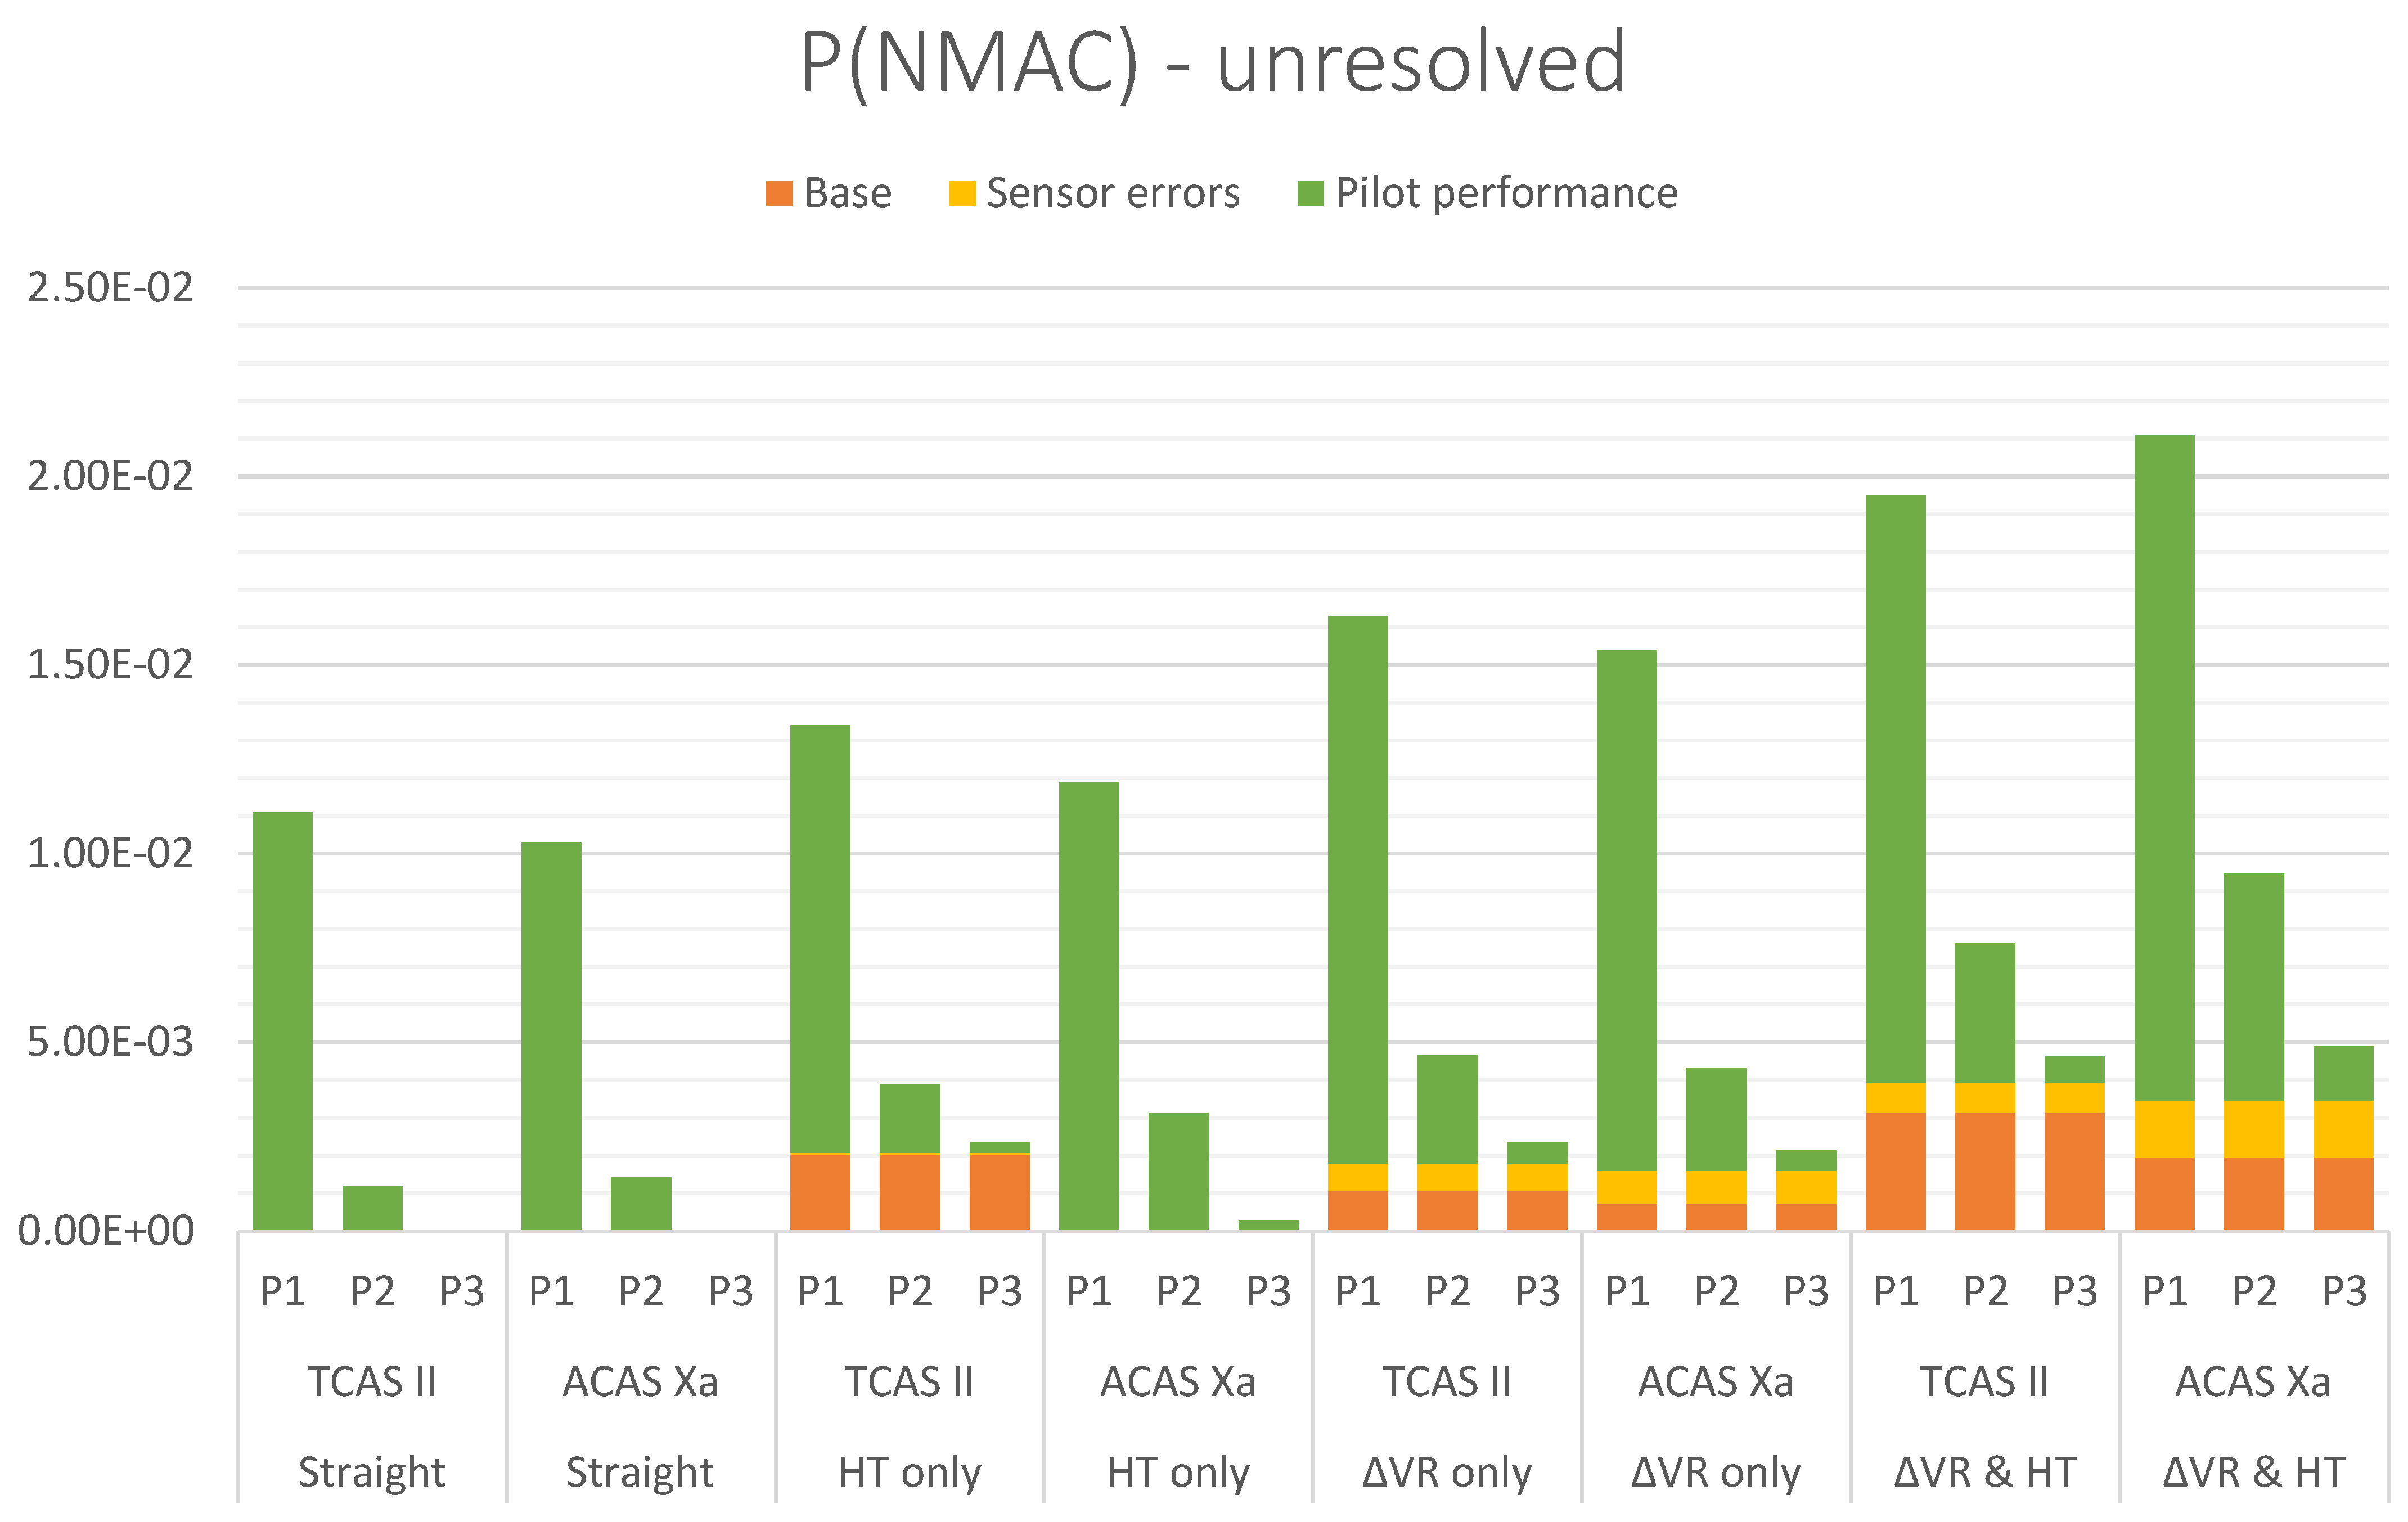
4.4. Pilot Performance

This section provides the NMAC probability estimates for the various cases/models of pilot response. All results are achieved for the nominal set of sensor errors (E1). Table 5 shows the results for the scenarios where the pilots of both aircraft respond to provided RAs following the standard response model (reference case), versus scenarios where only the pilots of aircraft 1 respond following the standard response model and the pilots of aircraft 2 do not respond.
For encounters with straight trajectories, it was shown earlier that both ACASs are very effective in collision avoidance and are robust against sensor errors. The results in Table 5 show that if one of the pilots does not respond, not all NMACs can be avoided: in about one per 210 cases (TCAS II) to one per 450 cases (ACAS Xa) an NMAC is not resolved. For encounters with horizontal turns but without vertical rate changes, the P(NMAC) estimates are almost equal for both ACASs if only one aircraft responds. Comparing with the reference where the pilots of both aircraft respond, it can be recognized that there is a much larger increase in P(NMAC) for ACAS Xa. For encounters with vertical rate changes but without horizontal turns, the lack of pilot response in one of the aircraft leads to a P(NMAC) increase by a factor 11.8 for TCAS II and about a factor 9.6 for ACAS Xa. So here, ACAS Xa is a bit more robust than TCAS II for the lack of pilot response. For encounters with both vertical rate changes and horizontal turns, the lack of pilot response in one of the aircraft leads to a P(NMAC) increase by a factor 8.5 for TCAS II and a factor 11.6 for ACAS Xa. So here TCAS II is more robust than ACAS Xa for the lack of pilot response.
An example of an encounter with straight trajectories that leads to non-resolved NMACs for both TCAS II and ACAS Xa is shown in Figure 4 for the TCAS II case. Interestingly, the ACAS performance can be sensitive to sensor errors in such encounter scenarios. Figure 4 shows two MC simulation runs of the same trajectories in the encounter for different realizations of the sensor errors for TCAS II; in both cases only the pilots of AC001 respond according to the standard ICAO response model. In run one, AC001 receives the following RAs: Level Off (LO), Climb (CL), and another LO, which lead to a VMD of 1380 ft. In run two, AC001 receives the RAs Maintain Descent (MDE) and Increase Descent (IDE) to 2500 fpm descent, which lead to a VMD of 53 ft and an NMAC. In this encounter the MDE and IDE are not effective since aircraft 1 is already descending at about 2300 fpm and aircraft 2 does not react to its Level Off and Climb RAs. In this specific encounter, the 20 MC simulation runs led to 13 NMAC events for TCAS II and to 5 NMAC events for ACAS Xa. So, this encounter provides an example where (limited) sensor errors can lead to different RAs and to large VMD differences.
To provide more insight into the variability in VMDs, Figure 5 shows histograms for critical encounters with straight trajectories having at least one unresolved NMAC in its 20 MC simulation runs, for the scenarios with one pilot responding to RAs from TCAS II or ACAS Xa. It is clear from these histograms that, for these critical encounters, the VMD is either very small, leading to an NMAC, or the VMD is quite large, attaining a higher mode than that for the VMDs for straight trajectories when both pilots are responding (see Figure 3). So, the (limited) sensor errors basically lead to divergence in the attained VMD. This is an example of the butterfly effect in chaos theory, where a small change leads to large consequences in a nonlinear dynamical system.
The above simulation results applied deterministic pilot models. In reality the performance of pilots in responding to RAs is variable. To evaluate variable pilot performance, pilot models P1, P2, and P3 were defined in Section 3.2.4. Table 6 shows the P(NMAC) estimates for scenarios with these pilot response models. Model P3 means that the pilot always responds, but that there is variability in the timing and acceleration of the response. Comparison of P3 with the reference case PP in Table 5 shows the following.
  • For encounters with straight trajectories, no NMAC events are found for ACAS Xa, while there is a considerable increase in the P(NMAC) estimate for TCAS II. However, the numbers of simulated NMACs are small.
  • For encounters including vertical rate changes and/or horizontal turns, the P(NMAC) estimates increase for both TCAS II and ACAS Xa. The relative increases are consistently larger for ACAS Xa (34% to 600%) than for TCAS II (13% to 30%). So, in these cases, ACAS Xa is found to be less robust for the inclusion of timing and acceleration variability in pilot response. Nevertheless, the P(NMAC) estimates remain smaller for ACAS Xa, except for encounters with both vertical rate changes and horizontal turns.
Models P1 and P2 include the same timing and acceleration variability as model P3; moreover, they include two types of response models. Model P1 reflects stubborn pilots, who make a decision to respond once and who do not reconciliate in the case of subsequent RAs. The following results for P1 can be observed in Table 6.
  • The P(NMAC) estimates all lie in the range of [1.03 × 10⁻², 2.11 × 10⁻²]. A priori is it known that the minimum of P(NMAC) is 1 × 10⁻², since the probability of not responding was set as 0.1 per pilot and the probabilities per aircraft are modelled as independent. These probabilities are all considerably larger than those in the reference case with a standard ICAO response model, which lie in the range [0, 3.93 × 10⁻³] (see PP results in Table 5).
  • The P(NMAC) estimates are smaller for ACAS Xa than for TCAS II, except for encounters that include both vertical rate changes and horizontal turns.
For model P2, representing pilots who do reconciliate in the case of subsequent RAs, the following results can be observed.
  • The P(NMAC) estimates lie in the range [1.20 × 10⁻³, 9.47 × 10⁻³]. They are consistently smaller than those of P1 and consistently larger than those of the standard PP.
  • The P(NMAC) estimates are smaller for TCAS II in the cases of straight trajectories as well as the cases with both vertical rate changes and horizontal turns. In the other two sets, the P(NMAC) estimates are smaller for ACAS Xa.

4.5. Comparison of Variability Contributions

In support of the main objective of this paper, to provide insight in contributions of various sources of variability, Figure 6 provides a comparative visualization of the main results. The bars show the contributions of P(NMAC) in encounters leading to an NMAC without resolution using the following three components:
  • Base: point estimates for scenarios without sensor errors and with standard pilot response (from Table 1);
  • Sensor error: differences between point estimates for scenarios with and without sensor errors; both with standard pilot response (from Table 1);
  • Pilot performance: differences between point estimates for scenarios with sensor errors and standard pilot performance (from Table 1) and scenarios with sensor errors and one of the pilot response models P1, P2, or P3 (from Table 6).
These bars are shown for TCAS II and ACAS Xa, as well as for the type of trajectories in the encounters: straight trajectories, including horizontal turns only, including vertical rate changes only, and including horizontal turns and vertical rate changes.
Figure 6 shows that pilot performance is typically the most important factor for the effectiveness of ACAS, both for TCAS II and ACAS Xa. The sizes of the pilot performance contributions largely depend on the type of pilot response model and their parameterization, but also the types of encounters and ACAS type influence the P(NMAC) contributions.
The base risks stemming from the types of trajectories in the encounters mostly provide the second most important contribution. These base risks are especially prominent for encounters that include vertical rate changes with or without horizontal turns, as well as encounter scenarios with horizontal turns and TCAS II. ACAS Xa is considerably more effective in attaining low base risks than TCAS II for these types of encounters. For encounters with straight trajectories, both TCAS II and ACAS Xa are very effective, and the base risk is practically zero.
The contributions of sensor errors to P(NMAC) are mostly the smallest. Especially in encounters with straight trajectories or involving only horizontal turns, these contributions are very small. In encounters with vertical rate changes, sensor errors play a more prominent role, and their contribution is larger for ACAS Xa than for TCAS II.

5. Discussion

The objective of this paper is to present and analyze the types of new results that can be achieved by MC simulation of agent-based models for ACAS encounter scenarios and to contrast them with customary techniques applied in ACAS operational validation studies. This has been attained in a use case comparing the performance of a development version of ACAS Xa with TCAS II v7.1. A detailed discussion of the results is presented below. The main conclusions and recommendations are summarized in Section 6.
As already indicated in the Introduction, the scope of this use case is considerably limited with respect to the scope that would be needed in an operational validation study. The use case considers pairs of aircraft that are both equipped with TCAS II or with ACAS Xa, neglecting TCAS II–ACAS Xa pairs, or pairs where one of the aircraft is not ACAS equipped. All aircraft use mode S transponders, neglecting mode C, which has less accurate slant range and bearing measurements, and coarser altitude discretization. The ACAS Xa option to employ ADS-B for threat resolution was not used. This implies that the same surveillance information was available for TCAS II and ACAS Xa, thus creating a level playing field for comparing the tracking and alerting modules of both ACASs, but it also means that the benefit that ADS-B can provide to ACAS Xa was not accounted for. The CPA of all encounters is attained at flight level 120, neglecting other flight levels. The performance of TCAS II and ACAS Xa depends on the altitude, and it is known that their performance varies for different altitude layers [9,10]. The encounters in the use case were constructed to represent classes with different types of variability (horizontal turns, vertical rate changes), but they do not represent the probabilistic characteristics of a particular airspace using some Bayesian network model [7,8,20,21,22,23,24]. The use case considered the safety metrics P(NMAC) and VMD distributions, but it did not include operational acceptance metrics like generic or specific RA alert rates, time between TA and initial RA, or altitude crossings. Notwithstanding these limitations, the agent-based models and their implementation in CAVEAT fully support extending the scope and performing MC simulation for additional scenario settings of balanced encounter sets and to analyze additional evaluation metrics.
As explained in Section 3.3.2, ACAS operational validation studies have consistently used altimetry error postprocessing (AEP) of deterministic simulations to account for the dispersion of altitude estimates [9,10,36]. A key result of this paper (see Section 4.2) is that that the postprocessing of altimetry errors leads to P(NMAC) estimates that are often lower than the estimates achieved by MC simulation for the same altimetry error distribution. AEP is based on the assumption that the real VMD differs from the VMD measured in a deterministic simulation by a combined error with a probability distribution that is based on the altimetry error distributions of the involved aircraft. The lower P(NMAC) estimates achieved by AEP indicate that this assumption is not valid. An explanation for the failing of this assumption is the finding in Section 4.4 that limited differences in altimetry biases can lead to large VMD differences, since they trigger different RA sequences. Such small sensor error differences leading to large VMD differences is an example of the butterfly effect in nonlinear dynamical system. It implies that the key assumption underlying the AEP does not consistently hold.
The results in Section 4.2 also show that the AEP-induced biases in the P(NMAC) estimates are consistently larger for ACAS Xa than for TCAS II. A possible reason for this could be that the adaptation of the optimization criteria, such as the components of the reward function, during the development of ACAS Xa has been driven by AEP-based P(NMAC) estimates. This could mean that the biases in the P(NMAC) estimates have influenced the ACAS Xa decision logic, leading to decisions that are more favorable to such biased P(NMAC) estimates. Whatever the reason, it follows from the butterfly effect identified in Section 4.4, and the results in Section 4.2, that the usual approach of altimetry error postprocessing can lead to the underestimation of P(NMAC) and in a different evaluation for ACAS Xa and TCAS II. Since such biases in P(NMAC) estimates should be avoided in certification of new ACASs, it is advised that future operational validation studies use MC simulation and counting-based P(NMAC) estimates to account for altimetry errors instead of AEP-based estimates.
Conducting an MC simulation requires more computational resources and/or time than deterministic simulation of encounter scenarios. In CAVEAT, the simulation engine for deterministic and MC simulations is largely the same (except for the inclusion of random effects) and their processing times for same numbers of runs are about the same. For illustration, the simulations performed for this paper were carried out on a Windows PC with maximum utilization of eight cores. Here, the simulation time of 50,000 runs was 10 min for TCAS II encounter scenarios and 20 min for ACAS Xa encounter scenarios. The simulation time increases linearly with the number of MC simulation runs per encounter scenario, e.g., 20 MC simulation runs per encounter scenario last 200 to 400 min for the indicated sets and PC.
To address the question “what matters in the effectiveness of ACAS performance?”, fractions of remaining NMAC events in sets of encounters that included NMAC events before ACAS advisories were compared for various conditions. The overview in Section 4.5 clearly shows that pilot performance has the largest contribution to the P(NMAC) estimates and that the size of these contributions depends on the type of pilot response model. The smallest contributions are for the model where the pilots always respond but apply variable response times and acceleration. Although relatively small, these risk contributions can be similar to those induced by sensor errors. This type of pilot response variability has not been included systematically in operational validation studies. Larger contributions exist for cases where pilots may not respond to RAs. Here the sizes of the contributions strongly depend on the type of decision making used by the pilots. If the pilots of an aircraft decide once to not respond to RAs, then the risk is considerably larger than if the pilots reconciliate and update their earlier decision given a subsequent RA. The first type of behavior has typically been included in operational validation studies, but downlinked RA data in [29] indicate that the compliance for subsequent RAs is better than for initial RAs. As such, the use of a “reconciliating” pilot response model in MC simulation facilitates a more comprehensive analysis of pilot response. Naturally, the sizes of the pilot response risk contributions strongly depend on the values of the response probability. The simulations in this study used a non-response probability of 10% for initial RAs, which is similar to data from [1,29], but in [28], larger non-response probabilities were found. For the probability of response to subsequent RAs less data are available. So, it is fair to say that there exists considerable uncertainty in the values of response probabilities, while they have a large impact on the risk contributions.
Notwithstanding the uncertainty in the type of pilot response model and its parameterization, it stands out that pilot performance has a very large contribution to the overall effectiveness of ACAS advisories in avoiding collisions. In addition, the attained results indicate that the contributions of pilot performance are far larger than the performance differences between TCAS II and ACAS Xa. The design of ACAS Xa has focused on the new surveillance & tracking and the threat resolution modules. The human machine interface of ACAS Xa is largely the same to that of TCAS II, it uses the same visualization and only has some changes in aural annunciations (e.g., the advisory to maintain vertical speed while descending is announced as “Maintain vertical speed, maintain” in TCAS II v7.1, while it is announced as “Descend, descend” in ACAS Xa). Historically, the main way to improve pilot response probability has been by training and safety awareness campaigns for pilots. A technical solution supporting response to RAs is the automatic response by the autopilot/flight director TCAS capability [37], which is available on a number of Airbus aircraft [38]. In the future, means to support effective response to RAs will remain essential to assure the overall effectiveness of TCAS II and ACAS Xa.
The second most important contribution to unresolved NMAC events stems from the types of trajectories in the encounters. In the attained results, encounters with straight trajectories are handled very effectively by TCAS II and ACAS Xa, encounters with only horizontal turns lead to some problems for TCAS II but not for ACAS Xa, encounters with vertical rate changes lead to some problems for TCAS II as well as for ACAS Xa, and these problems become worse if they also include turns. In interpreting these results it should be realized that the encounter sets are not based on an airspace-specific encounter model, but that they hold various types of encounters with characteristics chosen from uniform distributions as a way to represent various types of variability in the trajectories. In real operations some types of encounters are more likely than others, e.g., encounters with straight trajectories are far more likely than encounters where aircraft are turning and levelling off. In addition, some speeds, rates of turn, and vertical accelerations are more likely than others, impacting P(NMAC) estimates in the classes. In operational validation studies, encounter models based on radar observations should remain to play a key role. Nevertheless, the insights that can be attained by clustering for horizontal turns and/or vertical rate changes can be an added value.
Overall, the impact of sensor errors on unresolved NMAC probability is smaller than the contributions by pilot performance and encounter trajectories. The attained results indicate that the impact of sensor errors depends considerably on the types of trajectories in the encounters. In encounters without vertical rate changes (i.e., straight trajectories or only horizontal turns) both TCAS II and ACAS Xa are very robust against sensor errors, while in encounters with vertical rate changes sensor errors lead to a considerable increase in unresolved NMAC events. In these latter types of encounters, ACAS Xa is more sensitive to sensor errors than TCAS II. This is remarkable since there are more advanced tracking algorithms in ACAS Xa than in TCAS II. A possible explanation could be that the optimization process of the ACAS Xa decision logic has not consistently included sensor errors, such that its performance was tuned towards cases without such sensor errors. The more generic rules in TCAS II have not been optimized in such a detailed way, and as a result, it can be more robust for sensor errors.
For judging the overall collision avoidance performance of an ACAS, one needs to evaluate the likelihood of unresolved NMAC events, which were discussed above, as well as the likelihood of induced NMAC events, which are cases where ACAS contributes to an NMAC event that would not have occurred otherwise. In the MC simulation of encounter scenarios, the induced risk can be evaluated straightforwardly by counting NMAC events resulting in encounters that were without NMAC originally. No troublesome assumptions about combined altimetry error distributions have to be made to account for altimetry errors in such evaluation. While NMAC encounters describe a limited set of well-defined vertical and horizontal miss distances, the VMD and HMD boundaries of No NMAC encounters are not strictly defined. Clearly the induced risk strongly depends on these boundaries, and it will tend to be zero for large enough values. Induced risk results for a particular choice of VMD and HMD boundaries were shown, which illustrate the MC simulation-based evaluation including sensor errors. A meaningful evaluation of induced risk, however, requires an encounter model with proper distributions of VMD and HMD of No NMAC encounters, in combination with other encounter characteristics.
As has been explained in the Introduction, dynamic programming as used in the design of ACAS Xa is an off-line reinforcement learning approach [18]. Its achieved alerting logic depends on its underlying models, the reward function, the data-informed encounters, and the settings used in simulations of the logic, the judgement of the simulated performance and resulting adaptation of the reward function. As such, it depends on a combination of models, underlying data, simulation settings, and judgements. The way that machine learning approaches can be effectively applied to achieve trustworthy AI in aviation applications is a key topic in current research and development. As part of its AI roadmap, the European Aviation Safety Agency (EASA) has published first guidance for machine learning applications [39]. The scope of this release is supervised learning applications and suitable learning assurance processes, which aims at providing assurance on sufficient performance of the intended function of the AI-based system, and at ensuring that the resulting trained models possess sufficient guarantees of generalization and robustness. While [39] does not yet address reinforcement learning, these general objectives are also appropriate for systems based on reinforcement learning. For an ACAS this means that it effectively supports collision avoidance (intended function) for a broad range of encounter conditions (generalization) while it is robust for sensor errors and variability in pilot response. In above discussion, some cases were indicated where the optimization process may have been influenced by its conditions and the choices made, thus rendering it less robust for some variabilities. It is advised to pursue more detailed analyses concerning the generalization and robustness of ACASs for sensor errors and pilot response in operational validation studies.

6. Conclusions and Recommendations

The following main conclusions and recommendations are derived from the above discussion of the results.
  • The scope of the use case has been limited, such that no final conclusions on the performance of ACAS Xa versus TCAS II are drawn. It is advised to extend the scope as part of a future validation study for the latest version of ACAS Xa [6].
  • The assumption underlying altimetry error postprocessing, namely that VMD equals deterministically simulated VMD plus a (limited) altimetry error, does not consistently hold. MC simulation shows that the butterfly effect of non-linear dynamical systems exists; limited altimetry errors can lead to large VMD differences for the same encounter. It has been shown that AEP-based P(NMAC) estimates are often lower than the estimates achieved by MC simulation for the same altimetry error distribution. It is advised to use MC simulation of altimetry errors in future validation studies.
  • Pilot response probability has the largest impact on overall ACAS effectiveness, and it is much larger than performance differences between TCAS II and ACAS Xa. Advanced pilot models with different response probabilities for initial and subsequent RAs lead to different results for ACAS effectiveness. It is advised to include advanced types of pilot response models in future validation studies.
  • The obtained results show that AEP-based biases in P(NMAC) estimates are larger for ACAS Xa than for TCAS II, and that ACAS Xa can be more sensitive to sensor errors than TCAS II. It is possible that sensor errors neglected in the optimization process of ACAS Xa have led to more specific and less robust performance in its alerting logic, while TCAS II uses generic rules. It is advised to perform more detailed analyses of the generalization and robustness of ACAS in future operational validation studies, so as to assure trustworthy AI performance in ACAS Xa.

Funding

This research received no external funding.

Data Availability Statement

No new data were created or analyzed in this study. Data sharing is not applicable to this article.

Acknowledgments

I would like to thank Carmelo-Javier Villanueva-Cañizares and the development teams at EUROCONTROL, NLR, everis, and NTT-Data Spain for their support in the development of the models and software for CAVEAT, which have enabled this study.

Conflicts of Interest

The author declares no conflict of interest.

References

  1. EUROCONTROL. Network Manager Operational Safety Study: TCAS RA Not Followed; EUROCONTROL: Brussels, Belgium, 2017.
  2. Drozdowski, S. Traffic Alert and Collision Avoidance System (TCAS)—Selected Statistical and Performance Data in Core European Airspace; EUROCONTROL: Brussels, Belgium, 2021.
  3. EUROCAE. Minimum Operational Performance Standards for Traffic Alert and Collision Avoidance System II (TCAS II), Volume I, ED-143; EUROCAE: Malakoff, France, 2008. [Google Scholar]
  4. ICAO. Annex 10 Aeronautical Telecommunications, Volume IV Surveillance and Collision Avoidance Systems; International Civil Aviation Organization: Montreal, QC, Canada, 2014. [Google Scholar]
  5. EUROCAE. Minimum Operational Performance Standards for Airborne Collision Avoidance System X (ACAS X) (ACAS Xa AND ACAS Xo), ED-256; EUROCAE: Saint-Denis, France, 2018. [Google Scholar]
  6. EUROCAE. Minimum Operational Performance Standards for Airborne Collision Avoidance System X (ACAS X) (ACAS Xa AND ACAS Xo), ED-256A; EUROCAE: Saint-Denis, France, 2023. [Google Scholar]
  7. Kochenderfer, M.J.; Edwards, M.W.M.; Espindle, L.P.; Kuchar, J.K.; Griffith, J.D. Airspace Encounter Models for Estimating Collision Risk. J. Guid. Control Dyn. 2010, 33, 487–499. [Google Scholar] [CrossRef]
  8. Dean, G.; Mosteiro, S.H.; Huck, V.; Irvine, R.; Phu, D.; Shaw, C.; Melgar, A.S.; Howell, R.; Hutchinson, H.; Painter, D. Collision Avoidance Fast-Time Evaluator (CAFE) Revised Encounter Model for Europe (CREME); SESAR Joint Undertaking: Brussels, Belgium, 2022. [Google Scholar]
  9. FAA. Post-FRAC Operational Validation Report; ACAS-RPT_18_018_V1R0, DO-385 V1R0; Federal Aviation Administration: Washington, DC, USA, 2018.
  10. EUROCONTROL. European Airborne Collision Avoidance System (ACAS) Xa Change Proposal (CP)1 Validation Report; EUROCONTROL: Brussels, Belgium, 2022.
  11. Stroeve, S.H.; Blom, H.A.P.; Medel, C.H.; Daroca, C.G.; Cebeira, A.A.; Drozdowski, S. Modeling and simulation of intrinsic uncertainties in validation of collision avoidance systems. J. Air Transp. 2020, 28, 173–183. [Google Scholar] [CrossRef]
  12. EUROCONTROL. CAVEAT Tool. Available online: https://skybrary.aero/articles/caveat-tool (accessed on 5 June 2023).
  13. Muñoz, C.; Narkawicz, A.; Chamberlain, J. A TCAS-II resolution advisory detection algorithm. In Proceedings of the AIAA Guidance, Navigation, and Control (GNC) Conference, Boston, MA, USA, 19–22 August 2013. [Google Scholar]
  14. EUROCONTROL. ACAS Guide, Edition 4.1; EUROCONTROL: Brussels, Belgium, 2022.
  15. EUROCAE. TCAS II Collision Avoidance System (CAS) Requirements Specification, Volume II ED-143; EUROCAE: Malakoff, France, 2008. [Google Scholar]
  16. Kochenderfer, M.J.; Holland, J.E.; Chryssanthacopoulos, J.P. Next-generation airborne collision avoidance system. Linc. Lab. J. 2012, 19, 17–33. [Google Scholar]
  17. Kochenderfer, M.J. Decision Making under Uncertainty; The MIT Press: Cambridge, MA, USA, 2015. [Google Scholar]
  18. Sutton, R.S.; Barto, A.G. Reinforcement Learning: An Introduction, 2nd ed.; MIT Press: Cambridge, MA, USA, 2020. [Google Scholar]
  19. Holland, J.E.; Kochenderfer, M.J.; Olson, W.A. Optimizing the next generation collision avoidance system for safe, suitable, and acceptable operational performance. In Proceedings of the Tenth USA/Europe Air Traffic Management Research and Development Seminar (ATM2013), Chicago, IL, USA, 10–13 June 2013. [Google Scholar]
  20. Kochenderfer, M.J.; Espindle, L.P.; Kuchar, J.K.; Griffith, J.D. A comprehensive aircraft encounter model of the National Airspace System. Linc. Lab. J. 2008, 17, 41–53. [Google Scholar]
  21. Kochenderfer, M.J.; Espindle, L.P.; Kuchar, J.K.; Griffith, J.D. Correlated Encounter Model for Cooperative Aircraft in the National Airspace System Version 1.0; Project report ATC-344; MIT Lincoln Laboratory: Lexington, MA, USA, 2008. [Google Scholar]
  22. Kochenderfer, M.J.; Kuchar, J.K.; Espindle, L.P.; Griffith, J.D. Uncorrelated Encounter Model of the National Airspace System Version 1.0; Project report ATC-345; Lincoln Laboratory, MIT: Lexington, MA, USA, 2008. [Google Scholar]
  23. Weinert, A.J.; Harkleroad, E.P.; Griffith, J.; Edwards, M.W.; Kochenderfer, M.J. Uncorrelated Encounter Model of the National Airspace System, Version 2.0; Lincoln Laboratory, MIT: Lexington, MA, USA, 2013. [Google Scholar]
  24. Underhill, N.K.; Harkleroad, E.P.; Guendel, R.E.; Weinert, A.J.; Maki, D.E.; Edwards, M.W.M. Correlated Encounter Model for Cooperative Aircraft in the National Airspace System; Project report ATC-440; MIT Lincoln Laboratory: Lexington, MA, USA, 2018. [Google Scholar]
  25. ICAO. Procedures for Air Navigation Services—Aircraft Operations: Volume I Flight Procedures, Doc 8168; International Civil Aviation Organization: Montreal, QC, Canada, 2016. [Google Scholar]
  26. BFU. Investigation Report; AX001-1-2/02; Bundesstelle für Flugunfalluntersuchung: Braunschweig, Germany, 2004. [Google Scholar]
  27. EASA. Annual Safety Review 2022; European Union Aviation Safety Agency: Collogne, Germany, 2022.
  28. Londner, E.H.; Moss, R.J. Bayesian Network Model of Pilot Response to Collision Avoidance System Resolution Advisories. J. Air Transp. 2018, 26, 171–182. [Google Scholar] [CrossRef]
  29. Michalski, M.; Drozdowski, S. The Assessment of Pilot Compliance with TCAS RAs, TCAS Mode Selection and Serviceability Using ATC Radar Data; EUROCONTROL: Brussels, Belgium, 2022.
  30. IATA; EUROCONTROL. Performance Assessment of Pilot Compliance with Traffic Collision Avoidance System Advisories Using Flight Data Monitoring—Guidance Material; IATA: Montreal, QC, Canada, 2022.
  31. Cloerec, A. Final Report on the Analysis of Airborne Recorded Data and Pilot Model Specification; ASARP/WP/19/D; ASARP Project; EUROCONTROL: Brussels, Belgium, 2005.
  32. EUROCONTROL. CAVEAT 3.8.1 User Manual; EUROCONTROL: Brussels, Belgium, 2022.
  33. Stroeve, S.H.; Villanueva-Cañizares, C.J. CAVEAT TAM—Models and Algorithms: Development of a Collision Avoidance Evaluation and Analysis Tool; NLR-CR-2023-285; Royal Netherlands Aerospace Centre NLR: Amsterdam, The Netherlands, 2023. [Google Scholar]
  34. Van der Linden, W.J. A lognormal model for response times on test items. J. Educ. Behav. Stat. 2006, 31, 181–204. [Google Scholar] [CrossRef]
  35. Owen, A. Simple Monte Carlo. In Monte Carlo Theory, Methods and Examples; 2013; Available online: https://artowen.su.domains/mc/ (accessed on 5 June 2023).
  36. McLaughlin, M.P.; Zeitlin, A.D. Safety Study of TCAS II for Logic Version 6.04; DOT/FAA/RD-92/22; Federal Aviation Administration: Washington, DC, USA, 1992.
  37. EUROCAE. Minimum Aviation System Performance Specification (MASPS) for Flight Guidance System (FGS) Coupled to Traffic Alert and Collision Avoidance System (TCAS), ED-224; EUROCAE: Malakoff, France, 2014. [Google Scholar]
  38. EUROCONTROL. Autopilot/Flight Director (AP/FD) TCAS Capability. 2023. Available online: https://www.skybrary.aero/articles/autopilotflight-director-apfd-tcas-capability (accessed on 7 June 2023).
  39. EASA. EASA Concept Paper: First Usable Guidance for Level 1&2 Machine Learning Applications; European Aviation Safety Agency: Cologne, Germany, 2023.
Figure 1. P(NMAC) estimate for a particular measured VMD and a flight level, assuming normally distributed altimetry errors.
Aerospace 10 00952 g001
Figure 2. Example encounter scenario without sensor errors where a collision is successfully avoided by ACAS Xa but not by TCAS II. Top: TCAS II, bottom: ACAS Xa, left: horizontal plane, right: altitude–time. Acronyms: PT = Proximate Traffic, TA = Traffic Advisory, LO = Level Off, DE = Descend, IDE = Increase Descend, CL = Climb, ICL = Increase Climb, COC = Clear of Conflict.
Aerospace 10 00952 g002
Figure 3. Histograms of the relative frequencies of the vertical miss distance for encounter scenarios with all sensor errors, standard pilot response for the four sets of encounters.
Aerospace 10 00952 g003
Figure 4. Results of two MC simulation runs for the same encounter and standard pilot response for AC001 for different realizations of sensor errors in MC simulation runs. Acronyms: TA = Traffic Advisory, LO = Level Off, CL = Climb, MCDE = Maintain Crossing Descent, COC = Clear of Conflict, MDE = Maintain Descent, IDE = Increase Descent, ICL = Increase Climb.
Aerospace 10 00952 g004
Figure 5. Histograms of the relative frequencies of the vertical miss distance for critical encounters with straight trajectories having at least one unresolved NMAC in the scenarios with one pilot responding to RAs from TCAS II or ACAS Xa.
Aerospace 10 00952 g005
Figure 6. Overview of contributions to sources of variability to P(NMAC) for encounters leading to an NMAC without resolution. Pilot models: P1, P2, P3. ACAS: TCAS II, ACAS Xa. Aircraft trajectories: straight, with horizontal turns (HT), with vertical rate changes (∆VR), with HT and ∆VR.
Aerospace 10 00952 g006
Table 1. Probability estimates of remaining NMAC events in NMAC encounters. Three types of scenarios for sensor errors: no errors, only altimetry bias, and all sensor errors.
Vertical Rate ChangeHorizontal TurnACASP(NMAC): Point Estimate and 95% Confidence Interval
No Sensor ErrorsOnly Altimetry BiasAll Sensor Errors
NoNoTCAS II0[0, 6.0 × 10⁻⁵]2 × 10⁻⁶[0, 4.8 × 10⁻⁶]1 × 10⁻⁶[0, 3.0 × 10⁻⁶]
ACAS Xa0[0, 6.0 × 10⁻⁵]0[0, 3.0 × 10⁻⁶]0[0, 3.0 × 10⁻⁶]
NoYesTCAS II2.04 × 10−3±4.0 × 10−42.07 × 10−3±8.9 × 10−52.08 × 10−3±8.9 × 10⁻⁵
ACAS Xa0[0, 6.0 × 10⁻⁵]6.60 × 10⁻⁵±1.6 × 10−54.70 × 10−5±1.3 × 10⁻⁵
YesNoTCAS II1.06 × 10−3±2.9 × 10−51.76 × 10−3±8.2 × 10−51.80 × 10−3±8.3 × 10⁻⁵
ACAS Xa7.20 × 10−4±2.4 × 10−41.59 × 10−3±7.8 × 10−51.60 × 10−3±7.8 × 10⁻⁵
YesYesTCAS II3.14 × 10−3±4.9 × 10−43.86 × 10−3±1.2 × 10−43.93 × 10−3± 1.2 × 10⁻⁴
ACAS Xa1.96 × 10−3±3.9 × 10−44.04 × 10−3±1.2 × 10−43.43 × 10−3± 1.2 × 10⁻⁴
Table 2. Comparison of P(NMAC) estimates based on simulation of altimetry biases versus postprocessing of altimetry biases for the same Gaussian altimetry bias distribution. Results for case with only altimetry biases (E2) versus case without sensor errors (E0).
Vertical Rate ChangeHorizontal TurnACASP(NMAC) Estimates
Simulated Biases (E2)
Point Estimate/95% Conf. Int.
Postprocessed Biases (E0)
Estimate/Rel. Diff
NoNoTCAS II2 × 10−6 [0, 4.77 × 10⁻⁶ ]4.93 × 10⁻¹³ -
ACAS Xa0 [0, 3.00 × 10⁻⁶ ]3.50 × 10⁻¹⁵ -
NoYesTCAS II2.07 × 10−3 [1.98 × 10⁻³, 2.16 × 10⁻³]1.96 × 10⁻³−5.3%
ACAS Xa6.60 × 10−5 [5.01 × 10⁻⁵, 8.19 × 10⁻⁵]4.04 × 10⁻⁵−38.8%
YesNoTCAS II1.76 × 10−3 [1.67 × 10⁻³, 1.84 × 10⁻³]1.63 × 10⁻³−7.4%
ACAS Xa1.59 × 10−3 [1.51 × 10⁻³, 1.67 × 10⁻³]1.32 × 10⁻³−17.0%
YesYesTCAS II3.86 × 10−3 [3.74 × 10⁻³, 3.99 × 10⁻³]3.65 × 10⁻³−5.4%
ACAS Xa4.04 × 10−3 [3.91 × 10⁻³, 4.16 × 10⁻³]3.66 × 10⁻³−9.4%
Table 3. Comparison of P(NMAC) estimates based on simulation of altimetry biases versus postprocessing of altimetry biases for the same Gaussian altimetry bias distribution. Results for case with all sensor errors (E1) versus case with all sensor errors except altimetry biases (E3).
Vertical Rate ChangeHorizontal TurnACASP(NMAC) Estimates
Simulated Biases (E1)
Point Estimate/95% Conf. Int.
Postprocessed Biases (E3)
Estimate/Rel. Diff
NoNoTCAS II1.00 × 10−6 [0, 2.96 × 10⁻⁶]8.06 × 10⁻¹³-
ACAS Xa0 [0, 3.00 × 10⁻⁶]9.46 × 10⁻¹³-
NoYesTCAS II2.08 × 10−3 [1.99 × 10⁻³, 2.17 × 10⁻³]1.96 × 10⁻³−5.8%
ACAS Xa4.70 × 10−5 [3.36 × 10⁻⁵, 6.04 × 10⁻⁵]3.47 × 10⁻⁵−26.2%
YesNoTCAS II1.80 × 10−3 [1.72 × 10⁻³, 1.88 × 10⁻³]1.70 × 10⁻³−5.6%
ACAS Xa1.60 × 10−3 [1.52 × 10⁻³, 1.68 × 10⁻³]1.38 × 10⁻³−13.8%
YesYesTCAS II3.93 × 10−3 [3.81 × 10⁻³, 4.05 × 10⁻³]3.60 × 10⁻³−8.4%
ACAS Xa3.43 × 10−3 [3.32 × 10⁻³, 3.54 × 10⁻³]3.11 × 10⁻³−9.3%
Table 4. Probability estimates of remaining NMAC events in NMAC encounters compared with induced NMACS in No NMAC encounters.
Vertical Rate ChangeHorizontal TurnACASP(NMAC) Estimates
Point Estimate/95% Confidence Interval
P(NMAC) for No NMAC versus NMAC Enc. (%)
NMAC EncountersNo NMAC Encounters
NoNoTCAS II1 × 10−6[0, 3.0 × 10⁻⁶]0[0, 3.0 × 10⁻⁶]0%
ACAS Xa0[0, 3.0 × 10⁻⁶]0[0, 3.0 × 10⁻⁶]-
NoYesTCAS II2.08 × 10−3±8.9 × 10−51.68 × 10−4±2.5 × 10−58.1%
ACAS Xa4.70 × 10−5±1.3 × 10−51.00 × 10−5±6.2 × 10−621.3%
YesNoTCAS II1.80 × 10−3±8.3 × 10−58.50 × 10−5±1.8 × 10−54.7%
ACAS Xa1.60 × 10−3±7.8 × 10−51.22 × 10−4±2.2 × 10−57.6%
YesYesTCAS II3.93 × 10−3±1.2 × 10−43.38 × 10−4±3.6 × 10−58.6%
ACAS Xa3.43 × 10−3±1.2 × 10−44.85 × 10−4±4.3 × 10−514.1%
Table 5. Probability estimates of remaining NMAC events in NMAC encounters with nominal sensor errors for two types of deterministic pilot response models: (1) both aircraft respond and (2) only AC1 responds.
Vertical Rate ChangeHorizontal TurnACASP(NMAC): Point Estimate and 95% Confidence Interval
Standard Response for Two Aircraft (PP)Standard Response for AC1 Only (PN)
NoNoTCAS II1 × 10−6[0, 3.0 × 10⁻⁶]4.78 × 10⁻³±1.4 × 10⁻⁴
ACAS Xa0[0, 3.0 × 10⁻⁶]2.24 × 10⁻³±9.3 × 10⁻⁵
NoYesTCAS II2.08 × 10−3±8.9 × 10−51.06 × 10−2±2.0 × 10⁻⁴
ACAS Xa4.70 × 10−5±1.3 × 10−51.03 × 10−2±2.0 × 10⁻⁴
YesNoTCAS II1.80 × 10−3±8.3 × 10−52.13 × 10−2±2.8 × 10⁻⁴
ACAS Xa1.60 × 10−3±7.8 × 10−51.53 × 10−2±2.4 × 10⁻⁴
YesYesTCAS II3.93 × 10−3±1.2 × 10−43.33 × 10−2±3.5 × 10⁻⁴
ACAS Xa3.43 × 10−3±1.2 × 10−43.98 × 10−2±3.8 × 10⁻⁴
Table 6. Probability estimates of remaining NMAC events in NMAC encounters. Three types of scenarios for stochastic pilot response models P1, P2, and P3.
Vertical Rate ChangeHorizontal TurnACASP(NMAC): Point Estimate and 95% Confidence Interval
Stoch. Pilot Model P1Stoch. Pilot Model P2Stoch. Pilot Model P3
NoNoTCAS II1.11 × 10−2±2.1 × 10−41.20 × 10−3±6.8 × 10−51.80 × 10−5±8.3 × 10⁻⁶
ACAS Xa1.03 × 10−2±2.0 × 10−41.44 × 10−3±7.4 × 10−50[0, 3.0 × 10⁻⁶]
NoYesTCAS II1.34 × 10−2±2.3 × 10−43.89 × 10−3±1.2 × 10−42.34 × 10−3±9.5 × 10⁻⁵
ACAS Xa1.19 × 10−2±2.7 × 10−43.14 × 10−3±1.1 × 10−42.82 × 10−4±3.3 × 10⁻⁵
YesNoTCAS II1.63 × 10−2±2.5 × 10−44.66 × 10−3±1.3 × 10−42.34 × 10−3±9.5 × 10⁻⁵
ACAS Xa1.54 × 10−2±2.4 × 10−24.30 × 10−3±1.3 × 10−42.14 × 10−3±9.1 × 10⁻⁵
YesYesTCAS II1.95 × 10−2±2.1 × 10−47.61 × 10−3±1.7 × 10−44.63 × 10−3±1.3 × 10⁻⁴
ACAS Xa2.11 × 10−2±2.8 × 10−49.47 × 10−3±1.9 × 10−44.89 × 10−3±1.4 × 10⁻⁴
Disclaimer/Publisher’s Note: The statements, opinions and data contained in all publications are solely those of the individual author(s) and contributor(s) and not of MDPI and/or the editor(s). MDPI and/or the editor(s) disclaim responsibility for any injury to people or property resulting from any ideas, methods, instructions or products referred to in the content.

