Article

The Application of a Laser-Printed Miniature Five-Hole Probe in the End-Wall Flow Measurement of a Multistage Axial Compressor

Jiangsu Province Key Laboratory of Aerospace Power Systems, College of Energy and Power Engineering, Nanjing University of Aeronautics and Astronautics, Nanjing 210016, China
*
Author to whom correspondence should be addressed.
Aerospace 2023, 10(12), 1020; https://doi.org/10.3390/aerospace10121020
Submission received: 31 October 2023 / Revised: 1 December 2023 / Accepted: 6 December 2023 / Published: 8 December 2023

Abstract

:
To make measurement of end-wall flow between blade rows in a compact multistage configuration possible, a miniature L-shaped five-hole probe was employed in this paper. This compact tip structure, realized by laser-printing instead of the conventional machining technique, reduces the blockage effect of this intrusive measurement on the flow and ensures high spatial resolution. The zonal method is introduced to extend the usable flow angle range up to 60 degrees. A local least-squares interpolation technique is utilized to acquire flow angle and static/total pressure. In order to improve accuracy for the points located at the sector boundary, the overlap region method is included in the interpolation. Additional test data indicate that the maximum error in flow angle is nearly within 1 degree, and the maximum errors of total pressure and static pressure are 0.56% and 1.9% respectively. The application in a low-speed multistage axial compressor indicates that the zonal method can decrease the number of points exceeding the measurable flow range and is of great significance for the end-wall flow measurement, especially for the near-stall condition. Compared with the traditional method, the proportion of available data for the near-stall state measurement was increased by 18% by using the zonal method.

1. Introduction

The axial compressor, as a core component of aircraft engines, plays a dominant role in engine performance. It is also well known that complex flow in the end-wall region is the primary loss source for axial compressors and has a significant effect on stability. It is necessary to obtain reliable measurements deep into the end wall region to understand the flow in the end wall region. Some research, for example, that of [1] and [2], indicate that about half of the loss is associated with the end-wall boundary layers, especially for the rear stages of multistage axial compressors. Since about 1970, a great reduction in the aspect ratio of blades has occurred in compressors [3], which makes this situation more acute. Typically, the optimum aspect ratio is below 1.5 for modern axial compressors, under which conditions no discernible freestream is visible in the flow field [4]. It is also evident that there is a close relationship between the blockage of the end-wall region and compressor stability from the work of Koch and Smith [2], and Koch [5]. Smith developed a correlation between the maximum blockage and geometry and aerodynamic parameters [6]. Based on the above literature review, it can be concluded that a reliable measurement deep into the end-wall region is needed.
Although non-intrusive measurement techniques, such as PIV and LDV, are increasingly widely employed in turbomachines recently, their application is restrained by some limitations. For example, seeding particles into the closed end-wall region is not always possible and the adjustment for optical devices is highly complicated. Conventional multi-hole probe is still a common method to measure three-dimensional flow field in turbomachines for their attractive features of robustness, ease of use, and relatively-low cost. Generally, the multi-hole probe can be used both in a nulling and non-nulling way. Nulling method is almost unrealistic for long time-consuming in practical application. Instead, a non-nulling method is a better alternative. For non-nulling measurement, careful calibration of the probe is needed before putting it into use in an unknown flow field.
Some features of end-wall flow in modern multistage high-pressure axial compressors challenge the manufacturing, calibration, and data reduction of the probe a lot. These features are reflected in the following four areas: (1) serious blockage, (2) high gradient, (3) narrow axial gap, and (4) violently changing flow angle. Some of the literature related to this challenge is cited to demonstrate the importance of the work in this paper. First, the end-wall region blockage is already serious, even exceeding 70% pitch [7]. In the measurement process, the presence of intrusive probes will aggravate the blockage [8,9] and even change the airflow parameters near the probe, causing measurement errors. Second, the multi-hole probe is usually calibrated in the uniform flow through a wind tunnel. However, pressure and velocity gradient in the end-wall region induce greater errors [10]. Third, for the purpose of reducing weight of the aeroengine and improving efficiency, the axial gap between the rotating part (rotor blades) and the stationary part (stator vanes) becomes narrower for modern multistage axial compressors. For example, the axial gap of the test compressor modeled from a modern high-pressure compressor in [11] is low to the value of 7 mm. Fourth, the flow angle in the end-wall region changes violently. For the traditional way of calibration and data reduction, the usable flow range is insufficient for some flows of interest. Taking these four aspects into account, it is urgent to minimize the tip diameter and tip length of the five-hole probe as well as use advanced calibration strategies to maximize the usable range of the five-hole probe in order to make the five-hole probe measurement technology applicable in the inter-stage measurement of small axial clearance compressors and to improve the accuracy of the measurement results of the five-hole probe in the end wall area of the multistage compressor.
For conventional five-hole probes, the tip diameter is greater than 3 mm, such as the cases of [12] (3.2 mm) and [13] (4 mm). Recently, Liu [14] processed a five-hole probe with a tip diameter of 2 mm. However, it is necessary to continue to reduce the diameter of the probe when the processing conditions permit. In this paper, a miniature five-hole probe with a tip diameter of 1.5 mm and tip length of 4 mm, manufactured through laser printing, which is almost unrealizable through conventional machining, was employed to conduct end-wall flow measurements in a multistage axial compressor. The tiny tip diameter ensured the remission of the extra blockage due to intrusive measurement and improves spatial resolution (i.e., reducing error induced by a strong flow gradient close to the casing). The shorter tip length and wider usable flow range made it possible for end-wall flow measurement to be conducted with high accuracy in a compact turbomachinery configuration.
This paper is mainly divided into four parts. The first part is an introduction that details the calibration method of the probe. The second part demonstrates the measurement uncertainty of the probe based on a large amount of additional test points. The third part presents the corresponding results of applying this miniature five-hole probe to measure the complex end-wall region of a multistage axial compressor. The last part presents a summary of the work of this paper.

2. Calibration Strategy

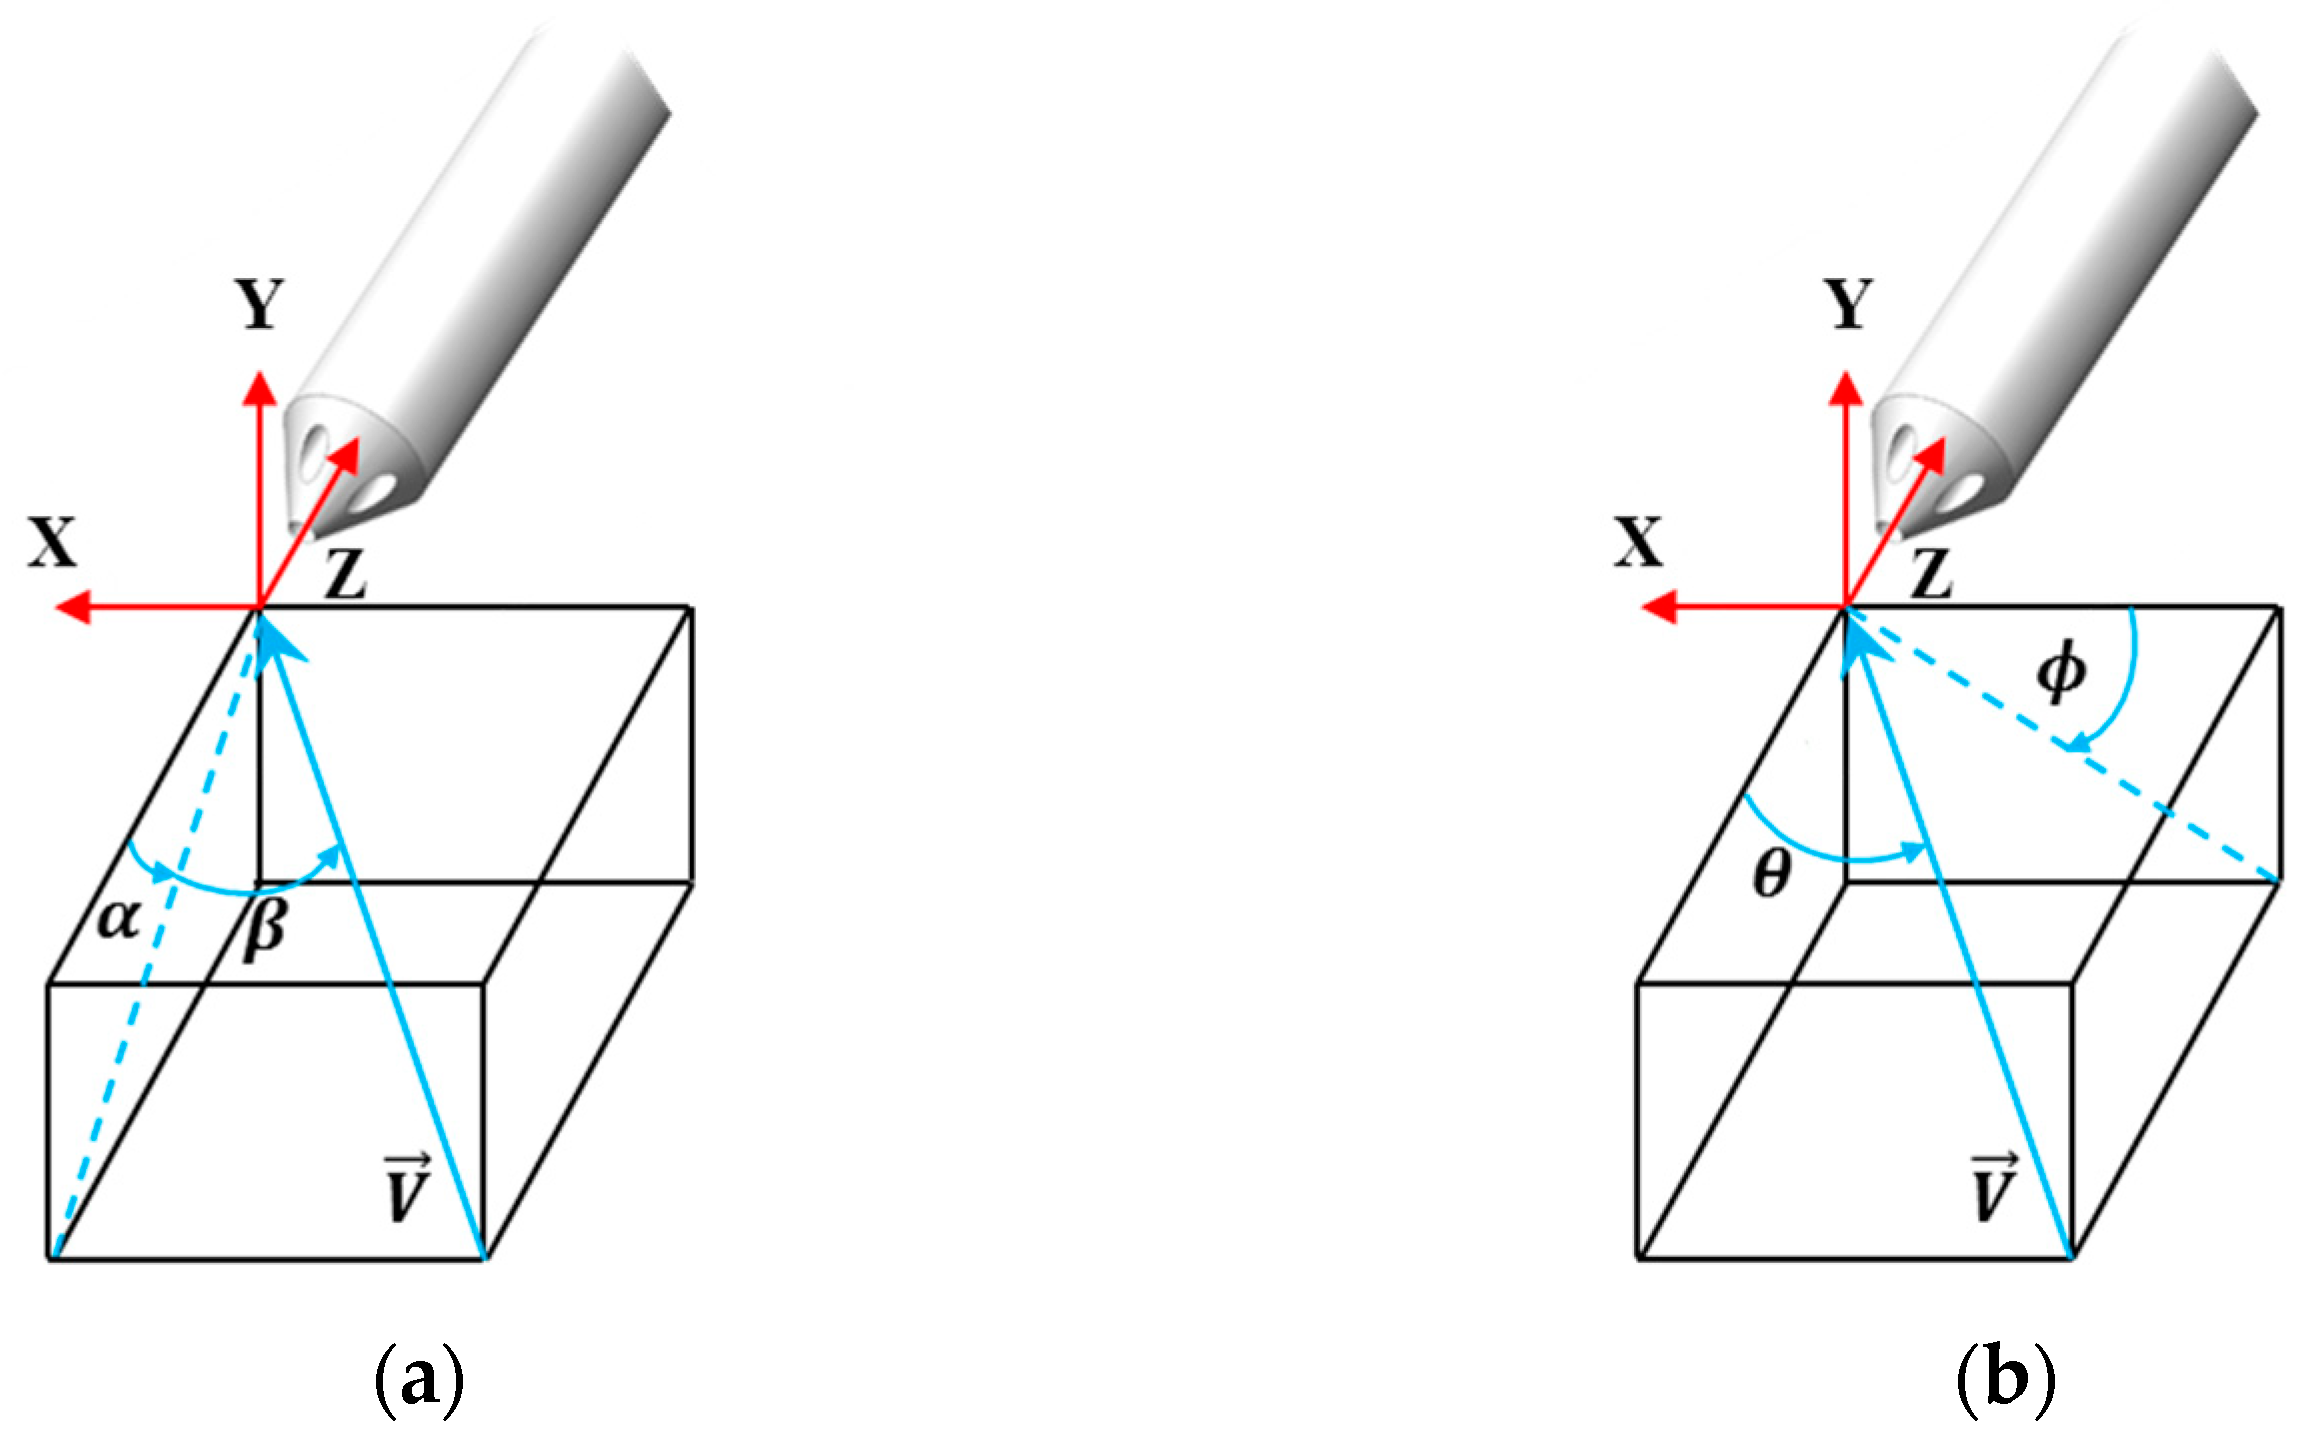
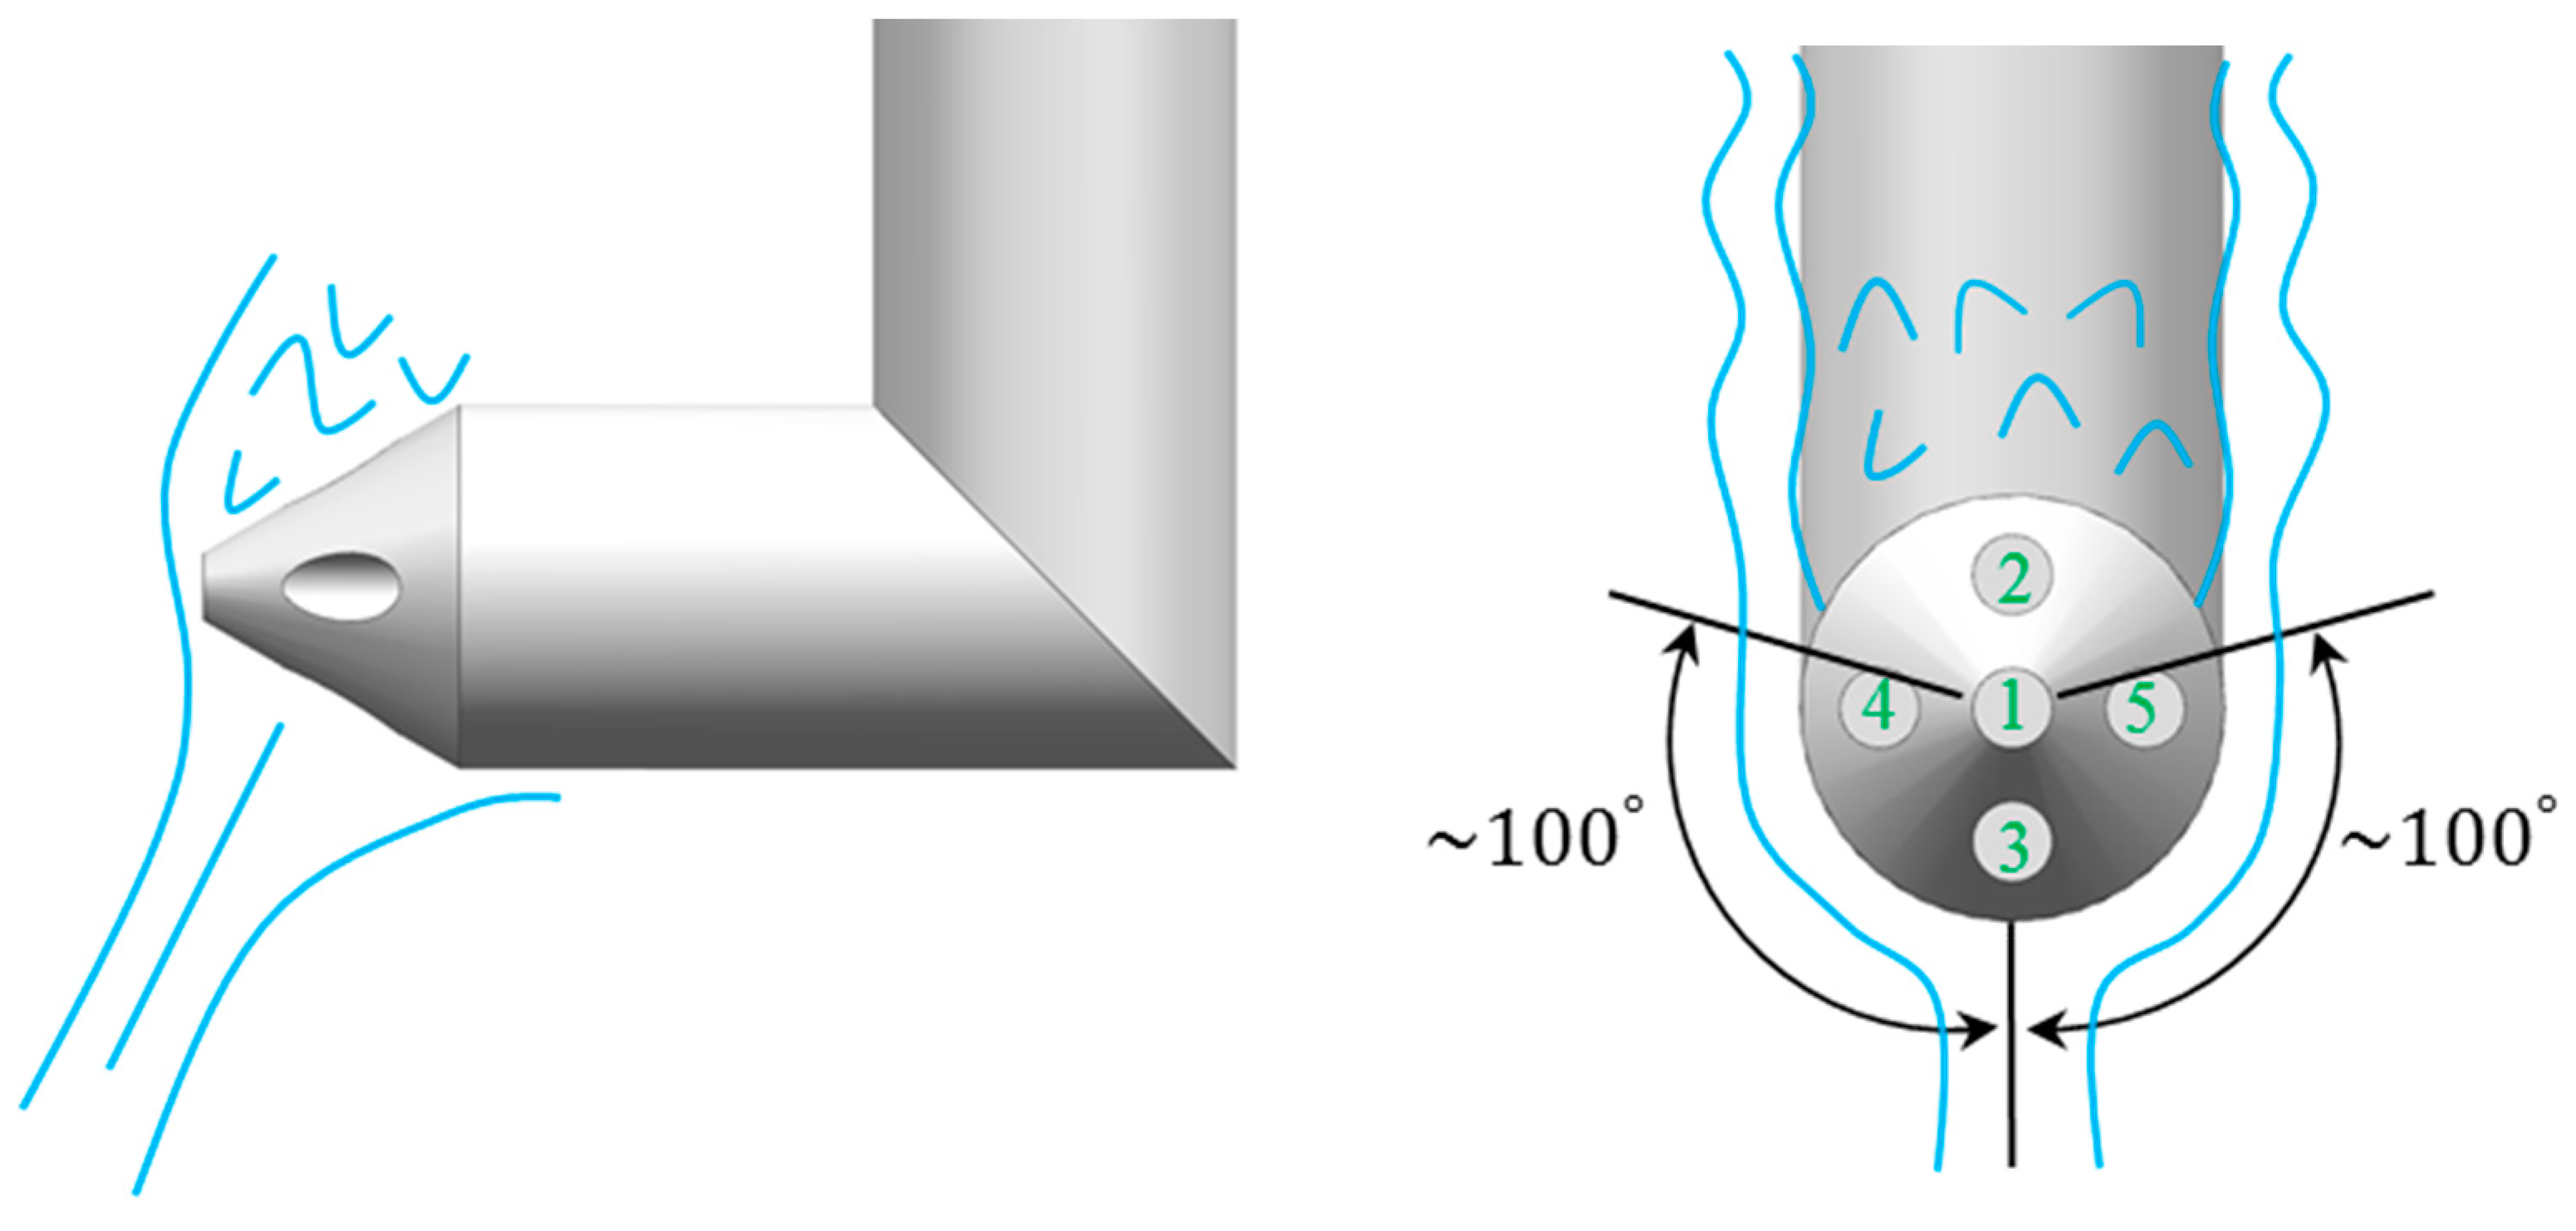
2.1. Probe Structure and Angle Frames

The structure of the five-hole probe is presented in Figure 1. In order to make measurement between blade rows in compact turbomachinery possible, the L-shaped structure was adopted. The tip diameter of the probe was 1.5 mm, the cone angle of which was 60 degrees, and the distance between the probe tip and the axis of the probe stem was 3.2 mm. Laser printing technology was used in the manufacturing process of this miniature five-hole probe. The material of the probe head was Inconel. Laser printing technology allowed for geometric tolerances of the five-hole probe within 0.05 mm. The diameter of each hole was 0.4 mm. The central port (labeled as 1) was surrounded by four outer ports on the conical surface (labeled as 2–5).
There are two different angle frames used to describe low angularity and high angularity, respectively, as shown in Figure 2. Pitch ( α ) and yaw ( β ) angle, defined in the Cartesian coordinates, are used to describe low angularity, and cone ( θ ) and roll ( ϕ ) angle, defined in the polar coordinates, are used to describe high angularity. In the calibration process, the angle frame of the cone and roll angle was adopted. The transformation between these two angle frames is as follows:
θ = a r c o s c o s α c o s β ,
ϕ = a r t a n s i n α t a n β ,

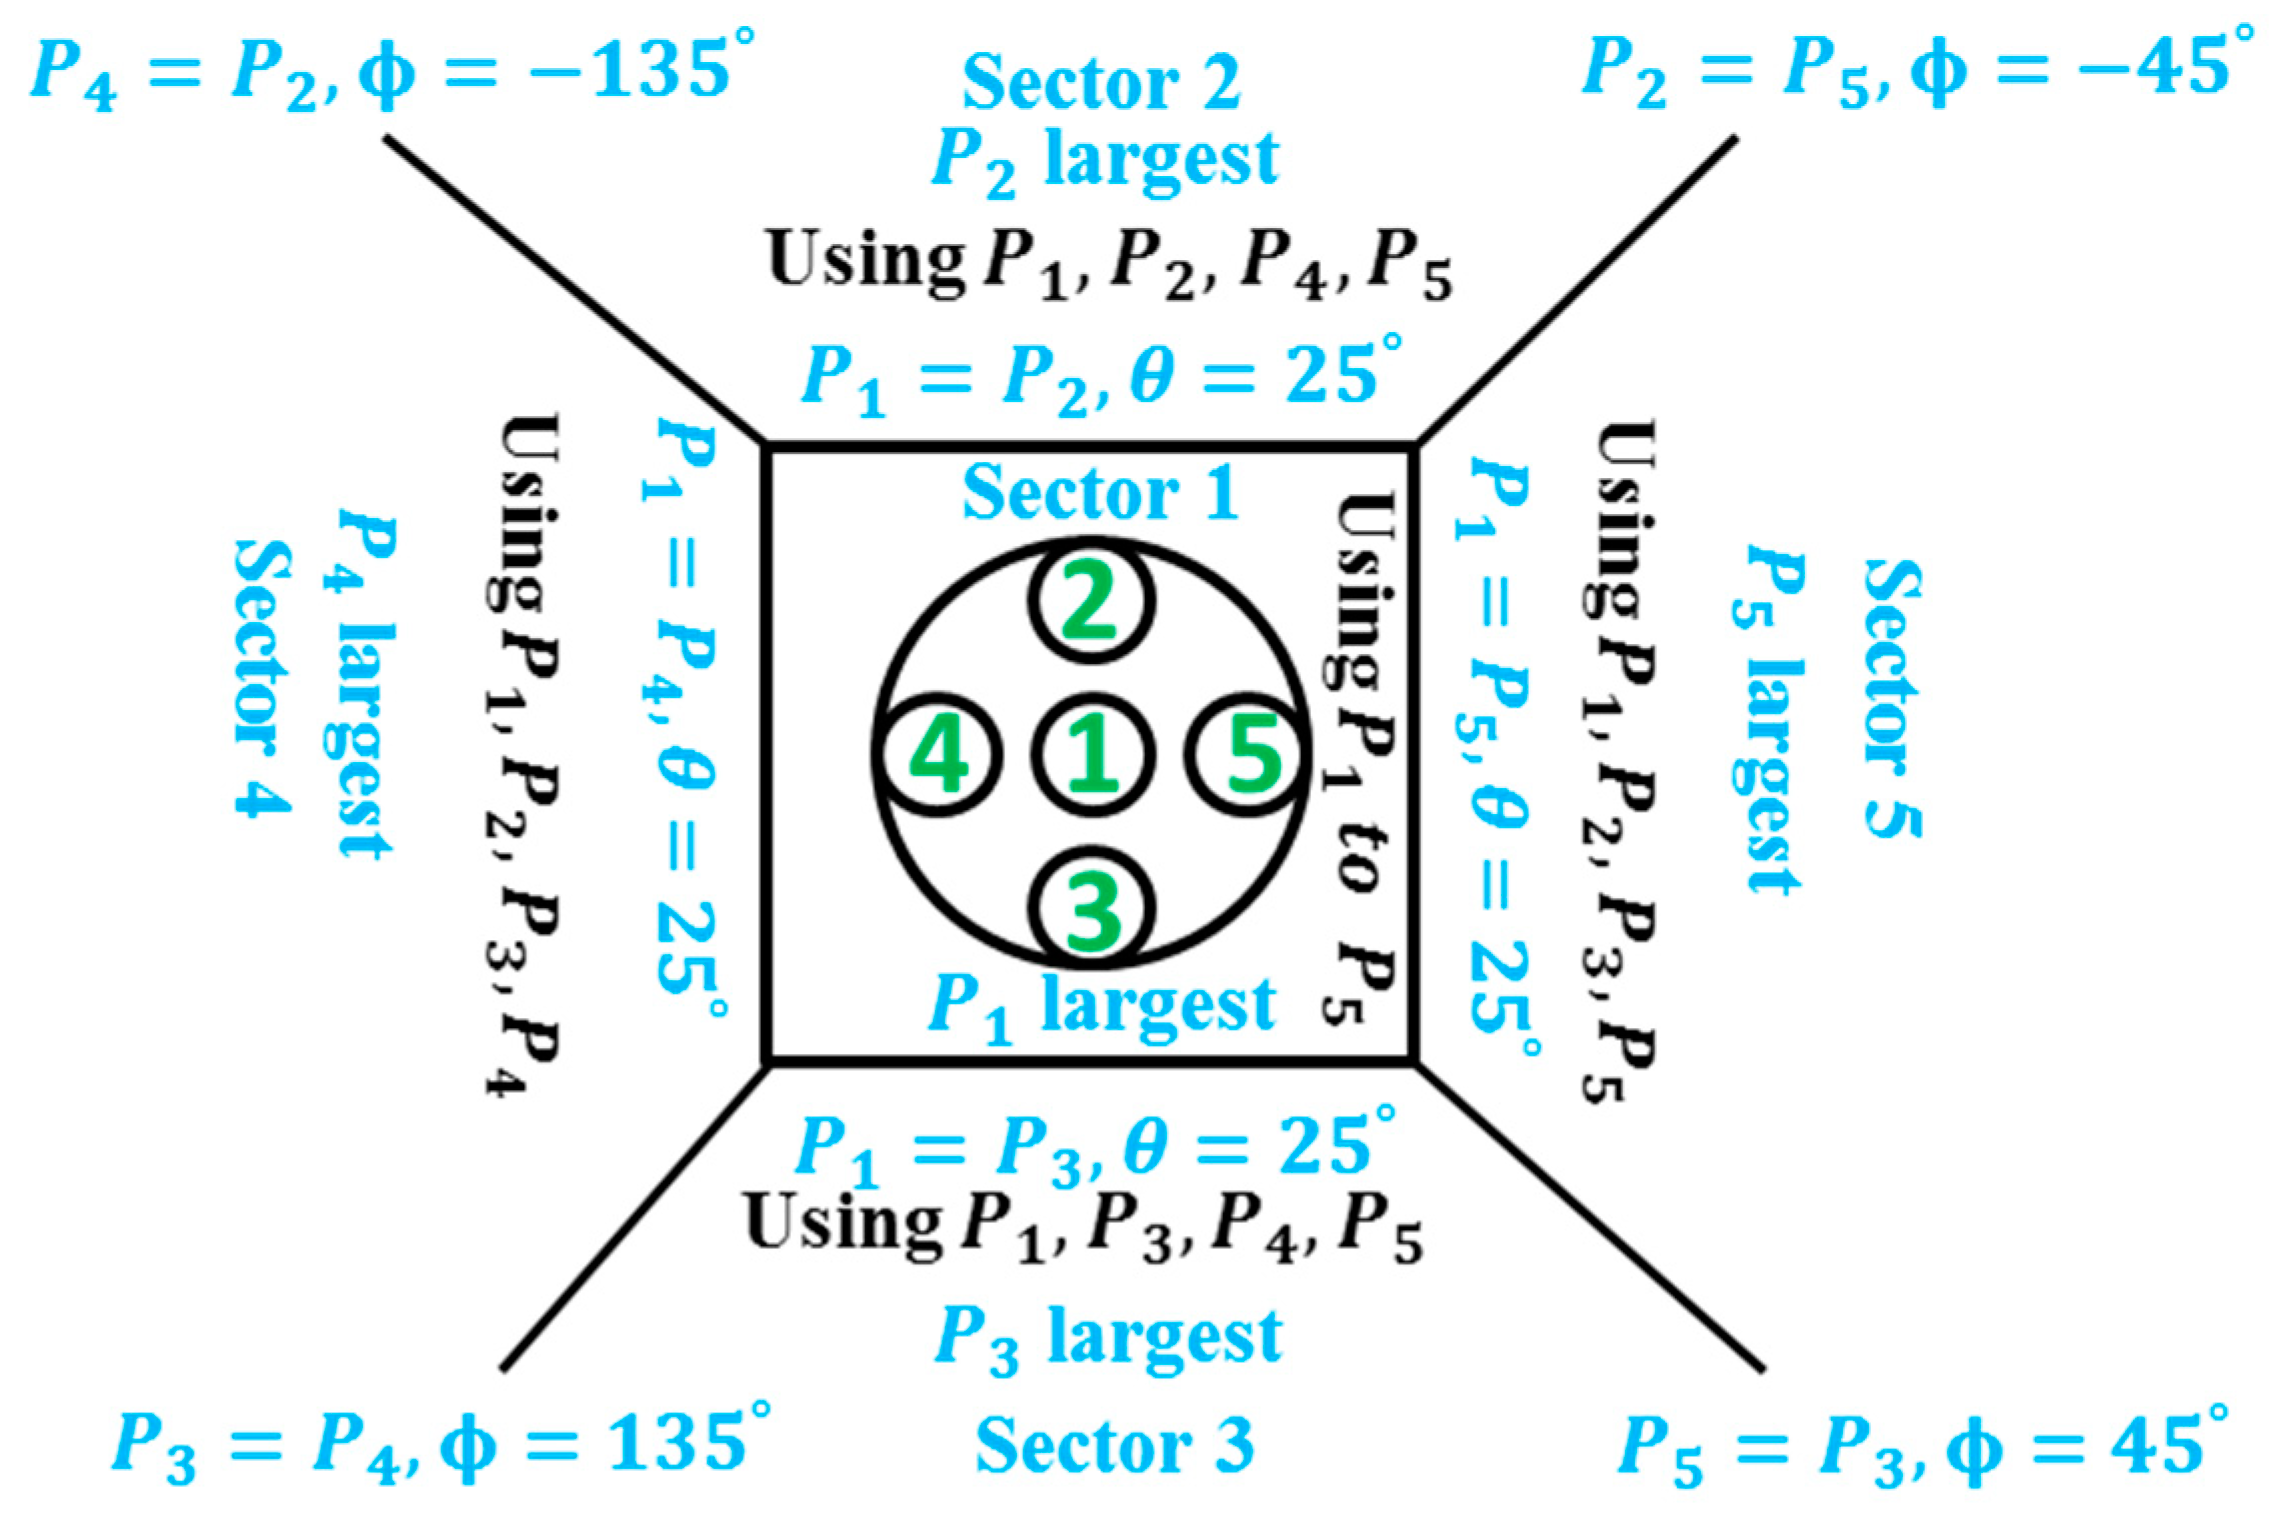
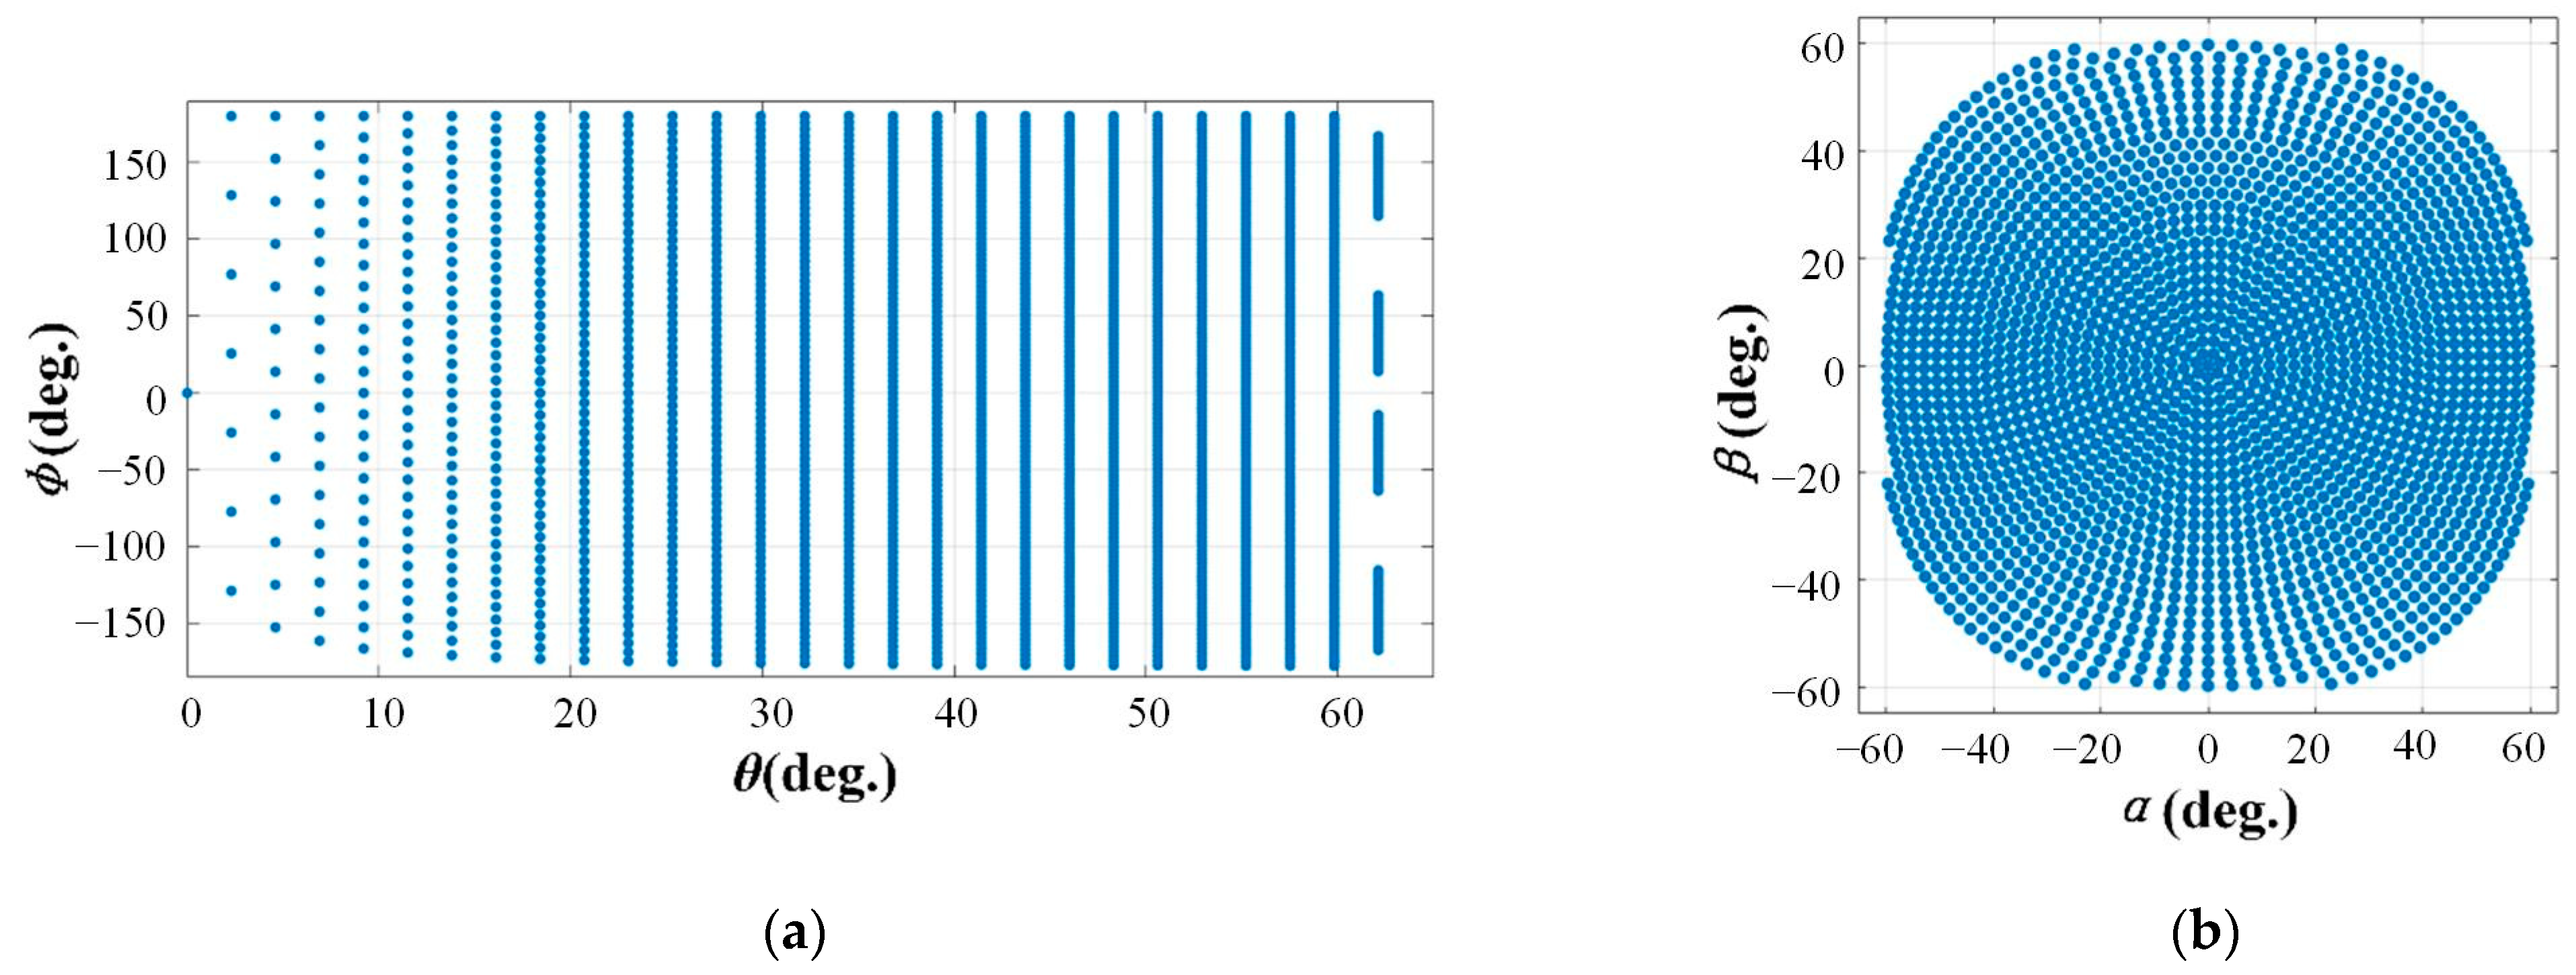
2.2. Angular Space Division

The zonal method was developed in the early 1980s to extend the usable flow range to high angles [15,16,17]. Compared to other methods (such as the denominator-shift method [18] and the generalized n-hole method [19]), the zonal method offers accurate results both at low and high flow angles [20]. This method divides the whole angular space into an inner sector and four outer sectors, in which different definitions of non-dimensional coefficients are applied. The location where the different sectors intersect is called the sector boundary. It is worth mentioning that the number of outer sectors depends on the number of ports of the specific multi-hole probes (for example, there are 6 outer sectors for seven-hole probes). Generally speaking, there are two different ways to accomplish it, i.e., geometrical and aerodynamic division (as shown in Figure 3). The geometrical division means that different sectors are defined through cone and roll angles. For example, sector 1 is restrained to the region where the cone angle is lower than 25 ° , and sector 3 is restrained to the region where the cone angle is greater than 25 ° and roll angle is from 45 ° to 135 ° . Aerodynamic division is accomplished on the basis of the index of the maximum pressure hole. For example, if port 1 for one specific calibration point senses the largest pressure compared to 4 other ports, this point is allocated to sector 1. Due to the manufacturing error, the sector boundary defined by the geometrical division does not match that defined by the aerodynamic division exactly. The aerodynamic division method was employed in this paper, considering its capability to reduce extrapolation error for the data at sector boundary [21].

2.3. Calibration Coefficients for Low Flow Angle

As mentioned above, the angle frame of pitch and yaw was employed in low-flow angle conditions. In this condition, all five ports were in the attached flow region, which implies that all five readings are reliable and can be used to define calibration coefficients. Pitch, yaw, total pressure, and static pressure coefficients are defined as follows, respectively [15,22]:
b α = P 2 P 3 q ,
b β = P 4 P 5 q ,
b t = P 1 P t q ,
b s = q P t P s ,
where q represents dynamic pressure actually and for simplicity is replaced by the value:
q 1 = P 1 P 2 + P 3 + P 4 + P 5 4 ,
This simplification is used universally in open in the literature [15,22].

2.4. Calibration Coefficients for High Flow Angle

For high flow angle conditions, the angle frame of the cone and roll is used to describe flow angularity. In this condition, some port is in a separate flow region and becomes insensitive to flow angle. The port in the separate flow region provides meaningless reading and is not adopted to define calibration coefficients. Based on the reference [23], the separation point of a cylinder in a turbulent flow is over 100 ° . For this probe with a conical tip, the separation point is likely to extend downstream further, which means at least 4 ports can be used to define calibration coefficients. Figure 4 demonstrates the flow diagram over the probe tip at a high flow angle, in which condition port 2 is located at the separate flow region. Therefore, ports 1, 3, 4, and 5 were employed to define calibration coefficients. Generally speaking, the calibration coefficients at high flow angles are defined as follows [15,22]:
b θ = P i P 1 q ,
b ϕ = P i + P i q ,
b t = P i P t q ,
b s = P i P s q ,
where i denotes the port index with the maximum reading and i + / i denotes the adjacent port of the clockwise/anti-clockwise direction. Similarly, dynamic pressure q is replaced for simplicity by the following value:
q 2 = P i P i + + P i 2 .

2.5. Calibration Results

The pressure signal of the five-hole probe was collected by an electronic pressure scanner system (Figure 5). The system consists of a power supply, sensors, and pressure scanners. The sensor range used in the calibration process was 1 PSI, and its measurement accuracy was ±0.05% of the range. During the calibration process, the probe moved according to the preset angle driven by a two-axis traverse system (Figure 6) until the data acquisition of all calibration points was completed. The resolution of the rotation angle of the two-axis traverse system was within 1 degree. The yaw angle and pitch angle were changed by the motor driving the probe to rotate along axis 1 and axis 2. The direction of the air source was vertical to the plane of the picture.
Although some of the literature indicates that the compressibility effect is significant, the probe was only calibrated at the Mach number of 0.1 in this paper, considering the fact that end-wall flow investigated is subsonic and incompressible. Figure 7 shows the calibration grid of the probe. In the calibration process, the angle frame of the cone and roll was used. The cone angle was up to 60 ° , and roll angle distributed uniformly from 180 ° to 180 ° for each cone angle. Figure 8 demonstrates the calibration results of sector 1 and sector 3 as an example, and the corresponding results of the other 3 outer sectors are omitted for clarity. In Figure 8 and the remainder of this paper, b α and b θ are referred to as b 1 , and b β and b ϕ are referred to as b 2 .

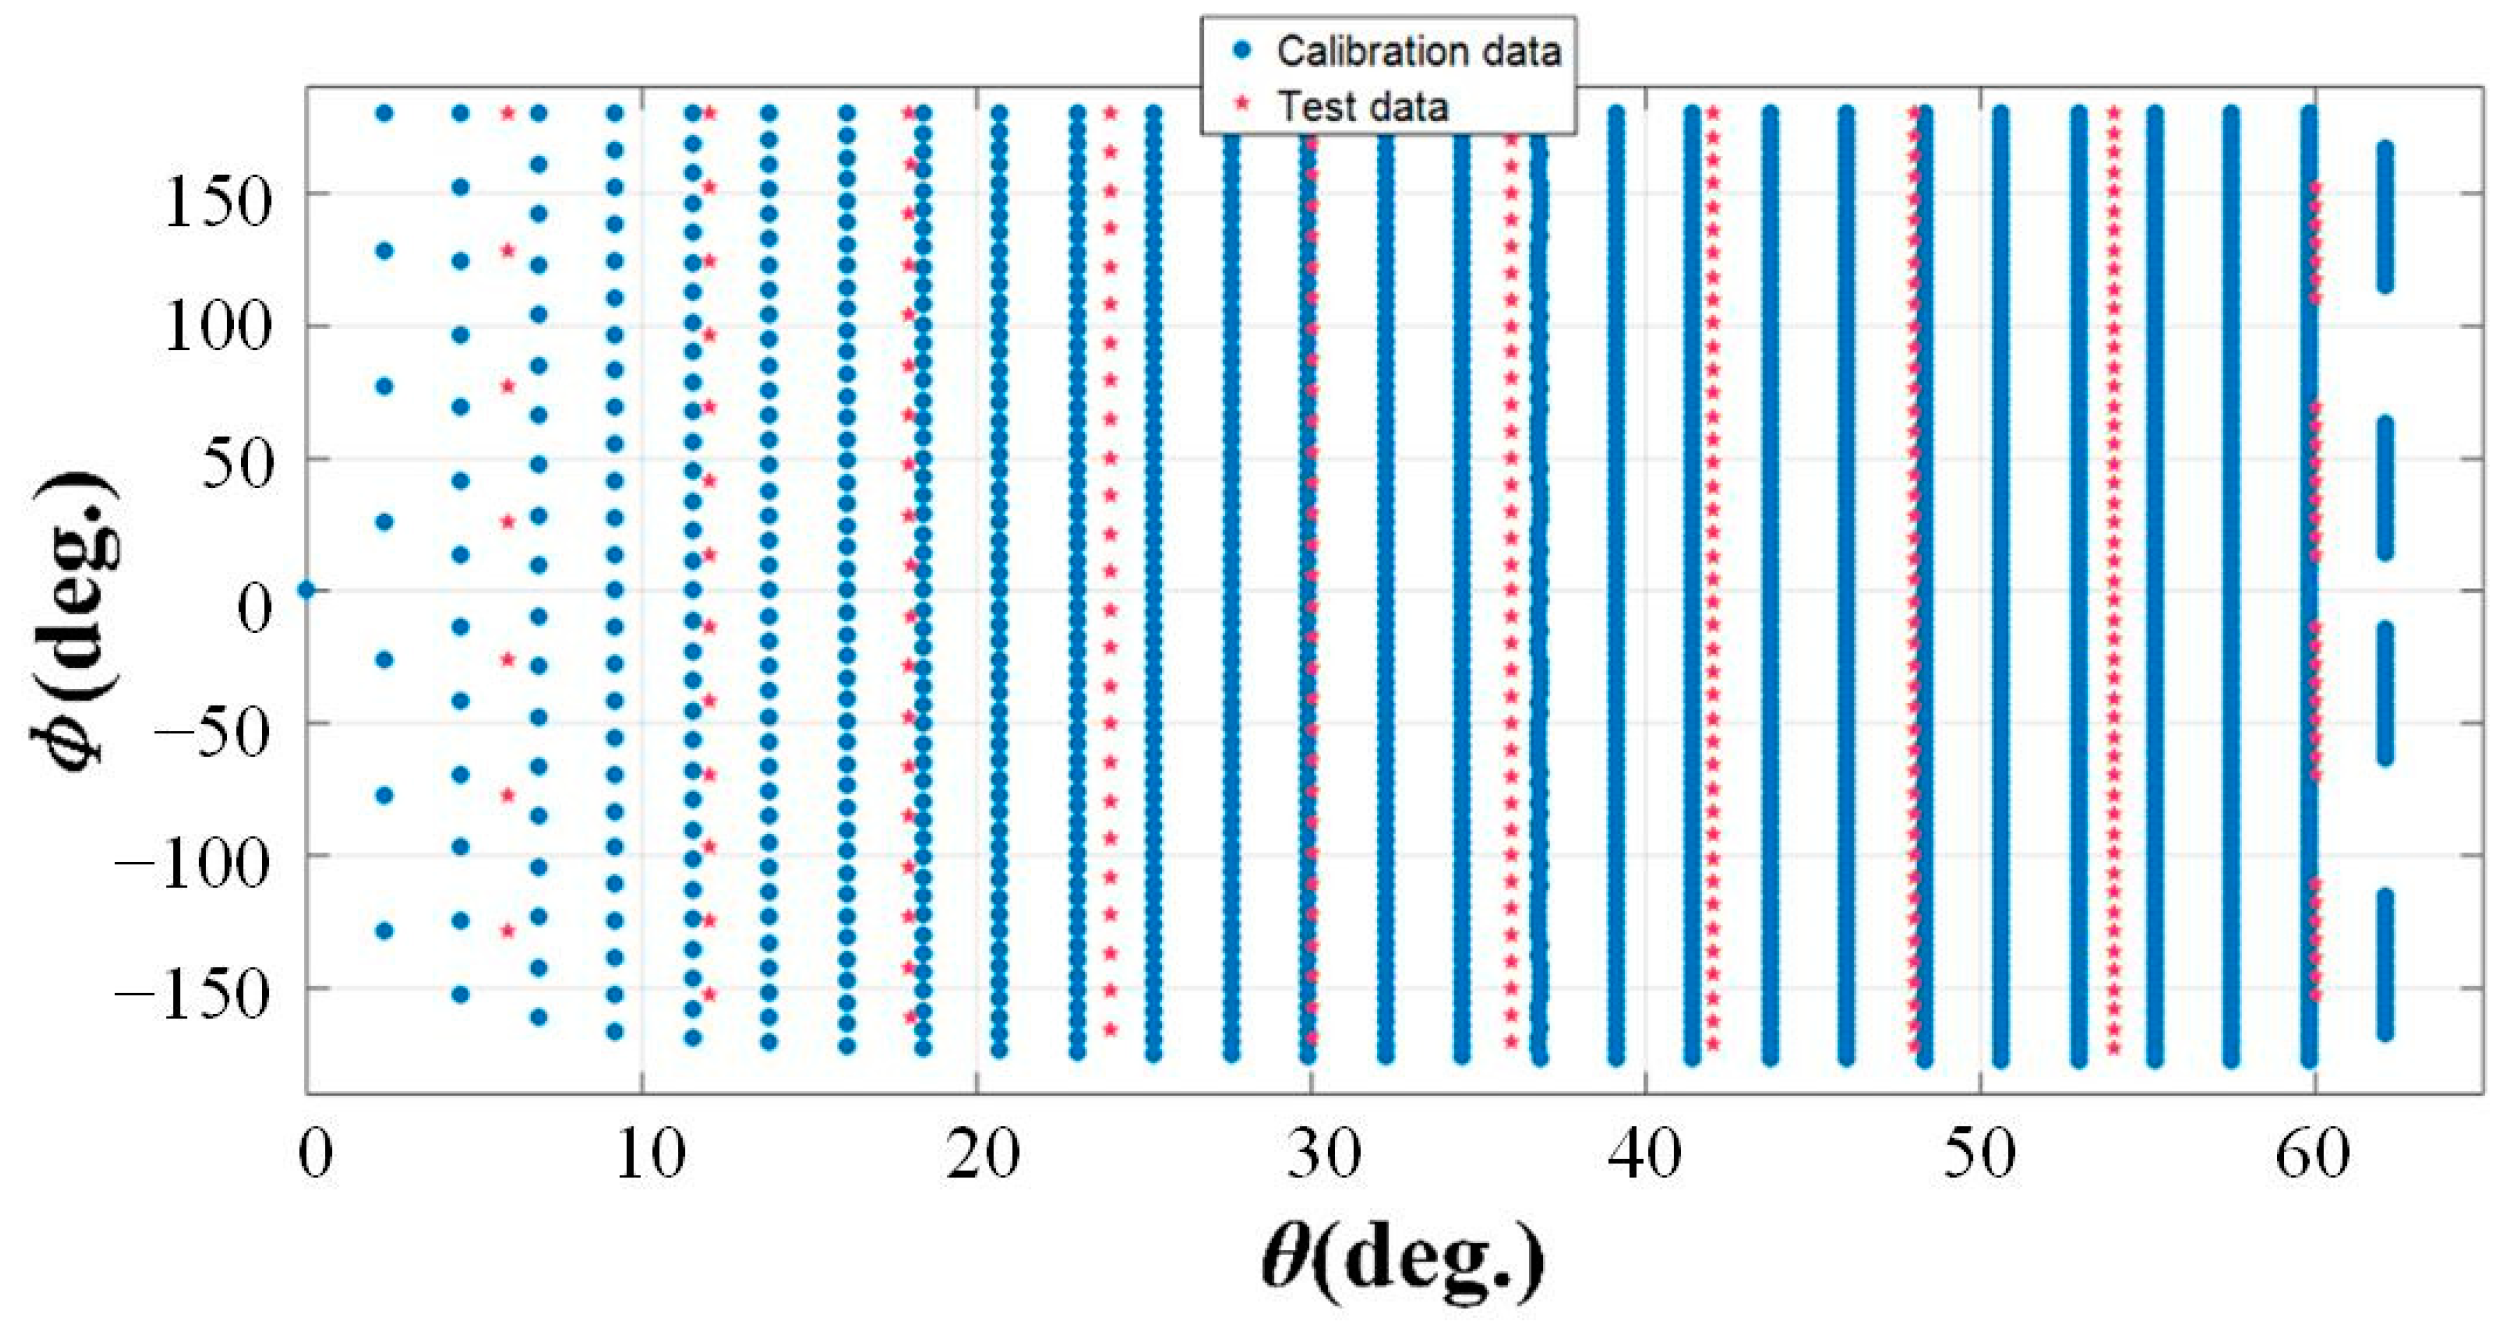
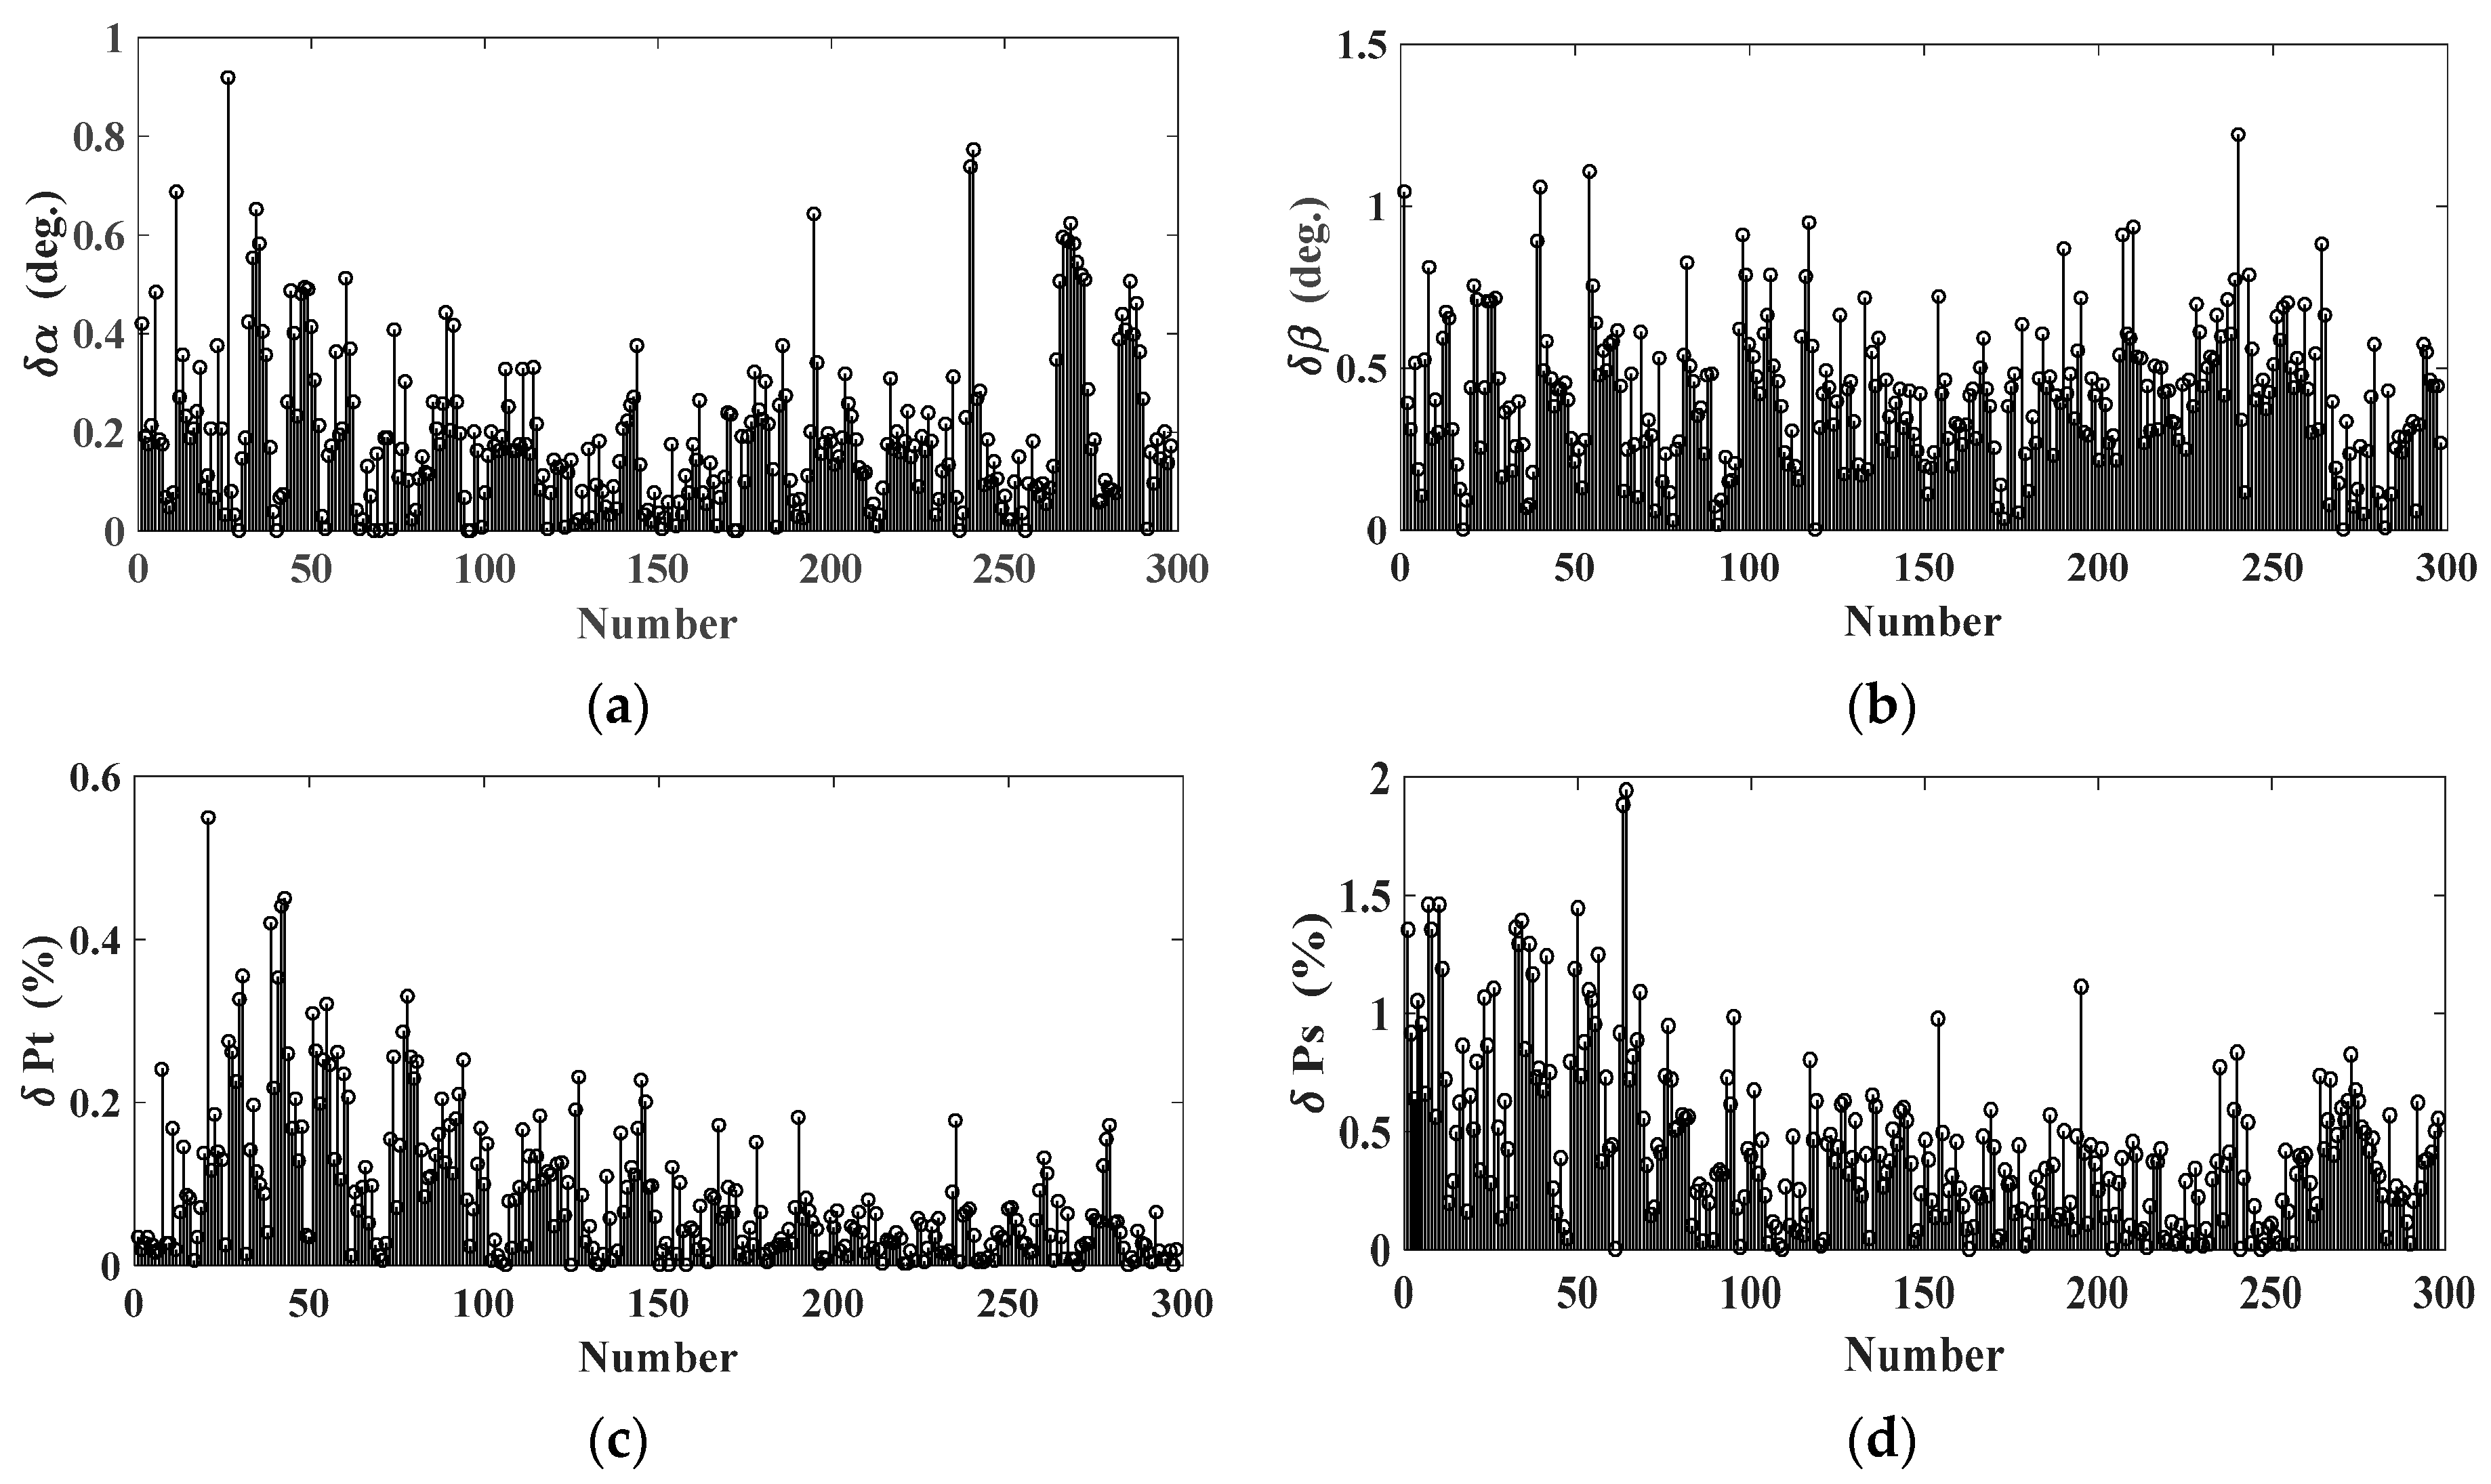
3. Error Evaluation Based on Test Data

Once the calibration was completed, the probe could be inserted into an unknown flow field to measure flow direction, static pressure, and total pressure. In the data reduction process, the angle frame of pitch and yaw was adopted in order to avoid discontinuity at 180 ° or 180 ° roll. The data reduction procedure to acquire flow direction and static/total pressure based on the sensed pressure of five ports is outlined in Figure 9. As indicated in Figure 9, the local least-squares algorithm was adopted in this paper. The first-order polynomial was used.
y = a 0 + a 1 b 1 + a 2 b 2 ,
where y denotes α , β , b t or b s . The coefficients a 0 , a 1 and a 2 are determined based on the criteria of minimizing the error between the predicted and real value, which means:
ε = 1 4 y i a 0 + a 1 b 1 i + a 2 b 2 i 2 = m i n i m u m ,
It yields:
a 1 a 2 a 0 = K T K 1 K T y 1 y 2 y 3 y 4 ,
where
K = k 11 k 12 1 k 21 k 22 1 k 31 k 32 1 k 41 k 42 1 ,
The definitions of b 1 and b 2 are largely dependent on the sector where the test point is located, and the primary error source is from this. In order to reduce the error at the sector boundary, the overlap region method was employed. The overlapping region method is described in reference [24]. If the maximum pressure was no larger than 90% that of the other four ports for a specified test point, it was judged that the test point was located at the sector boundary. The zonal method selects points from both the sector with the highest pressure (the primary sector) and two adjacent sectors. The adjacent sectors use the non-dimensional coefficient definitions in the primary sector to make the independent coefficients ( b 1 and b 2 ) from different sectors comparable. In the process of interpolation, the calibration database was from the above-mentioned primary sector and two adjacent sectors.
In the calibration process, an additional 298 points were measured to inspect the accuracy of the probe. These test points covered the whole calibration space and were distributed uniformly in the cone-roll space, as shown in Figure 10. The pre-mentioned data reduction procedure was applied to calculate flow angle, total, and static pressure. The deviation between the calculated value and the real value is presented in Figure 10 and the relevant statistical analysis for 5 sectors is shown in Figure 10. As shown in Figure 11, the maximum errors of the pitch angle, yaw angle, total pressure, and static pressure were 0.93°, 1.24°, 0.56%, and 1.9%, respectively. For the five-hole probe manufactured in the literature [14], the maximum errors of its pitch angle, yaw angle, total pressure, and static pressure were 0.95°, 0.60°, 2.0%, and 4.0%, respectively. Thus, the probe and data reduction procedure in this paper has obvious advantages in measuring total pressure and static pressure. It can be concluded from Figure 12 that the main error source in total and static pressure was from sector 1. However, even in sector 1, the predicting ability of the data reduction procedure was satisfactory because the mean absolute deviations of pitch angle, yaw angle, total pressure, and static pressure were 0.23°, 0.41°, 0.17%, and 0.78%, respectively. Correspondingly, the standard deviations were 0.1°, 0.25°, 0.13% and 0.44%.

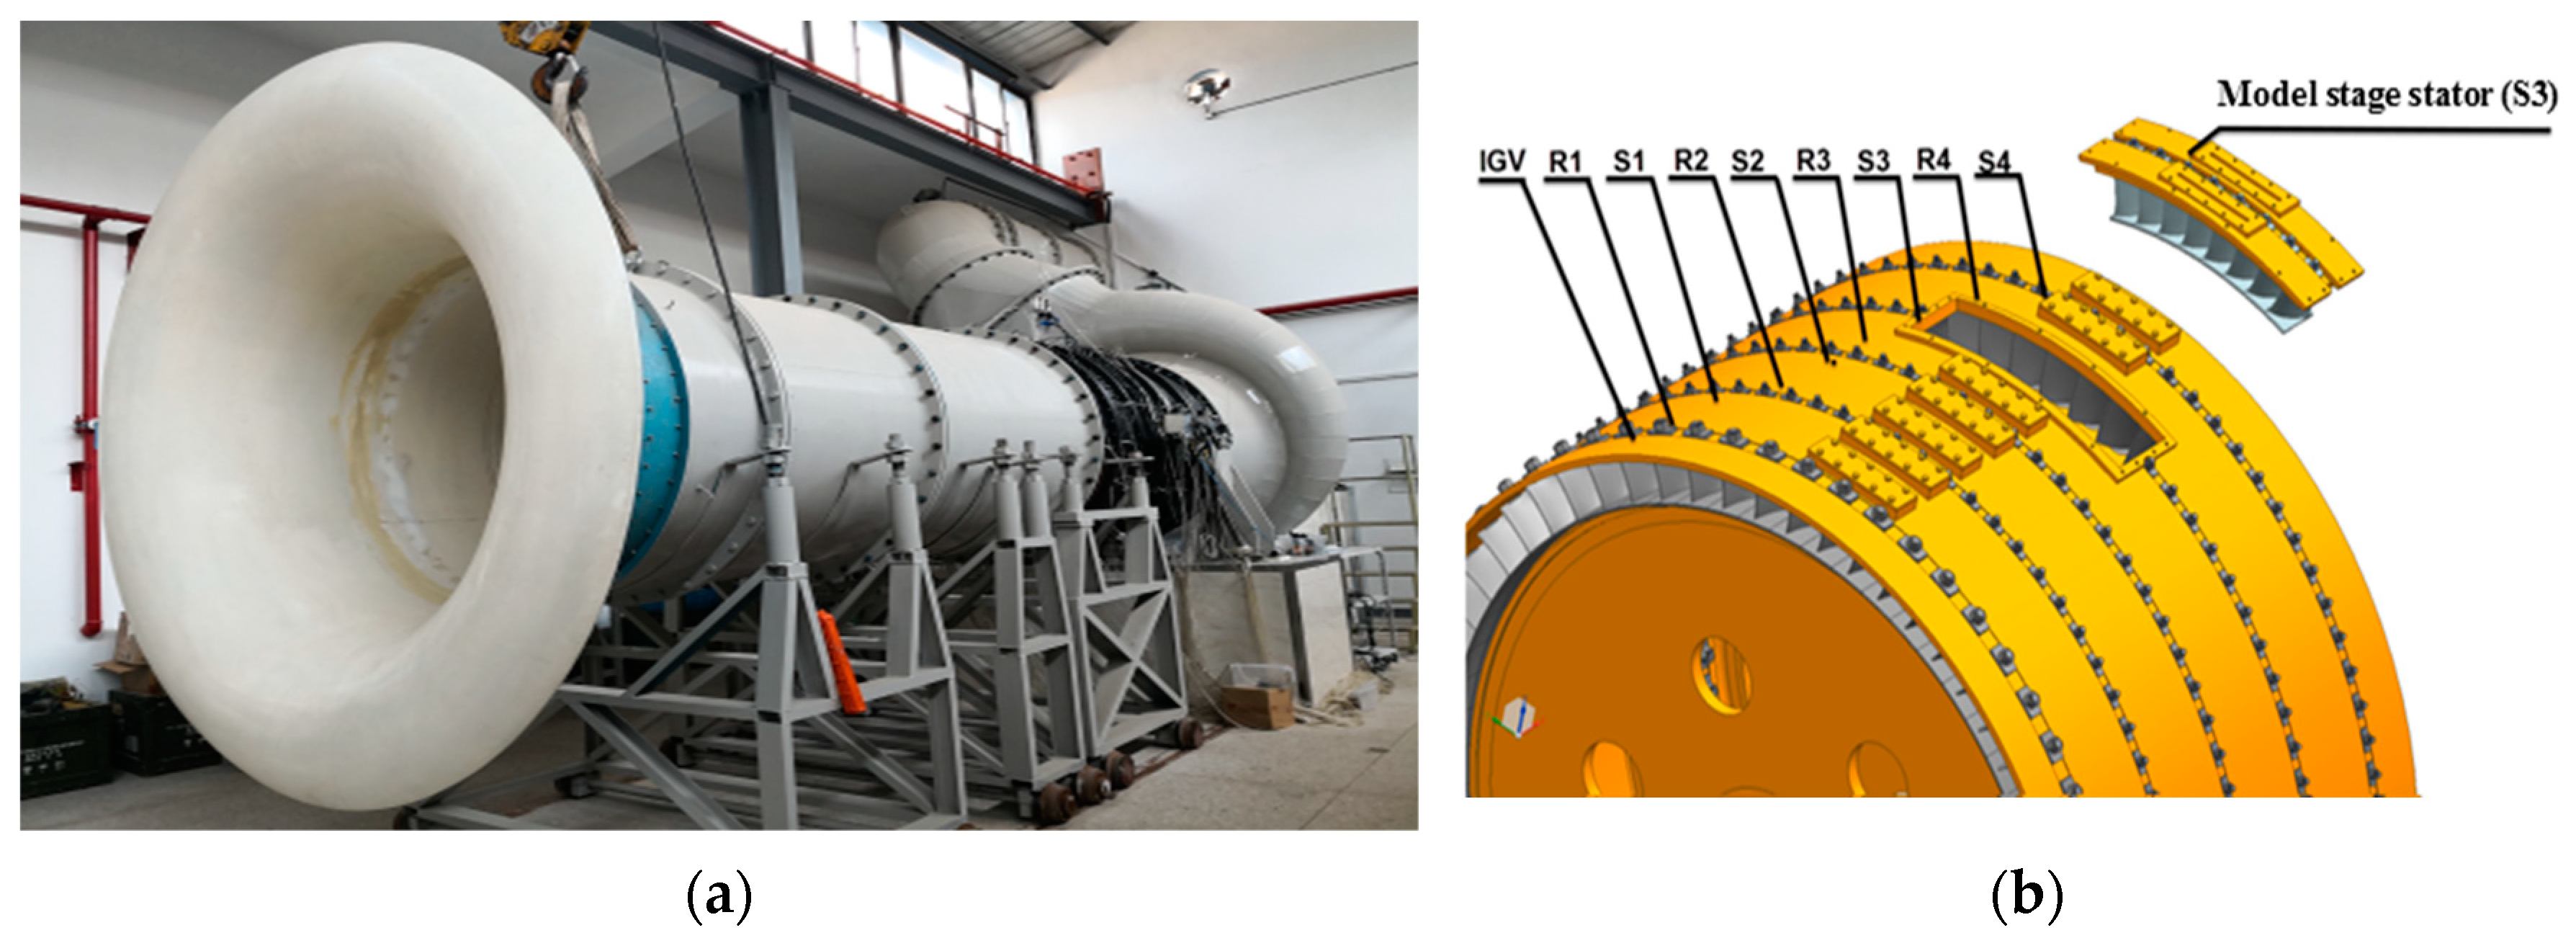
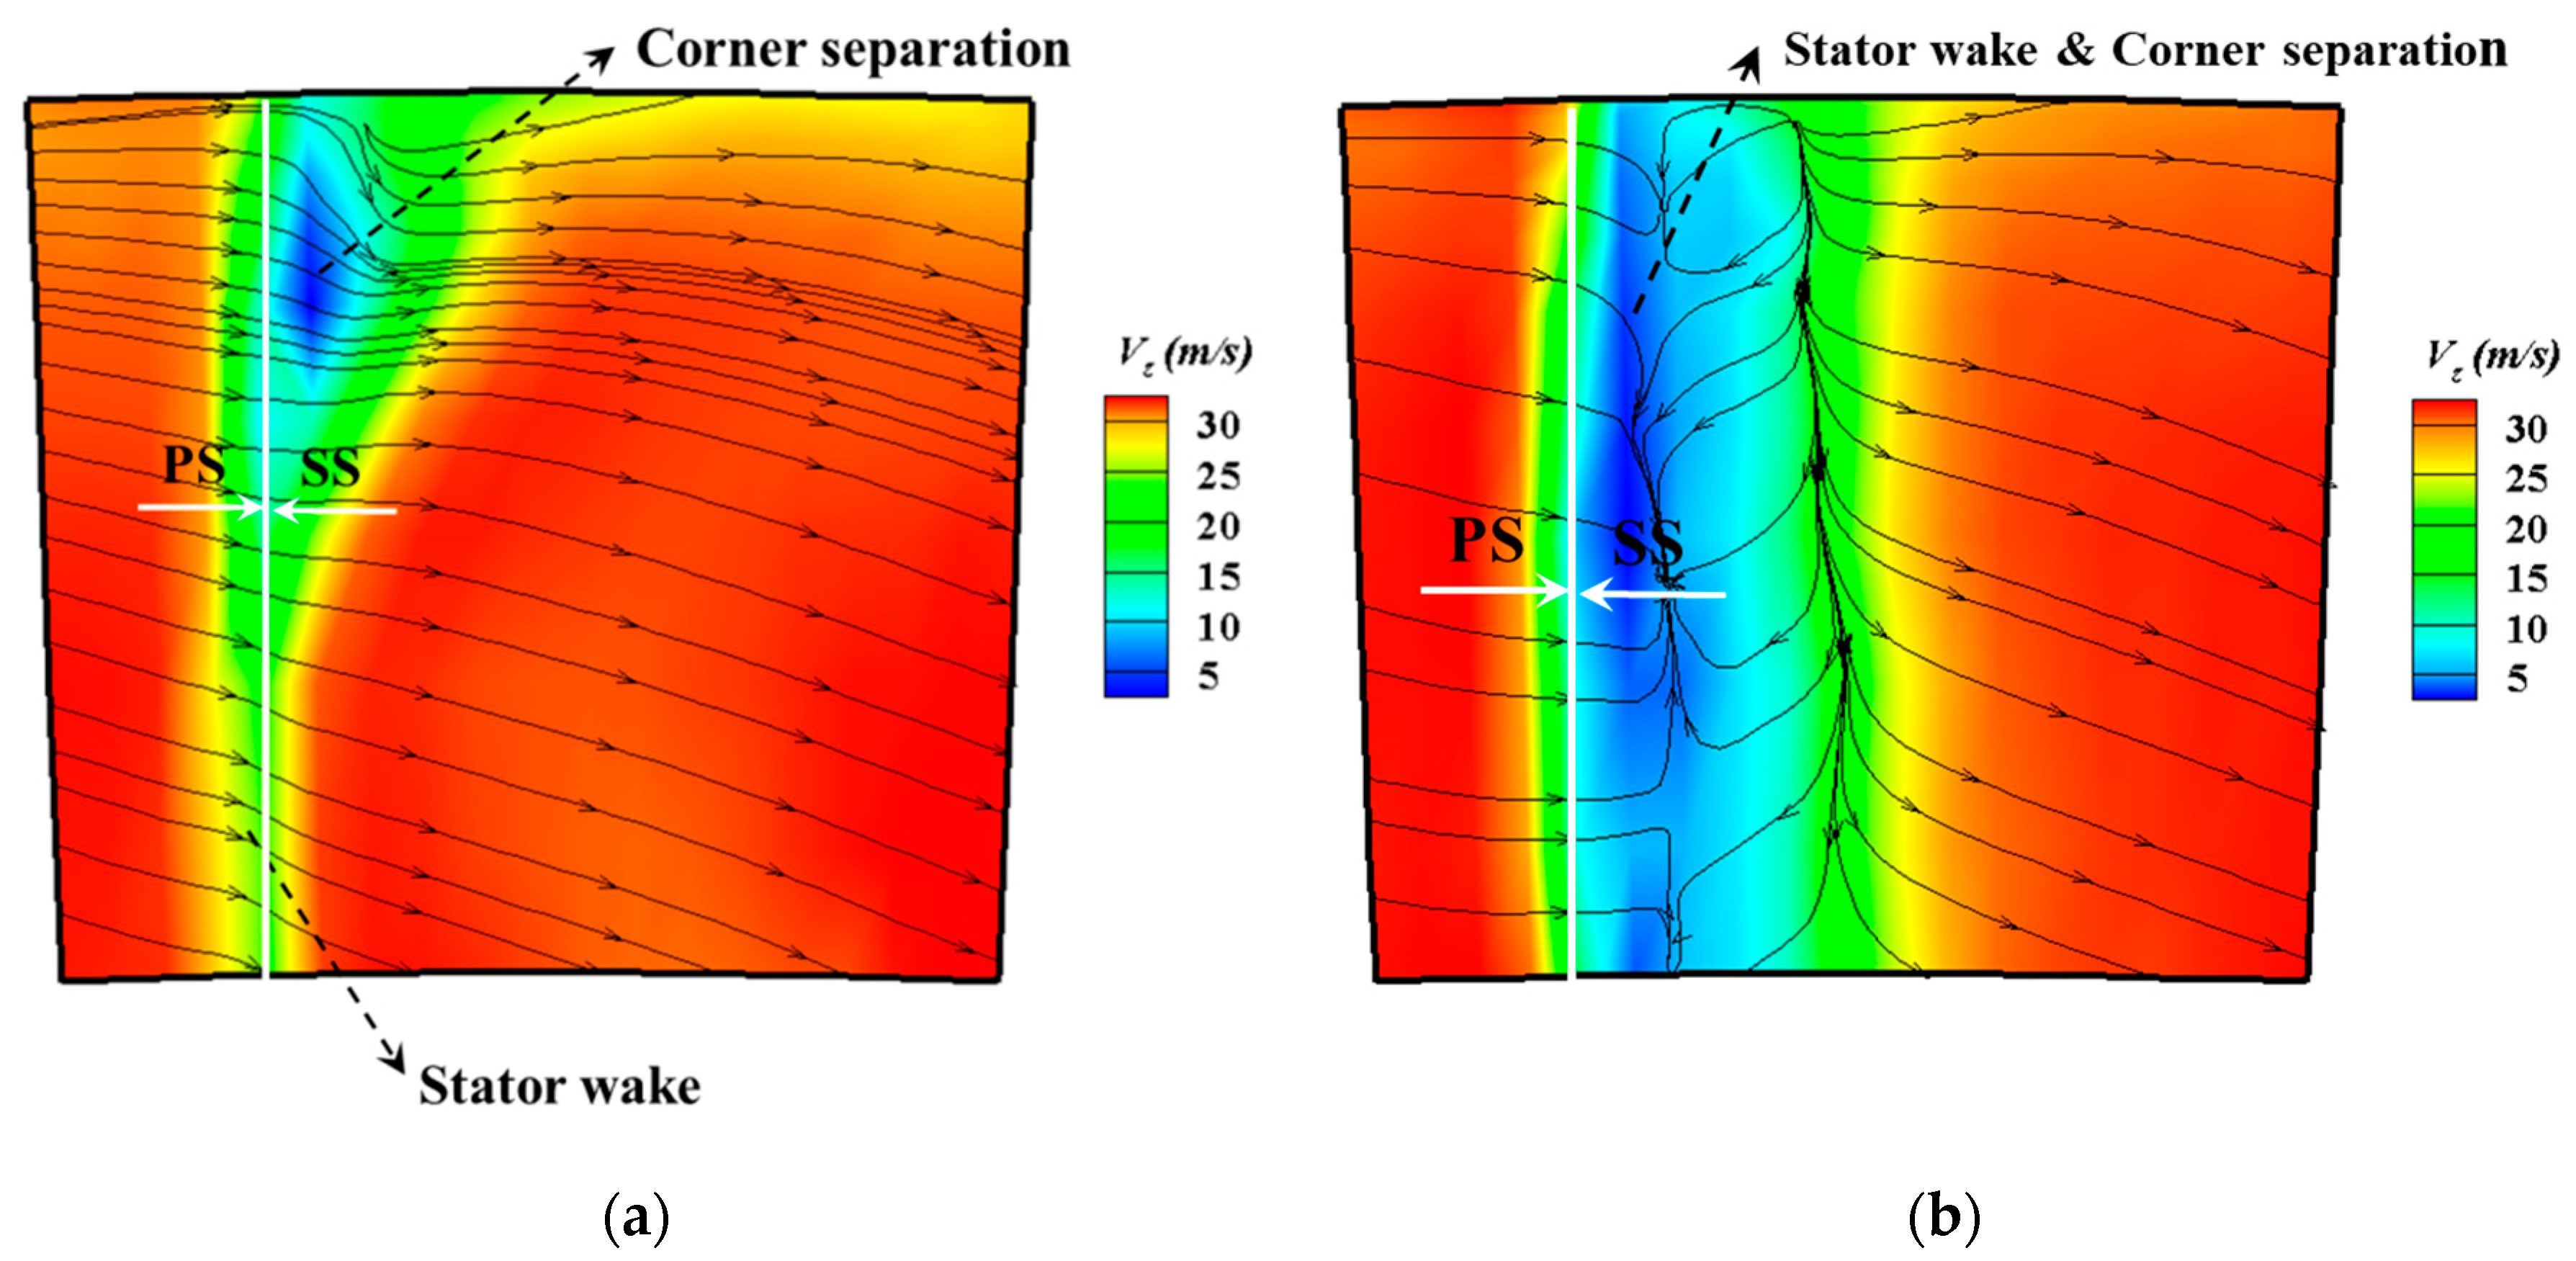
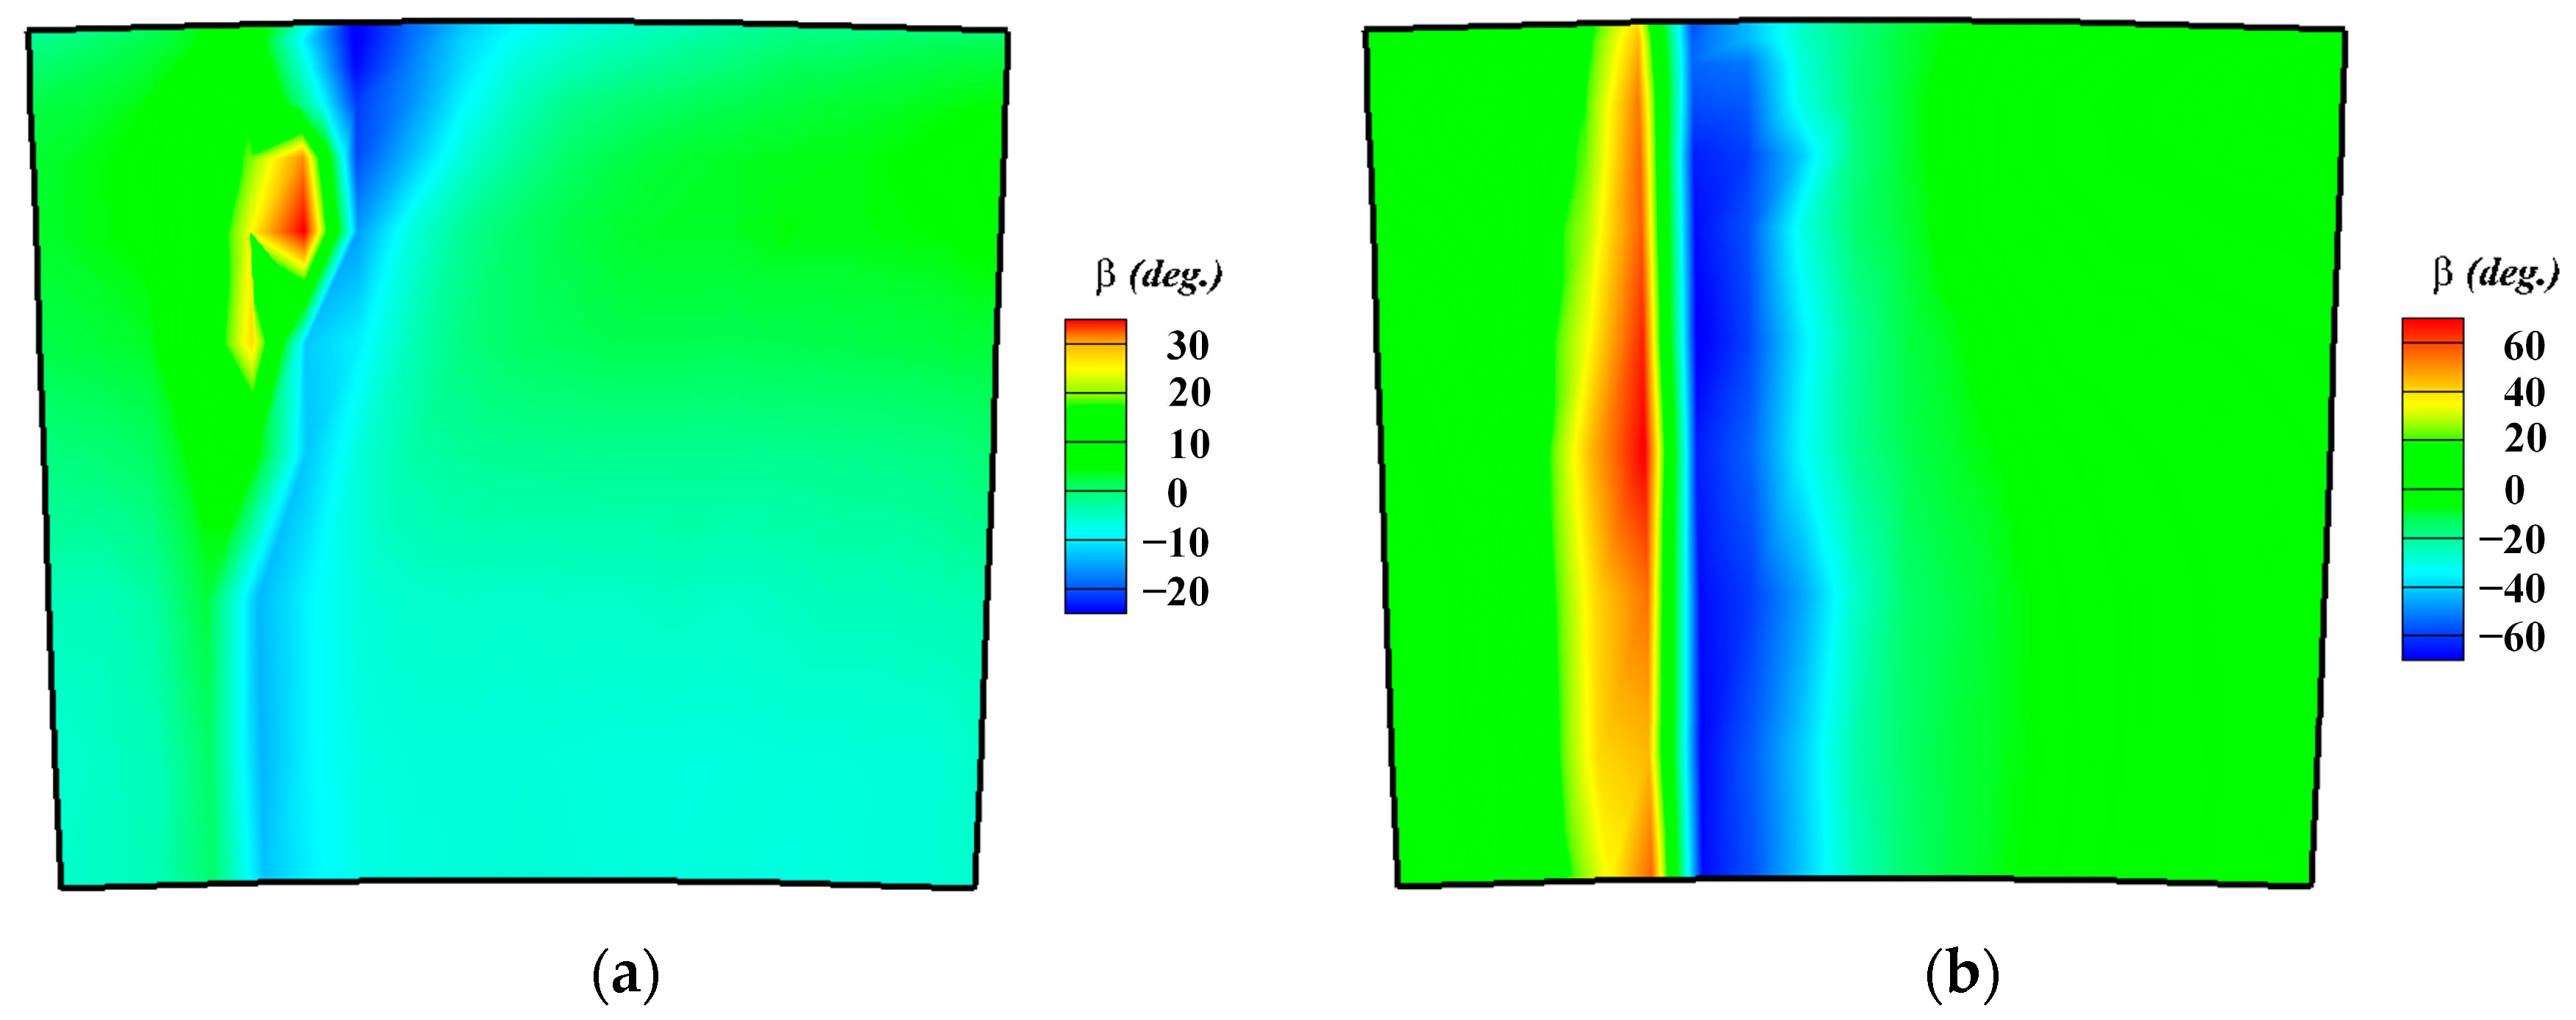
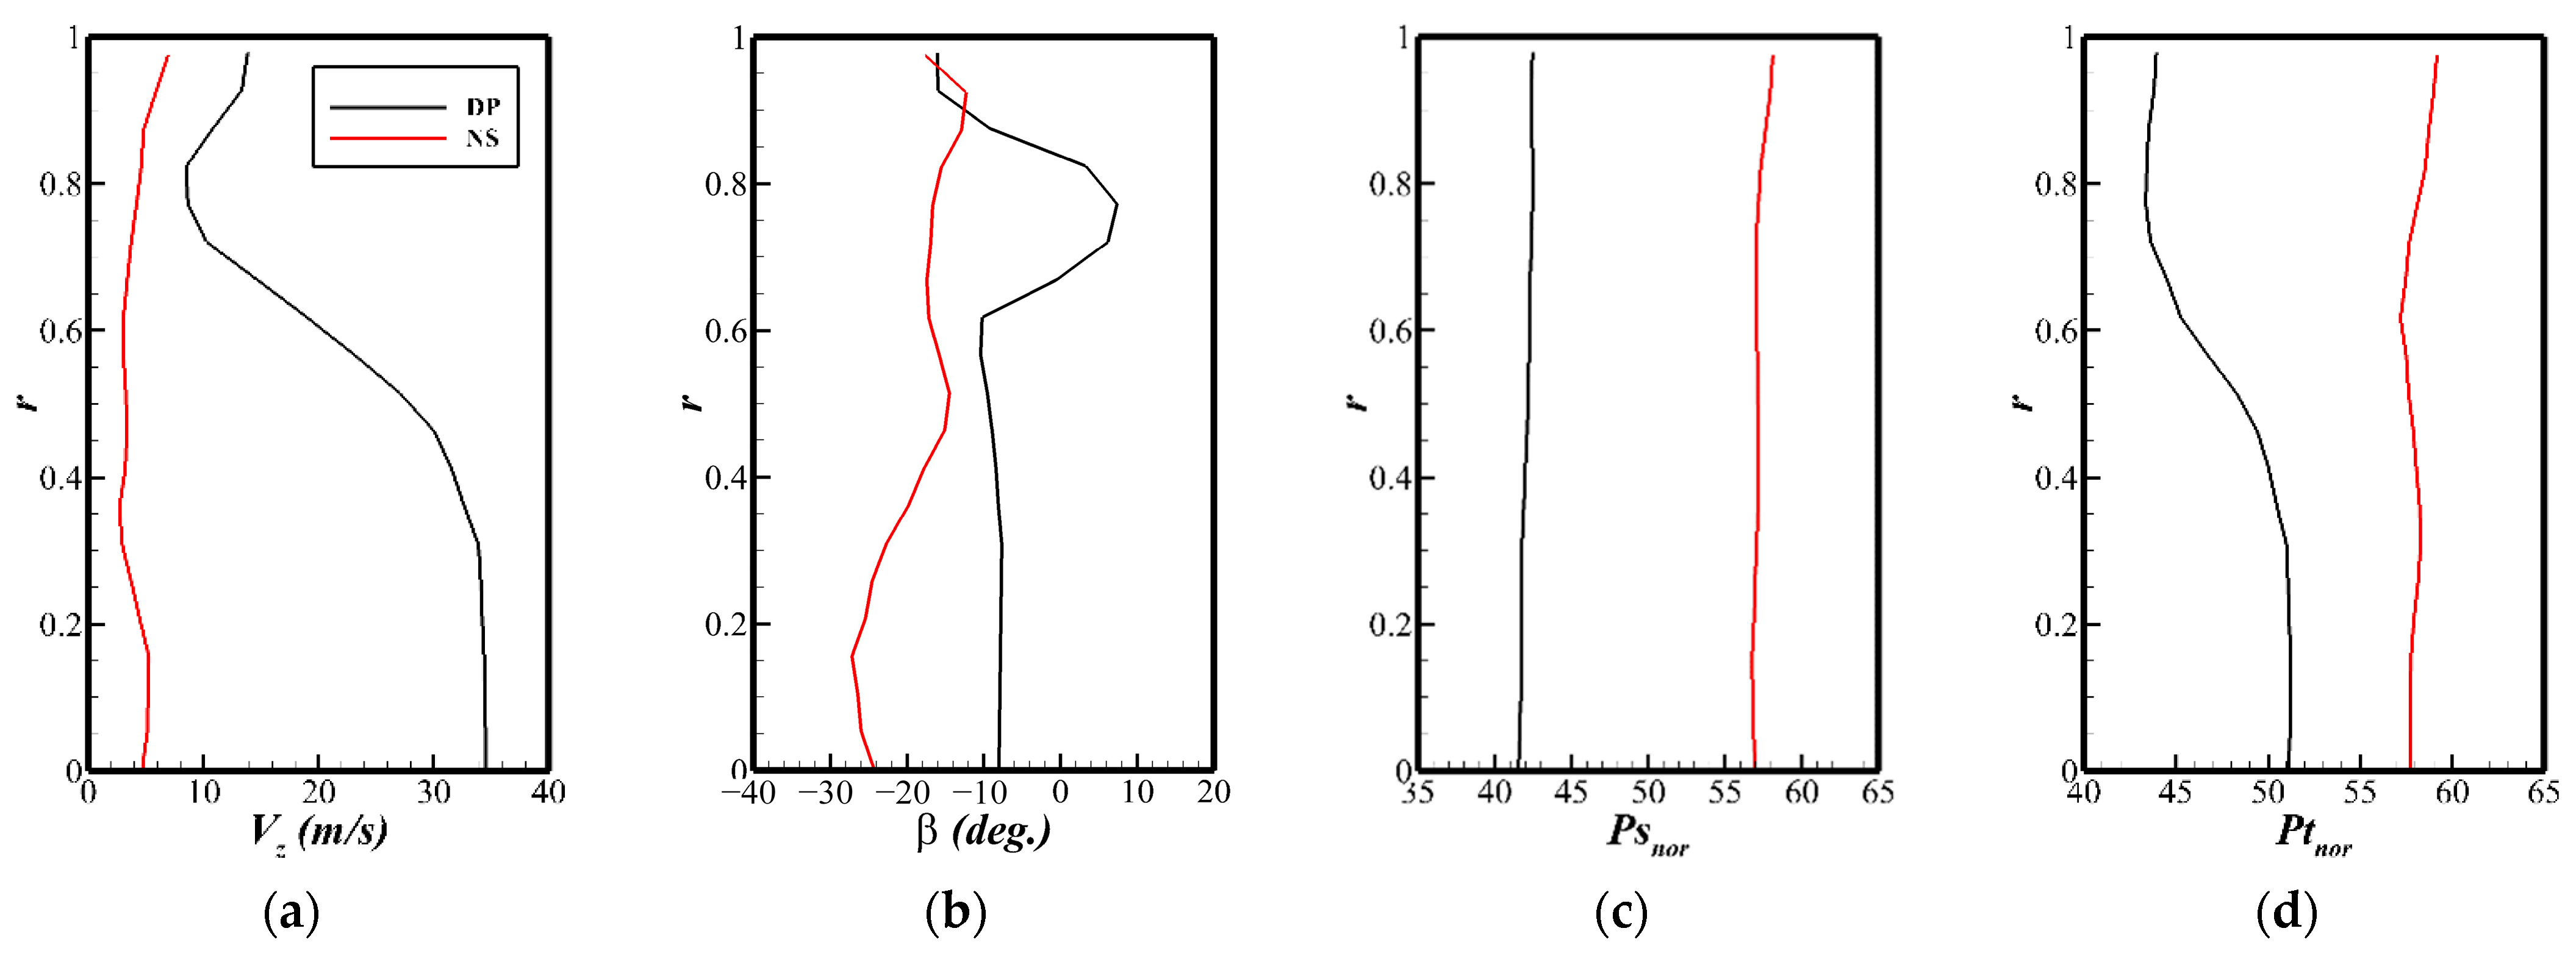
4. Application in End-Wall Flow Measurement for a Low-Speed Repeating-Stage Axial Compressor

In this part, the corresponding results of the end-wall flow measurement through the calibrated miniature five-hole probe are presented. The measurement was conducted on a low-speed repeating-stage axial compressor, which is a model of a modern high-pressure compressor exit stage. Drawings of the experimental test facility are shown in Figure 13. The test rig consisted of a bell mouth, inlet ducts, test compressor, volute, valve, etc. There are four stages for the test compressor; the first two stages and the fourth stage provide inlet and outlet boundary conditions for the model stage (third stage). The valve was adapted to adjust the operating point of the compressor. Some necessary parameters of the test compressor are listed in Table 1.
In the course of this experiment project, an area traverse was performed at the interface between the S3 exit and the R4 inlet. Measurements were taken using the calibrated five-hole pneumatic probe. Based on the preliminary work, the end-wall separation occurred at the casing region. For the consideration of reducing experiment time, the measurement was conducted from 44% to 99% span. There are 11 radial locations (clustered towards the casing), 19 measurement points for each radial location that covers 1 stator pitch, and a total of 209 measurement points. The picture of the area traverse and measurement grid is presented in Figure 14.
Figure 15 presents the total-to-total pressure rise characteristic of the test compressor. The total-to-total pressure rise coefficient, Ψ T T , and flow coefficient, Φ , are defined as follows, respectively:
Ψ T T = P t , o u t l e t P t , i n l e t 0.5 ρ U m 2 ,
Φ = V z U m ,
The measurement was conducted both at design point (DP) and near-stall conditions (NS), which are characterized by solid symbols in Figure 15.
The measured flow fields of axial velocity and yaw angle are shown in Figure 16 and Figure 17, where both the results for the DP and NS conditions are presented. As shown in Figure 16, the corner separation under the condition of DP occurs at the suction side (SS) of stator blades and was confined to the casing region (about from 60% to 100% span), where the stator wake is also visible. With the compressor throttled to the stall boundary, the situation differs a lot. Under the condition of the NS, corner separation almost extends to the whole spanwise range and the stator wake also thickens. Due to these aspects, the stator wake is no longer discernible from the corner separation. Within the separation region, this implies complex secondary flow and that the situation is more terrible for the NS condition. It can be concluded from Figure 17 that the flow angle varies sharply in the stator wake, especially for the NS condition. For the condition of DP, the flow angle of the nearly entire flow field is restricted to the range from −30° to 30°, which means the flow angle lies in the range of sector 1 (Figure 3). Therefore, the traditional method instead of the zonal method is sufficient for this condition. However, the situation becomes more complex for the NS condition, where 46 points (about 22% of total points) exceed the measurable range of sector 1 (i.e., the traditional method). After the zonal method is used, which is put forward to enlarge the measurable flow range, only 7 points (about 3% of total points) exceed the measurable flow range.
Figure 18 shows the radial distribution of flow parameters at the outlet of the vane suction surface. At the design point, the decrease in velocity and the increase in flow angle at 60% to 80% span indicate that there is corner separation here. At the near-stall point, the corner separation spreads across the entire span, so that the flow parameters are then more uniformly distributed in the radial direction.

5. Summary and Discussion

Throughout the work of this paper, a miniature five-hole pneumatic probe, with a tip diameter and length of 1.5 mm and 3.2 mm, respectively, was manufactured, calibrated, and applied in the end-wall flow measurement in a low-speed, multistage axial compressor. To manufacture such a compact tip structure, the conventional machining technique was almost impossible and the state-of-the-art laser-printing technique was adopted. The summary of this paper contains two parts:
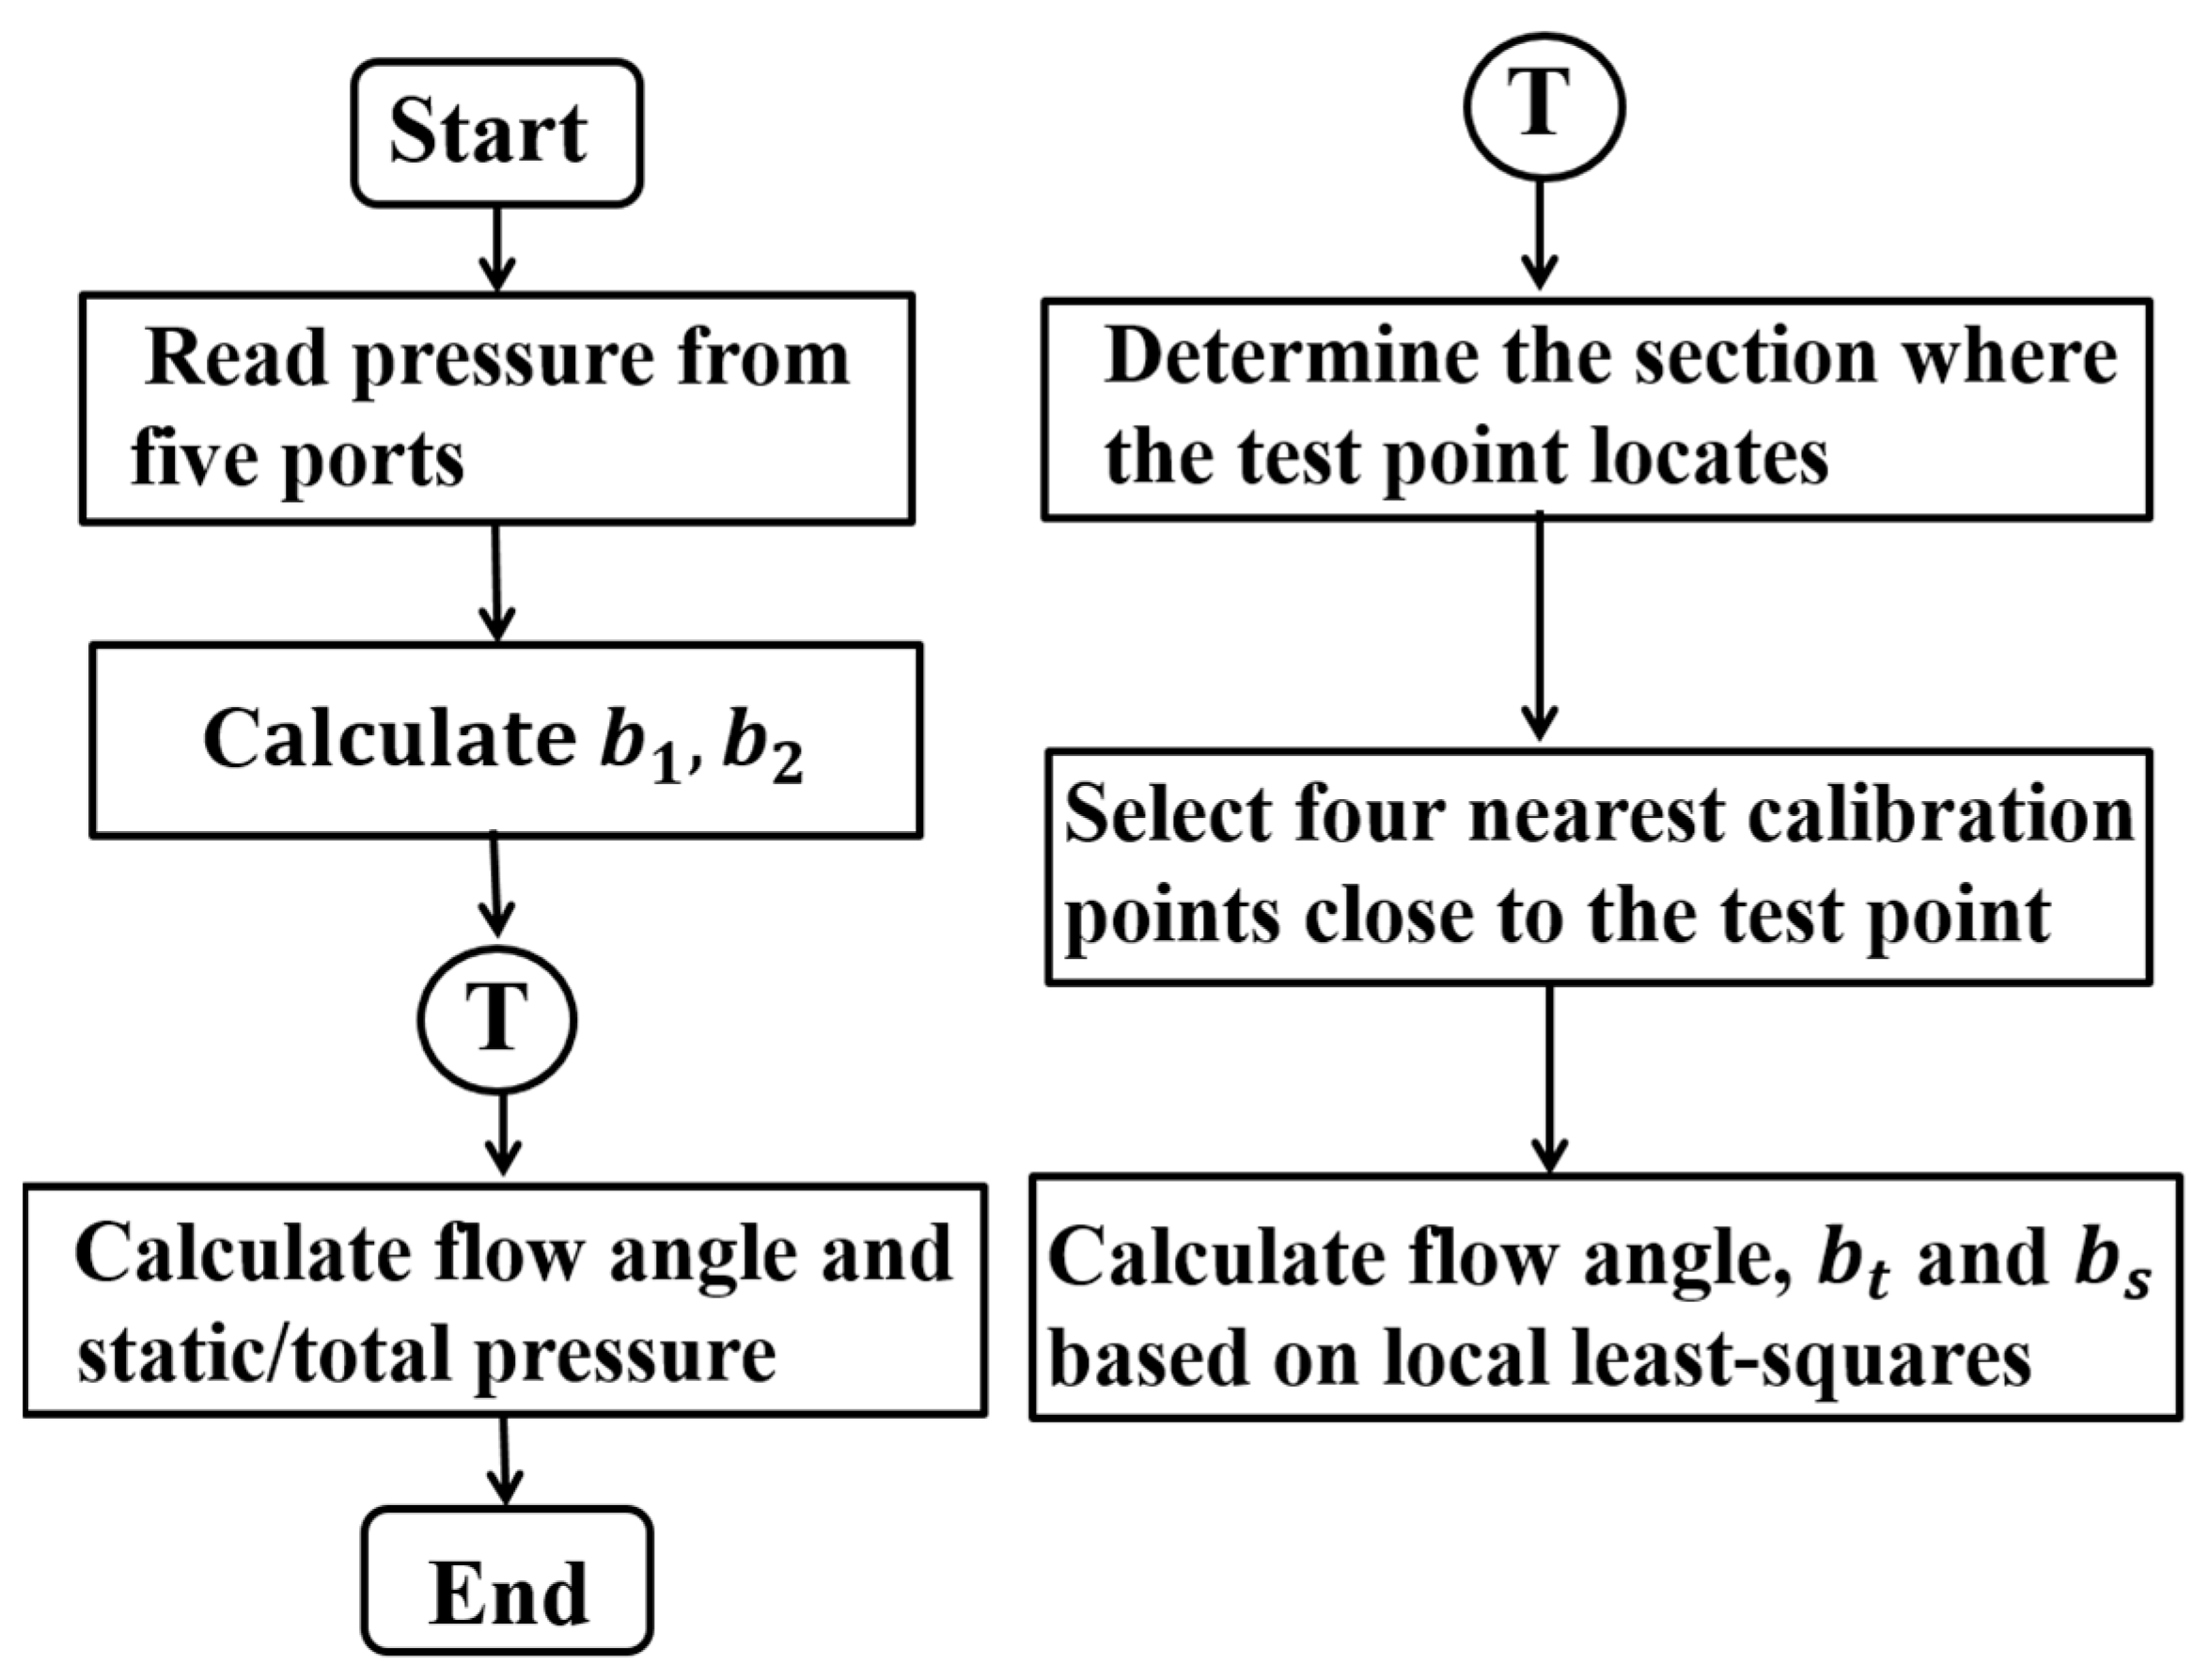
  • Data reduction and error analysis of the miniature five-hole probe.
The application of the laser printing technique enables for the successful manufacturing of this miniature probe, which is nearly impossible for traditional machining. The compact tip structure of the probe reduced the effect of probe blockage on the flow field and enhanced the spatial resolution. The local least-squares interpolation technique and overlap region method were employed to reduce the calibration errors. It shows that the maximum errors of the pitch angle, yaw angle, total pressure, and static pressure were 0.93°, 1.24°, 0.56%, and 1.9%. Compared with the previous literature, the probe and data reduction procedure in this paper reduce the measurement error of total pressure and static pressure. Also, the zonal method was adopted to enlarge the measurable flow range, up to ± 60 ° .
All of these aspects guarantee the application of the probe in the end-wall flow measurement between blade rows in multistage axial compressors.
2.
Application in end-wall flow measurement in a multistage axial compressor.
The measurement results from a low-speed, multistage axial compressor indicate that the probe can distinguish the corner separation and stator wake clearly and reflect the deterioration of the corner separation with the compressor throttled to the stall boundary. Also, the zonal method is of great significance in decreasing the number of points exceeding the measurable flow range for the traditional method, especially for the near-stall condition. Compared with the traditional method, the proportion of available data for the near-stall state measurement was increased by 18% by using the zonal method. However, in order to extend the probe to high-speed compressor flow field measurement, more research is needed in the future, such as on the influence of Reynolds number on measurement accuracy.

Author Contributions

S.M. contributed to methodology, calibration, data reduction, experiment conduction, and original manuscript writing. J.H. contributed to methodology and reviewing. X.W. contributed to calibration, data reduction, experiment conduction and probe manufacturing. J.J. contributed to calibration, data reduction. All authors have read and agreed to the published version of the manuscript.

Funding

The research was funded by National Science and Technology Major Project of China (grant No. J2019-V-0017-0112).

Data Availability Statement

The data presented in this study are available on request from the corresponding author.

Acknowledgments

The authors would like to acknowledge the supports of National Science and Technology Major Project of China.

Conflicts of Interest

The authors declare no conflict of interest.

Nomenclature

b s , b t Static and total pressure coefficients
b α , b β , b θ , b ϕ Pitch, yaw, cone, and roll angle coefficients
P 1 ,…, P 5 Pressure measured at port 1, …, 5
P t , i n l e t , P t , o u t l e t Total pressure at inlet and outlet
q 1 , q 2 Dynamic pressure for low-angles and high-angles
U m Rotational speed at mid span
V z Axial velocity
α , β , θ , ϕ Pitch, yaw, cone, and roll angle
ε Error between the measured and true value
ρ Density
Φ Flow coefficient
Ψ T T Total-to-total pressure rise

References

  1. Wisler, D.C. Aerodynamic effects of tip clearance, shrouds, leakage flow, casing treatment and trenching in compressor design—Blading design in the endwall region. In Lectures on Tip Clearance Effects in Axial Turbomachines; Von Karman Institute for Fluid Dynamics: Sint-Genesius-Rode, Belgium, 1985. [Google Scholar]
  2. Koch, C.C.; Smith, L.H. Loss sources and magnitudes in axial-flow compressors. J. Eng. Gas Turbines Power 1976, 98, 411–424. [Google Scholar] [CrossRef]
  3. Wennerstrom, A.J. Low aspect ratio axial flow compressors: Why and what it means. J. Turbomach. 1989, 111, 357–365. [Google Scholar] [CrossRef]
  4. To, H.-O.; Miller, R.J. The Effect of Aspect Ratio on Compressor Performance. J. Turbomach. 2019, 141, 081011. [Google Scholar] [CrossRef]
  5. Koch, C.C. Stalling Pressure Rise Capability of Axial Flow Compressor Stages. J. Eng. Power 1981, 103, 645–656. [Google Scholar] [CrossRef]
  6. Smith, L.H. Casing Boundary Layers in Multistage Axial Compressors. In Flow Research on Blading; Elsevier: Amsterdam, The Netherlands, 1970; pp. 275–304. [Google Scholar]
  7. Ren, X.; Gu, C. A numerical study on the tip clearance in an axial transonic compressor rotor. Appl. Therm. Eng. 2016, 103, 282–290. [Google Scholar] [CrossRef]
  8. Town, J.; Akturk, A.; Camci, C. Total pressure correction of a sub-miniature five-hole probe in areas of pressure gradients. In Proceedings of the ASME Turbo Expo 2012: Turbine Technical Conference and Exposition, Copenhagen, Denmark, 11–15 June 2012; Volume 1, pp. 855–861. [Google Scholar]
  9. Gilarranz, J.L.; Ranz, A.J.; Kopko, J.A.; Sorokes, J.M. On the Use of Five-Hole Probes in the Testing of Industrial Centrifugal Compressors. J. Turbomach. 2005, 127, 91–106. [Google Scholar] [CrossRef]
  10. Coldrick, S.; Ivey, P.C.; Wells, R.G. The Influence of Compressor Aerodynamics on Pressure Probes: Part 2—Numerical Models. In Proceedings of the ASME Turbo Expo 2004: Power for Land, Sea, and Air, Vienna, Austria, 14–17 June 2004; pp. 515–520. [Google Scholar]
  11. Li, J.; Du, J.; Geng, S.; Li, F.; Zhang, H. Tip air injection to extend stall margin of multi-stage axial flow compressor with inlet radial distortion. Aerosp. Sci. Technol. 2020, 96, 105554. [Google Scholar] [CrossRef]
  12. Yasa, T.; Paniagua, G. Robust procedure for multi-hole probe data processing. Flow Meas. Instrum. 2012, 26, 46–54. [Google Scholar] [CrossRef]
  13. Hall, B.F.; Povey, T. The Oxford Probe: An open access five-hole probe for aerodynamic measurements. Meas. Sci. Technol. 2017, 28, 35004. [Google Scholar] [CrossRef]
  14. Liu, B.; Qiu, Y.; An, G.; Yu, X. Utilization of Zonal Method for Five-Hole Probe Measurements of Complex Axial Compressor Flows. J. Fluids Eng. 2020, 142, 061504. [Google Scholar] [CrossRef]
  15. Gerner, A.A.; Maurer, C.L.; Gallington, R.W. Non-nulling seven-hole probes for high angle flow measurement. Exp. Fluids 1984, 2, 95–103. [Google Scholar] [CrossRef]
  16. Everett, K.N.; Gerner, A.A.; Durston, D.A. Seven-hole cone probes for high angle flow measurement Theory and calibration. AIAA J. 1983, 21, 992–998. [Google Scholar] [CrossRef]
  17. Babu, C.V.; Govardhan, M.; Sitaram, N. A method of calibration of a seven-hole pressure probe for measuring highly three-dimensional flows. Meas. Sci. Technol. 1998, 9, 468–476. [Google Scholar] [CrossRef]
  18. Pisasale, A.J.; Ahmed, N.A. A novel method for extending the calibration range of five-hole probe for highly three-dimensional flows. Flow Meas. Instrum. 2002, 13, 23–30. [Google Scholar] [CrossRef]
  19. Shaw-Ward, S.; Titchmarsh, A.; Birch, D.M. Calibration and Use of n-Hole Velocity Probes. AIAA J. 2015, 53, 336–346. [Google Scholar] [CrossRef]
  20. Mortadha, J.; Qureshi, I. Extending the usable range of the calibration map of a four-hole probe for measuring high flow angles. Flow Meas. Instrum. 2019, 65, 257–267. [Google Scholar] [CrossRef]
  21. Ericksen, A.L.; Gallington, R.W.; Rao, B.M. Rapid Calibration of Seven-Hole Probes; NASA Technical Memorandum 107040; National Aeronautics and Space Administration: Washington, DC, USA, 1995. [Google Scholar]
  22. Johansen, E.S.; Rediniotis, O.K.; Jones, G. The Compressible Calibration of Miniature Multi-Hole Probes. J. Fluids Eng. 2001, 123, 128–138. [Google Scholar] [CrossRef]
  23. Herrmann Schlichting, K.G. Boundary-Layer Theory; Springer: Berlin/Heidelberg, Germany, 2000; ISBN 3540662707. [Google Scholar]
  24. Crawford, J.; Michael Birk, A. Improvements to Common Data Reduction and Calibration Methods for Seven Hole Probes. J. Fluids Eng. 2013, 135, 031206. [Google Scholar] [CrossRef]
Figure 1. The schematic of the five-hole probe structure.
Aerospace 10 01020 g001
Figure 2. The two angle frames: (a) for low flow angle and (b) for high flow angle.
Aerospace 10 01020 g002
Figure 3. The schematic of angular space division.
Aerospace 10 01020 g003
Figure 4. Flow diagram over the probe tip at high flow angle.
Aerospace 10 01020 g004
Figure 5. Pressure scanner system used during calibration.
Aerospace 10 01020 g005
Figure 6. Two-axis traverse system.
Aerospace 10 01020 g006
Figure 7. Calibration grid of the probe. (a) Cone θ and roll ϕ ; (b) pitch α and yaw β .
Aerospace 10 01020 g007
Figure 8. Calibration results for sector 1 and sector 3. (a) α for sector 1; (b) α for sector 3; (c) β for sector 1; (d) β for sector 3; (e) b t for sector 1; (f) b t for sector 3; (g) b s for sector 1; (h) b s for sector 3.
Aerospace 10 01020 g008aAerospace 10 01020 g008b
Figure 9. Data reduction procedure.
Aerospace 10 01020 g009
Figure 10. The schematic of test data distribution in cone-roll space.
Aerospace 10 01020 g010
Figure 11. The errors of 298 test points (a) for pitch angle; (b) for yaw angle; (c) for total pressure; (d) for static pressure.
Aerospace 10 01020 g011
Figure 12. Statistical analysis of the error. (a) for mean absolute deviation; (b) for standard deviation.
Aerospace 10 01020 g012
Figure 13. Drawings of the experimental test facility (a) for the test rig; (b) for the test compressor.
Aerospace 10 01020 g013
Figure 14. Measurement methodology (a) for the area traverse; (b) for the measurement grid.
Aerospace 10 01020 g014
Figure 15. Total-to-total pressure rise characteristic of the test compressor.
Aerospace 10 01020 g015
Figure 16. The measured axial velocity contour and streamlines (a) for the DP condition; (b) for the NS condition.
Aerospace 10 01020 g016
Figure 17. The measured flow angle contour (a) for the DP condition; (b) for the NS condition.
Aerospace 10 01020 g017
Figure 18. Radial distribution of flow parameters at the outlet of the vane suction surface. (a) Axial velocity; (b) flow angle; (c) dimensionless static pressure; (d) dimensionless total pressure.
Aerospace 10 01020 g018
Table 1. Some key parameters of the test compressor.
ParameterValue
Rotational speed range (rpm)0~1500
Design speed/Test speed (rpm)900
Casing diameter (mm)1500
Hub-to-tip ratio0.88
Blade number (inlet guide vane/rotor/stator)60/64/80
Chord at midspan (mm, rotor/stator)92/74
Axial gap (mm)20
Disclaimer/Publisher’s Note: The statements, opinions and data contained in all publications are solely those of the individual author(s) and contributor(s) and not of MDPI and/or the editor(s). MDPI and/or the editor(s) disclaim responsibility for any injury to people or property resulting from any ideas, methods, instructions or products referred to in the content.

