Abstract
The cold gas micro-propulsion system can provide low noise and ultra-high accuracy thrust for satellite platforms for space gravitational wave detection, high-precision earth gravity field measurement. In this study, the effect of different needle valve opening ratios on the rarefied flow characteristics of a micro-nozzle in a cold gas micro-propulsion system was investigated based on DSMC method. The special feature of the currently studied micro-nozzle is that it has a section of micro-channel with a large length–diameter ratio up to 4.5. Due to the extremely small needle valve displacement of the nozzle (minimum needle valve displacement up to 1.7 μm), a finely structured mesh was used. The molecular particle and macro flow characteristics inside the micro-nozzle were calculated for the conditions of a needle valve opening ratio from 5% to 98%. The throttling effect of the throat has a significant effect on the rarefied flow in the micro-nozzle; especially under the tiny opening, this effect is more significant. The spatial distribution of continuous flow, transition flow, and free molecular flow in the micro-nozzle varies at different needle valve opening ratios. As the needle valve opening ratio increases, the continuous flow will gradually fill the microfluidic region.
1. Introduction
The new generation of space gravitational wave detection, high-precision earth gravity field measurement, high-precision earth observation, and satellite navigation missions have put forward the requirements of ultra-static, low noise, ultra-high accuracy, and stability for satellite platforms. The micro-thruster with high precision and resolution is the key to offset the extremely micro interference of non-conservative forces, such as atmospheric drag, solar light pressure, and cosmic particles’ impact, and make the satellite platform achieve “Drag-free control” []. Micro thrusters generate thrust in the order of milli-Newtons or even micro-Newtons through cold gas acceleration or chemical reaction, which has a relatively high impact, low power consumption, high working reliability, etc. [,,,]. The micro-thruster is one of the key components of the cold gas micro-propulsion system.
When the cold gas propulsion system works, gas, e.g., nitrogen and helium, will flow through the micro-nozzle to expand and eject at high speed, thus generating thrust. For flows inside the micro-nozzle, the continuum flow assumption is perhaps no longer valid. The gas molecular nature of the fluid becomes predominant. The particle transport processes in rarefied flows are also of interest but has been less addressed in the previous literature. Fratantonio et al. [] used the molecular tagging velocimetry (MTV) to detect the flow rate of argon and helium under low pressure in a 1 mm deep channel. Silva et al. [] presented a new time-dependent version of the well-known constant volume method for the accurate measurement of mass flow rates of gases in microchannels. It is difficult to accurately take measurements in rarefied flows in micro-nozzles and micro-channels []. Most scholars adopted numerical simulation methods to study the rarefied flow in micro-nozzles [].
Rarefied gas flow at the molecular level follows the Boltzmann equation, and direct simulation Monte Carlo (DSMC) [] is an efficient and mature method for solving the Boltzmann equation. Darbandi and Rooh [] used the DSMC method to study the influence of different gases, rarefaction degrees, and wall reflection models on the flow field of micro/nanometer nozzles. Zhi Shang et al. [] used the DSMC method to calculate the velocity field and temperature distribution around the astronaut re-entry module, which provided some useful information on heat transfer and boundary layer flow fields. Sebastian and Santos [] used the DSMC method to simulate convergent and divergent micro-nozzles arranged in arrays. By considering convex and concave divergent surfaces, the influence of contour curvature and discontinuity on the pressure, the surface friction, and the heat transfer coefficient of divergent surfaces was studied.
Previous studies have shown that the micro-thruster structure has an important influence on the internal rarefied flow characteristics. Zelesnik et al. [] studied the influence of the nozzle’s geometry on nozzle propulsive force at a low Reynolds number. They showed that conical nozzles can provide the maximum thrust because they have the largest mass flux compared to bell-shaped nozzles for the same inlet conditions. The result of Bayt [] indicate that the thrust performance decreases marginally with increasing expansion angle due to the dominance of the divergence losses. The variation is about 0.5% at high mass flow rates and decreases with the Reynolds number until, at the lowest Reynolds number tested, the large expansion angles perform better. Rossi [] confirmed the importance of adjusting the geometric characteristics of the micro nozzle to obtain the optimal thrust based on theoretical analysis. Louisos and Hitt [] used a continuum flow model to perform a numerical study on 2-D planar micro-nozzles to investigate the effect of the divergence angle and the throat Reynolds number on the thruster’s performance. It was observed that the direct scaling of the divergence angle of a macro-scale nozzle cannot achieve the same effect in a micro scale nozzle. Kn number is used to characterize the rarefied effect of gas flow, which is defined as the ratio of the average free path length of gas molecules λ to the geometric characteristic length L. According to different value ranges of the Kn number, the flow is divided into the following four types of flow regimes: namely continuous flow (Kn < 0.01), slip flow (0.01 < Kn < 0.1), transition flow (0.1 < Kn < 10), and free molecular flow (Kn ≥ 10) []. With the increase of the Kn number, the wall velocity slip and the temperature jump at the wall continue to intensify and have an important impact on momentum and energy transfer in the microchannel []. Michalis et al. [] studied the effects of rarefaction on gas viscosity in a long, straight channel using the DSMC method. They found that a Bosanquet-type of approximation describes very satisfactorily the Knudsen number dependence of the viscosity over the entire transition regime. Darbandi et al. [] carried out a numerical simulation of the large-scale thin flow regime from subsonic to supersonic in micro/nanoscale convergent divergent nozzles. When Kn exceeds the middle magnitude, the high viscous force generated by the wall boundary layer can prevent the supersonic flow in the nozzle expansion part. Compared with the macroscale structure, the microscale structure has a larger surface area-to-volume ratio, and the wall effect has a more significant impact on the momentum and energy transfer of the flow. The study of Varade et al. [] showed that the viscous shear force was the main factor of the pressure drop in extended micro-scale channels. Due to the weakening of convection, increasing the number of Kn increases the wall friction coefficient. When the Kn number is greater than 1, gas density pulsation is weakened, and diffusion transport is proportional to the pressure gradient. Increasing the face ratio of the micro-channel will not only increase the wall friction coefficient and the Nusselt number (Nu) but also will increase the sensitivity to the Kn number []. In addition to the influence of the rarefaction effect and wall effect, the flow inside the micro-nozzle is also affected by wall roughness [,], fluid–solid heat transfer [,], and other factors.
The micro-nozzle structure selected in this study (See Figure 1) includes the micro-channel with a large length-to-diameter ratio (>4) and the bell-shaped nozzle. The micro-channel with a large length-to-diameter ratio can effectively improve the structural strength and service life of the nozzle []. The bell geometry is favored on the macroscale for its flow alignment. The valve needle opening upstream of the micro-channel allows precise control of the nitrogen flow rate to meet the flow control requirements. However, theoretical analysis shows that the distribution range of the average free path length of gas molecules in the current nozzle is wide (10−7~10−3 m). The Kn number difference inside the micro-nozzle is more than 104, and the flow mechanism covers four flow states from continuous flow to free molecular flow. Darbandi et al. [] discussed the flow mechanism division in the micro-nozzle, but its structure is a simple convergent to divergent nozzle, lacking a microchannel. So far, there are few simulation studies on the rarefied flow in the micro-nozzle with a microchannel and needle valve structure [], which will increase the rarefied effect and wall effect of the micro-thruster.
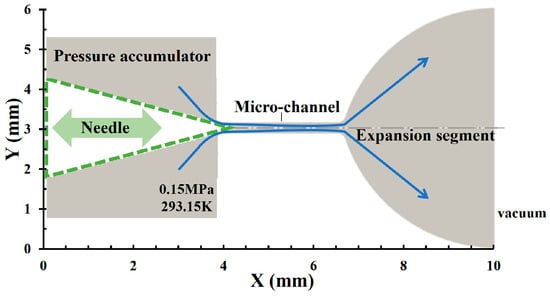
Figure 1.
The micro-nozzle structure with a large length-to-diameter ratio of 4.5 used in this study.
The aim of the present study is to analyze the effect of different needle valve opening ratios on the rarefied flow characteristics in a micro-nozzle with a microchannel of a large length-to-diameter ratio, up to 4.5 by the DSMC method. The main geometry parameters of the micro-nozzle are listed as follows: (1) valve needle cone angle is 30°; (2) micro-flow channel inner diameter, length, and length–diameter ratio are 0.6 mm, 2.7 mm, and 4.5, respectively; (3) expansion section length and outlet diameter are 3.8 mm and 6 mm. The particle-based DSMC solver dsmcFoam in the OpenFOAM V7 was used. The spatial distribution of gas molecules, molecular internal energy distribution, mean molecular free path, and local Kn number in the micro-nozzle were calculated. The spatial distribution of rarefied flow was discussed. Statistics were performed on macroscopic parameters, e.g., fluid temperature, pressure, density, and velocity.
2. The DSMC Method
The motion of molecules in a fluid can be described with the Boltzmann kinetic equation (BKE) []. This equation has the following form:
where is the motion distribution function, t is time, is the molecular position vector, and are initial velocities of the molecules before and after the collision. Once the distribution function is determined, the statistical averaging method can be used to obtain the flow flux and gradient information and, thus, the flow macroscopic parameters. The F is an external body force. In addition, , , , , and are the velocities of molecular pairs after collision. is the differential of collision cross section.
When the continuous flow assumption no longer holds, problems such as flow shear and heat transfer will not be solved by continuous flow methods. Then molecular dynamics (MD) and DSMC methods are proposed to solve the Boltzmann equation and use it to describe the dilute flow problem. However, the MD method is computationally time-consuming because it solves the motion of each molecule and its collision directly. The DSMC method was proposed by Bird and was shown to be consistent with the Boltzmann equation in 1992 []. DSMC is a computational tool to solve the BKE on the basis of the direct statistical simulation of molecular processes described by the kinetic theory [] The DSMC method applies a splitting approach to the particles’ velocity distribution function to obtain a solution for the Boltzmann equation. This method uses the introduction of a certain number of sample particles to simulate clusters of molecules or atoms to simplify the solution of the Boltzmann equation. Unlike the direct solution of the MD method, the DMSC method uses sample statistics and introduces scattering rate and collision velocity distribution models to describe collision events between molecules or between molecules and wall boundaries. Currently, the DSMC method is widely used to solve problems including spacecraft in orbit and rarefaction flow.
2.1. Molecular Collision Model
Both methods, DSMC and MD, are based on particle calculations. In fact, the DSMC method is the same as the molecular dynamic method. DSMC method starts from the microscopic point of view, uses a small number of simulated molecules to represent the real fluid molecules, uses the probability simulation method of statistical physics to simulate the movement and collision of molecules, and finally obtains a more accurate macroscopic physical process [].
In the DSMC method, the solution of the molecular collision process is based on a statistical approach to a sample of molecules within the cell []. There are a number of methods to ensure that the number of molecular collisions solved by statistical methods is close to the analytical theoretical solution, including the TC (time-counter) and NTC (no-time-counter) methods. The probability of collision of sample particle i with particle j in a given cell is
where N is the transient sample particles in the cell. The NTC method determines the number of molecular pairs that collide within the cell at some time step as:
where is cell volume, is the maximum value of the product of the collision cross section and the relative velocity of all possible colliding particles in the cell, N and are the number of sample particles in the cell and the actual number of atoms or molecules contained in the sample particles, respectively.
In this paper, the binary collision model is the Variable-Hard-Sphere model (VHS) because this method is most widely used. The mass of a nitrogen molecule is 46.5 × 10⁻²⁷ kg; the equivalent diameter is 3.17 × 10⁻¹⁰ m; the temperature exponent of the coefficient of viscosity is 0.74.
2.2. Cercignanie-Lampise-Lord (CLL) Gas-Surface Interaction Model
In rarefied flow problems within micro-channels, collisions between molecules and the boundary will have an impact on the molecular motion behavior. Especially when the microfluidic channel has a large aspect ratio, the effect of molecular collisions with the wall will be more significant. The molecule-wall interaction models are divided into the following three categories: (1) specular reflection models; (2) diffuse reflection models; and (3) mixed models of specular and diffuse reflection [].
At the gas–wall interface, the Maxwell model [] is used with fully diffuse accommodation of tangential momentum and energy. The models, however, do not produce the lobular distribution in the direction of the remitted molecules observed in experiments. The Maxwell model cannot consider the influence of wall morphology, wall atom/gas molecular potential energy interaction on the scattering of non-ideal molecules, so momentum and energy adjustment coefficients are introduced to adjust empirically. However, the determination of the adjustment coefficient depends on the results of molecular beam experiments or simulation studies, resulting in greater limitations in application. Lord et al. introduced Phenomenology into the DSMC method, and a new wall reflection model, the Cercignani–Lampis–Lord (CLL) wall reflection model, was developed []. The CLL model assumes that the normal and tangential velocities during molecular reflection are independent of each other and introduces a dispersion kernel function to describe the normal and tangential velocity probabilities of the reflected molecules. The dispersion kernel function determines the relationship between the incident and impinging reflected molecules. The number flow of the impinging reflected molecules can be expressed as
where and are the velocity distribution functions of the incident and reflected molecules, respectively. and are the velocities of the incident and reflected molecules, respectively. is the dispersion kernel function.
The dispersion kernel function for the tangential velocity and normal components is expressed as
where and are the tangential and normal velocities, respectively. Subscript and represent incident and reflected molecules, respectively. and are the tangential momentum adjustment coefficient and the normal energy adjustment coefficient, respectively. The tangential momentum adjustment coefficient and the normal energy adjustment coefficient in the CLL model are set to 0.8 and 1.0, respectively.
The dispersion kernel functions for the tangential velocity and normal components satisfy the normalization condition. At the same time, the dispersion kernel function is also subject to the reciprocity relation. The molecular reflection velocity distribution form calculated according to the CLL model is shown in Figure 2, and the reflected molecules from the impact wall form an asymmetric, one-sided blade form, which is closer to the experimental results of the gas molecules impacting the wall under vacuum conditions.
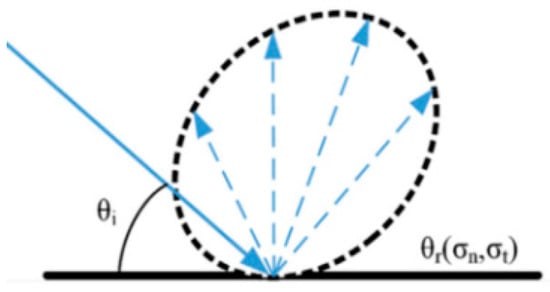
Figure 2.
Reflected velocity distribution of impacted molecules described by CLL model.
3. Results and Discussion
The computational domain of the micro-thruster is shown in Figure 3. The computational domain model can be divided into four sections such as inlet section, throat, micro-scale channel, and nozzle expansion section. Since the nozzle is an axisymmetric structure, a wedge-shaped computational domain, circumferential angle set to 0.5°, is used in this study. The main structural parameters of the micro-nozzle include the following: (1) valve needle cone angle is 30°; (2) micro-flow channel inner diameter of 0.6 mm, length of 2.7 mm, i.e., the length–diameter ratio is 4.5; (3) the expansion section length of 3.8 mm, outlet diameter of 6 mm. Since the DSMC calculation is applied to the whole area, the continuous flow area in the valve cavity upstream of the throat needs to be minimized in order to reduce the calculation effort, so the area within 0.4 mm upstream of the throat is selected for this calculation. Before the formal calculation, dsmcInitialise is used to set initial conditions such as the temperature of nitrogen molecules and walls, the velocity of the nitrogen molecules, and the number density of molecules at the entrance, and this process took 5 s.

Figure 3.
Computational domain (left side) and cells (right side).
The left side of the calculation domain (See Figure 3) shows the inlet boundary where the molecular number density corresponding to the actual inlet pressure 0.15 MPa is set to 1.9011 × 1025 1/m3. The mass of the nitrogen molecule is 46.5 × 10⁻²⁷ kg, and the equivalent diameter is set to 3.17 × 10⁻¹⁰ m. Since the actual outlet pressure is a vacuum, the molecular number density at the outlet surface is zero. The wall is set to an isothermal boundary of 300 K. The equivalent number of molecules per molecular sample particle is set to 5.5 × 10⁸. A fixed calculation time step is used, which takes the value of 1 × 10⁻⁹ s. The flow state in the micro nozzle reaches a quasi stable state at 0.1 ms.
Figure 4 shows the verification of the selected time step during calculation, which compares the time step to the ratio Δx/(3*u0), where Δx is the applied maximum cell size and u0 is the most probable velocity. The following histogram in Figure 4 shows the two velocity distributions in the calculation process, which can calculate u0. The results show that the calculated adaptive time step is always greater than the set fixed time step, so it meets the requirements.
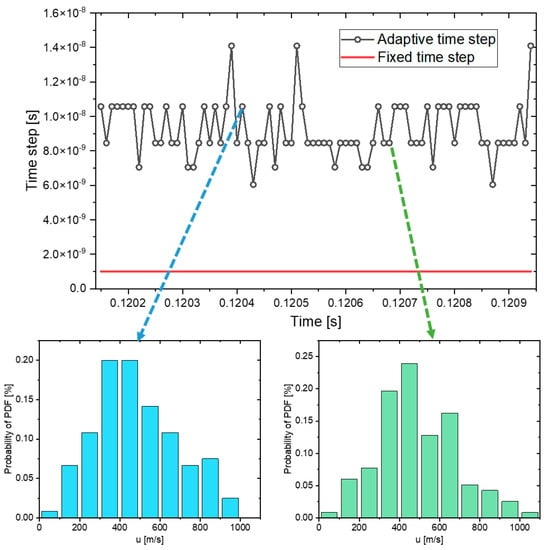
Figure 4.
Verification of time step.
In the present study, the particle-based DSMC solver dsmcFoam in the OpenFOAM V7 was used. The mesh generation utility, blockMesh, supplied with OpenFOAM was utilized to create parametric meshes with grading and curved edges.
Table 1 lists the different computational domain meshing schemes and the predicted deviation values with respect to the results of Grid 9. In the work on grid independence analysis, the needle valve opening ratio is set to 10%, i.e., the opening displacement 3.4 μm. Based on the comparison results of the gas’s average exit velocity on the outlet face, Grid 5 has a higher computational accuracy (calculation deviation 1.79%) and a relatively small total number of cells. The effect of continuing to increase the number of cells on the calculation results is small, with a relative deviation effect of less than 2%. Figure 5 shows Grid 1 and Grid 9 in Table 1, and the grid at the exit section.

Table 1.
Effects of cells on the mean molecular velocity at the nozzle exit.
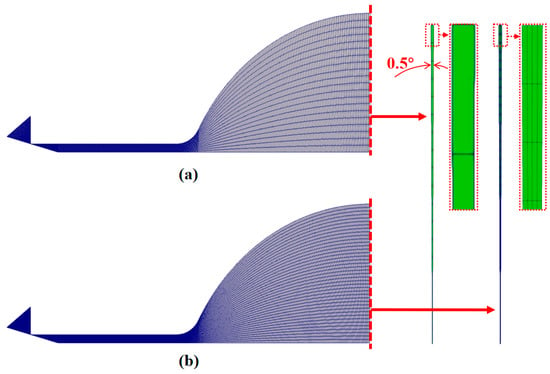
Figure 5.
Comparison of (a) Cells 1 and (b) Cells 9.
In order to verify the accuracy of the current model, a comparison of the simulation and experimental thrust results with a valve opening ratio ranging from 5% to 98% is carried out (Table 2). As shown in Figure 6, an indirect force measuring system based on the torsion pendulum platform is established. A high-precision capacitive displacement meter was used to measure the arm displacement. At the same time, a vacuum chamber with a diameter of 1 m and a length of 1.2 m was built to create a real working environment for the thruster as shown in Figure 6a. The mechanical pumps and molecular pumps were used for vacuuming so that the pressure in the vacuum chamber is less than 1 Pa. The mechanical pump was installed on the air-floating platform outside the warehouse to minimize the influence of mechanical vibration on the force measurement. The force measuring system was also equipped with an on-line damping and calibration subsystem suitable for a vacuum, which can improve the measurement accuracy and achieve a larger force measuring range. As shown in Figure 6b, the precision-leveled torsion pendulum platform was installed in the vacuum chamber; the micro-thruster was installed at the right end of the swing arm; and the counterweight, displacement meter, and damper were installed on the left side of the swing arm. The micro-thruster was covered by a thermal control, as shown in Figure 6c. The air supply source was installed outside the vacuum chamber, which was led into the vacuum chamber through hoses and connected to the thruster. All electronic control and data acquisition were controlled with measurement and control software to minimize human interference and improve the automation of the test system. The simulation obtained thrust results that are close to the experimental measurements. When the needle displacement is less than or equal to 3.4 μm, simulation deviations appear to increase up to approx. 28%. The reason is that when the needle displacement is too small, e.g., less than 3.4 μm in this study, the number of nitrogen molecules entering the micro-channel decreases sharply, which affects the calculation accuracy. Moreover, the thrust force at the tiny opening ratio is too small, which may also affect the accuracy of the experiment. The above two reasons cause an increase in the simulation’s deviation. When the needle displacement is greater than 3.4 μm, the simulation results match very well with the experimental results.

Table 2.
Comparison between experimental and computational thrust results.
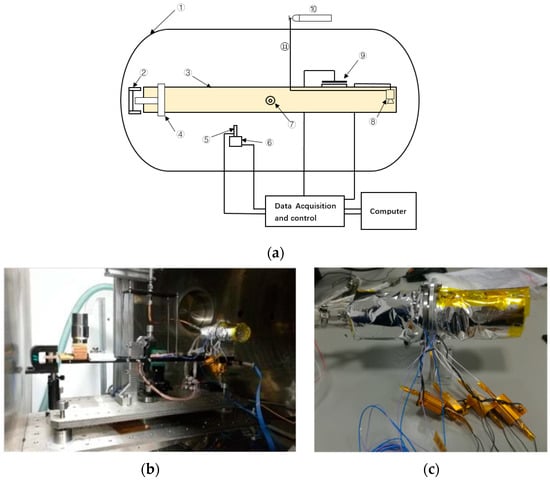
Figure 6.
Thrust measurement system. (a) Schematic diagram of measuring system. ① Vacuum Chamber; ② Damper; ③ Pendulum; ④ Counter weight; ⑤ Displacement Device; ⑥ Precision Seat; ⑦ Axis; ⑧ Micro-thruster; ⑨ Calibration System; ⑩ Gas Bottle; ⑪ Pipe. (b) Establishment of thrust measurement system. (c) Thruster with thermal control coating.
It has been shown that the molecular number density is an important parameter affecting the rarefied flow []. The following sections provide a detailed analysis of the flow characteristics within the micro-nozzle and investigate the flow mechanism under different needle displacements. The distributions of the DSMC molecular particles on the axial section of the micro-nozzle at different needle displacements at 0.1 ms are given in Figure 7. The results show that when the needle displacement is less than 3.4 μm, the nitrogen molecules are mainly concentrated in the upstream volume of the throat and the micro-channel due to the throttling effect. Then the nitrogen molecules quickly fill the entire nozzle space after leaving the micro-channel. As the needle valve displacement increases, the number of nitrogen molecules in the nozzle increases rapidly.
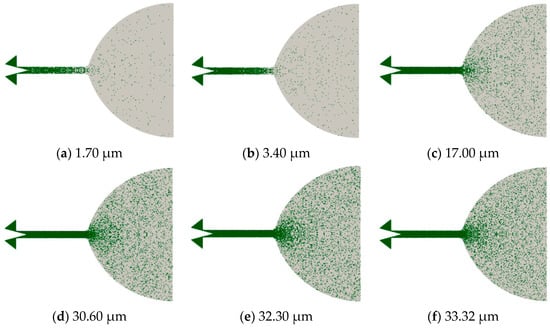
Figure 7.
Particle distributions in the axial plane with different needle displacements at t = 0.1 ms. The calculation contours are mirrored on the axis of the symmetry axis.
The distribution of the molecular sample particles (Figure 7) can only provide information on molecular spatial location and qualitative molecular number density. Molecular number density is a parameter that gives a good indication of the local number of molecules. The calculated molecular number density distribution for different valve opening ratios is given in Figure 8. The results show that the molecular number density in the region near the downstream of the throat is below a 1023 order of magnitude under the low needle valve opening. The molecular number density field in Figure 8 is a discrete, point-like, discontinuous distribution due to the use of molecular sample particles to approximate the actual molecules. The molecular number density is directly related to the local pressure and also determines the strength of the intermolecular collisions and the interaction between molecules inside the micro-nozzle. The molecules are mainly distributed in the upper midstream region of the micro-channel. The nitrogen molecular density decreases rapidly from 1024 1/m3 as the nitrogen enters from the channel to the nozzle expansion section.

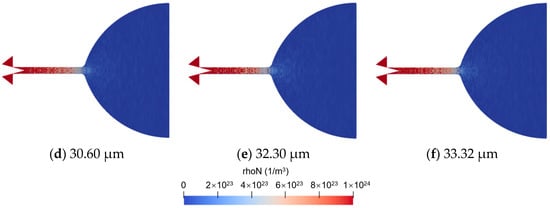
Figure 8.
Molecular number density fields in the axial plane with different needle displacements at t = 0.1 ms.
Figure 9 gives the molecular internal energy distribution at different needle displacements. When the needle displacement is below 17 μm, there are only a small number of lower energy (below 40 J/m3), discrete distributions of molecular sample particles in the nozzle. As the needle valve opening ratio increases, the high energetic molecules near the outlet of the micro-channel gradually increases. When the needle valve displacement exceeds 30.6 μm, the high internal energy molecules in the nozzle tend to diffuse toward the near-wall region of the expansion section, while the internal energy of molecules in the central region of the expansion section is relatively low.
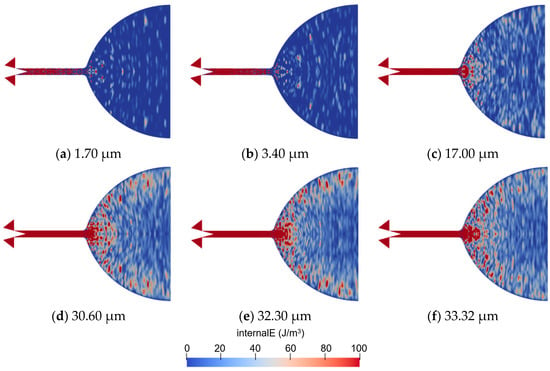
Figure 9.
Molecular internal energy fields in the axial plane with different needle displacements at t = 0.1 ms.
Figure 10 shows the macro temperature field of the gas inside the micro-nozzle. The DSMC calculation results require time-averaged statistics to obtain the macroscopic temperature distribution results. In OpenFOAM, the fieldAverage function object calculates and stores ensemble- or time-based field averages, with optional windowing. It is applicable to all field types, i.e., scalar, vector, tensor, etc. We used 50 DSMC time samples, and the time span across which the average is performed is 2 μs. When the needle valve opening ratio is small, the temperature distribution inside the nozzle is more uniform. With the increase in needle valve displacement, the gas temperature difference between the center and periphery of the nozzle expansion section gradually increased. Obviously, the acceleration of the gas molecules reduces the internal energy in the center of the nozzle expansion. As the needle valve displacement increases to greater than 30.6 μm, the gas temperature in the center of the nozzle drops to about 80 K.
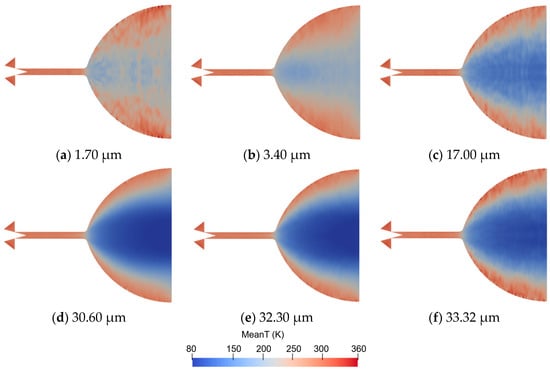
Figure 10.
Time-averaged fluid temperature fields in the axial plane with different needle displacements at t = 0.1 ms.
The results of the macroscopic gas velocity distribution inside the nozzle are given in Figure 11. The acceleration of the nitrogen molecules begins in the region near the exit of the micro channel. When the needle valve displacement is less than 17 μm, the peak velocity in the high velocity gas flow region is low (less than 500 m/s), and the low velocity zone is widely distributed. As the needle valve opening ratio increases, the gas velocity in the nozzle gradually increases.

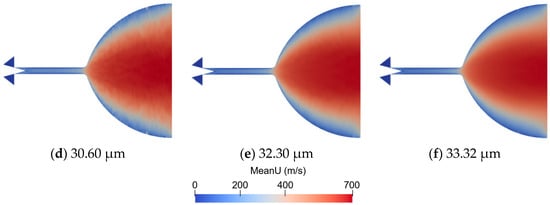
Figure 11.
Time-averaged fluid velocity fields in the axial plane with different needle displacements at t = 0.1 ms.
The mean free path length is the average distance that a molecule travels between collisions, which is an important factor influencing the rarefied degree of fluid. It is determined by the criterion that there is one molecule within the collision tube. The mean free path length can be obtained by the following equation []. To better show the results of the local molecular free path length in the nozzle, the legend color is set as the log distribution function (See Figure 12). There is a significant difference between the molecular free path in the micro-channel versus in the nozzle expansion section. The mean free path length in the nozzle expansion section is significantly larger than that in the micro-channel. The free path length of the molecules near the wall of the nozzle expansion section is significantly larger than in the central region. The average molecular free path in the nozzle at needle valve displacements that are less than 3.4 μm is an order of magnitude higher than the value at large needle valve displacements (greater than 17 μm). The smaller the valve opening, the more significant the throttling effect of the throat is, and the smaller the number of molecules entering the micro-channel and nozzle is, thus expanding the average molecular spacing and increasing the molecular free path length.
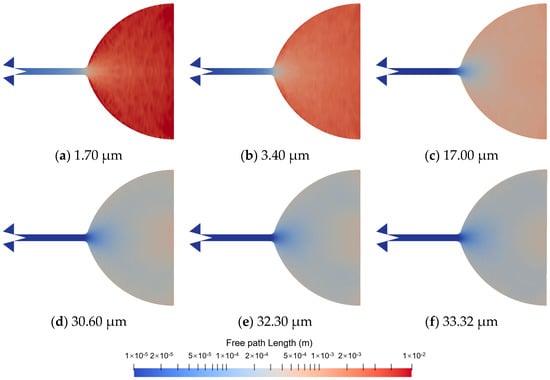
Figure 12.
Local mean molecular free path length in the axial plane with different needle displacements at t = 0.1 ms.
The local value of the Knudsen number (Kn), a dimensionless number defined as the ratio of the molecular mean free path length to a representative physical length scale, determines the degree of rarefaction and the degree of validity of the continuum model in a particular flow. If the Kn number is near or greater than 1.0, the mean free path of a molecule is comparable to a length scale of the problem, and the continuum assumption of fluid mechanics is no longer a good approximation []. The local Knudsen number is defined as Kn = λ/L, where L is expressed as the scale length of the macroscopic gradients, i.e., . The results of the local Kn distribution for different needle valve openings are given in Figure 13. To facilitate the observation of the location of the different values of Kn, ranging from 0.01 to 10 in the contour plot, the legend color takes the form of a logarithmic function. The results show that when the needle valve opening is less than or equal to 10%, i.e., needle displacement of 3.4 μm, the contour line of the local Kn of 0.01 appears in the region near the throat, and a local Kn larger than 0.1 is in the region upstream of the micro-channel. The region between the above two contour lines belongs to the slip flow regime. At all needle valve opening conditions, the no-slip continuous flow marked in blue in Figure 13 is distributed in the valve cavity region upstream of the throat. The gas, filled with dark purple, in the nozzle extension region is in the free molecular flow regime, as the value of the local Kn number is greater than 1 and less than 10. When the needle valve opening ratio exceeds 10%, i.e., the needle displacement is larger than 3.4 μm, the slip continuous flow region occupies almost the entire micro-channel, and the extended nozzle area is in the transition flow state. There is no free molecular flow in the micro-nozzle.
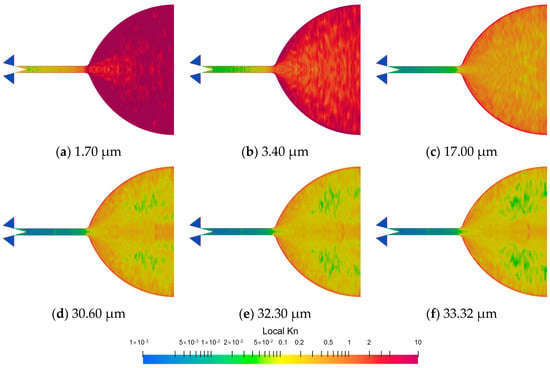
Figure 13.
Local Kn distributions in the axial plane with different needle displacements at t = 0.1 ms. The black area is continuous non-slip flow, and the red area is free molecular flow. The slip flow and transition flow are distributed between the above two regions.
To quantitatively analyze the spatial distribution of the flow regime in the nozzle at different needle valve openings, the local Kn number curves at the nozzle axis are plotted in Figure 14. The horizontal coordinate in the figure is the dimensionless length Lx/D. D is the internal radius of the micro-channel. Lx is the horizontal distance from the valve needle tip. The number of local Kn numbers increases gradually along the nozzle axis toward the outlet boundary. Near the exit of the micro-channel, the rate of increase of the local Kn number is higher than that of other regions. This indicates that the nitrogen molecule expands more rapidly in this region, resulting in an increased mean molecule free path. Combined with the right-side graph, the larger the needle valve opening, the lower the growth rate of the local Kn number (the first order derivative of the local Kn number). As the needle valve opening increases, the partition interface between the slip flow and the transition flow region (Kn = 0.1) then moves down from the approx. 1D position upstream of the micro-channel to the 8D position. In all cases, the flow in the axis of the micronozzle is almost in discontinuous flow only when the needle valve displacement is 1.7 μm. When the needle valve displacement is 3.4 μm, continuous flow develops to 2/3 of the micro-channel length. Continuous flows are developed to the micro-channel outlet with a needle valve displacement greater than 3.4 μm.
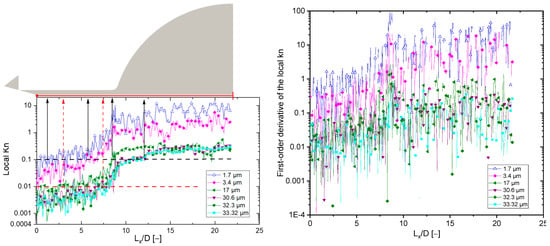
Figure 14.
Local Kn distributions along the axis with different valve opening ratios (Left-side image). First-order derivative of the local Kn number is shown in right-side image. The partition interface between the slip flow and the transition flow region (Kn = 0.1). If Kn is less than 0.01, the nitrogen gas flow is in the continuous flow regime.
Figure 15 shows the macroscopic flow parameters at the axial position of the micro-thruster for different needle valve opening ratios. As the needle valve opening ratio increases, the gas density, pressure, internal energy, and rhoN (i.e., mean molecular number density) in the micro-thruster gradually increases. After the needle valve opening ratio exceeds 95%, the fluid macro parameters remain stable. There are significant fluctuations in the macroscopic gas temperature and velocity values when the needle valve is opened below 10%. This result may be related to the reduction in the number of statistical molecular particles caused by the rarefied flow. When the needle valve opening ratio is less than 10%, the gas exit velocity at the nozzle axis reaches 400 m/s, while the gas exit velocity increases up to 700 m/s as the needle valve opening ratio increased to 90%.
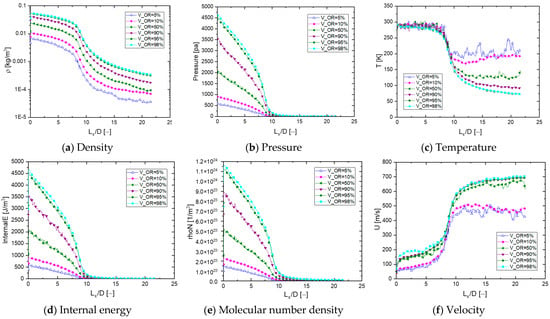
Figure 15.
Macroscopic flow parameters at the axial position of the micro-thruster for different needle valve opening ratios.
4. Conclusions
In this paper, the DSMC method is used to calculate the flow process in the micro-nozzle of the cold gas micro-thruster, and the influence of the nozzle needle valve opening ratio on the flow characteristics is studied. The spatial distribution of the flow regime in the micro-nozzle is discussed.
The flow mechanism inside the micro-nozzle with a large length–diameter ratio is quite complex and exhibits spatial multi-scale characteristics, which can be significantly affected by the needle valve opening ratio. When the needle valve opening ratio is less than 10%, i.e., the needle displacement is less than 3.4 μm, the nitrogen molecules are mainly concentrated in the upstream cavity of the throat by the choke effect. Continuous flows are developed to the micro-channel outlet with the needle valve displacement greater than 3.4 μm. As the needle valve opening increases, the partition interface between the slip flow and the transition flow region (Kn = 0.1) then moves down from the approx. 1D position upstream of the micro-channel to the 8D position, and macroscopic fluid parameters, such as the gas density, pressure, internal energy, and mean molecular number density in the micro-thruster, gradually increase. Significant fluctuations in macroscopic gas temperature and velocity values occur when the needle valve is opened below 10%. In future studies, the effect of the needle valve motion process on the transient flow characteristics inside the micro-nozzle will be investigated.
Author Contributions
Conceptualization, Y.L. and X.W.; methodology, Y.L. and X.W.; software, X.W. and Y.G.; validation, C.G. and W.F.; formal analysis, X.W.; resources, Y.G.; writing—original draft preparation, X.W. and Y.G.; writing—review and editing, X.W. and Y.L.; supervision, Y.L. All authors have read and agreed to the published version of the manuscript.
Funding
This work was supported by fund project: National Key R&D Program of China (2022YFC2001101) and Civil Space Program of Science and Industry Bureau.
Institutional Review Board Statement
Not applicable.
Informed Consent Statement
Not applicable.
Data Availability Statement
Some data, models, or code that support the findings of this study are available from the corresponding author upon reasonable request.
Conflicts of Interest
The authors declare no conflict of interest.
References
- Schleicher, A.; Ziegler, T.; Schubert, R.; Brandt, N.; Bergner, P.; Johann, U.; Fichter, W.; Grzymisch, J. In-orbit performance of the LISA Pathfinder drag-free and attitude control system. CEAS Space J. 2018, 10, 471–485. [Google Scholar] [CrossRef]
- Ranjan, R.; Chou, S.K.; Riaz, F.; Karthikeyan, K. Cold gas micro propulsion development for satellite application. Energy Procedia 2017, 143, 754–761. [Google Scholar] [CrossRef]
- Ketsdever, A.; Mueller, J. Systems considerations and design options for microspacecraft propulsion systems. In Proceedings of the 35th Joint Propulsion Conference and Exhibit, Los Angeles, CA, USA, 20–24 June 1999; p. 2723. [Google Scholar] [CrossRef]
- Chigier, N.; Gemci, T. A review of micro propulsion technology. In Proceedings of the 41st Aerospace Sciences Meeting and Exhibit, Reno, Nevada, 6–9 January 2003; p. 670. [Google Scholar] [CrossRef]
- Köhler, J.; Bejhed, J.; Kratz, H.; Bruhn, F.; Lindberg, U.; Hjort, K.; Stenmark, L. A hybrid cold gas microthruster system for spacecraft. Sens. Actuators A Phys. 2002, 97, 587–598. [Google Scholar] [CrossRef]
- Fratantonio, D.; Rojas-Cardenas, M.; Si Hadj Mohand, H.; Barrot, C.; Baldas, L.; Colin, S. Velocity measurements in channel gas flows in the slip regime by means of molecular tagging velocimetry. Micromachines 2018, 11, 374. [Google Scholar] [CrossRef]
- Silva, E.; Deschamps, C.J.; Rojas-Cardenas, M.; Barrot, C.; Baldas, L.; Colin, S. A time-dependent method for the measurement of mass flow rate of gases in microchannels. Int. J. Heat Mass Transf. 2018, 120, 422–434. [Google Scholar] [CrossRef]
- Rothe, D.E. Electron-beam studies of viscous flow in supersonic nozzles. AIAA J. 1971, 9, 804–811. [Google Scholar] [CrossRef]
- Xie, C. Characteristics of micronozzle gas flows. Phys. Fluids 2007, 19, 037102. [Google Scholar] [CrossRef]
- Bird, G.A. Approach to translational equilibrium in a rigid sphere gas. PhyFluids 1963, 6, 1518–1519. [Google Scholar] [CrossRef]
- Darbandi, M.; Roohi, E. Study of subsonic–supersonic gas flow through micro/nano scale nozzles using unstructured DSMC solver. Microfluid. Nanofluid 2011, 10, 321–335. [Google Scholar] [CrossRef]
- Shang, Z.; Chen, S. 3D DSMC simulation of rarefied gas flows around a space crew capsule using OpenFOAM. Open J. Appl. Sci. 2013, 3, 35–38. [Google Scholar] [CrossRef]
- Sebastiao, I.B.; Santos, W.F.N. Impact of surface discontinuities on flowfield structure of a micro nozzle array. Nanoscale Microscale Thermophys. Eng. 2015, 18, 54–79. [Google Scholar] [CrossRef]
- Zelesnik, D.; Micci, M.; Long, L. DSMC simulation of low Reynolds number nozzle flows. In Proceedings of the 29th Joint Propulsion Conference and Exhibit, Monterey, CA, USA, 28–30 June 1993; p. 2490. [Google Scholar] [CrossRef]
- Bayt, R.L.; Breuer, K.S. Viscous effects in supersonic MEMS-fabricated micronozzles. In Proceedings of the ASME International Mechanical Engineering Congress and Exposition. American Society of Mechanical Engineers, Anaheim, CA, USA, 15–20 November 1998; Volume 15960, pp. 117–123. [Google Scholar] [CrossRef]
- Rossi, C.; Do Conto, T.; Esteve, D.; Larangot, B. Design, fabrication and modelling of MEMS-based microthrusters for space application. Smart Mater. Struct. 2001, 10, 1156. [Google Scholar] [CrossRef]
- Louisos, W.; Hitt, D. Optimal expansion angle for viscous supersonic flow in 2-D micro-nozzles. In Proceedings of the 35th AIAA Fluid Dynamics Conference and Exhibit, Toronto, ON, Canada, 6–9 June 2005; p. 5032. [Google Scholar] [CrossRef]
- Rosa, P.; Karayiannis, T.G.; Collins, M.W. Single-phase heat transfer in microchannels: The importance of scaling effects. Appl. Therm. Eng. 2009, 29, 3447–3468. [Google Scholar] [CrossRef]
- Le, N.T.P.; Roohi, E.; Tran, T.N. Comprehensive assessment of newly developed slip-jump boundary conditions in high-speed rarefied gas flow simulations. Aerosp. Sci. Technol. 2019, 91, 656–668. [Google Scholar] [CrossRef]
- Michalis, V.K.; Kalarakis, A.N.; Skouras, E.D.; Burganos, V.N. Rarefaction effects on gas viscosity in the Knudsen transition regime. Microfluid. Nanofluidics 2010, 9, 847–853. [Google Scholar] [CrossRef]
- Varade, V.; Duryodhan, V.S.; Agrawal, A.; Pradeep, A.; Ebrahimi, A.; Roohi, E. Low Mach number slip flow through diverging microchannel. Comput. Fluids 2015, 111, 46–61. [Google Scholar] [CrossRef]
- Renksizbulut, M.; Niazmand, H.; Tercan, G. Slip-flow and heat transfer in rectangular microchannels with constant wall temperature. Int. J. Therm. Sci. 2006, 45, 870–881. [Google Scholar] [CrossRef]
- Kandlikar, S.G.; Joshi, S.; Tian, S. Effect of surface roughness on heat transfer and fluid flow characteristics at low Reynolds numbers in small diameter tubes. Heat Transf. Eng. 2003, 24, 4–16. [Google Scholar] [CrossRef]
- Shams, M.; Khadem, M.H.; Hossainpour, S. Direct simulation of roughness effects on rarefied and compressible flow at slip flow regime. Int. Commun. Heat Mass Transf. 2009, 36, 88–95. [Google Scholar] [CrossRef]
- Alexeenko, A.A.; Fedosov, D.A.; Gimelshein, S.F.; Levin, D.; Collins, R. Transient heat transfer and gas flow in a MEMS-based thruster. J. Microelectromech. Syst. 2006, 15, 181–194. [Google Scholar] [CrossRef]
- Hameed, A.H.; Kafafy, R.; Asrar, W.; Idres, M. Two-dimensional flow properties of micronozzle under varied isothermal wall conditions. Int. J. Eng. Syst. Model. Simul. 2013, 5, 174–180. [Google Scholar] [CrossRef]
- Spazzini, P.G.; Fallerini, L. Performance analysis of a microthruster for satellite applications. Measurement 2019, 131, 782–786. [Google Scholar] [CrossRef]
- Darbandi, M.; Roohi, E. Applying a hybrid DSMC/Navier–Stokes frame to explore the effect of splitter catalyst plates in micro/nanopropulsion systems. Sens. Actuators A Phys. 2013, 189, 409–419. [Google Scholar] [CrossRef]
- Li, Z.H.; Fang, M.; Jiang, X.Y.; Wu, J. Convergence proof of the DSMC method and the gas-kinetic unified algorithm for the Boltzmann equation. Sci. China Phys. Mech. Astron. 2013, 56, 404–417. [Google Scholar] [CrossRef]
- Bird, G.A. Recent advances and current challenges for DSMC. Comput. Math. Appl. 1998, 35, 1–14. [Google Scholar] [CrossRef]
- Bird, G.A. Molecular Gas Dynamics and the Direct Simulation of Gas Flows Oxford; Clarendon Press: Oxford, UK, 1994; p. 199. [Google Scholar] [CrossRef]
- Bird, G.A. The DSMC Method; CreateSpace Independent Publishing Platform: California, CA, USA, 2013. [Google Scholar]
- Bird, G.A. Molecular Gas Dynamics; Clarendon Press: Oxford, UK, 1976. [Google Scholar] [CrossRef]
- Padilla, J.F.; Boyd, I.D. Assessment of gas-surface interaction models for computation of rarefied hypersonic flow. J. Thermophys. Heat Transf. 2009, 23, 96–105. [Google Scholar] [CrossRef]
- Maxwell, J.C. On stresses on rarefied gases arising from inequalities of temperature. Philos. Trans. R. Soc. Lond. 1965, 170, 231–256. [Google Scholar] [CrossRef]
- Cercignani, C.; Lampis, M. Kinetic models for gas-surface interactions. Transp. Theory Stat. Phys. 1971, 1, 101–114. [Google Scholar] [CrossRef]
- Zakeri, M.; Roohi, E. Flow and thermal field investigation of rarefied gas in a trapezoidal micro/nano-cavity using DSMC. Int. J. Mod. Phys. C 2021, 32, 2150162. [Google Scholar] [CrossRef]
- Jennings, S.G. The mean free path in air. J. Aerosol Sci. 1988, 19, 159–166. [Google Scholar] [CrossRef]
- Maxa, J.; Bílek, V.; Hlavatá, P.; Vyroubal, P.; Lepltová, K. Comparisons using methods of continuum mechanics and Monte Carlo at differentially pumped chamber. Adv. Mil. Technol. 2016, 11, 143–150. [Google Scholar] [CrossRef]
Disclaimer/Publisher’s Note: The statements, opinions and data contained in all publications are solely those of the individual author(s) and contributor(s) and not of MDPI and/or the editor(s). MDPI and/or the editor(s) disclaim responsibility for any injury to people or property resulting from any ideas, methods, instructions or products referred to in the content. |
© 2023 by the authors. Licensee MDPI, Basel, Switzerland. This article is an open access article distributed under the terms and conditions of the Creative Commons Attribution (CC BY) license (https://creativecommons.org/licenses/by/4.0/).