Abstract
In order to reduce the dependence on fossil fuels, the concept of distributed electric propulsion (DEP) has been introduced. At present, there are a few studies on the small electric propulsion engines of DEP vertical take-off and landing (VTOL) UAVs. According to the design requirements of DEP VTOL UAV ducted fans, the aerodynamic design of a ducted fan is carried out in this paper. Firstly, the initial model is established by referring to theoretical derivations. Then, Bezier curves are used to control the mid-arc and thickness distributions of the blade profiles at different blade heights in order to realize the parameterization as design variables. Finally, the objective function that can represent the performance of the rotor is selected, and a multi-objective genetic algorithm is used to optimize the performance. The optimal results are obtained, and the aerodynamic characteristics are analyzed. Compared with the initial model, the total pressure ratio and isentropic efficiency of the optimized model are increased by 5.3% and 7.8%, respectively, reaching 1.20 and 90.37%. Meanwhile, the aerodynamic performance of the optimized model is improved, indicating that the performance of the rotor is significantly enhanced and that the design task is completed.
1. Introduction
In recent years, our society has put forward ecological requirements for the aircraft industry [1,2]. In the quest to reduce the dependence on fossil fuels, hybrid electric and full-electric propulsion systems are gaining increasing importance in the aircraft industry [3,4]. The characteristics of modern aircraft propulsion systems have moved away from combustion engines toward electric motors. With the generation and development of electric aircraft, the concept of distributed electric propulsion (DEP) UAVs has been introduced. DEP has three potential aerodynamic advantages: installed drag reduction, high lift augmentation and swirl cancellation [5]. Electricity is used to drive multiple thrusters via a distributed electric propulsion system, which is the aircraft’s power plant. To date, there have been many studies on equipping light aircraft with electric engines [6], but electric propulsion for small aviation aircraft is an emerging area. Brelje and Martins [7] introduced the classification of electric aircraft and summarized the concept by outlining the electrical components and propulsion architecture.
Currently, the German “Lily” UAV, the U.S. DARPA-supported XV-24 “Lightning Strike” aircraft and NASA’s X-57 “Maxwell” and GL-10 experimental aircraft are the representatives of DEP UAVs. Before the X experimental aircraft was officially named, NASA conducted a ground validation study on the wing leading edge asynchronous propeller propulsion technology (LEAPTech), and the results showed that the distributed propellers could significantly increase the inlet velocity and dynamic pressure of the wing surface [8]. The XV-24 “Lightning Strike” and NASA GL-10 UAVs also fall under the category of DEP VTOL aircraft. The XV-24 “Lightning Strike” features a total of 24 ducted fans between the upper and lower surfaces of the wings and canards, and they are designed for vertical take-off and landing with a high cruising speed capability [9]. The GL-10 aircraft is equipped with 10 propellers, 8 of which are located on the leading edge of the inclined wing and 2 on the horizontal stabilizer, suitable for hover, transition and forward flight modes [10]. Unlike conventional general aviation configurations, the Lilium jet features a total of 32 electrically powered ducted fans on both the canard and wings. Since the ducted fans are embedded in the wings, the need for a dedicated cabin is eliminated, reducing weight and minimizing aerodynamic drag loss [11].
An electric propulsion system can satisfy VTOL, hover and cruise flight modes by using ducted fans or propellers, while the size and operation designs can make the best of the synergistic action of aerodynamic propulsion, providing a higher aerodynamic performance. In addition, the thrust of a UAV can be directly controlled by the distributed propulsion system to reduce the aircraft’s dependence on the tail and steering surface, and the synergy of multiple thrusters can reliably support the thrust [12,13,14]. Compared with traditional fuel aircraft, a DEP aircraft has a higher aerodynamic efficiency and is more environmentally friendly [12]. Currently, propeller and ducted fan propulsion systems are common in distributed VTOL UAVs. Compared with open propeller engines, electric propulsion ducted fan engines have advantages at higher cruising speeds. A rotor engine with a shroud is more easily embedded into the aircraft fuselage, allowing designers to place the engine in a more favorable position for the aircraft. Additionally, ducted fans can be designed to be compact, saving space and energy consumption due to engine weight. In contrast to propellers, the shroud of a ducted fan reduces the noise pollution caused by rotor rotation, and integrating the engine into the fuselage enhances this noise reduction. At present, ducted fans are popular applications in DEP VTOL UAVs, and they can create considerable additional tension in the flow field of the propeller and sharply improve the efficiency of the power system [15,16,17].
We may need a higher cruising speed for design purposes. The target thrust of a single ducted fan is within about 1000 N. Many studies have been conducted on large multi-stage engines at home and abroad [18]. However, compared with larger engines, smaller engines show more obvious three-dimensional flow features, and smaller engines have fewer stages, so the results may not be directly applicable to smaller engines through simple scaling. Recently, a few studies have focused on the optimal design of the ducted fans in DEP UAVs. According to the design requirements of DEP VTOL UAV ducted fans, this paper is devoted to developing an aerodynamic design of a fan and to optimizing its blades. A ducted fan for small integrated propulsion systems is made, and it has a compact design with a low-flow cross-section and high performance. Firstly, the initial model is created according to the theory and is gridded, and a computational fluid dynamics simulation is carried out. Then, the blade profiles at different blade heights are parameterized as design variables using Bezier curves, which are used to control the arc and thickness distributions of the blade profiles. Finally, the objective function that can represent the performance of the ducted fan is selected, and a multi-objective genetic algorithm is applied to optimize the performance. On the basis of the optimization results, the aerodynamic characteristics are analyzed, and the fan is found to meet the design requirements.
2. Initial Rotor Design
2.1. Initial Model Building
The DEP UAV studied in this paper is equipped with a motor that drives a ducted fan to generate thrust. Under the constraints of the thrust and motor performance of the given UAV, the fan with the smallest radial size possible should be selected to reduce the weight. The final design parameters selected for the ducted fan are shown in Table 1.

Table 1.
Initial rotor design parameters.
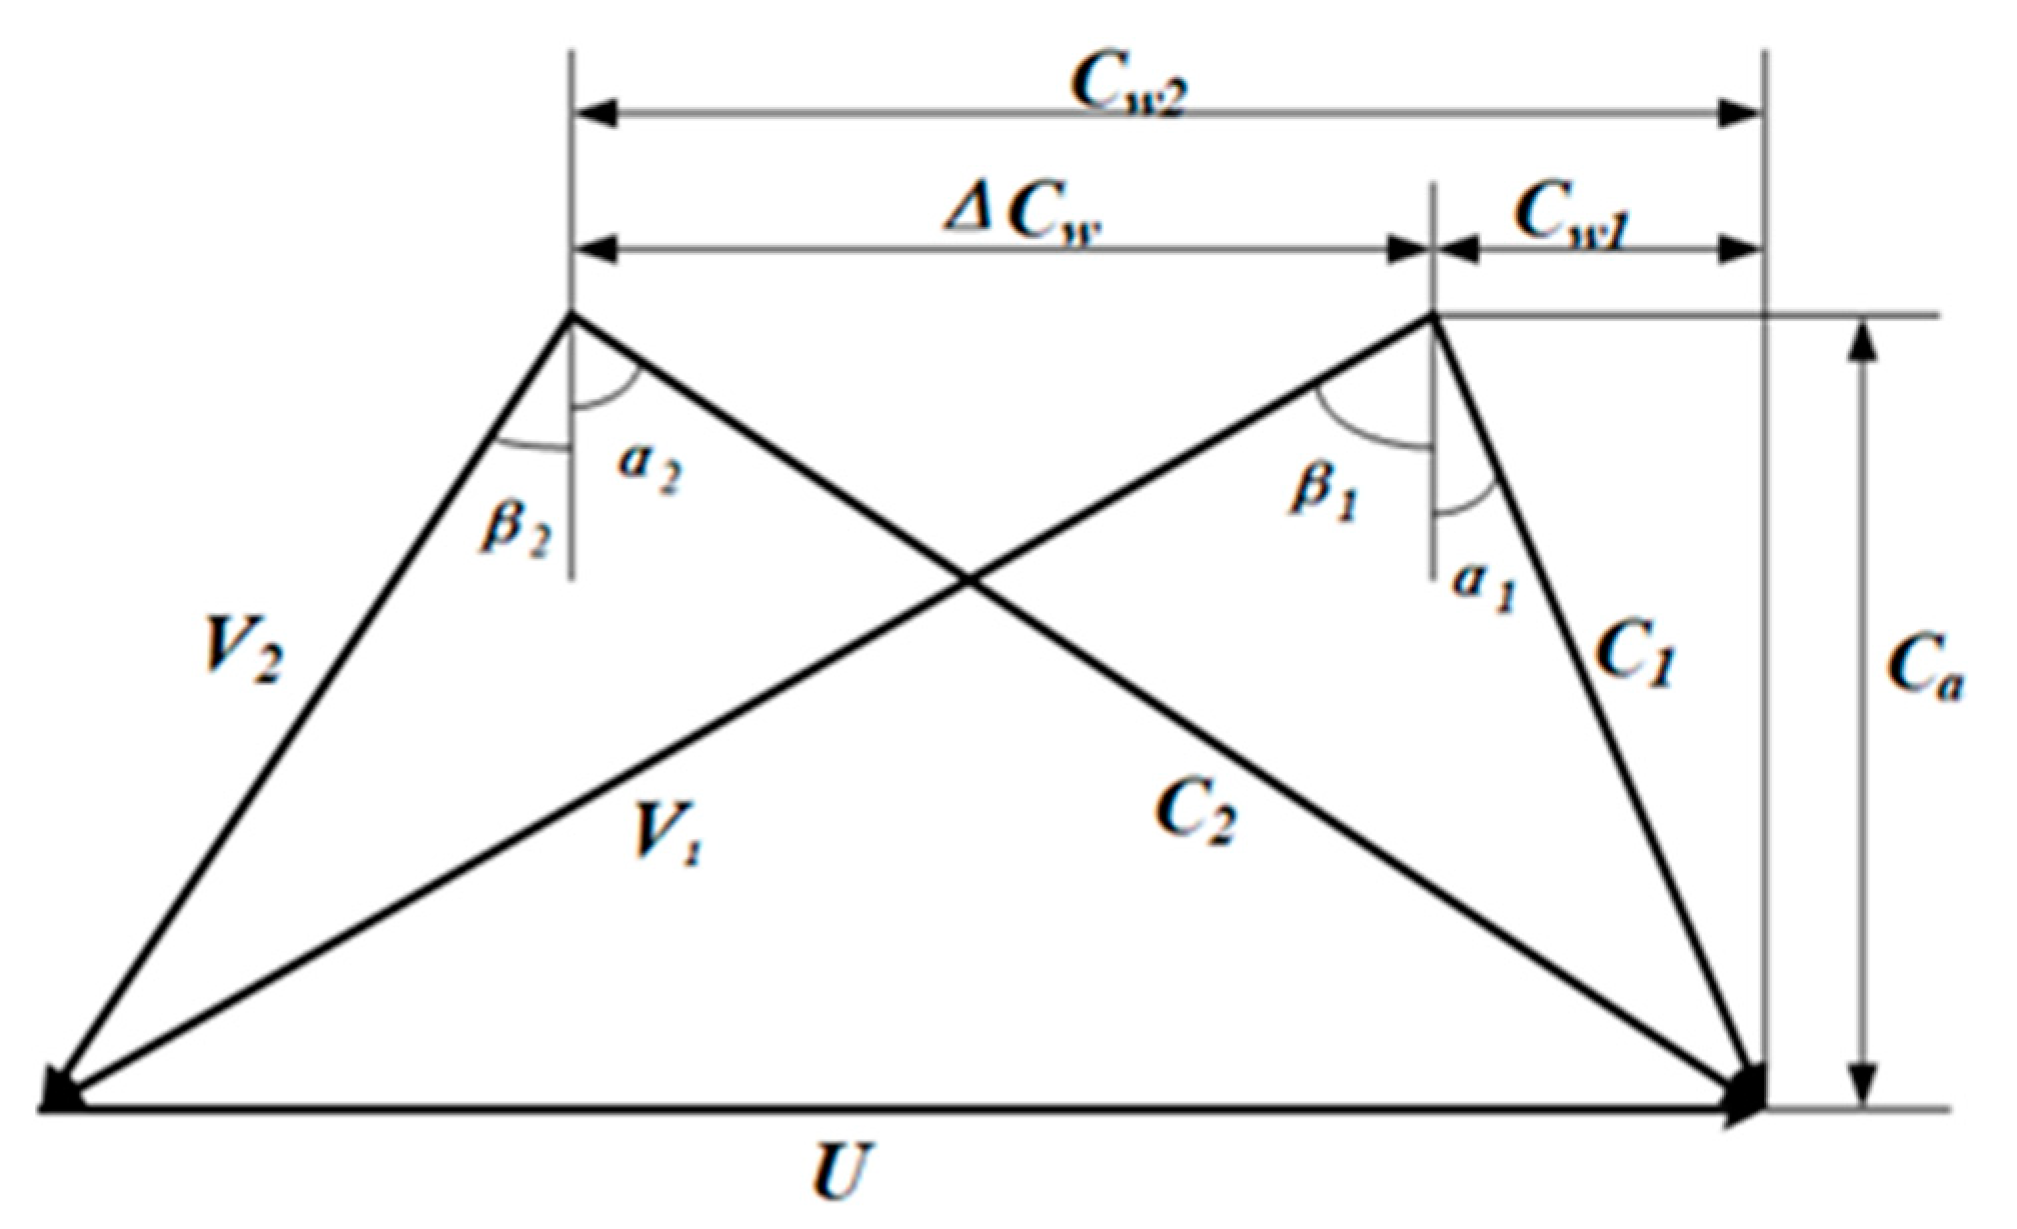
In ducted fans [19], the total temperature, total pressure and static pressure of the fluid are increased by rotation. During this process, air enters the compressor axially and is deflected to match the rotor inlet. The air approaches the rotor with a velocity C1 that is at an angle α1 from the axial direction. Combining C1 with the blade velocity U gives the velocity relative to the blade V1 at the inlet blade angle β1 from the axial direction. After passing through the rotor, the absolute velocity of the air is increased, and the fluid leaves the rotor at the relative velocity V2 of the outlet blade angle. Assuming that the axial velocity Ca remains constant in the design, the value of V2 can be obtained. The outlet velocity triangle is constructed by V2 and U and then by obtaining C2 at outlet air angle α2. The following basic equations are derived from the velocity triangle (Figure 1):
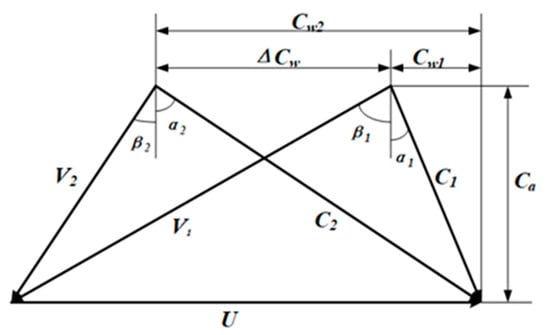
Figure 1.
Velocity triangle.
The diffusion factor [19] is a dimensionless number that measures the load on the blade and that ensures that airflow separation does not occur across the passages, thus preventing stall.
ϭ is the consistency, which is equal to the blade chord length/blade pitch.
The flow coefficient is defined as follows:
When maintaining the blade speed, an increase in the flow coefficient results in an increase in the inlet blade angle β1. The recommended typical value of the flow coefficient is between 0.3 and 0.6.
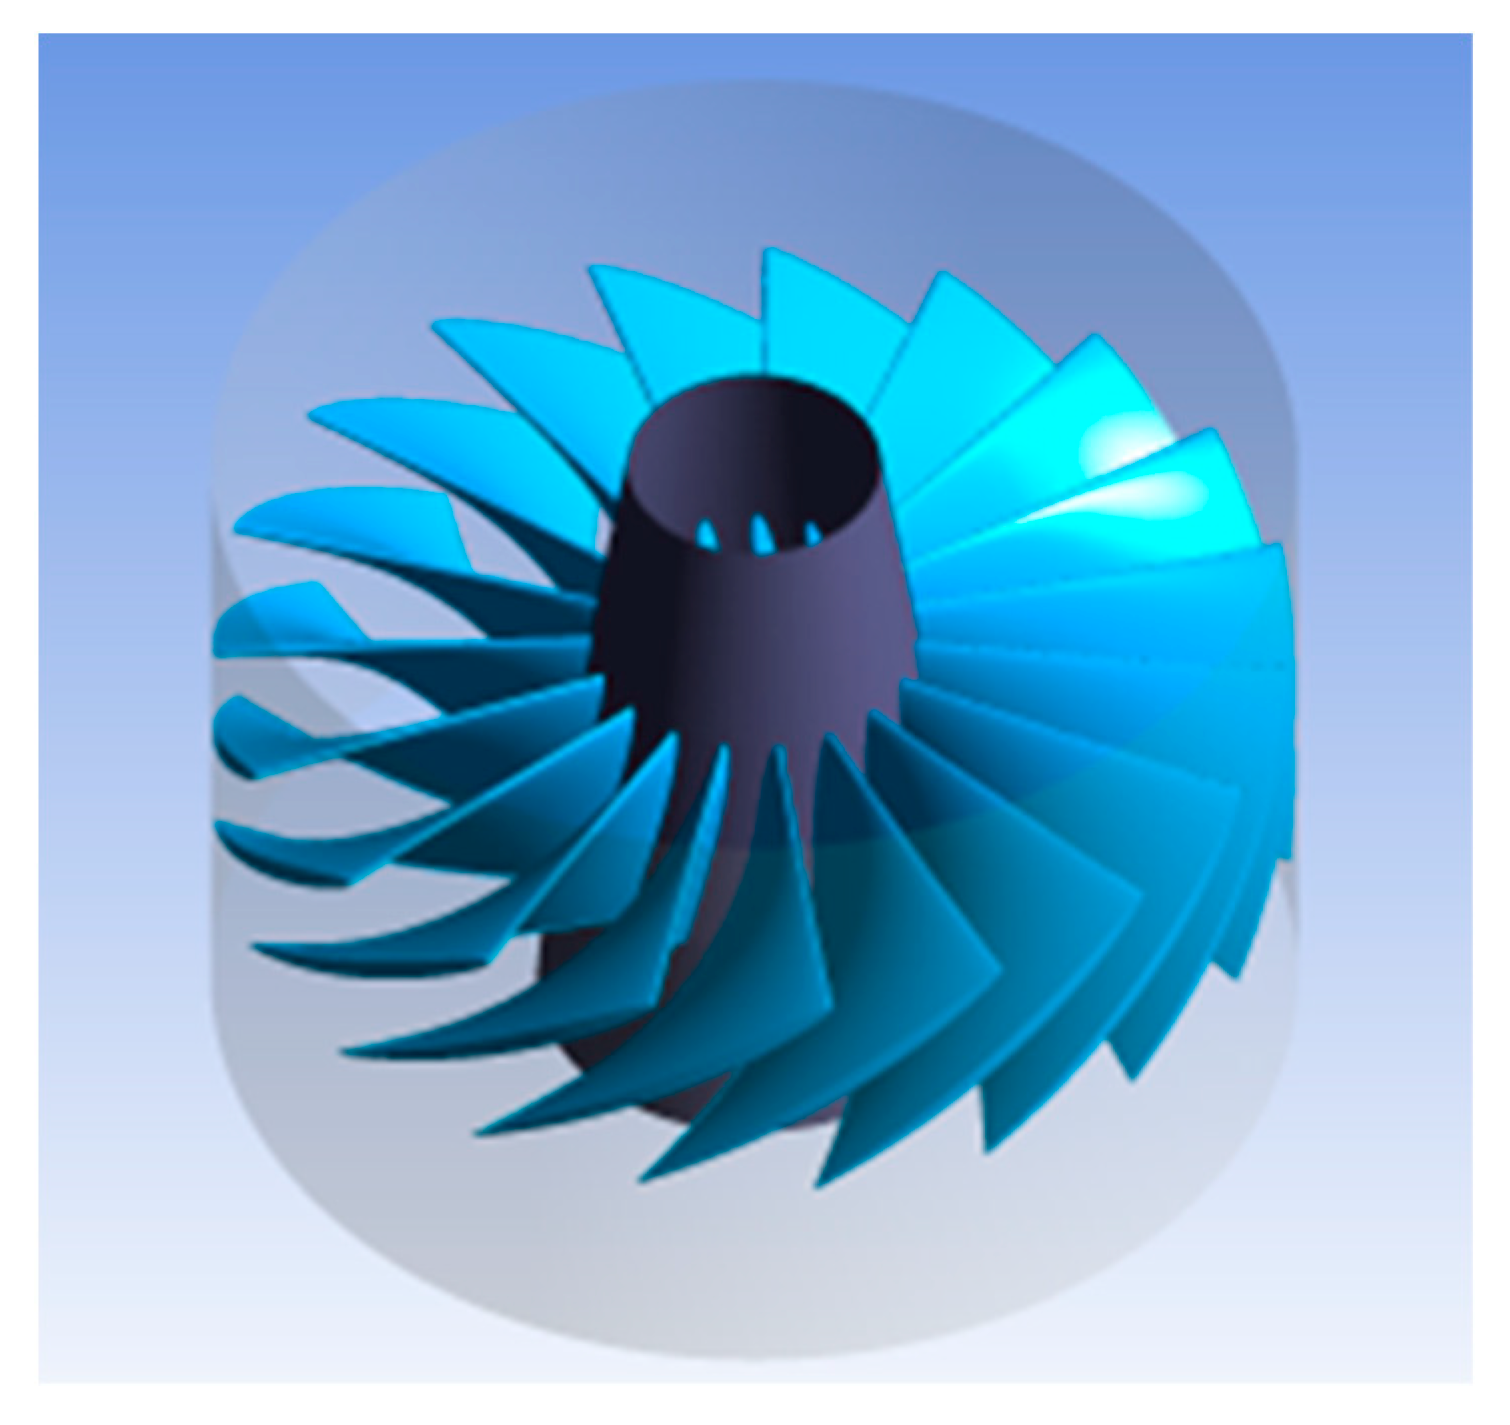
In the initial design of the rotor (Figure 2), the goal is to make the initial model reasonably geometric. Obvious blockage and separation do not exist, and all parameters are reasonably within the range of the theoretical values.
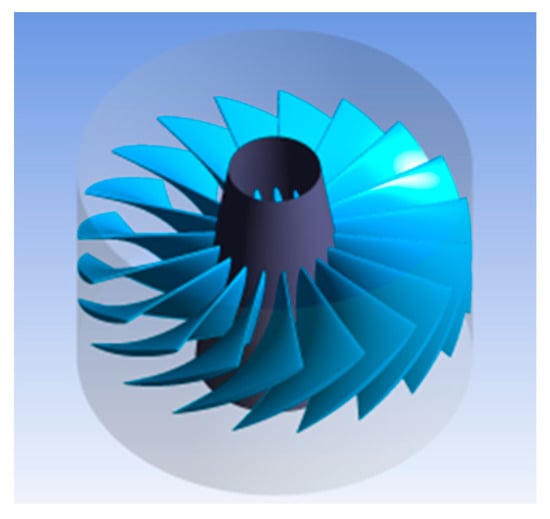
Figure 2.
Initial rotor.
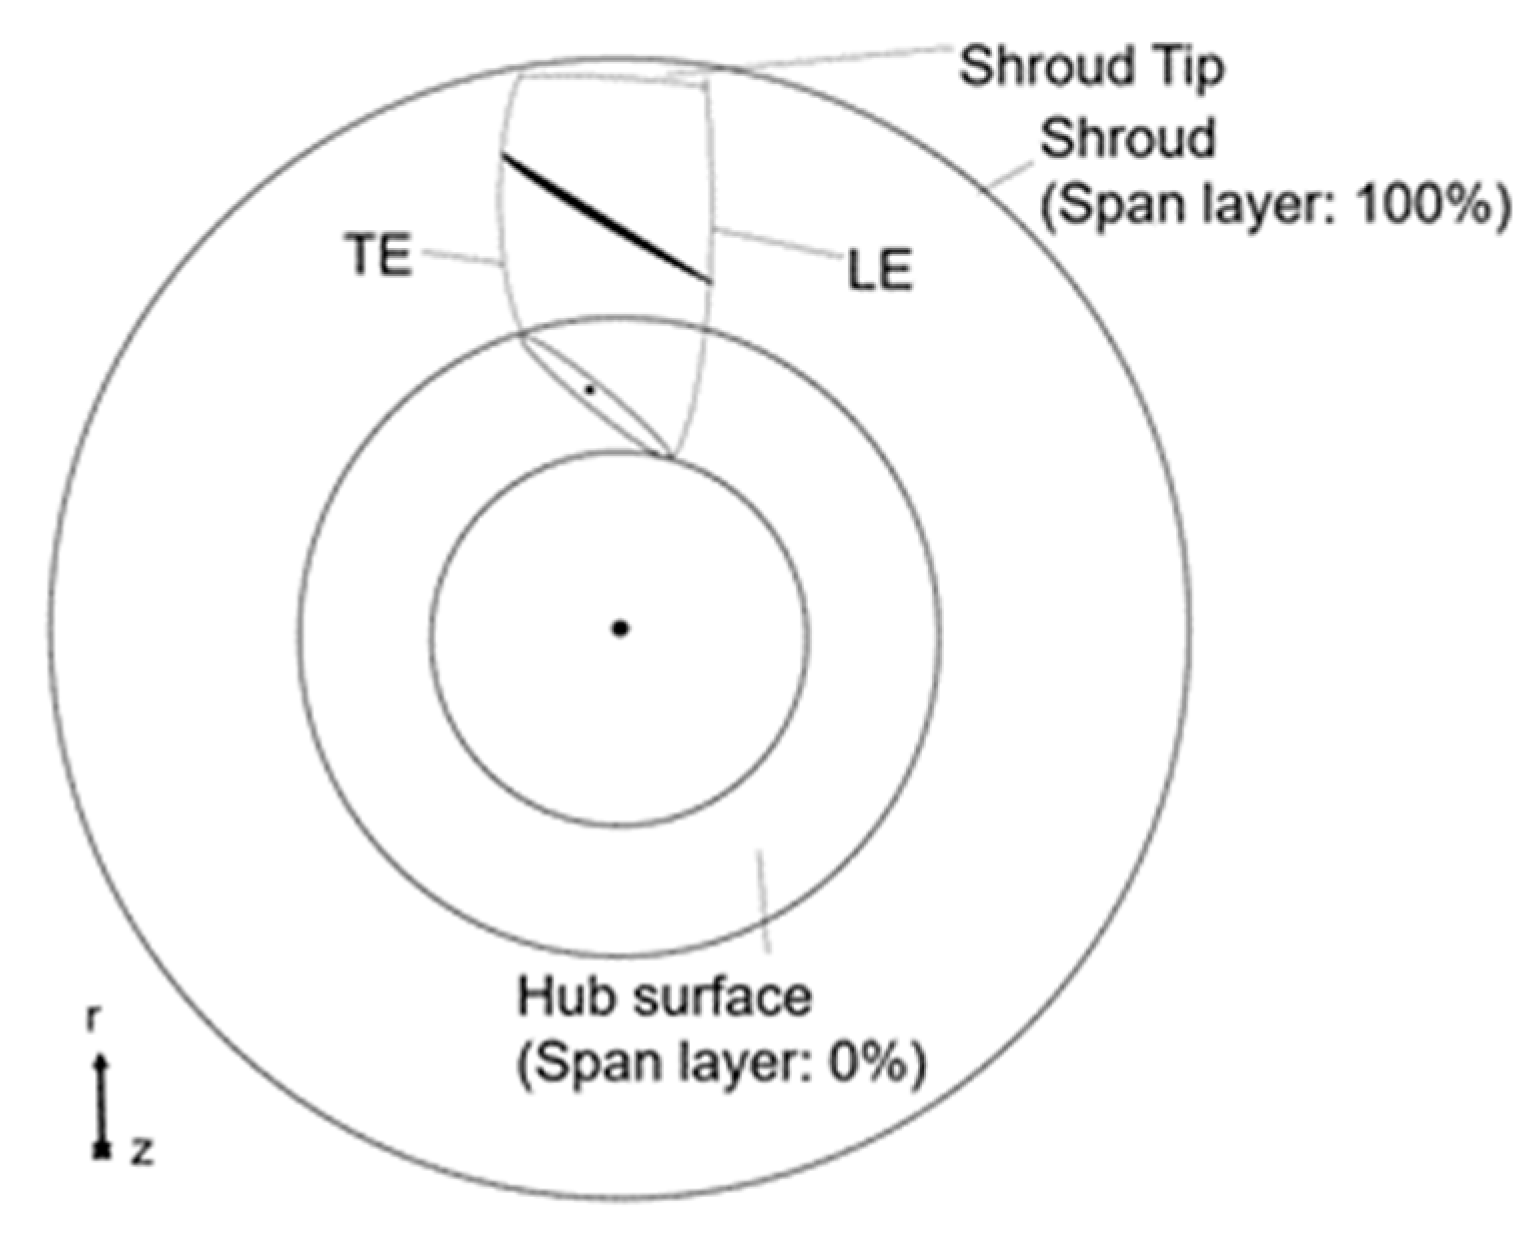
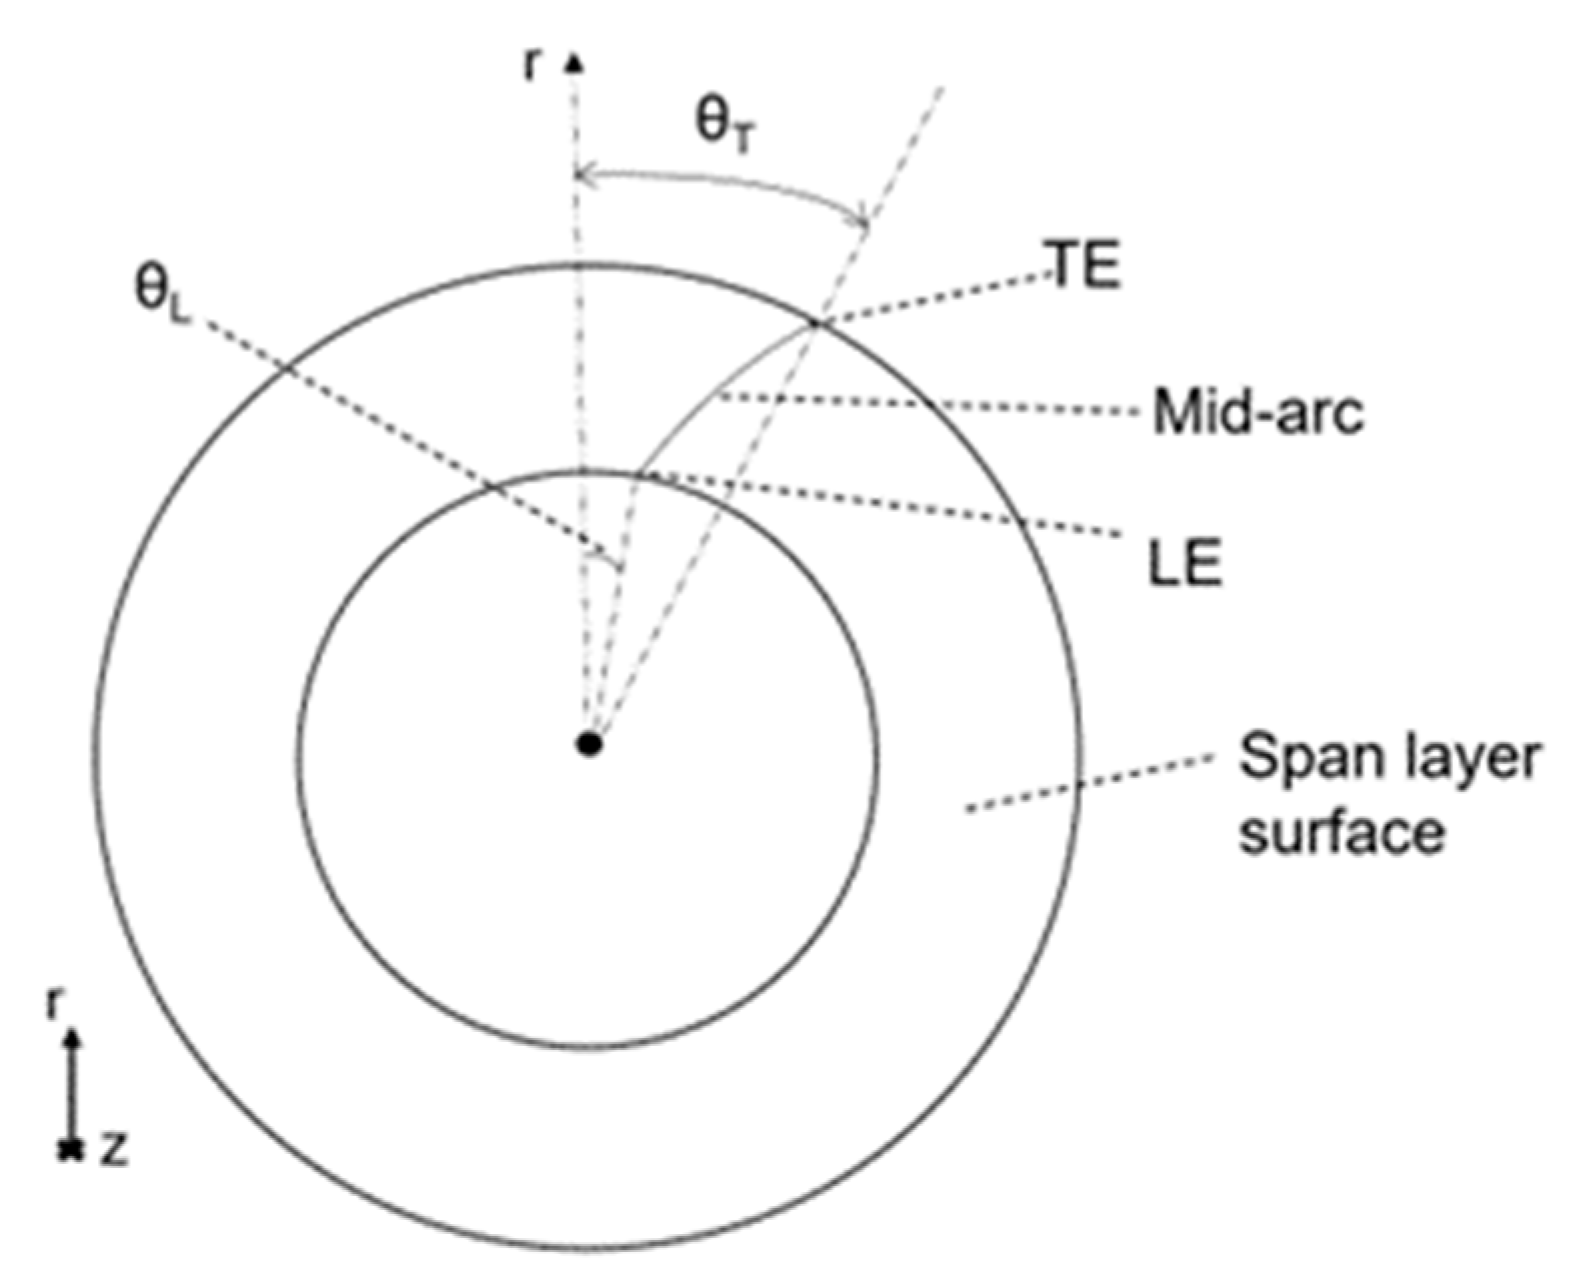
Assuming that the axial flow velocity is 80 m/s since the inlet airflow angle is α1 = 0°, according to formula (1), the inlet blade angle is β1 = 20°. V1 = 243.5 m/s, V2 ≈ 175.3 m/s and β2 = 60° are all calculated from the velocity triangle theory. At this time, DF ≈ 0.42, and ψ ≈ 0.35. According to the above theoretical calculation results, the geometric design of the initial model is shown in Table 2. The three-dimensional blade is generated via interpolation between the blade profiles at different spans (Figure 3). The thickness distribution is superimposed on the mid-arc to create a blade profile (Figure 4). In order to reduce the number of design parameters and ensure the rationality of the thickness distribution, the initial model adopts a consistent NACA thickness distribution.

Table 2.
Geometrical design parameters of the initial rotor.
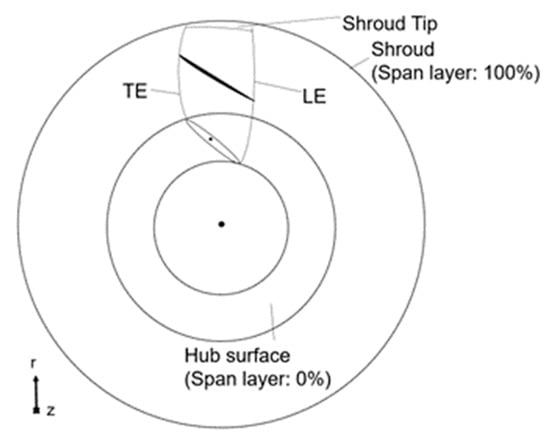
Figure 3.
Front view of the three-dimensional blade.
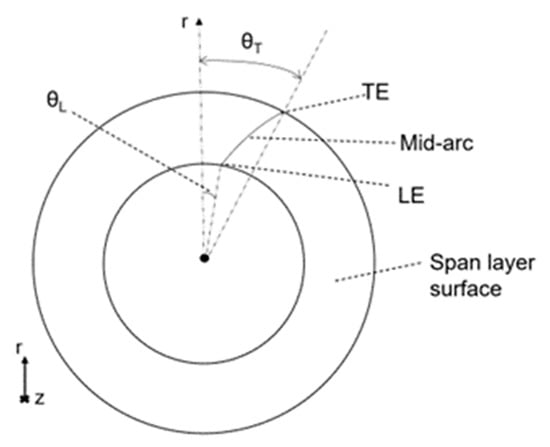
Figure 4.
Curved mid-arc.
The total pressure ratio (Rs) is the ratio of the total pressure at the compressor outlet to the inlet, indicating the pressurization capacity of the compressor. The isentropic efficiency (ηis) is the ratio of the entropy of the theoretical compression to the actual compression. The closer the actual process to the isentropic efficiency, the higher the system efficiency. The total pressure ratio and the isentropic efficiency are important parameters that measure rotor performance. As the total pressure and total temperature at the inlet are set to P01 = 101,325 Pa (1 atm) and T01 = 288 K, respectively, ΔT0s ≈ 38 K is obtained from formula (9), where ΔT0s = T02 − T01, Cp = 1004.5 J/(kg·K), and U is the blade tip velocity. Then, according to the ideal gas state equation, P02 = 112,274 Pa, and, finally, the total pressure ratio is 1.1 theoretically. With reference to the theoretical values and application [20], the isentropic efficiency is 90%, as expected.
2.2. Numerical Simulation and Results
Structured grids, including C, O and H grids, are generally used in the numerical simulation of turbomachines: C grids are commonly used near the leading edge with large shape changes, O grids can better deal with the grids near the front and back edges, and H grids have good orthogonality and are often divided into passage inlet and outlet grids. The combination of these three structured grids can achieve a better mesh quality. In this numerical simulation, high-quality grids are generated quickly and automatically. In addition, the quality of the generated grids is evaluated mainly based on the minimum volume, the maximum or minimum face angles and the edge length ratio. The minimum volume is used to ensure that no negative volumes are created within the passage. The maximum and minimum face angles are the greatest and smallest face angles of all the faces that touch the node, respectively. For each face, the angle between the two edges of the face that touch the node is calculated. If possible, these should be improved until they fall within the constraints of a minimum of 15° and a maximum of 165°. Values close to but just outside the constraints may still be acceptable for the simulation. The edge length ratio is a ratio of the longest edge of a face divided by the shortest edge of the face. Values close to 100 are normally acceptable.
In the three-dimensional meshing of the initial model, the minimum volume is 2.1 × 10⁻¹³; the maximum and minimum face angles are 164° and 27°, respectively; and the edge length ratio is 134, which means that the mesh quality meets the requirements. The total nodes and the total elements of the mesh are 192,292 and 175,487, respectively. A numerical simulation is run on the rotor; the boundary conditions of the inlet are the total pressure and the total temperature, and the boundary condition of the outlet is the mass flow rate. The turbulence model adopts k-epsilon, the total energy is applied as the energy model, the wall is set to be an adiabatic smooth boundary with no slip, and the convergence residual is set to an RSM of less than 10−4.
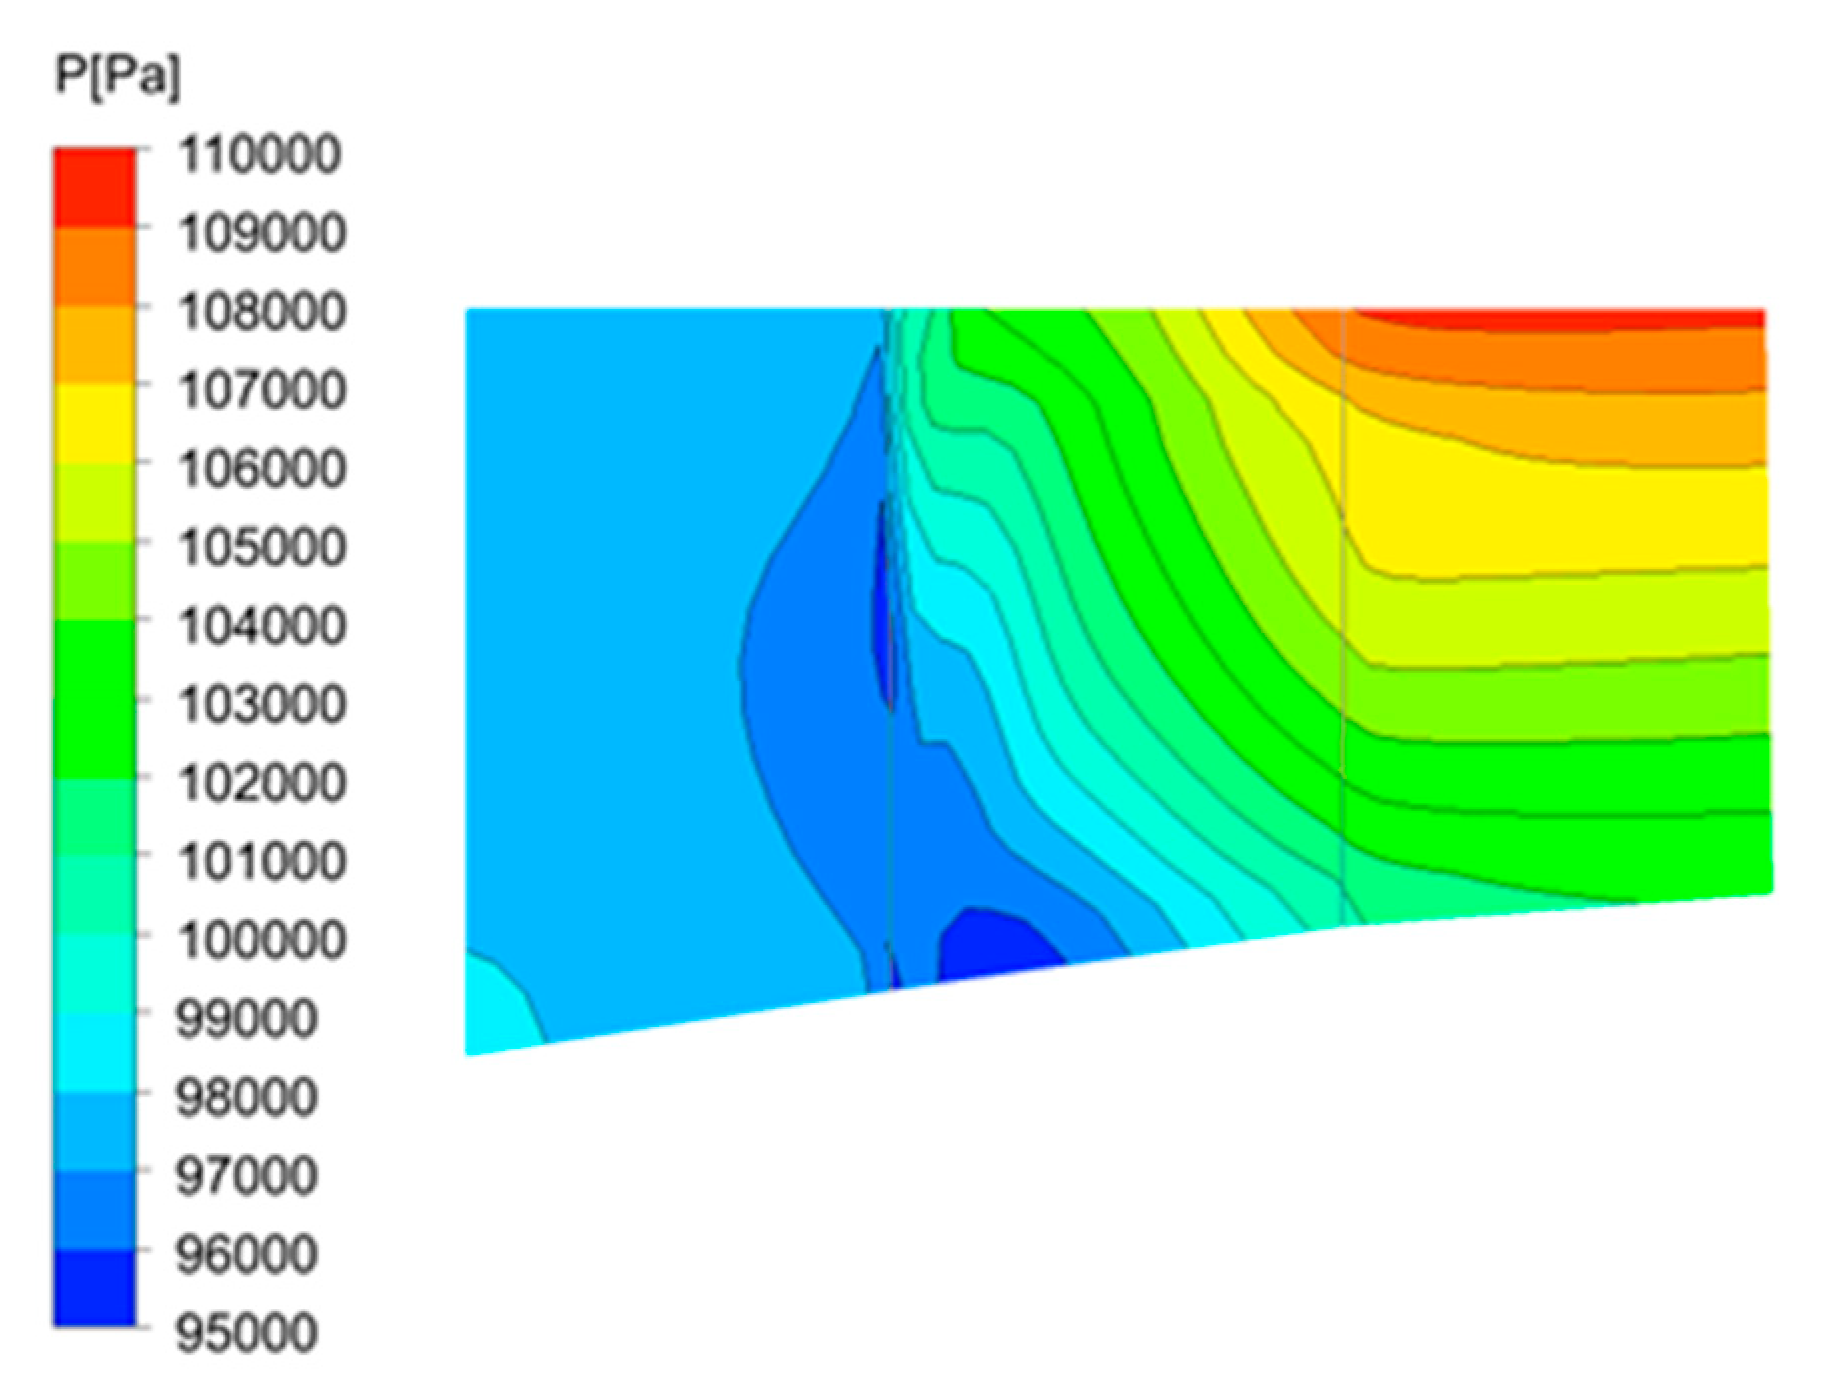
According to the numerical results of the initial model, it can be seen in Table 3 that the total pressure ratio is 1.14 and that the isentropic efficiency is 83.8% at the design point. Figure 5 presents the Mach number distribution of the initial model, which has no obvious separation or clogging, and the blade profile is relatively reasonable. Figure 6 shows that the static pressure increases uniformly from the inlet to the outlet, indicating that the aerodynamic performance of the rotor is better. Based on the above analysis, the performance of the initial model is in line with expectations, but the efficiency is low, which needs to be optimized and improved.

Table 3.
Performance of the initial model.

Figure 5.
Mach number contours at 20% (a), 50% (b) and 80% (c) spans.
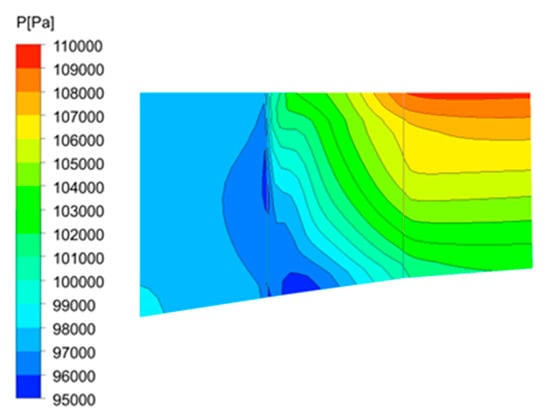
Figure 6.
Static pressure P contour of meridional channel.
3. Blade Aerodynamic Optimization
3.1. Blade Parameterization
One of the critical steps in the optimal design process is to choose an efficient method to parametrically describe the blade geometry [21]. In this paper, the blade model is defined by data points distributed over a number of constant radius layers, spanning from 0% at the hub to 100% at the shroud, and the geometric characteristics are specified at each spanwise layer, including θ for controlling the shape of the mid-arc of the blade profile and the thickness distribution. The three-dimensional blade is generated via interpolation between the span layers.
The initial model is established in the r-z-θ cylindrical coordinate system, where r is the blade height direction, z is the axial direction, and θ is the azimuth angle. The blade profiles from the r-z-θ coordinate system are mapped to the two-dimensional space of m-θ. Based on the formulas below, we can define a two-dimensional space with m along the horizontal axis and θ along the vertical axis. Then, the flow surface in the r-z-θ coordinate system is mapped into the m-θ space, and then a 2D curve is flattened and unrolled.
At each span layer (Figure 7), the blade profile is created in the m-θ coordinate system to specify a set of points (m, θ) that represent the mid-arc of the blade profile at that span layer. Furthermore, the thickness distribution is superimposed on the mid-arc to create a complete blade profile, fitted by a set of points (m, thickness), and “thickness” specifies the thickness distribution value on the m-axis. A standard NACA 0008 thickness distribution is used for all the span layers of the initial model in this paper.

Figure 7.
The control layer of the blade.
It is hoped that a blade profile with a reasonable performance and multiple geometric shapes can be determined with few design parameters. For convenience, the blade is defined by the data points at the 0%, 50% and 100% span layers of the blade, and the mid-arc and thickness distribution curves of the blade profiles are fitted using the cubic Bezier curve [21] with four control points so as to ensure that the curves are smooth and free of discontinuities. Each layer has four control points from the leading edge to the trailing edge numbered 1 to 4.
Due to the good performance of the initial rotor, in order to reduce the calculation time and design parameters, the θ of the leading and trailing edges of each layer is fixed to maintain the general trend of the mid-arc of the blade profile, and the θ of the two control points in the middle of the span are adjusted to control the shape of the mid-arc, resulting in a total of six design parameters (3 span layers * 2 control points). The thickness distribution curve is also controlled by the thickness values of the two middle control points at 0% span, and the same thickness distribution is superimposed on the other span layers of the blade profile, resulting in only two design parameters. Hence, there are eight design parameters in total used to specify the blade geometry. The design parameters are adjusted relative to their original values, and the ranges are shown in Table 4.

Table 4.
Ranges of blade design parameters.
3.2. Optimization Method
Design of Experiments (DOE) and Response Surface Optimization (RSO) are applied to establish the empirical relationships between the design variables and the responses. Optimal Latin hypercube sampling is employed in the design space to generate a sample set of predictive models in the Design of Experiments (DOE). The Sample Type is set to CCD Samples, which generates the same number of samples that a CCD DOE would generate for the same number of inputs. The Random Generator Seed is set to 20 and is used to initialize the random number generator invoked internally by LHS. A DOE matrix is generated and consists of generated design points. The statistical approximations of the total pressure ratio and the isentropic efficiency are 0.327% and 1.420% when optimizing the shape of the mid-arc in the blade profile, and they are 0.018% and 0.025% when optimizing the thickness distribution curve, respectively.
The genetic aggregation (GA) algorithm is used to generate the response surface model, and multi-objective genetic algorithm (MOGA) optimization is carried out on the response surface model. Six thousand samples were generated when optimizing the shape of the mid-arc in the blade profile, with 1200 samples per iteration; two thousand samples were generated when optimizing the thickness distribution curve, with 400 samples per iteration. The maximum number of iterations is set to 20, and the maximum Pareto percentage is set to 70%.
In compressor design optimization, high overall efficiency levels and a high total pressure ratio are always expected simultaneously. These parameters are important for measuring compressor performance, but both often cannot reach their maximum at the same time. In general, a good compromise between the overall efficiency and pressure ratio is required [19,22]. Therefore, the optimization goal is to improve the isentropic efficiency ηis of the initial model and to make its aerodynamic performance better under the condition where the total pressure ratio Rs reaches 1.1. The total pressure ratio and isentropic efficiency are selected to construct the objective function, the specific definition of which is as follows:
where T0 is the total temperature, P0 is the total pressure, ΔT0s is the total temperature increase, and γ = 1.4 is the specific heat.
In the optimization, the blade design objectives and constraints are as follows:
Objective function: max Rs and max ηis;
Constraints: ηis < 100.
4. Analysis of Optimization Results
4.1. Results
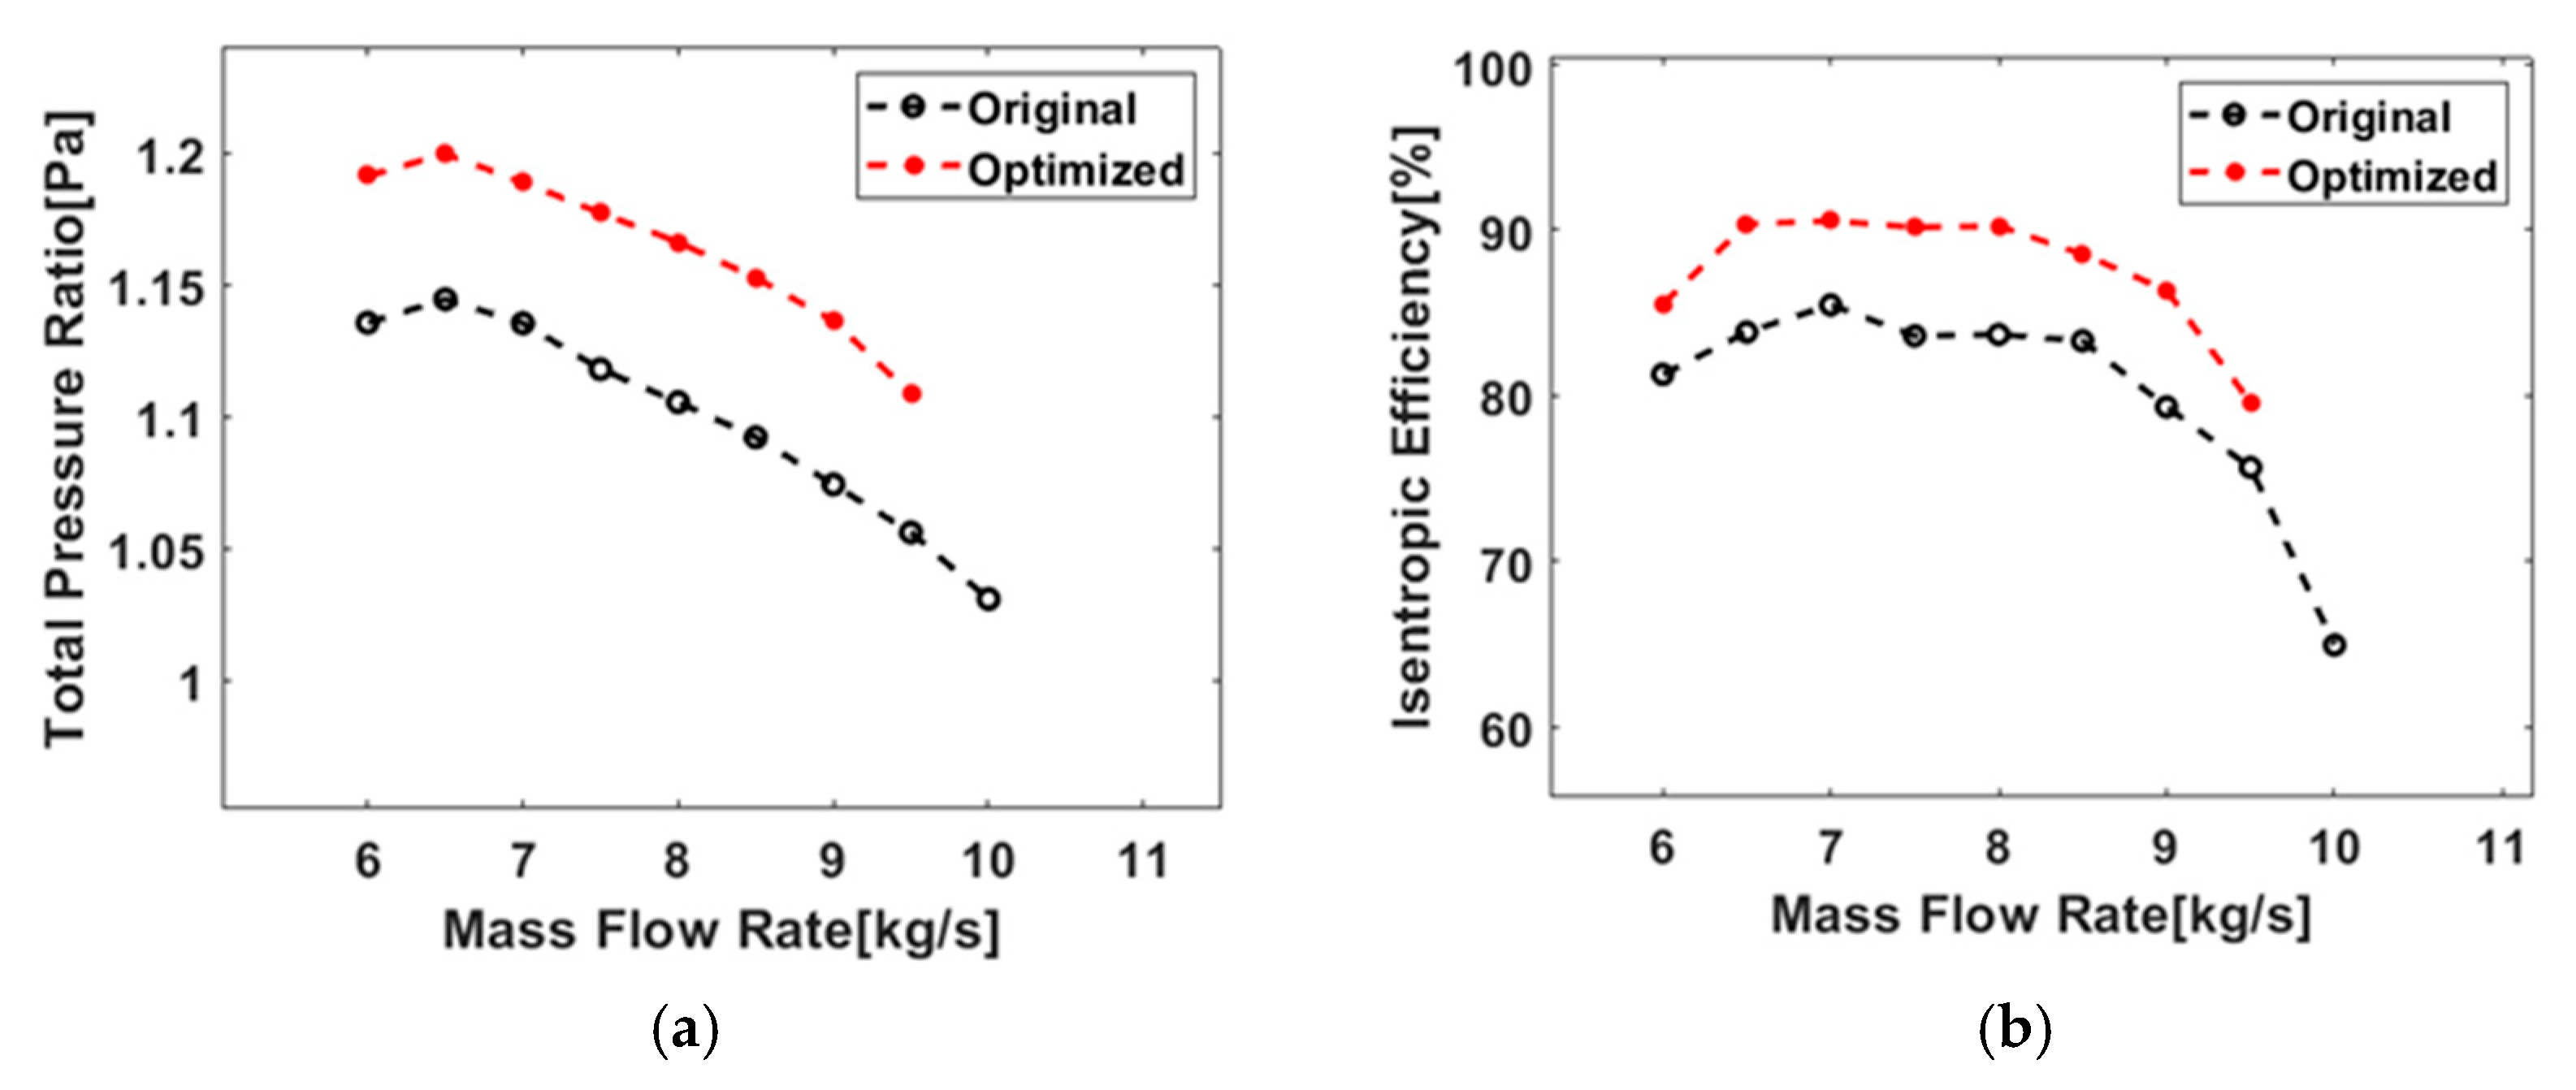
The isentropic efficiency ηis and the total pressure ratio Rs are selected as the optimization objective functions, and the multi-objective genetic algorithm is used for optimization. At the end of the iterations, the total pressure ratio and isentropic efficiency did not fluctuate greatly. Table 5 summarizes the performance comparisons of the model before and after optimization. It can be seen that the total pressure ratio is 1.20 and that the isentropic efficiency is 90.37% after optimization and that they increased by 5.3% and 7.8%, respectively.

Table 5.
Comparison of performances.
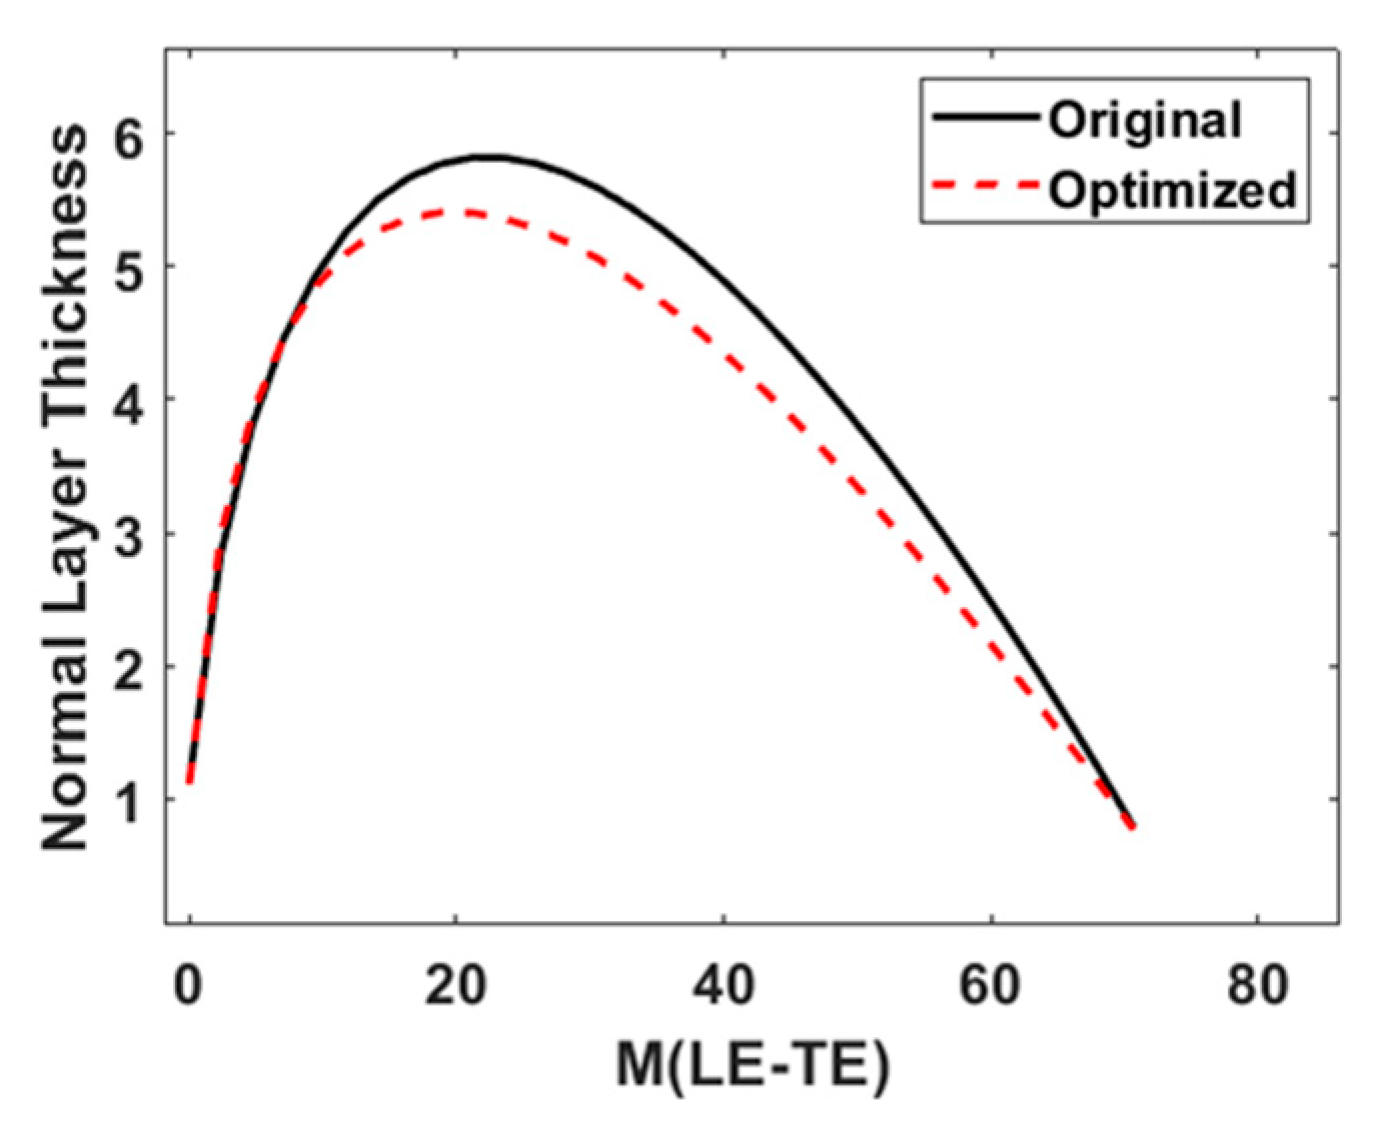
Figure 8 compares the optimized sectional profiles with the original ones at several span layer sections. The blade profiles of the sections have evident variations in curvature because of increases in theta. The thickness distribution of the blade profiles (Figure 9) indicates that the optimized blade is thinner and that the maximum thickness position is closer to the leading edge.

Figure 8.
Initial and optimized blade profiles at different spans: (a), (b) and (c) are the blade profiles at 20%, 50% and 80% of the span layers before and after optimization, respectively.
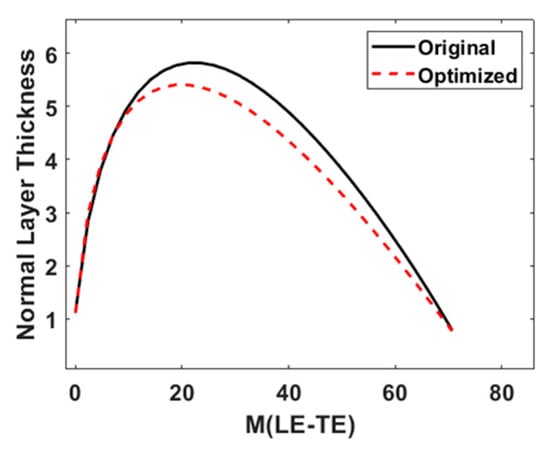
Figure 9.
Thickness distribution curves.
4.2. Flow Field and Performance Analyses
Figure 10 provides information on the distribution of the static pressure coefficient along the axial direction in three different spanwise locations. The static pressure distribution of the optimized model blade is more uniform along the axial direction, and the static pressure increases to varying degrees at each span layer, indicating that the overall pressurization of the blade is significantly improved.

Figure 10.
Axial distribution of static pressure coefficient: (a), (b) and (c) are the 20%, 50% and 80% span layers of the blade, respectively.
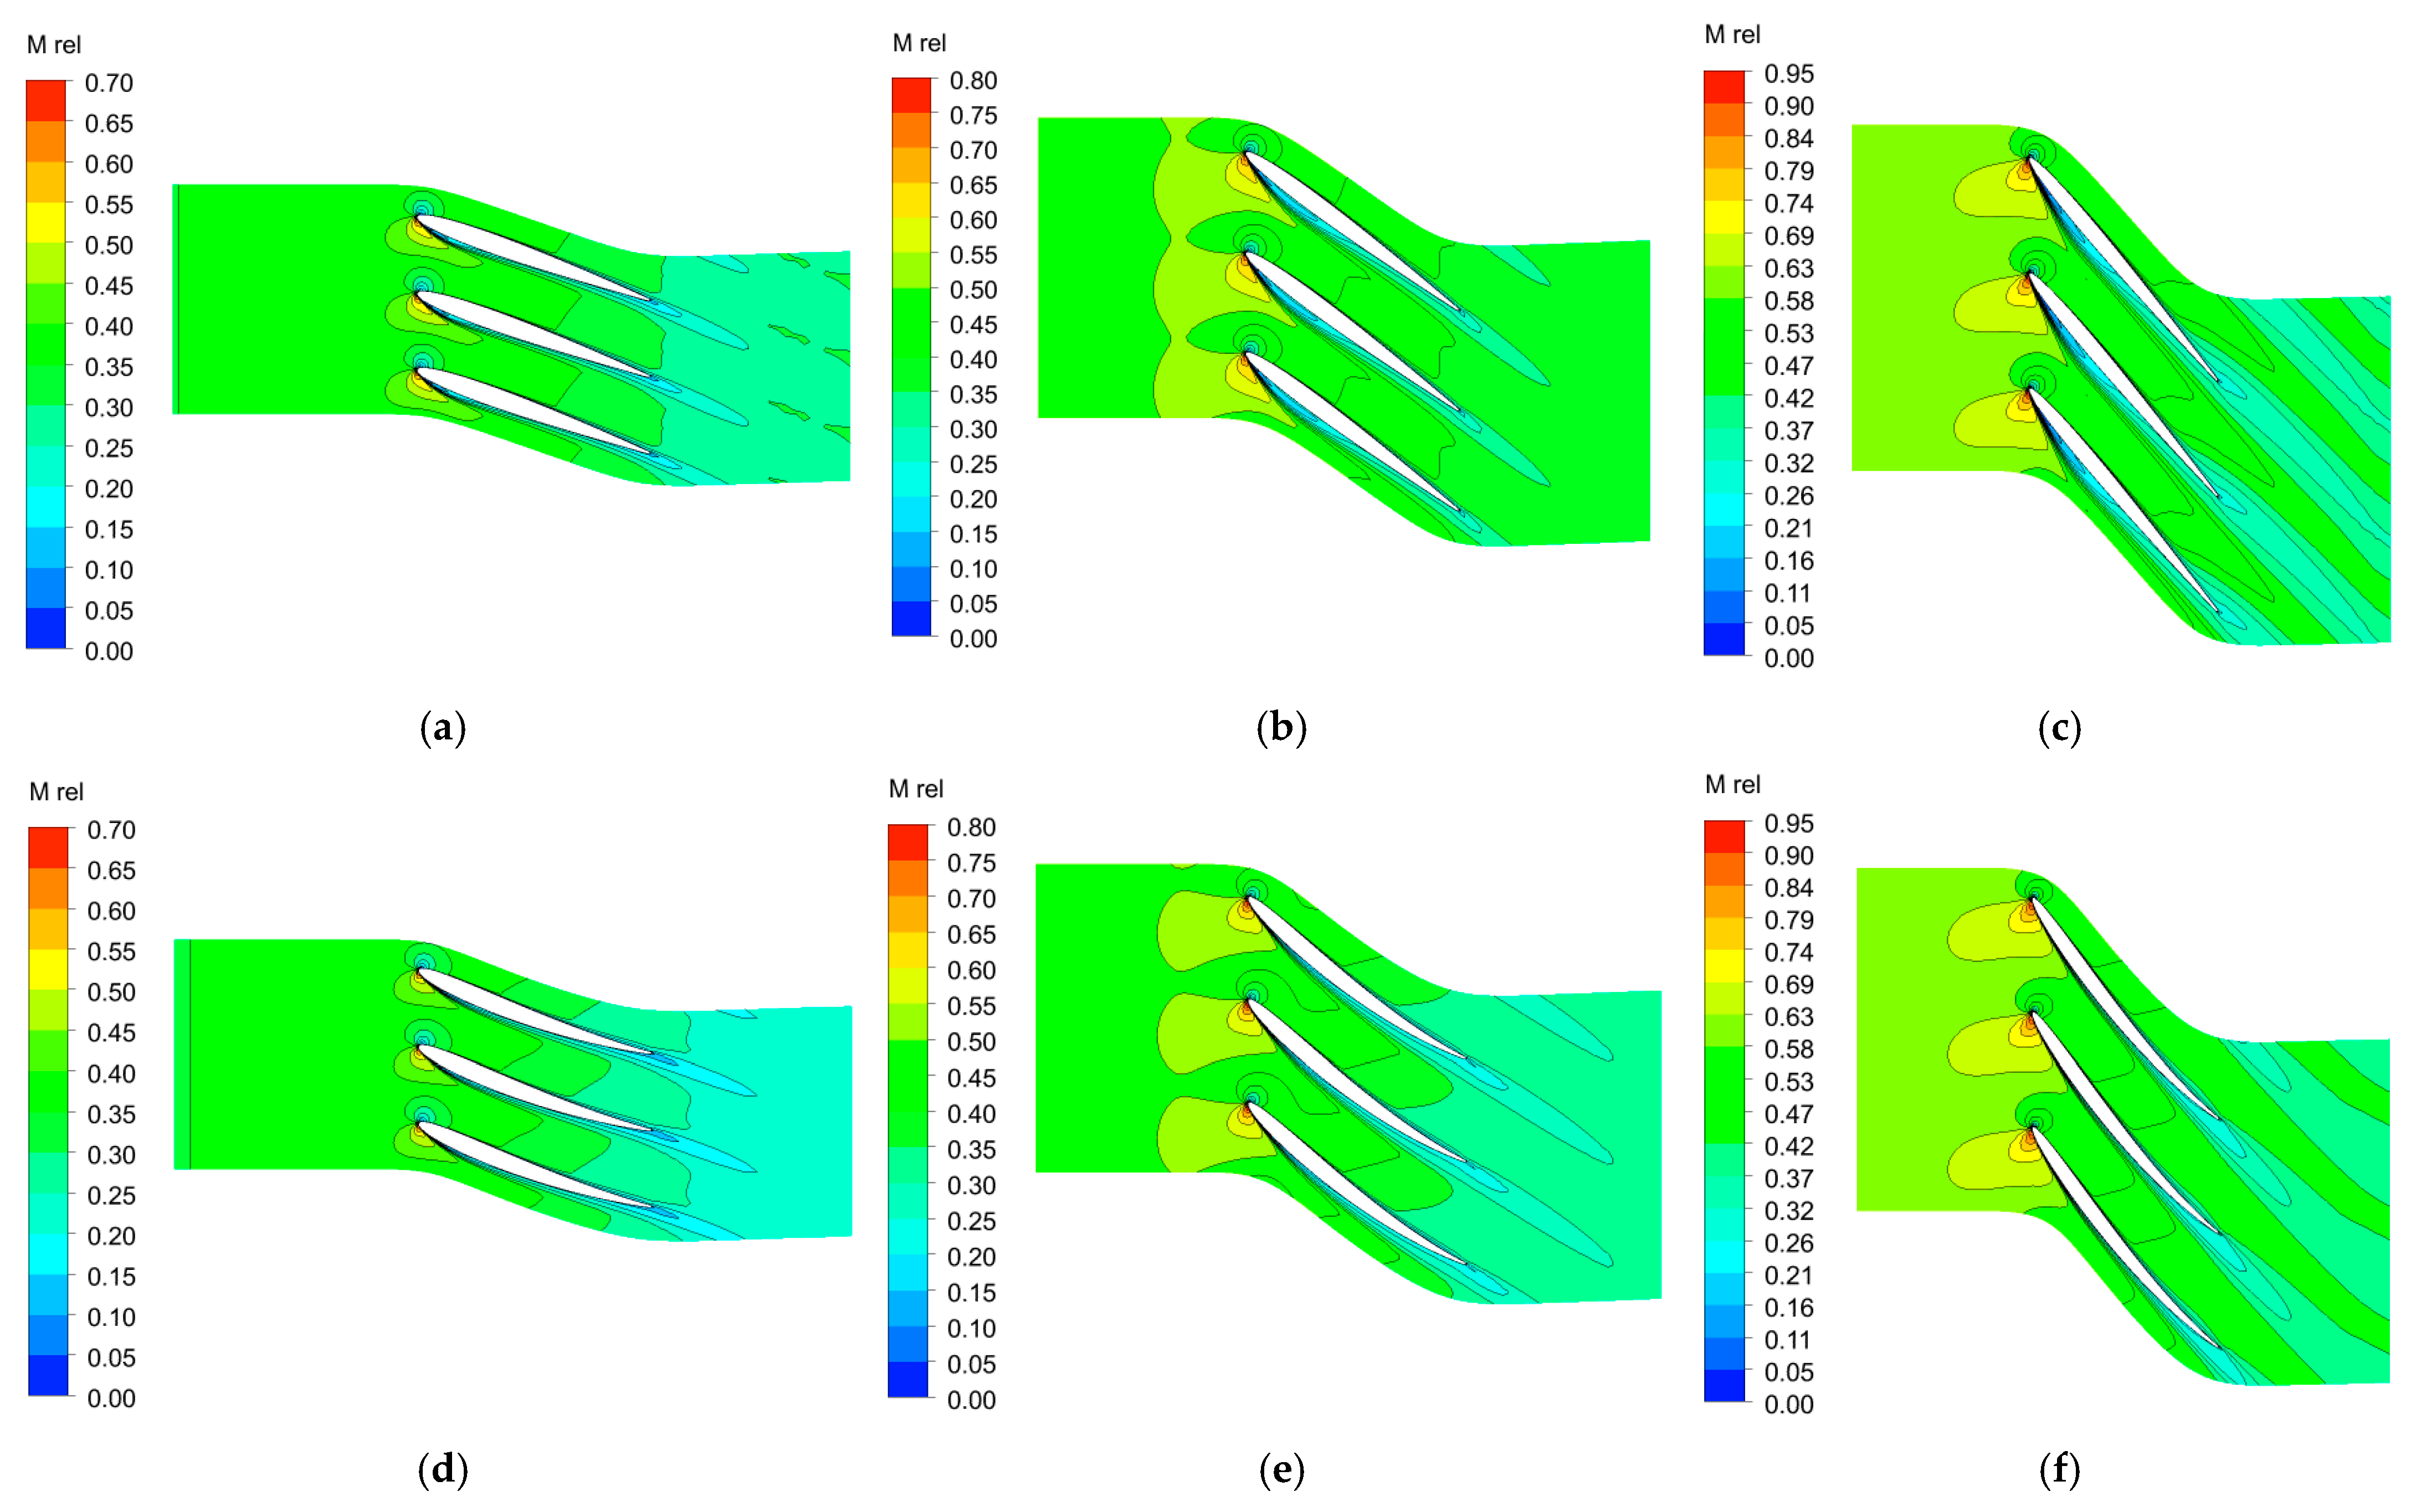
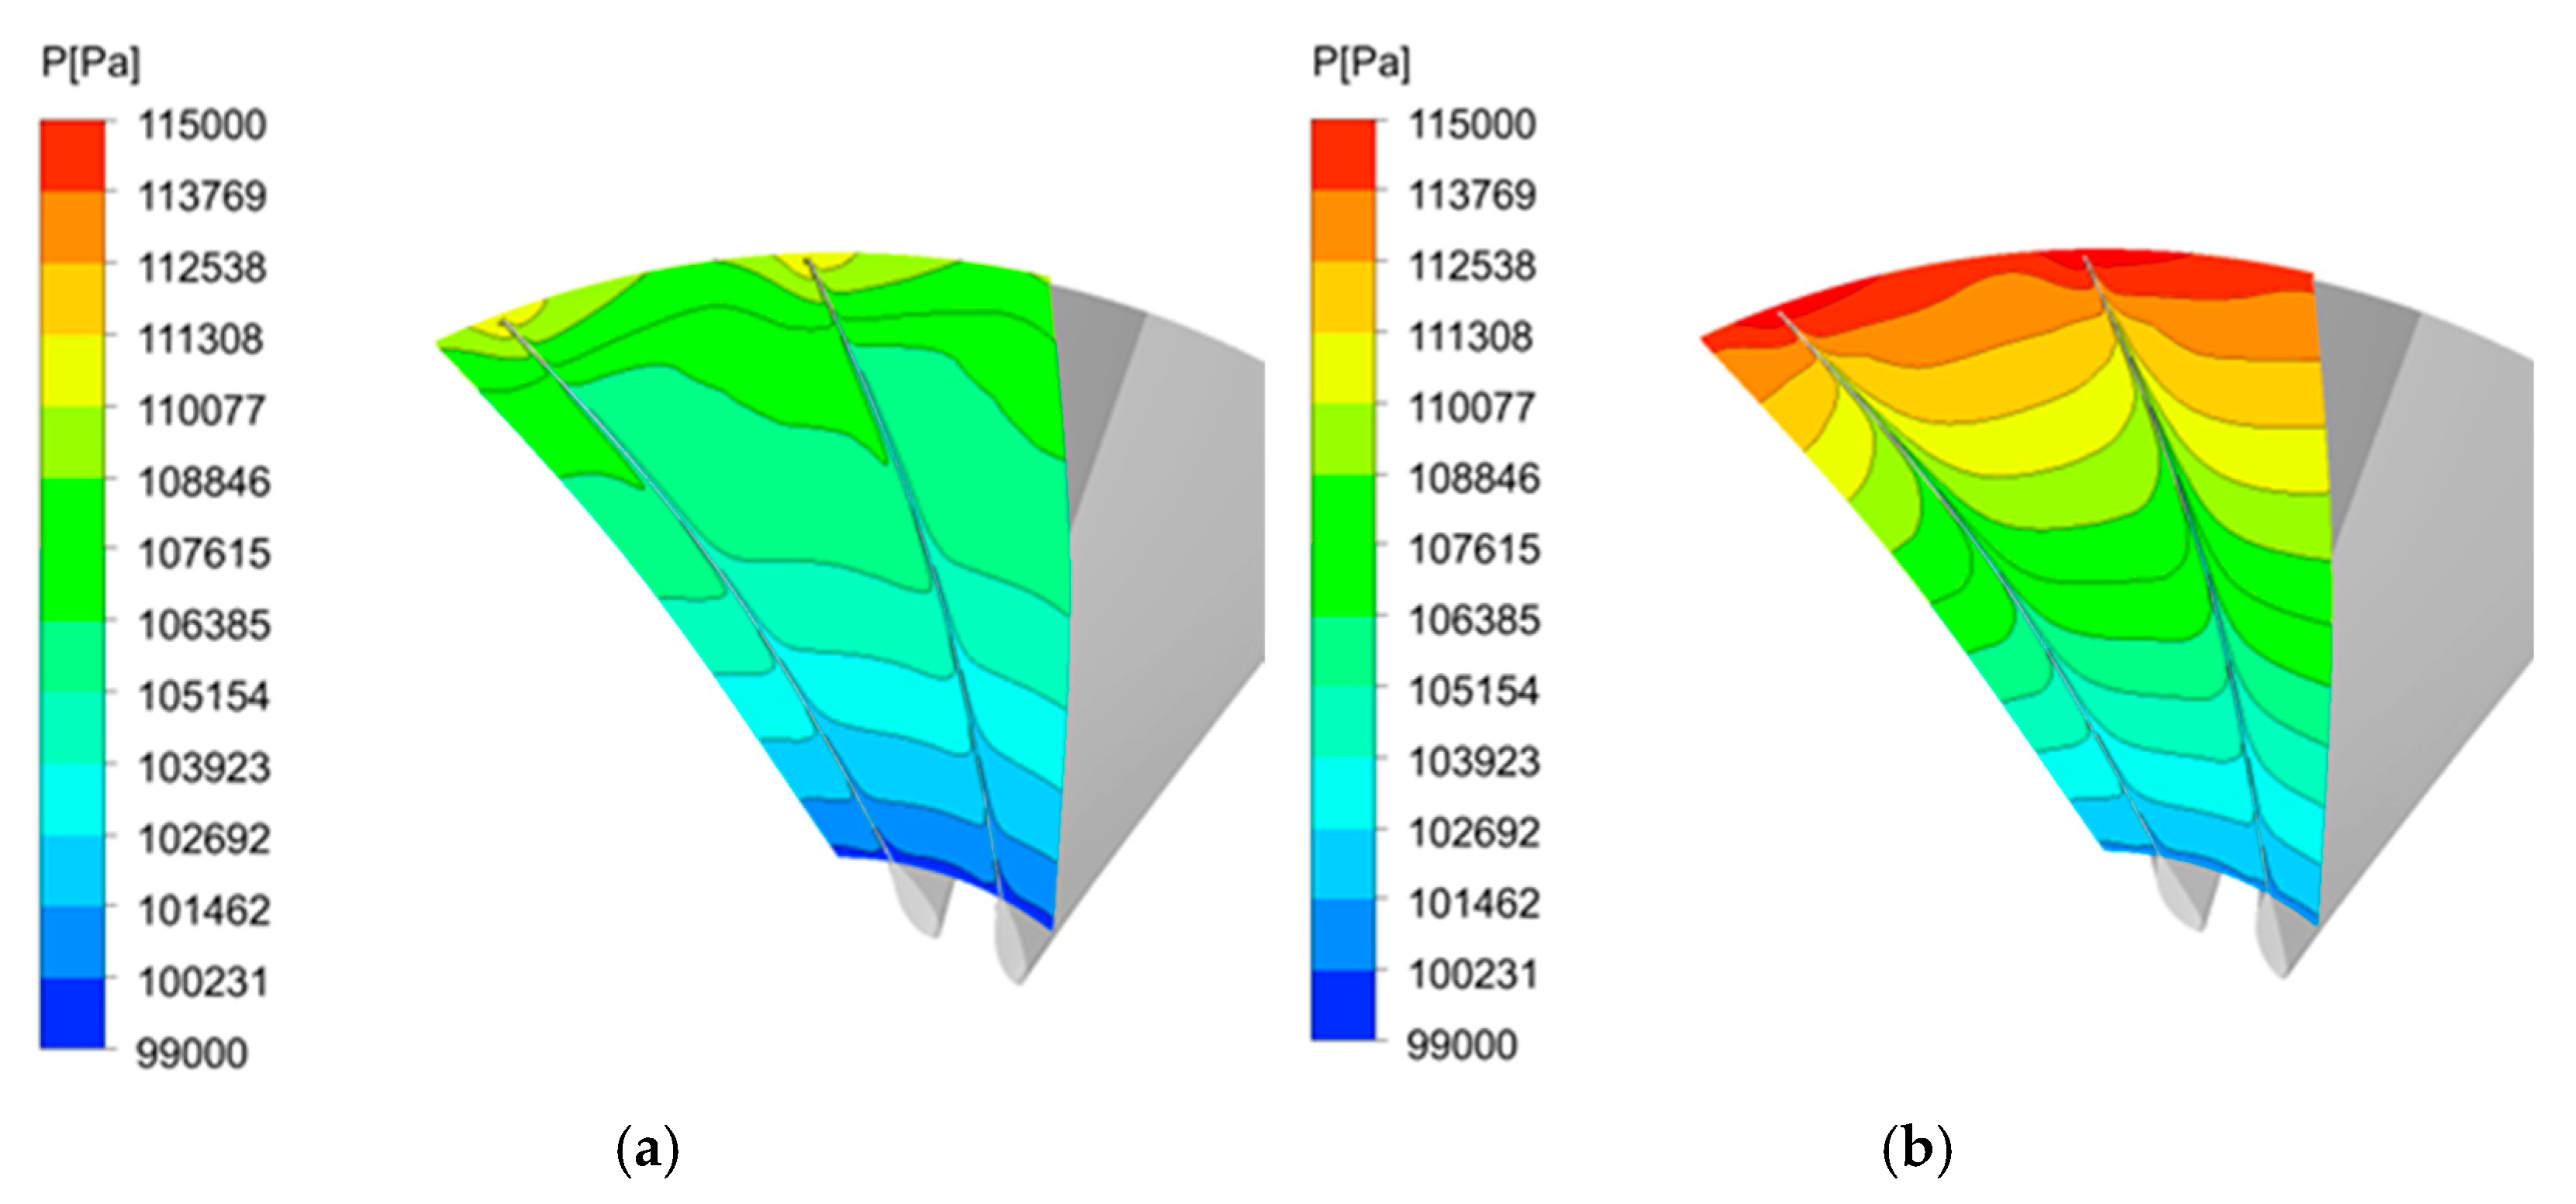
Figure 11 displays the distribution of Mach numbers at the 20%, 50% and 80% span layers of the optimized blade. The Mach number in each span is reduced to a certain extent, which indicates the reduction of losses. Figure 12 presents a cloud diagram of the static pressure at the outlet. The increases in the static pressure in the middle and upper regions of the blades show that the working abilities of the middle and upper parts of the blades are significantly improved. All these improved flow features help to reduce losses and support a higher level of overall performance.
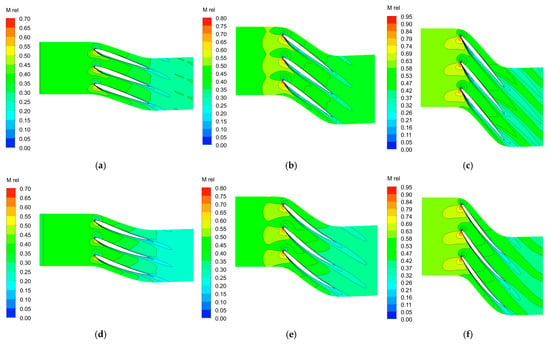
Figure 11.
Mach contours at different spans: (a), (b) and (c) and (d), (e) and (f) are the blade profiles at 20%, 50% and 80% of the span layers before and after optimization, respectively.
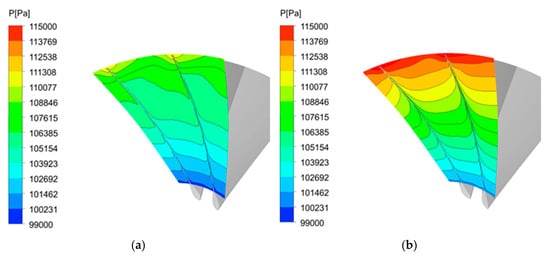
Figure 12.
Static pressure contours at outlet before (a) and after (b) optimization.
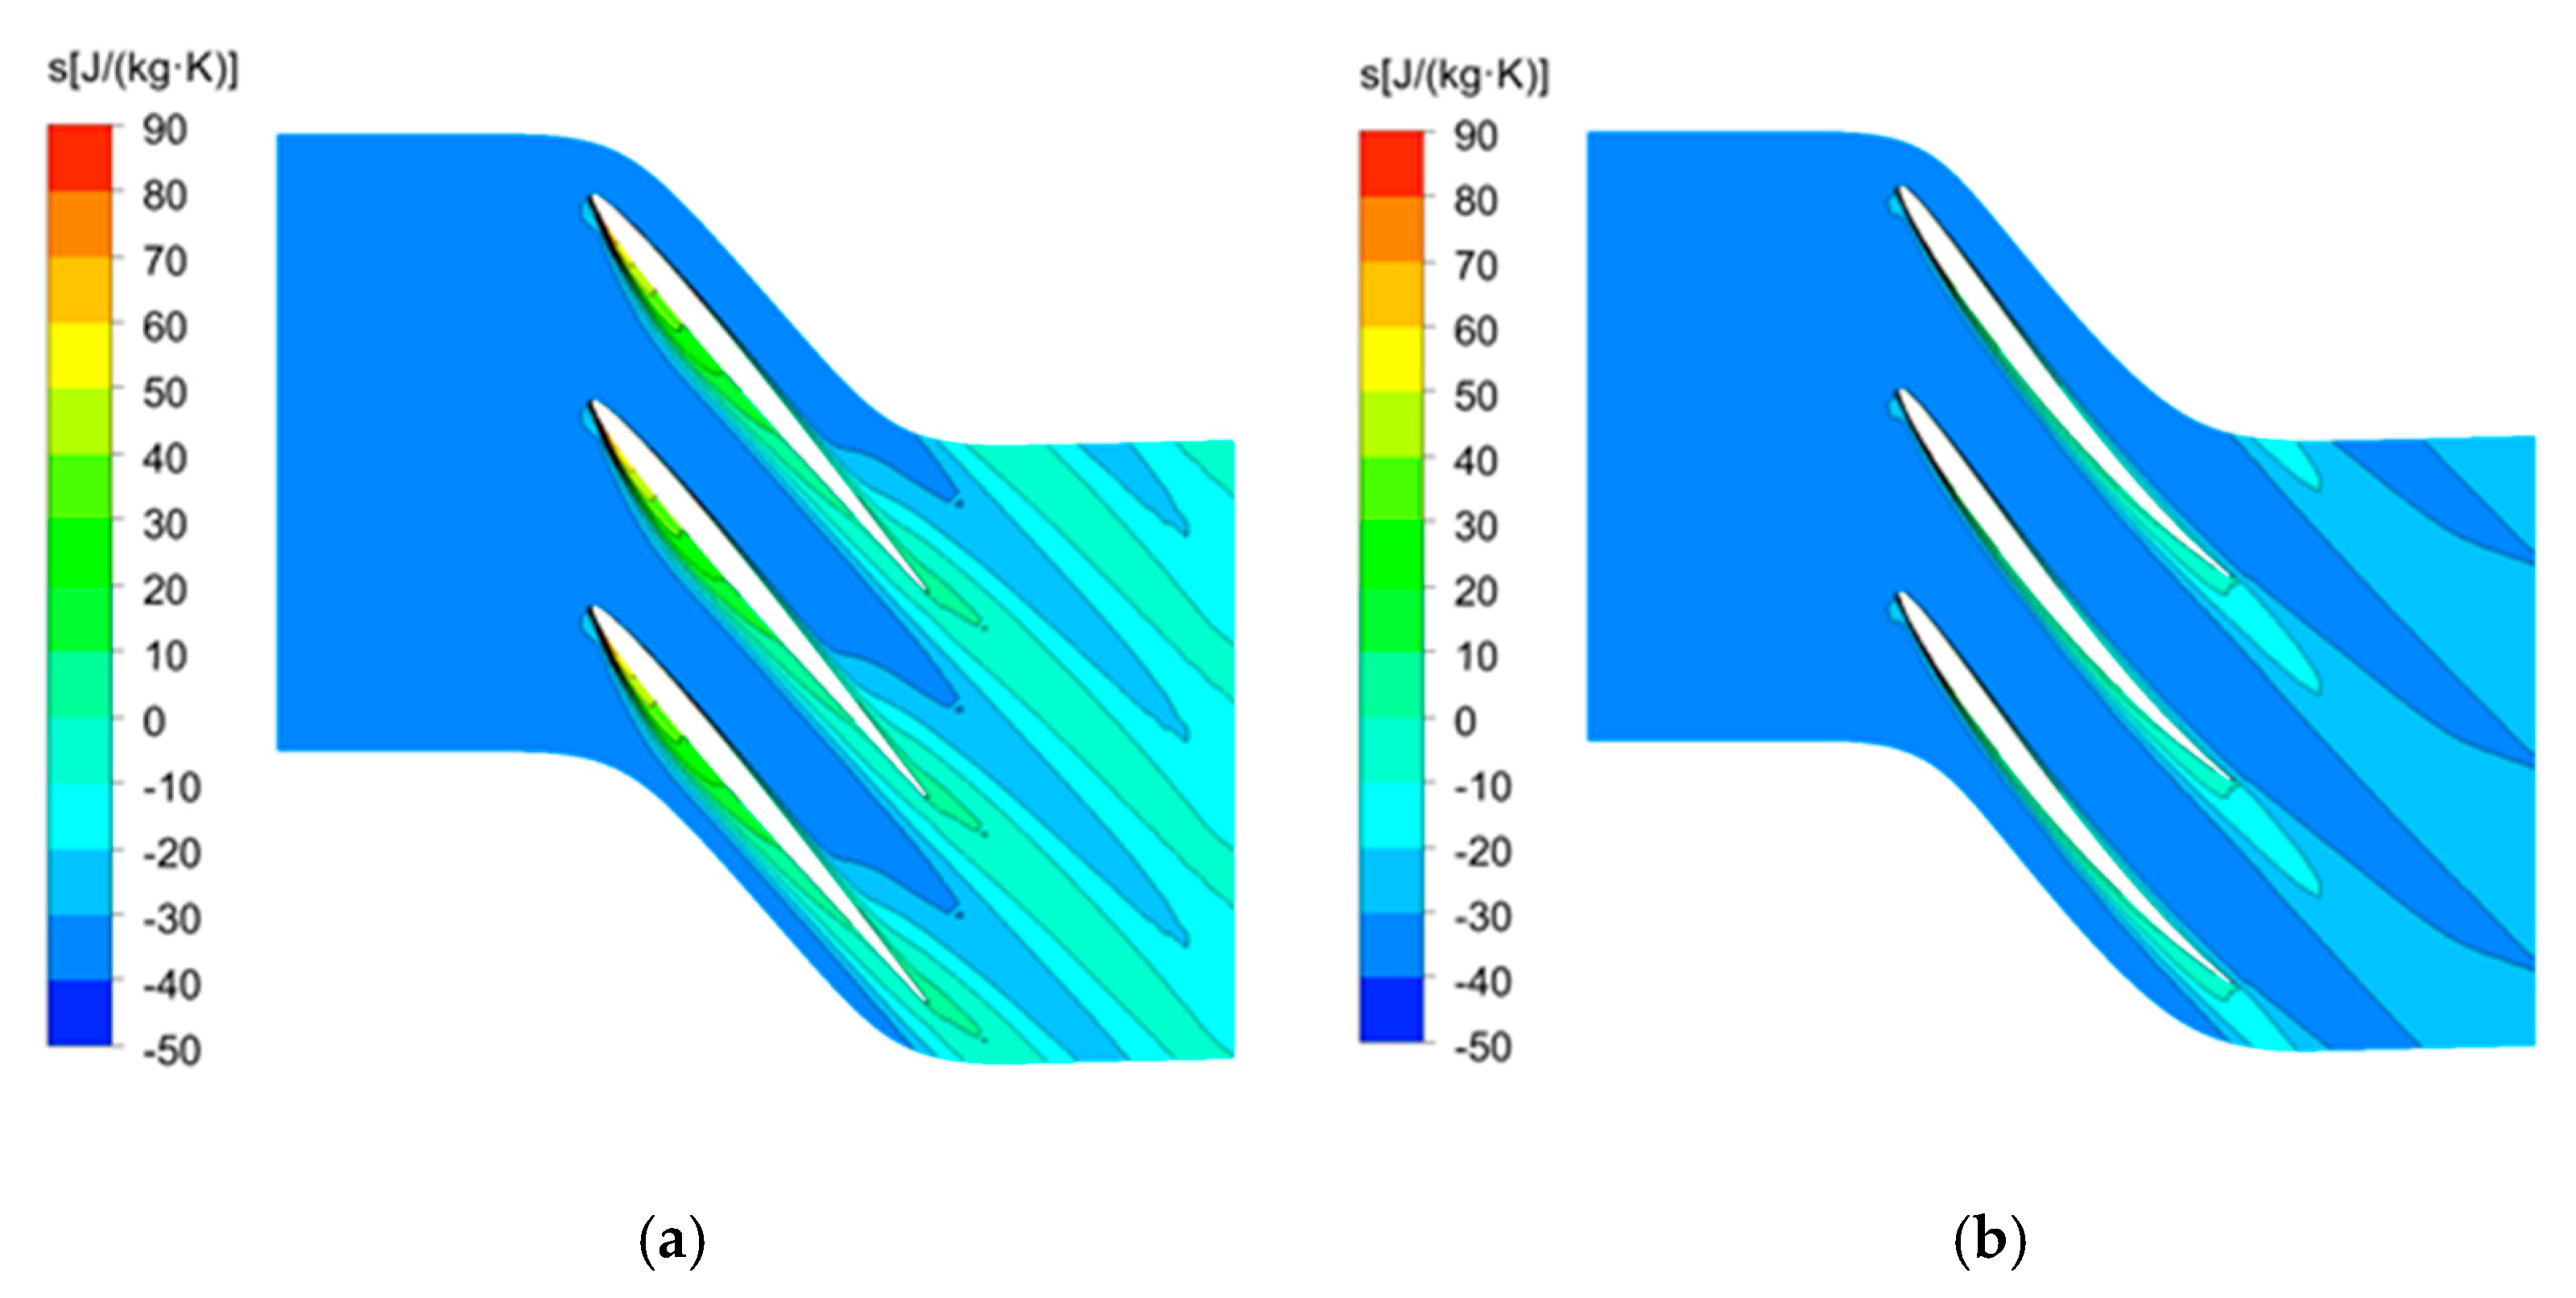
Figure 13a and Figure 13b make comparisons of the total pressure ratio–mass flow rate and isentropic efficiency–mass flow rate characteristic curves of the original and optimized blades at the design points, respectively. Rs is the total pressure ratio of the inlet and outlet of the blade, and ηis is the isentropic efficiency. Figure 14 shows the distribution of the entropy increase at the 80% span. Figure 13 shows that the total pressure ratio and isentropic efficiency are greatly improved compared with those of the original design. Based on the analysis in Figure 14, the optimized blade geometry significantly reduces the entropy increase, reduces the loss and improves the overall efficiency. In summary, the performance of the optimized blades is improved not only at the design point but also at the off-design point in the steady flow range.
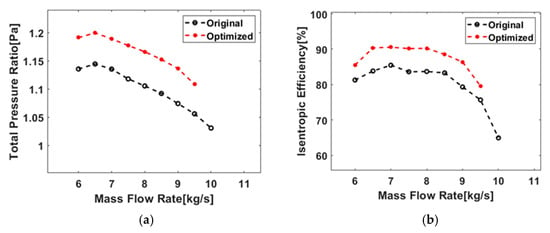
Figure 13.
Overall performance curves of the original (a) and optimized (b) blades.
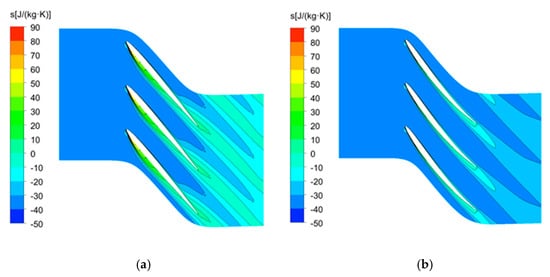
Figure 14.
Entropy increased contours at 80% span of the original (a) and optimized (b) blades.
5. Conclusions
In this paper, according to the design requirements of the ducted fans in the new distributed electric propulsion vertical take-off and landing UAVs, the aerodynamic design and optimization of the ducted fan blades are carried out. The conclusions are as follows:
Firstly, the initial model is created via a theoretical design, and a numerical simulation is carried out. The performance of the initial model almost meets the requirements, as the total pressure ratio reaches 1.14; however, the isentropic efficiency is 83.84%, which is low, and the aerodynamic performance is insufficient.
For the optimized blade, the angle (θ) between the arc and the axis of the blade profile is increased. Additionally, the thickness of the blade is smaller, and the position of the maximum thickness is closer to the leading edge. The total pressure ratio of the optimized model reaches 1.20, and the isentropic efficiency is 90.37%, which are increased by 5.3% and 7.8%, respectively, compared with those of the initial model, indicating that the optimization process significantly improves the performance of the rotor.
Finally, the rotor is analyzed based on the flow field at the design points. The static pressure of the rotor is increased at each span layer, and the increases in the static pressure in the middle and upper regions of the blades show that the working ability is enhanced after optimization. The optimized blade geometry significantly reduces the increase in the entropy, and the total pressure ratio and isentropic efficiency are both improved in the stable working range.
In the present study, a ducted fan for small integrated propulsion systems is designed, and it has a compact design with a low-flow cross-section and high performance. However, only the flow field of the ducted fan is analyzed. Therefore, in future research, studies of the flow field during the transition between the hover and cruise modes should be performed.
Author Contributions
Conceptualization, H.L.; Formal analysis, H.L.; Funding acquisition, K.L.; Methodology, H.L.; Project administration, K.L.; Supervision, K.L.; Visualization, H.L.; Writing—original draft, H.L.; Writing—review and editing, K.L. All authors have read and agreed to the published version of the manuscript.
Funding
This research was funded by the Shenzhen Science and Technology Program (Grant No. JCYJ20200109142205924, 202001093000459).
Data Availability Statement
Data are contained within the article.
Conflicts of Interest
The authors declare no conflict of interest.
References
- Krein, A.; Williams, G. Flightpath 2050: Europe’s vision for aeronautics. In Innovation for Sustainable Aviation in a Global Environment: Proceedings of the Sixth European Aeronautics Days; Knörzer, D., Szodruch, J., Eds.; IOS Press BV: Amsterdam, The Netherlands, 2012; pp. 63–71. [Google Scholar]
- Owen, B.; Lee, D.S.; Lim, L. Flying into the future: Aviation emissions scenarios to 2050. Environ. Sci. Technol. 2010, 44, 2255–2260. [Google Scholar] [CrossRef]
- Köhler, J.; Jeschke, P. Conceptual design and comparison of hybrid electric propulsion systems for small aircraft. CEAS Aeronaut. J. 2021, 12, 907–922. [Google Scholar] [CrossRef]
- Wheeler, P.; Sirimanna, T.S.; Bozhko, S.; Haran, K.S. Electric/hybrid-electric aircraft propulsion systems. Proc. IEEE 2021, 109, 1115–1127. [Google Scholar] [CrossRef]
- Jansen, R.; Duffy, K.P.; Brown, G. Partially turboelectric aircraft drive key performance parameters. In Proceedings of the 53rd AIAA/SAE/ASEE Joint Propulsion Conference, Atlanta, GA, USA, 10–12 July 2017; p. 4702. [Google Scholar]
- Martin, P.; Tung, C. Performance and Flowfield Measurements on a 10-Inch Ducted Rotor Vtol Uav; BiblioGov: Washington, DC, USA, 2013. [Google Scholar]
- Brelje, B.J.; Martins, J.R.R.A. Electric, hybrid, and turboelectric fixed-wing aircraft: A review of concepts, models, and design approaches. Prog. Aerosp. Sci. 2019, 104, 1–19. [Google Scholar] [CrossRef]
- Wang, X.Y. A review of NASA’s first All-Eletric X-plane, the X57 Maxwell. Aerosp. Power 2020, 2, 29–32. [Google Scholar]
- Aurora Flight Sciences. Available online: http://www.aurora.aero/lightningstrike (accessed on 24 May 2018).
- Murphy, P.C.; Landman, D. Experiment design for complex VTOL aircraft with distributed propulsion and tilt wing. In Proceedings of the AIAA Atmospheric Flight Mechanics Conference, Dallas, TX, USA, 5–9 January 2015; p. 0017. [Google Scholar]
- Lilium. Available online: https://lilium.com/technology (accessed on 24 May 2018).
- Kim, H.D.; Perry, A.T.; Ansell, P.J. A review of distributed electric propulsion concepts for air vehicle technology. In Proceedings of the 2018 AIAA/IEEE EATS, Cincinnati, OH, USA, 12–14 July 2018; pp. 1–21. [Google Scholar]
- Huang, J. Survey on design technology of distributed electric propulsion aircraft. Acta A Aeronaut. Astronaut. Sin. 2021, 42, 624037–624054. [Google Scholar]
- Nalianda, D.; Singh, R. Turbo-electric distributed propulsion–opportunities, benefits and challenges. Aircr. Eng. Aerosp. Technol. Int. J. 2014, 86, 543–549. [Google Scholar] [CrossRef]
- Deere, K.A.; Viken, J.K.; Viken, S.; Carter, M.B.; Wiese, M.; Farr, N. Computational analysis of a wing designed for the X-57 distributed electric propulsion aircraft. In Proceedings of the 35th AIAA Applied Aerodynamics Conference, Denver, CO, USA, 5–9 June 2017; p. 3923. [Google Scholar]
- Bacchini, A.; Cestino, E. Electric VTOL configurations comparison. Aerospace 2019, 6, 26. [Google Scholar] [CrossRef]
- Borer, N.K.; Patterson, M.D.; Viken, J.K.; Moore, M.D.; Clarke, S.; Redifer, M.E.; Christie, R.J.; Stoll, A.M.; Dubois, A.; Bevirt, J.; et al. Design and performance of the NASA SCEPTOR distributed electric propulsion flight demonstrator. In Proceedings of the 16th AIAA Aviation Technology, Integration, and Operations Conference, Washington, DC, USA, 13–17 June 2016; p. 3920. [Google Scholar]
- Gallimore, S.J. Axial flow compressor design. Proc. Inst. Mech. Eng. Part C J. Mech. Eng. Sci. 1999, 213, 437–449. [Google Scholar] [CrossRef]
- Saravanamuttoo, H.I.H.; Rogers, G.F.C.; Cohen, H. Gas Turbine Theory, 3rd ed.; Longman Scientific & Technical: Harlow, UK, 2001; pp. 138–219. [Google Scholar]
- Boyce, M.P. Gas Turbine Engineering Handbook, 4th ed.; Elsevier: Amsterdam, The Netherlands, 2011; pp. 303–355. [Google Scholar]
- Karpowitz, D. Bezier curve fitting method for existing turbine blade design. J. Appl. Eng. Math. 2005, 1, 1. [Google Scholar]
- Song, P.; Sun, J.; Wang, K. Blade shape optimization of transonic axial flow fan in terms of sectional profiles and stacking line. In Turbo Expo: Power for Land, Sea, and Air; American Society of Mechanical Engineers: Düsseldorf, Germany, 2014; Volume 45615, p. V02BT39A016. [Google Scholar]
Disclaimer/Publisher’s Note: The statements, opinions and data contained in all publications are solely those of the individual author(s) and contributor(s) and not of MDPI and/or the editor(s). MDPI and/or the editor(s) disclaim responsibility for any injury to people or property resulting from any ideas, methods, instructions or products referred to in the content. |
© 2023 by the authors. Licensee MDPI, Basel, Switzerland. This article is an open access article distributed under the terms and conditions of the Creative Commons Attribution (CC BY) license (https://creativecommons.org/licenses/by/4.0/).

