Article

Experimental Study on the Influence of Temperature on the Mechanical Properties of Near-Space Airship Envelopes

1
Aerospace System Engineering Shanghai, Shanghai 201108, China
2
School of Aeronautics and Astronautics, Shanghai Jiao Tong University, Shanghai 200240, China
3
School of Aerospace Engineering and Applied Mechanics, Tongji University, Shanghai 200092, China
*
Author to whom correspondence should be addressed.
Aerospace 2023, 10(5), 413; https://doi.org/10.3390/aerospace10050413
Submission received: 25 November 2022 / Revised: 24 April 2023 / Accepted: 25 April 2023 / Published: 28 April 2023

Abstract

:
A biaxial tension test considering temperature is crucial to predict the mechanical properties of airship envelopes. However, there is a lack of biaxial tensile test equipment for high- and low-temperature correlation. In this study, a temperature control device suitable for biaxial tension was designed based on the traditional device, and the biaxial tension test of the UN-5100 material in high- and low-temperature environments was realized. In addition, a series of tests were carried out to verify the effectiveness and rationality of the temperature control device. Then, a biaxial tensile test of UN-5100 specimens between −33 °C and 80 °C were carried out and the stress–strain relationship of the UN-5100 specimens under high- and low-temperature environments was obtained. Based on the test data, the elastic modulus and Poisson’s ratio of the UN-5100 specimens at different temperatures were calculated. Finally, the test results showed that the elastic modulus and Poisson’s ratio of the airship envelope were larger at low temperatures, indicating that the capsule is relatively safe at such temperatures. The relationships between the temperature and the mechanical properties of the airship were also summarized.

1. Introduction

Since the end of the last century, near-space airships have reached a more technical level with the development of materials science, control science, and renewable energy engineering. Specifically, new envelope materials (Kevlar®, Dyneema®, Vectran®, etc.) with high strength, low density, long-distance flight control, information transmission, helium extraction, and solar energy technology have made it possible for airships to fly in the stratosphere. The development of science and technology and the broad prospects of near-space flight platforms have drawn people’s attention to near-space aircraft. Due to the important application prospects of near space in the military and civilian fields [1,2,3,4,5], many countries are conducting relevant research [6,7,8,9].
The performance test of a near-space airship envelope in the special near-space environment [10] is an important aspect of the research of near-space airships, and it is of great significance to predict the flight state of near-space airships. As far as the environment is concerned, the near-space temperature varies with altitude, season, and latitude. Considering the influence of different geographical factors on the near-space temperature, the temperature in the stratosphere ranges from −55 °C to −50 °C [11]. The maximum temperature is at the top of the stratosphere, which is approximately 50 km above sea level, and the minimum temperature is at the bottom of the stratosphere, which is 20 km above sea level [12,13]. For the near-space airship, due to the influence of various types of radiation in the stratosphere and to its own equipment, the local area of its envelope may reach a high temperature of more than 80 °C, such as the installation site of the solar cell array and the envelope.
The changes in the material shape and properties due to the temperature on the main bearing layer directly affect the mechanical properties of the envelope material, so temperature is an important factor in the research of near-space airship envelopes. In 2006, Kang [14] carried out uniaxial tensile tests at different temperatures. The results showed that the stress–strain behavior is significantly nonlinear in all of the test temperature ranges. It was also found that the stiffness modulus is temperature-dependent and increases with the decrease in temperature. In 2008, Maekawa [15] carried out uniaxial tensile tests on a Z2929T-AB airship envelope’s material at different temperatures, studied the effect of temperature on its mechanical properties, and obtained the tensile strength of its plain fabric material and its weld. It was found that the tensile failure strength of the specimen is higher at low temperatures. In 2009, Yamamoto [16] introduced the material properties and toughness of Vectron fiber at low temperatures and pointed out that the toughness of Vectron fiber at −70 °C improved compared with that at 20 °C. In 2009, McDaniels [17] conducted uniaxial tensile tests on CT155 UHMWPE and CT135 PBO membranes and found that the uniaxial failure and tear strengths of the specimens at −60 °C were higher than at 23 °C. In 2009, Bai Xianghong [18] carried out a uniaxial tensile test of envelope materials at high and low temperatures. It was found that the mechanical properties of the envelope materials at high and low temperatures were related to the type of material, cyclic specimen, and direction. In 2013, Ambroziak [19] carried out uniaxial tensile tests on plain weave materials at different temperatures. The curve showed that the strain of the specimen at −30 °C was smaller than that at high temperatures under the same stress conditions. In 2013, Komatsu [20] of JAXA tested and evaluated the tensile strength of more than 30 kinds of high-specific-strength laminated fabrics that are used for near-space airship platforms, involving a large number of high-performance fiber and membrane materials, including Vectran, Kevlar, and Zylon as the main bearing structure membrane materials. Komatsu also studied the effect of temperature on airships’ mechanical properties and found that Zylon-based materials can maintain high-specific strengths at both high and low temperatures and that Zylon fiber also has good creep resistance, as the creep failure time is two years at room temperature under 60 °C.
According to the existing research, the airship envelope material test considering temperature influence factors is basically a uniaxial tensile test; however, biaxial tensile tests considering temperature were not found. This is mainly due to the lack of relevant experimental equipment. The uniaxial tensile test is a simple and effective way to study the envelope material of near-space airships, but the biaxial tensile test is closer to the mechanical characteristics of the envelope materials on airships. Therefore, a biaxial tensile test considering temperature is of great significance for the study of near-space airships.
In this work, a temperature control device that is suitable for biaxial tension and can realize the high and low temperatures of biaxial tension experiments was designed. The low temperature consisted of a mixture of dry ice and high-concentration ethanol (the cold source), while the high temperature consisted of a water solution that was heated by a thermostat (the heat source). This study carried out the verification test of the influence of the temperature control device on the experiment. In order to eliminate the influence of ethanol on the specimen, this work provided the biaxial tensile test of the membrane material that was soaked in alcohol at a low temperature. The results showed that the mechanical properties of the membrane did not change significantly after being soaked in high-concentration alcohol. Through the device and biaxial tensile machine, the biaxial tensile test of the UN-5100 membrane [21] under a −33 °C~80 °C environment was realized, and the stress–strain curves and overall mechanical properties of the membrane under biaxial cyclic tensile at different temperatures were obtained.

2. Methodology

The MSAJ standard [22,23,24] is the only existing and widely accepted standard for the biaxial testing of woven fabrics. The American Standard ASCE1852 (1996) [25] also recommends the MSAJ standard. As the thickness of plain-weave materials is minimal, it is generally considered that their mechanical properties are orthotropic elastic and, thus, that the corresponding stress–strain relationship can be approximated using an orthotropic plane model:
ε x ε y = E 11 E 12 E 21 E 22 σ x σ y
where ε is the strain, σ is the stress, and E mn   (m, n = 1, 2) are defined as:
E 11 = 1 E x  
E 12   = ν yx E y
E 21 = ν xy E x
E 22   = 1 E y
where v is the Poisson’s ratio, and the subscripts x and y denote the warp and weft directions, respectively. For orthotropic elastic materials, the Poisson’s ratio and elastic modulus are constrained by the Maxwell relationship:
ν yx E y = ν xy E x
From Equations (2) and (5), it can be determined that E 21 = E 12 . Under different stress ratio loads, the sum of the squares of the strain difference can be obtained as:
S = E 11 σ x i + E 12 σ y i ε x i 2 + E 12 σ x i + E 22 σ y i ε y i 2
where i represents the experimental data obtained at the i-th stress ratio. Using the principle of the minimum sum of the squares of strain residuals, the derivative of the unknown variables is equal to 0:
S E 11 = S E 12 = S E 22 = 0
Combining Equations (7) and (8) yields:
σ x i 2 σ x i σ y i 0 σ x i σ y i σ x i 2 + σ y i 2 σ x i σ y i 0 σ x i σ y i σ y i 2 1 E x ν yx E y 1 E y = σ x i ε x i σ y i ε x i + σ x i ε y i σ y i ε y i
From Equations (1) and (9), the Poisson’s ratio ( ν yx , ν xy ) and elastic modulus (𝐸𝑥, 𝐸𝑦) can be obtained.

3. Experiments

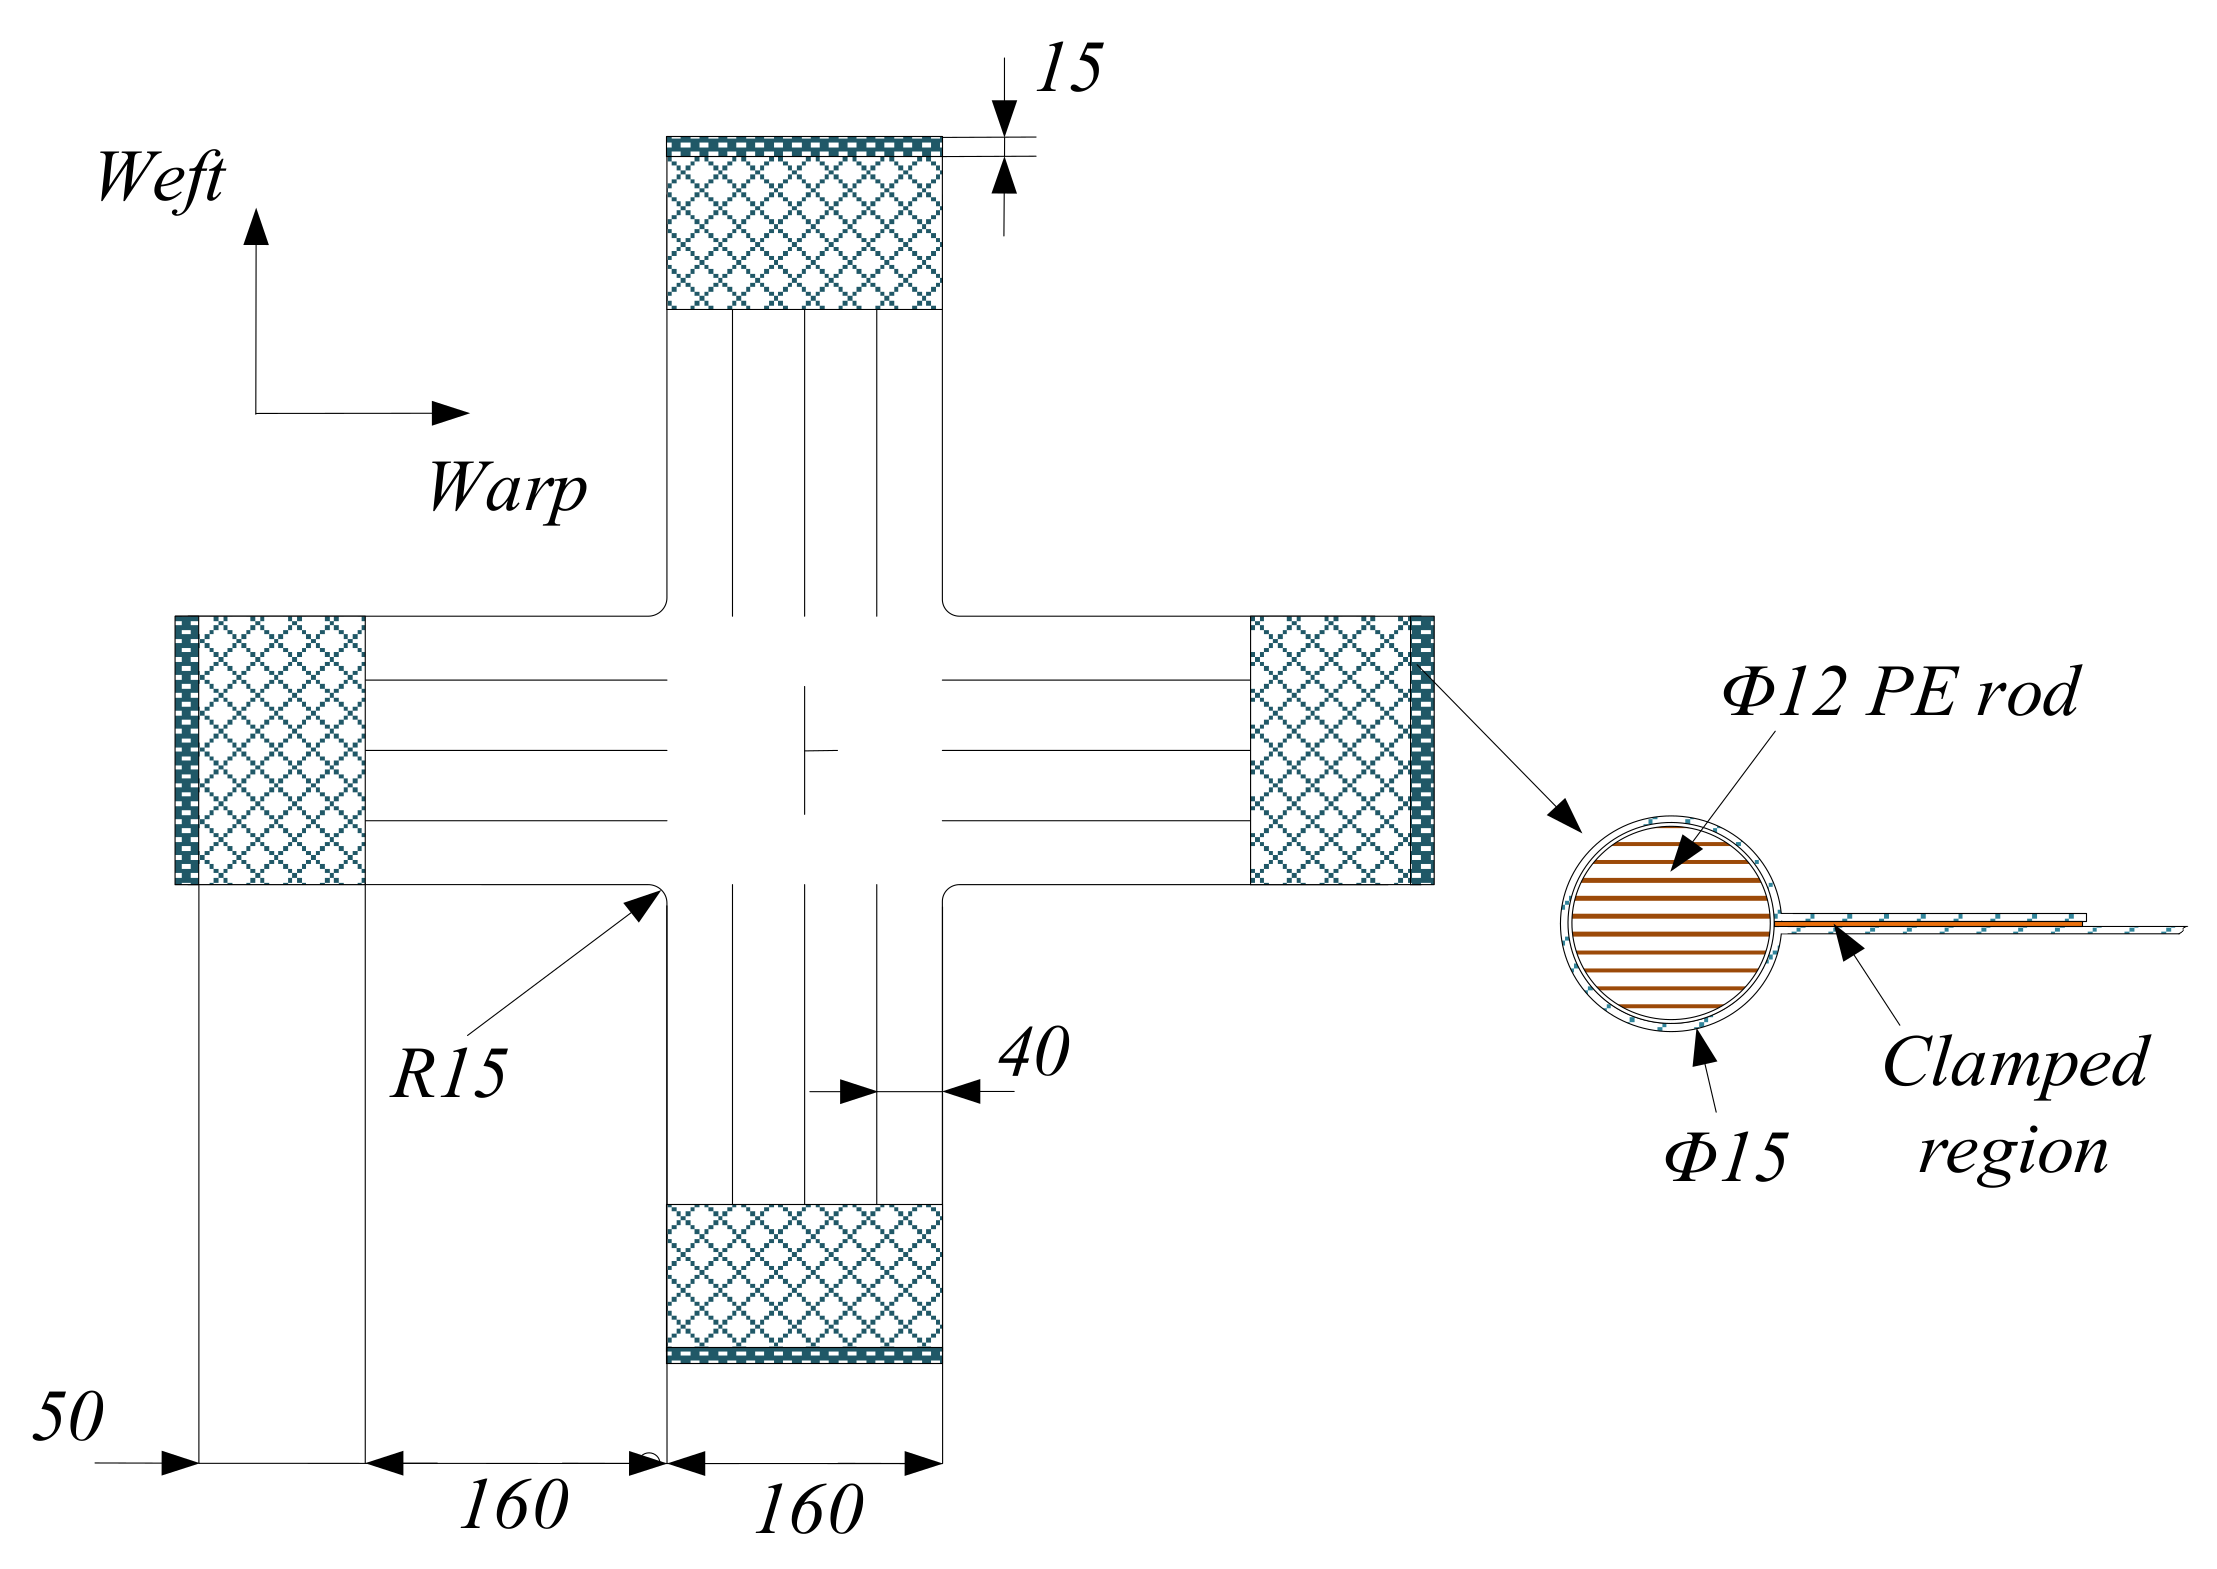
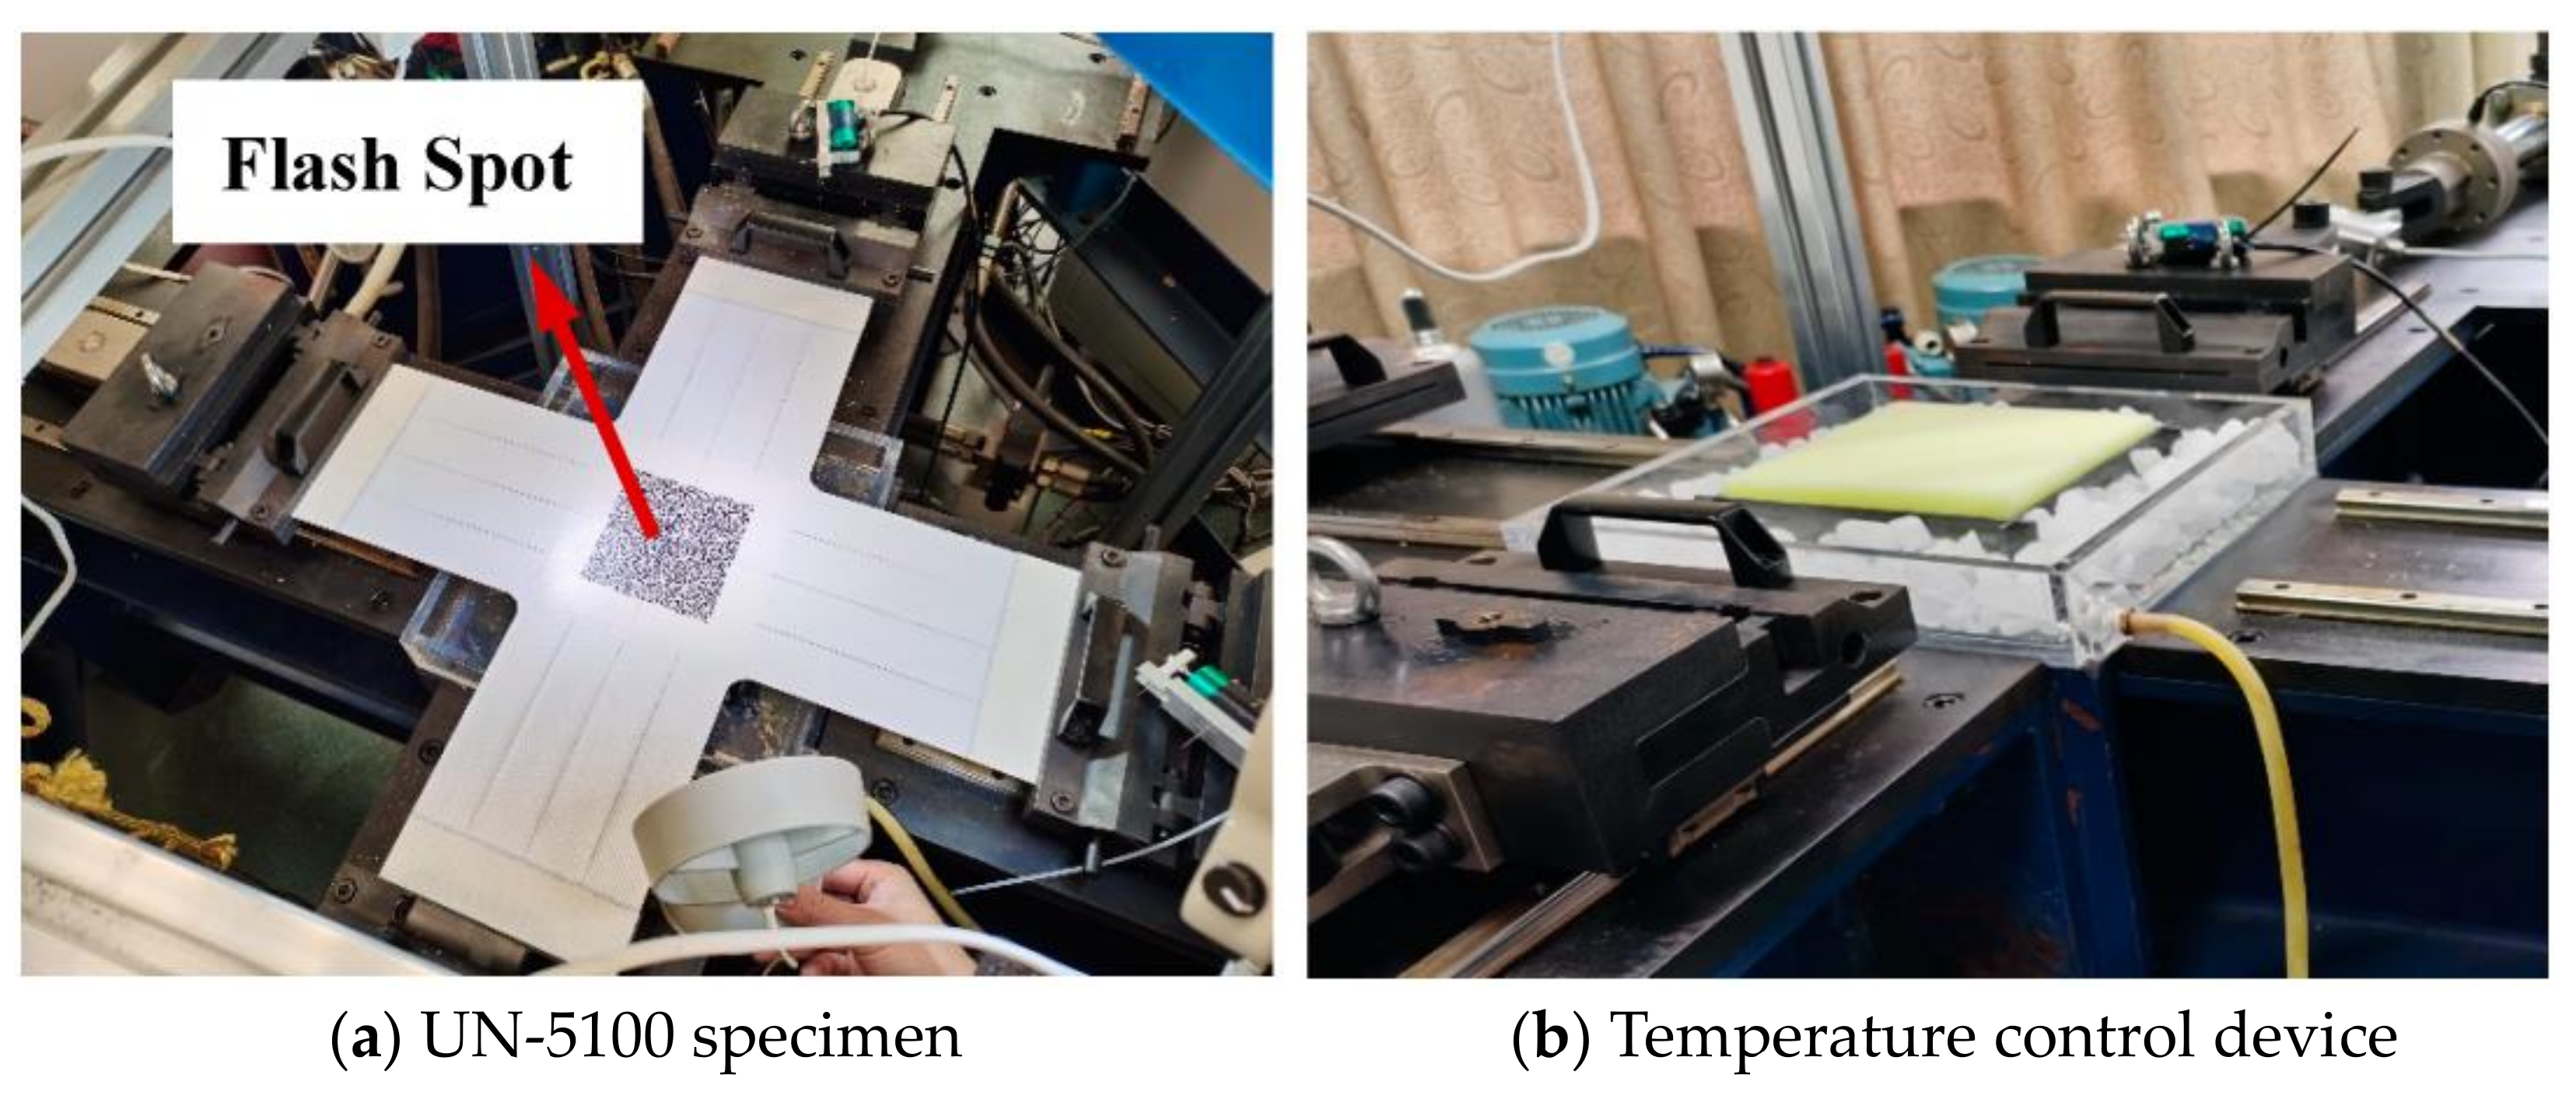
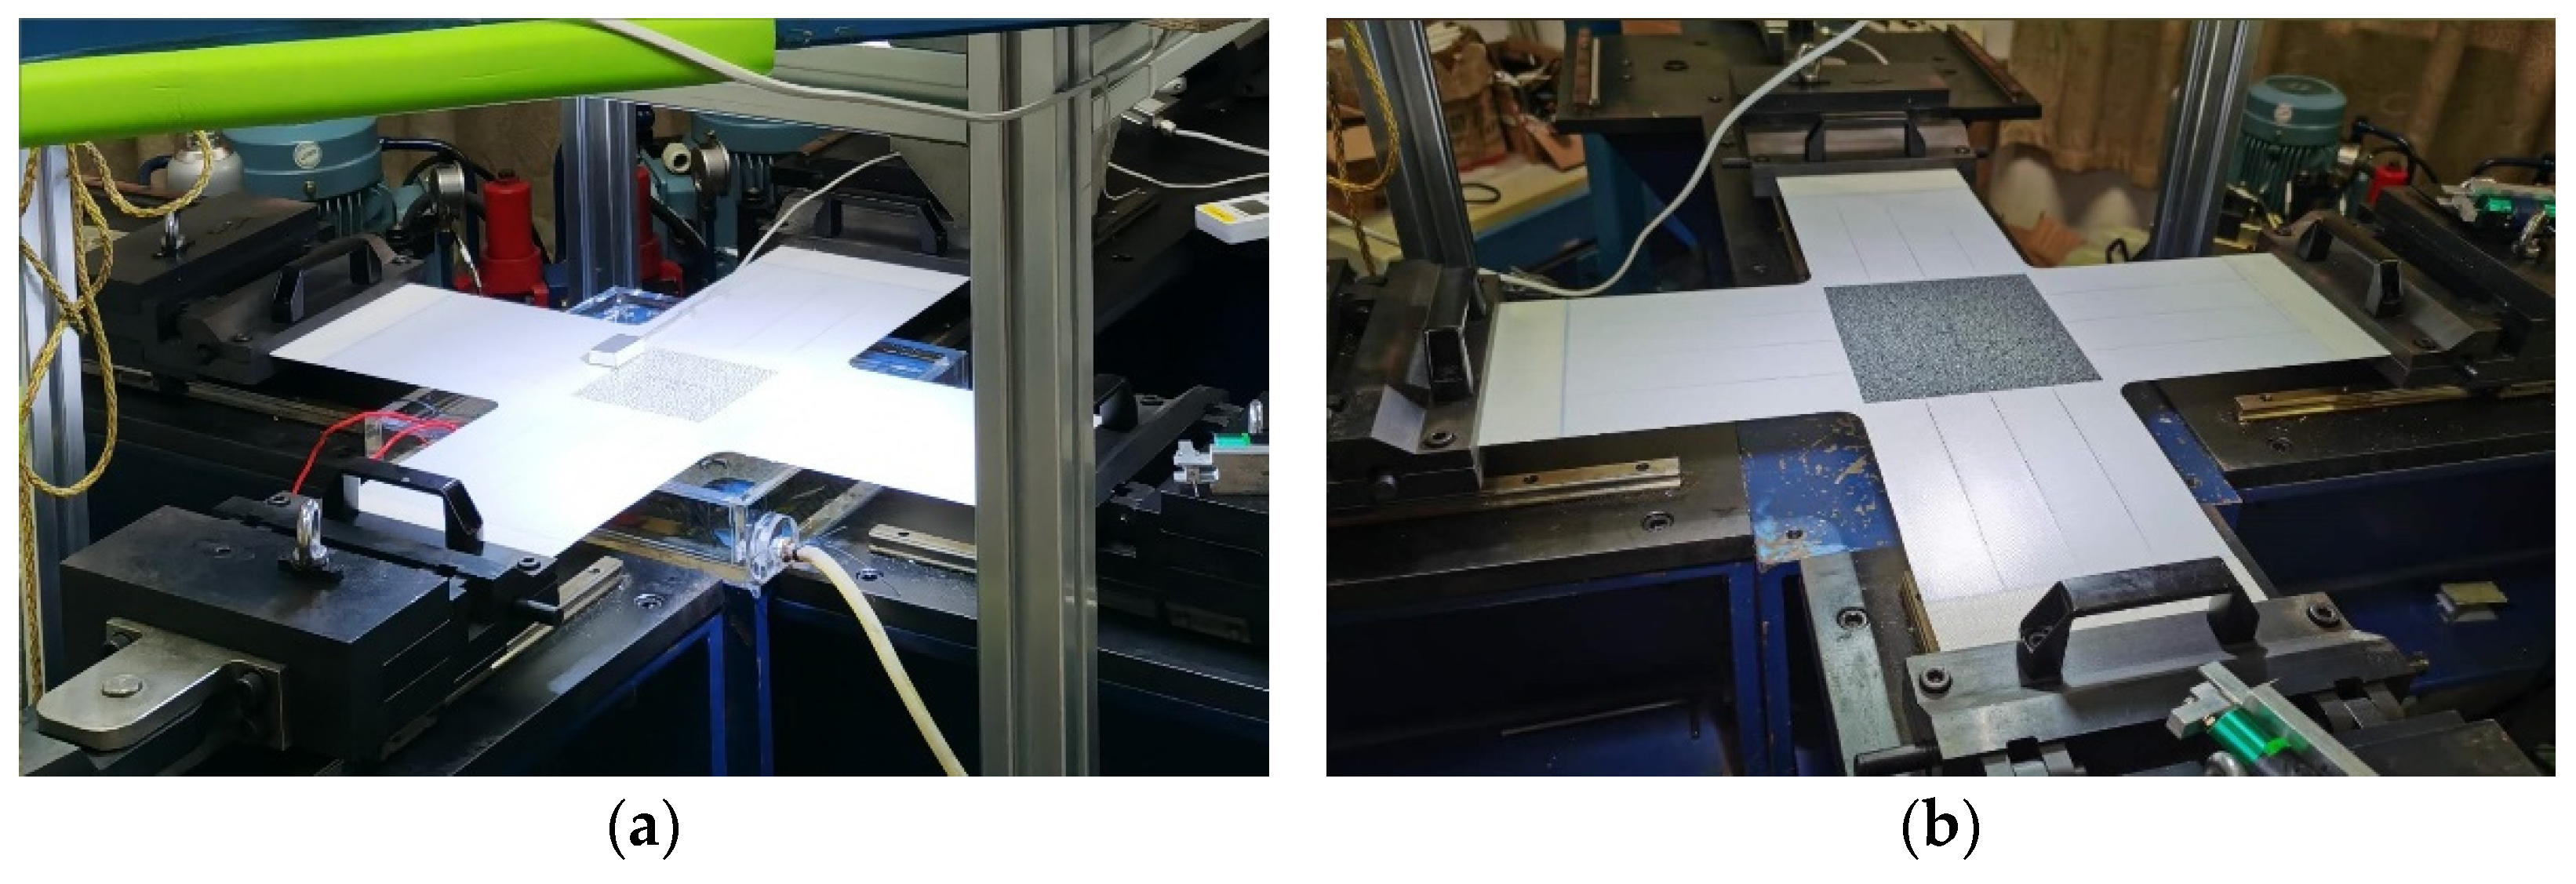
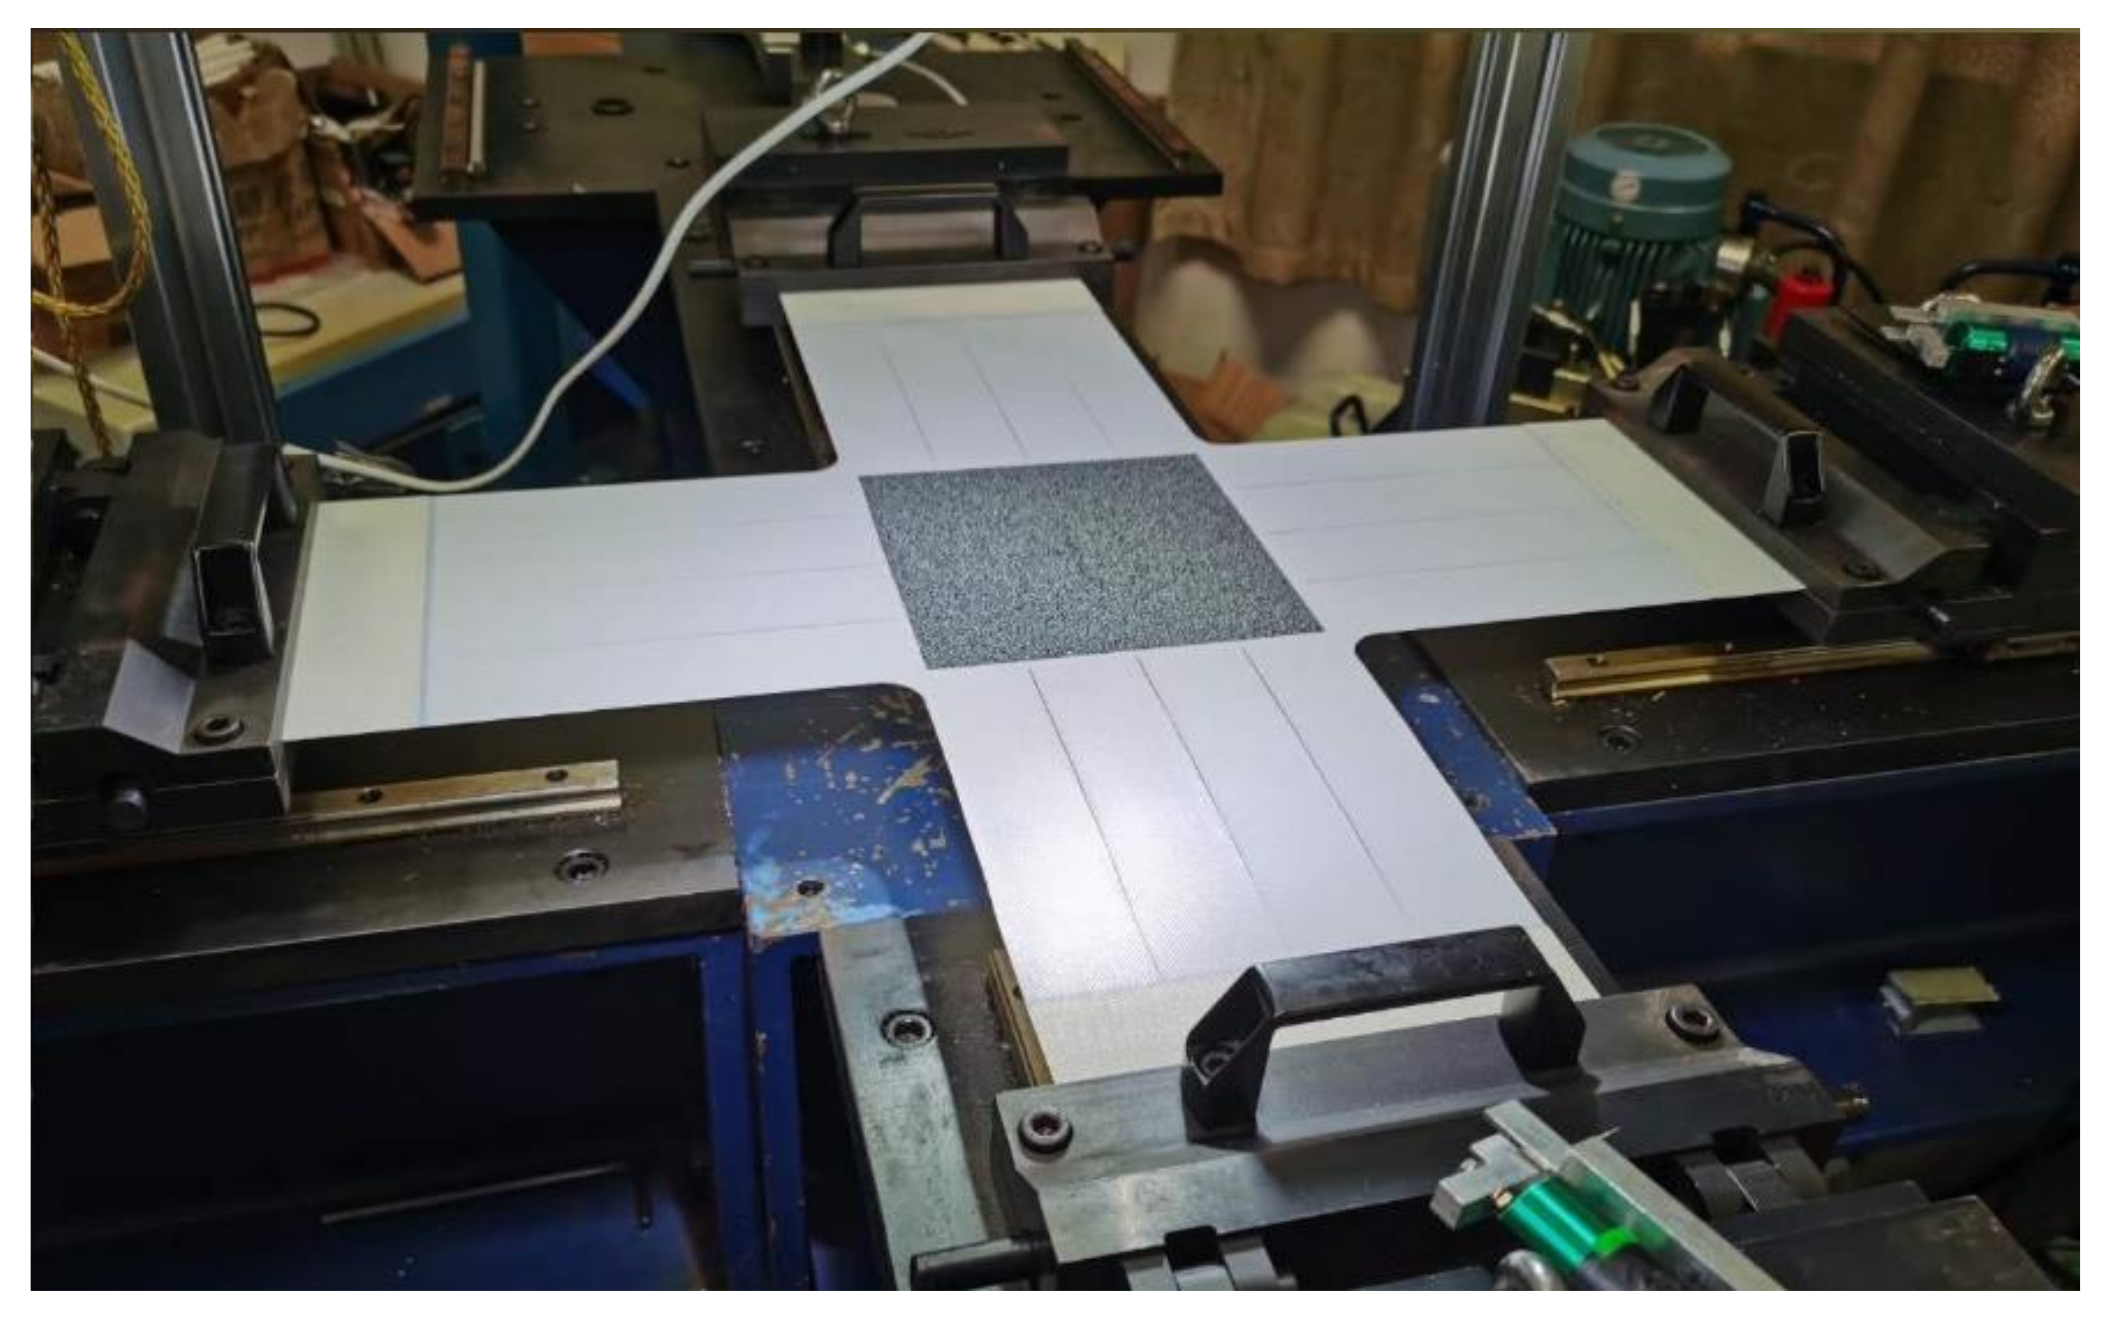
3.1. Experimental Material and Preparation

The material of the biaxial tensile cycle test is a UN-5100 membrane, and its main bearing structure is composed of Vectran fiber. The main material of the weathering layer and helium barrier layer is polyethylene terephthalate (PET).
The size of the specimen is shown in Figure 1.
The stress and strain data that are concerned in the biaxial tensile test were all taken from the central area of the specimen, and the central area of the specimen in Figure 2a is the flash spot. In order to realize the biaxial tensile test of the specimens at different temperatures, only the temperature of the central region of the specimen needs to be controlled.
The corresponding temperature control device is designed for the central area of the specimen, and the specific device is shown in Figure 2b.
The temperature control device is mainly composed of a temperature source container, a fixed baffle, and an absorbent sponge. Figure 3 shows the structure explosion diagram of the device. The external dimensions of the temperature source container are 290 × 290 × 50 mm, and its thickness is 10 mm, which is used to hold the cold source or heat source liquid in the container. The temperature source container is designed with a connecting hole to conveniently adjust the liquid level of the cold source or heat source during the experiment. The fixed baffle is used to set the sponge up to a certain height, and the baffle is designed with a flow hole for the liquid flow of the cold or heat source so as to realize the full contact between the sponge and the liquid. The size of the sponge is 160 × 160 × 20 mm, which is slightly larger than that of a flash spot. When the sponge is placed on the baffle, its upper surface is at the same height as the lower surface of the specimen. After the sponge fully absorbs the cold or heat source liquid, the liquid will automatically be adsorbed by the lower surface of the specimen due to the surface tension. According to the above methods, the surface temperature of the specimen can be controlled by maintaining the liquid temperature in the container of the temperature source.
The control of cold and heat sources in the temperature source vessels should be simple, stable, and easy to operate. In this work, water was used as the heat source, and the thermostat heating system was used to control the temperature of the heat source liquid, as seen in Figure 4a. The range of the thermostat heating system is 0 °C~150 °C. The cold source that was used is dry ice, the temperature of which can reach −78 °C. The combination of dry ice and 99% alcohol is a common cooling bath in chemical laboratories and creates a physical reaction. It was verified by testing whether the combination of dry ice and 99% alcohol can produce a stable low temperature of −75 °C and its duration is positively correlated with the amount of dry ice. The low-temperature duration of the temperature source container that was designed in this work can reach one hour after a one-time filling with dry ice and 99% alcohol, which is greater than the time required for the biaxial tensile cycle test at a stress ratio (30 min). The biaxial testing was carried out using a self-developed biaxial tensile testing machine (SJTU-I), as shown in Figure 4b.
This experiment followed the stress protocol shown in Figure 5. According to the maximum uniaxial tensile strength of the material provided by the manufacturer, a quarter of the maximum value was taken as the maximum value of the biaxial tension. In order to avoid the initial latitudinal and high latitudinal stresses, residual stresses of 200 N should be applied. The method also has the advantage of preventing the specimen from loosening in the initial state.

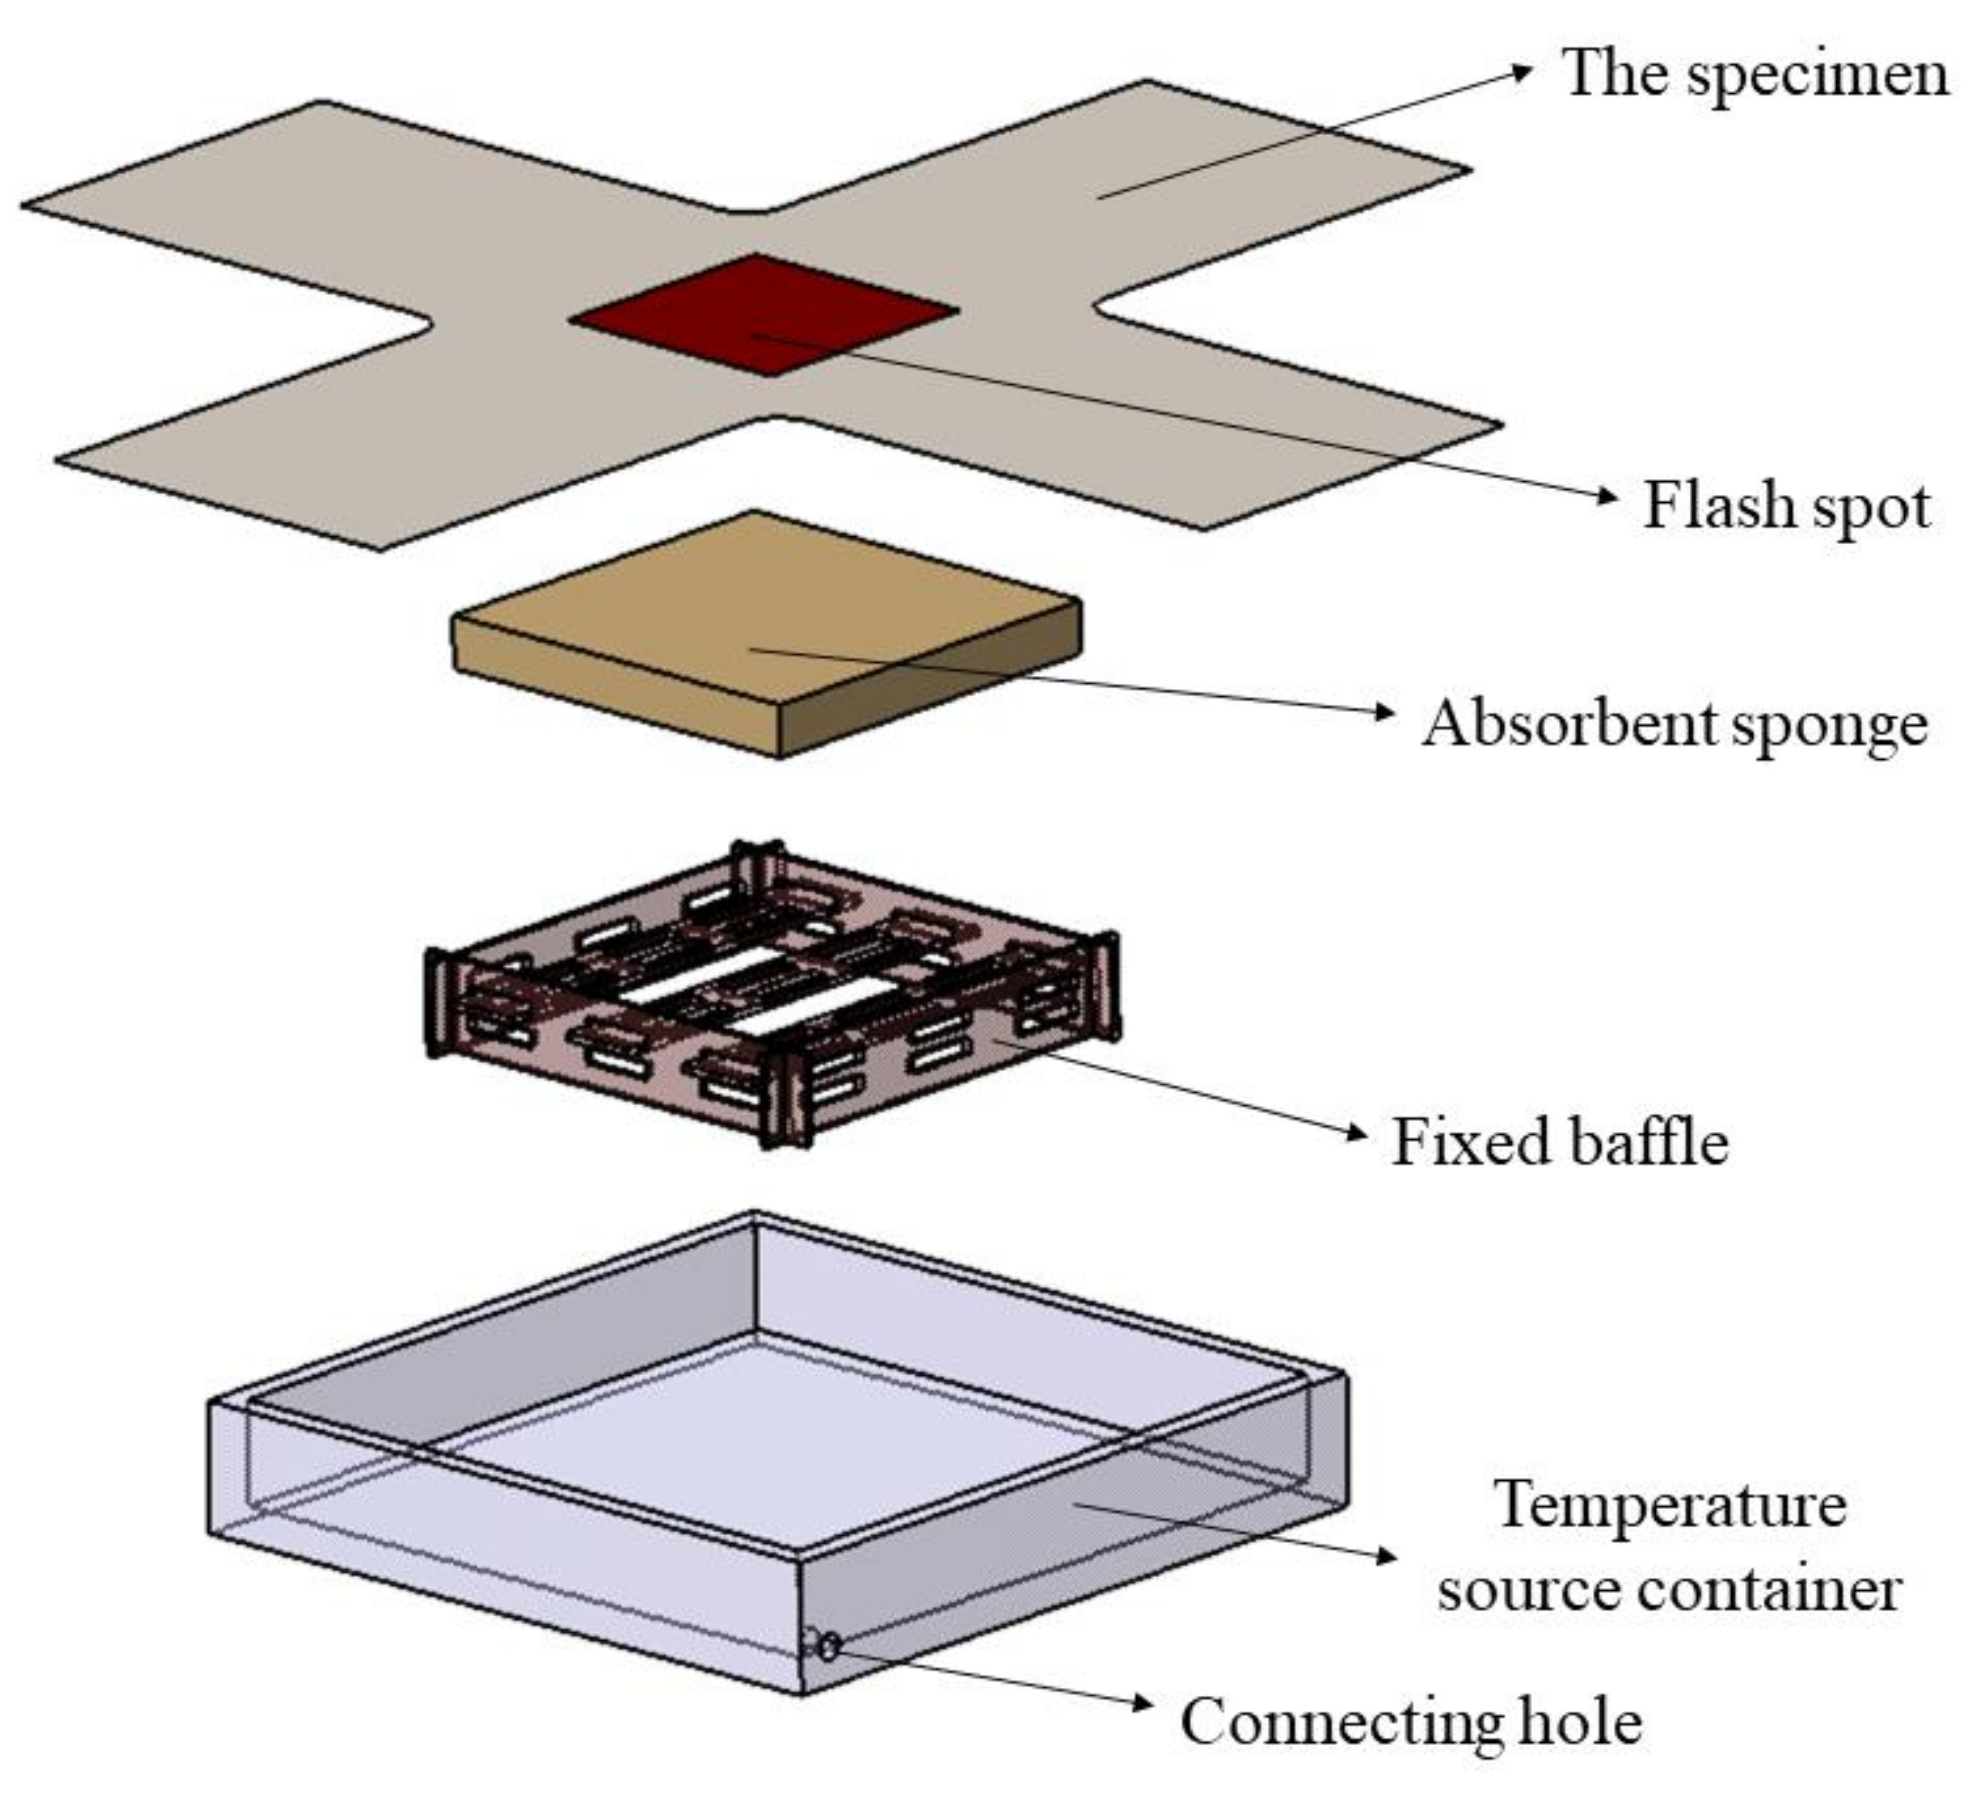
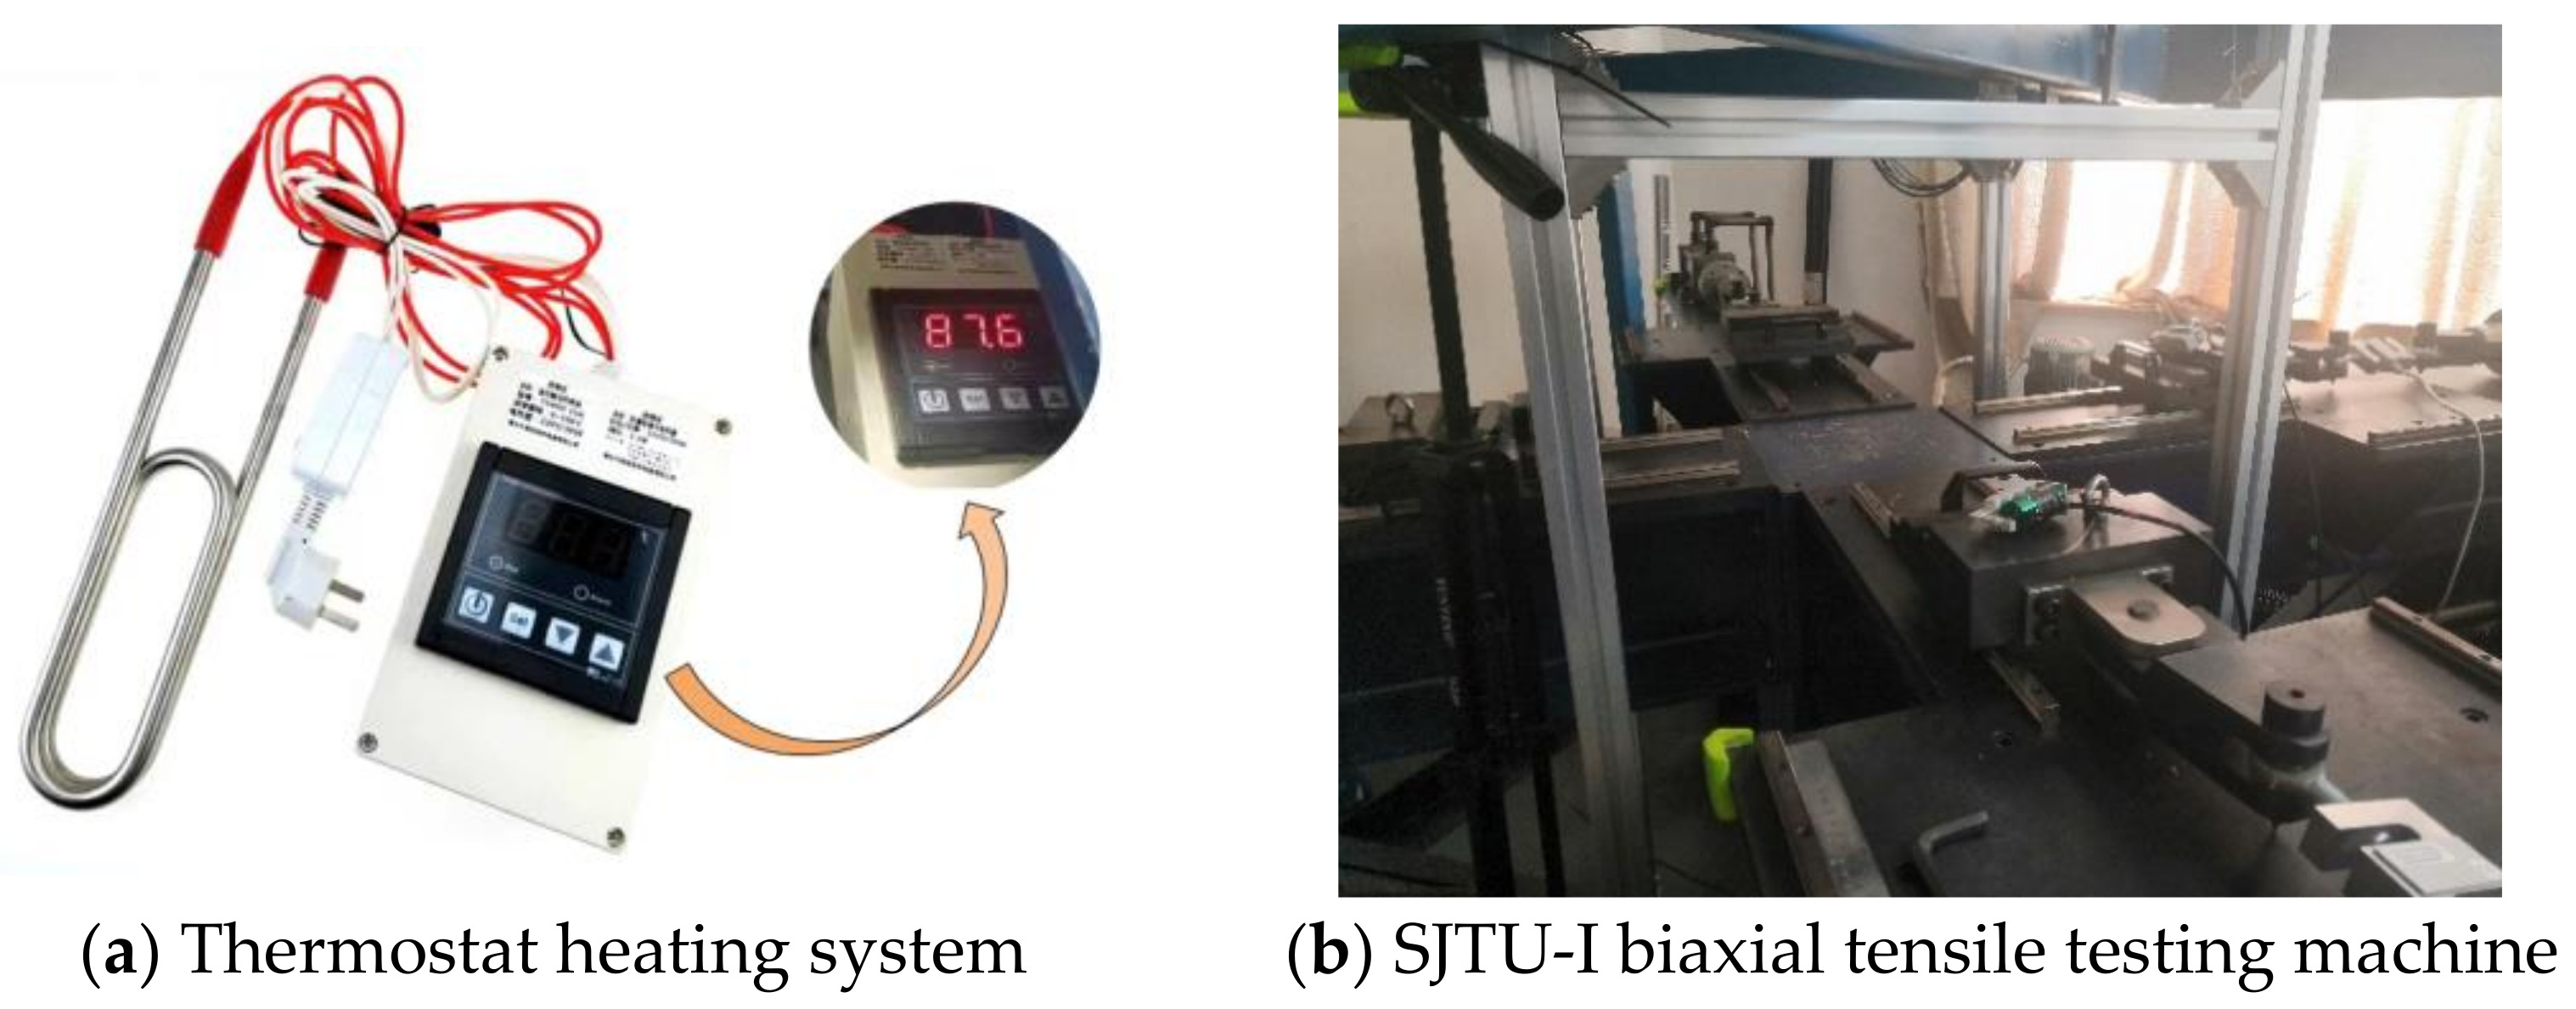
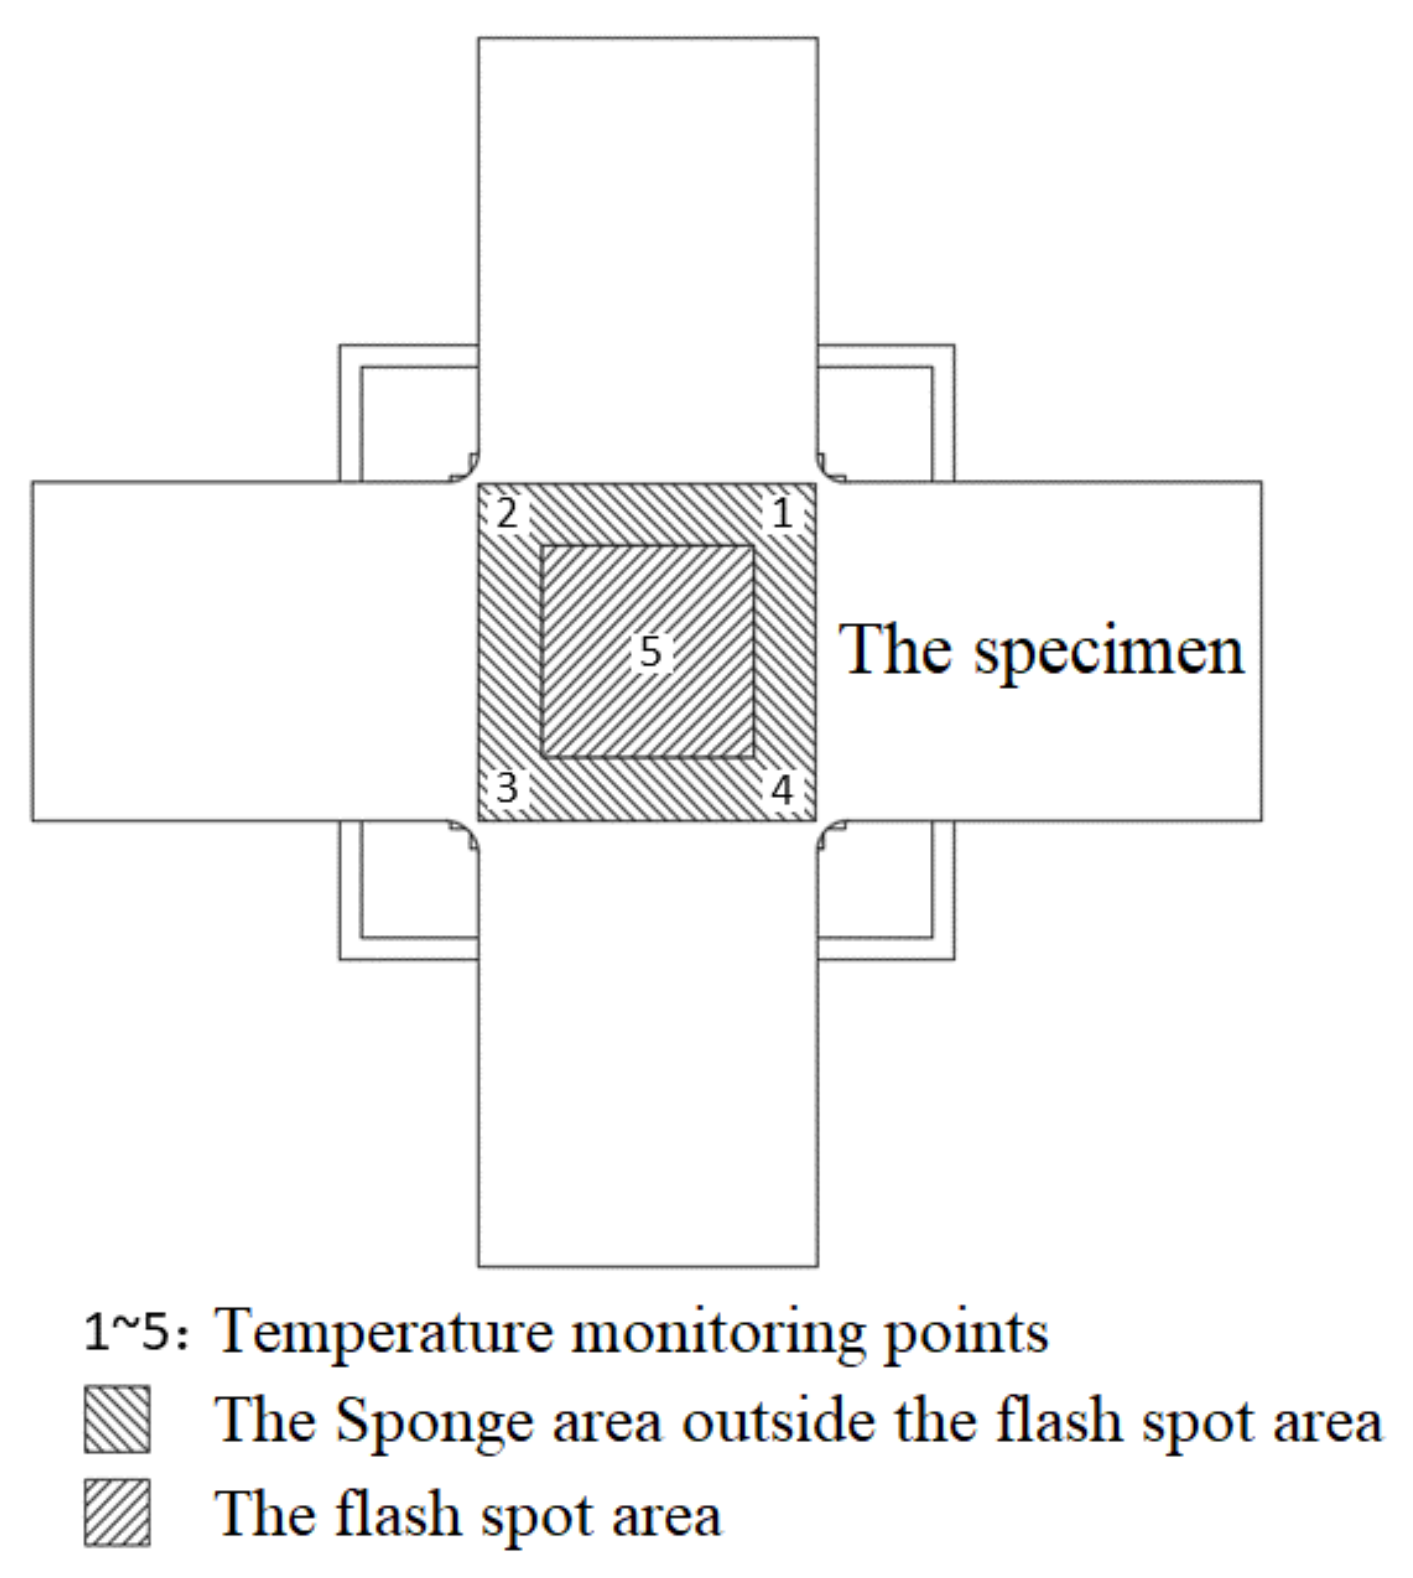
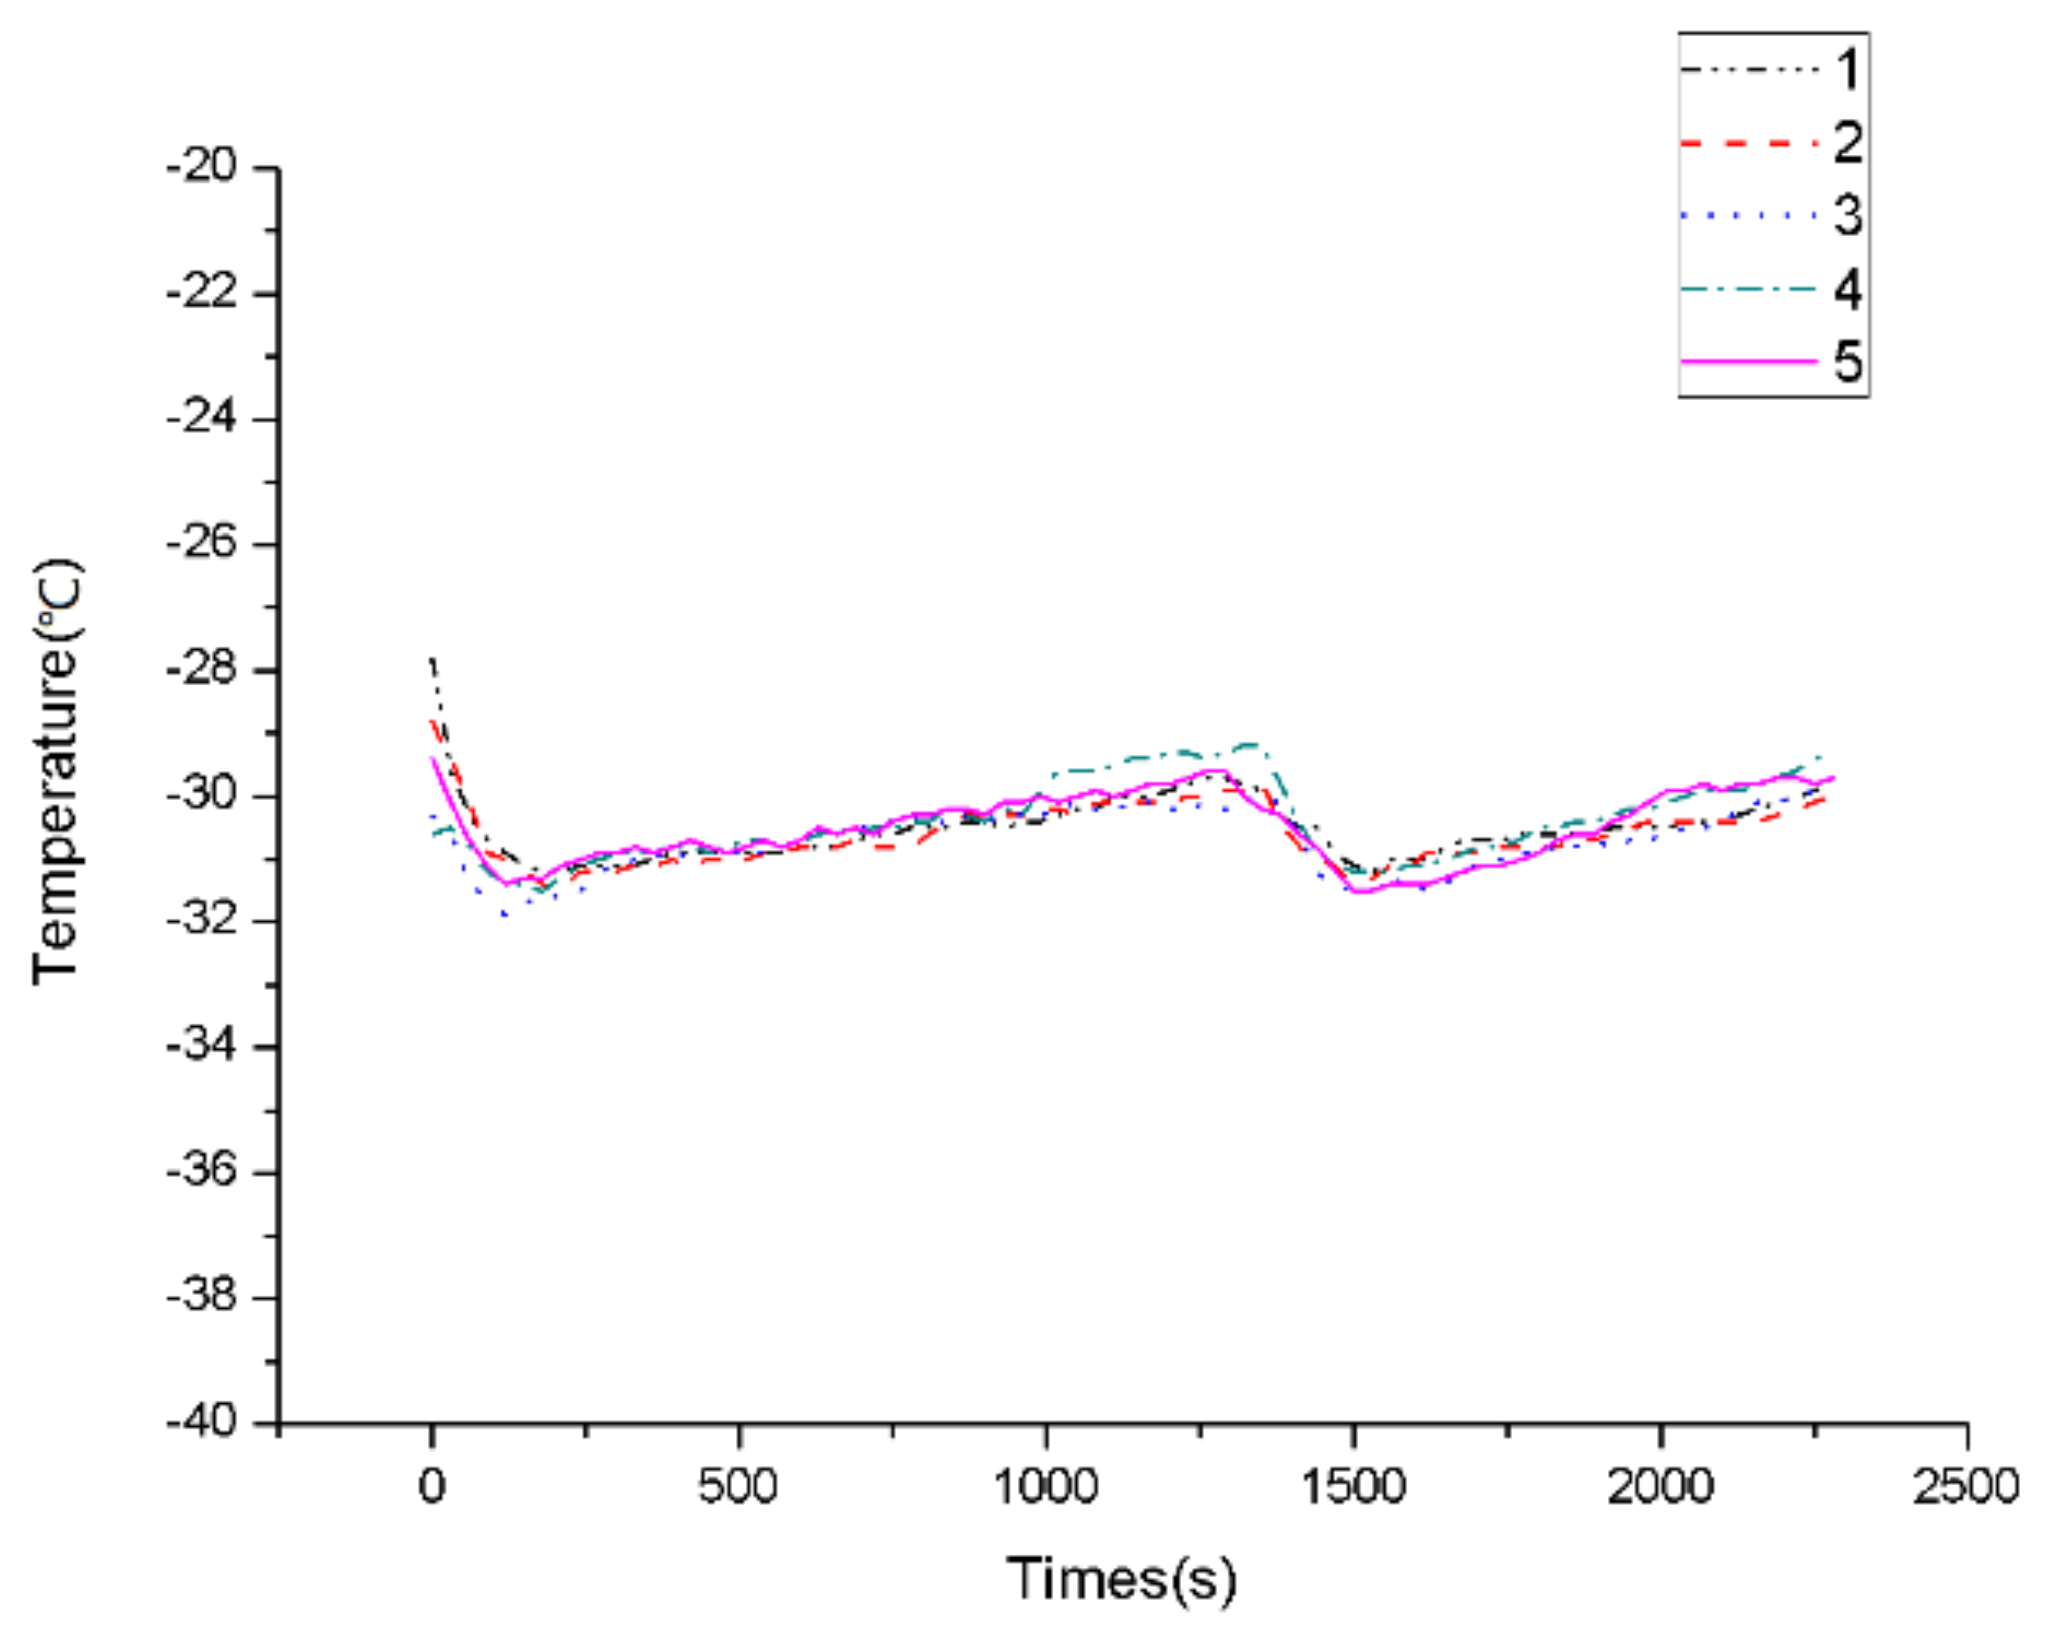
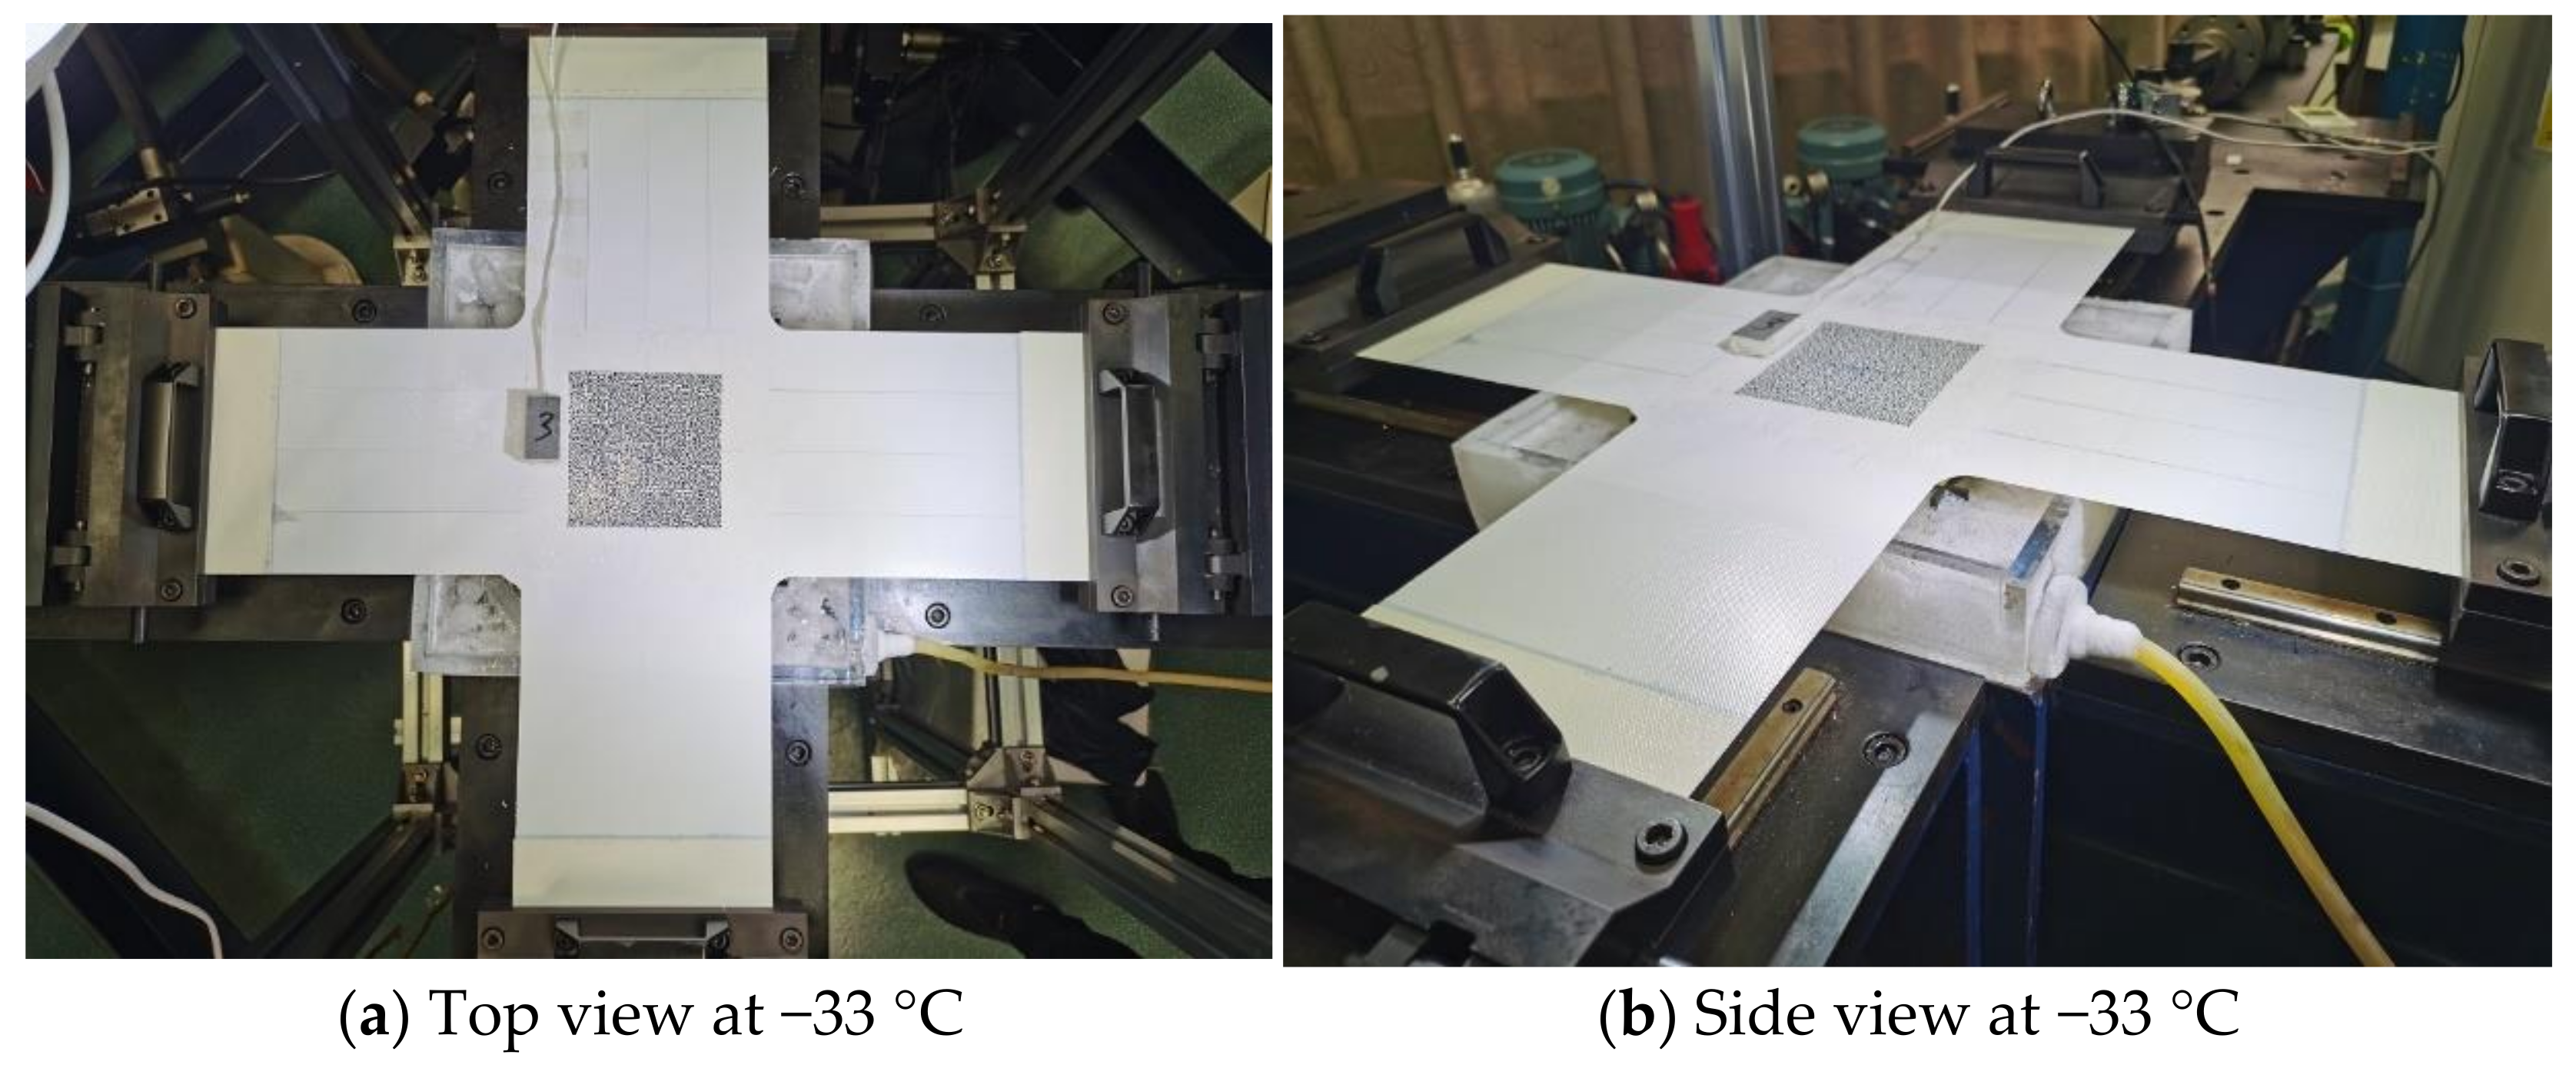
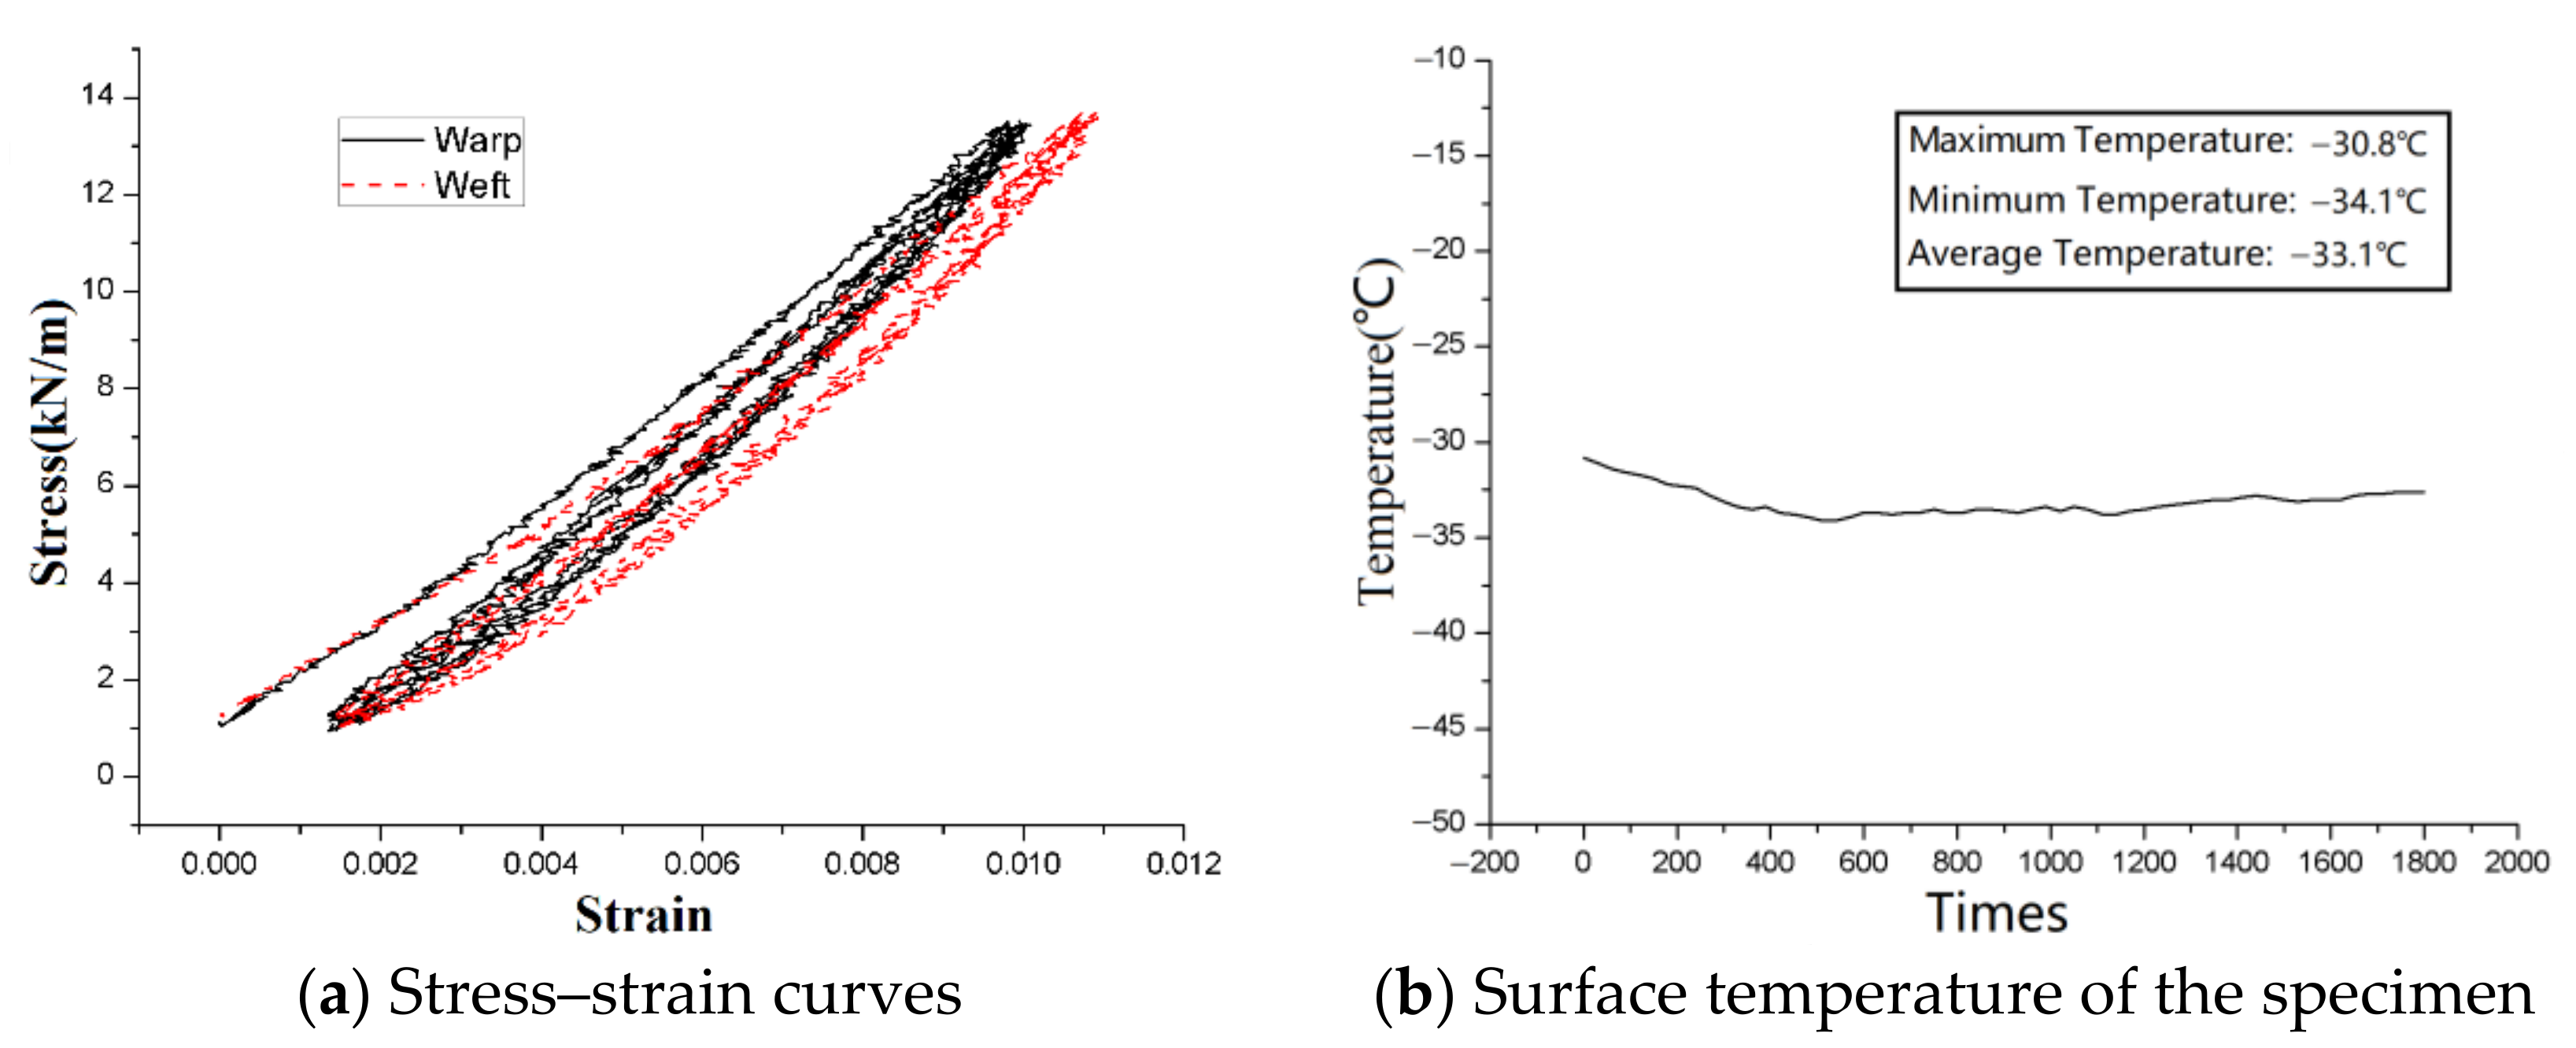
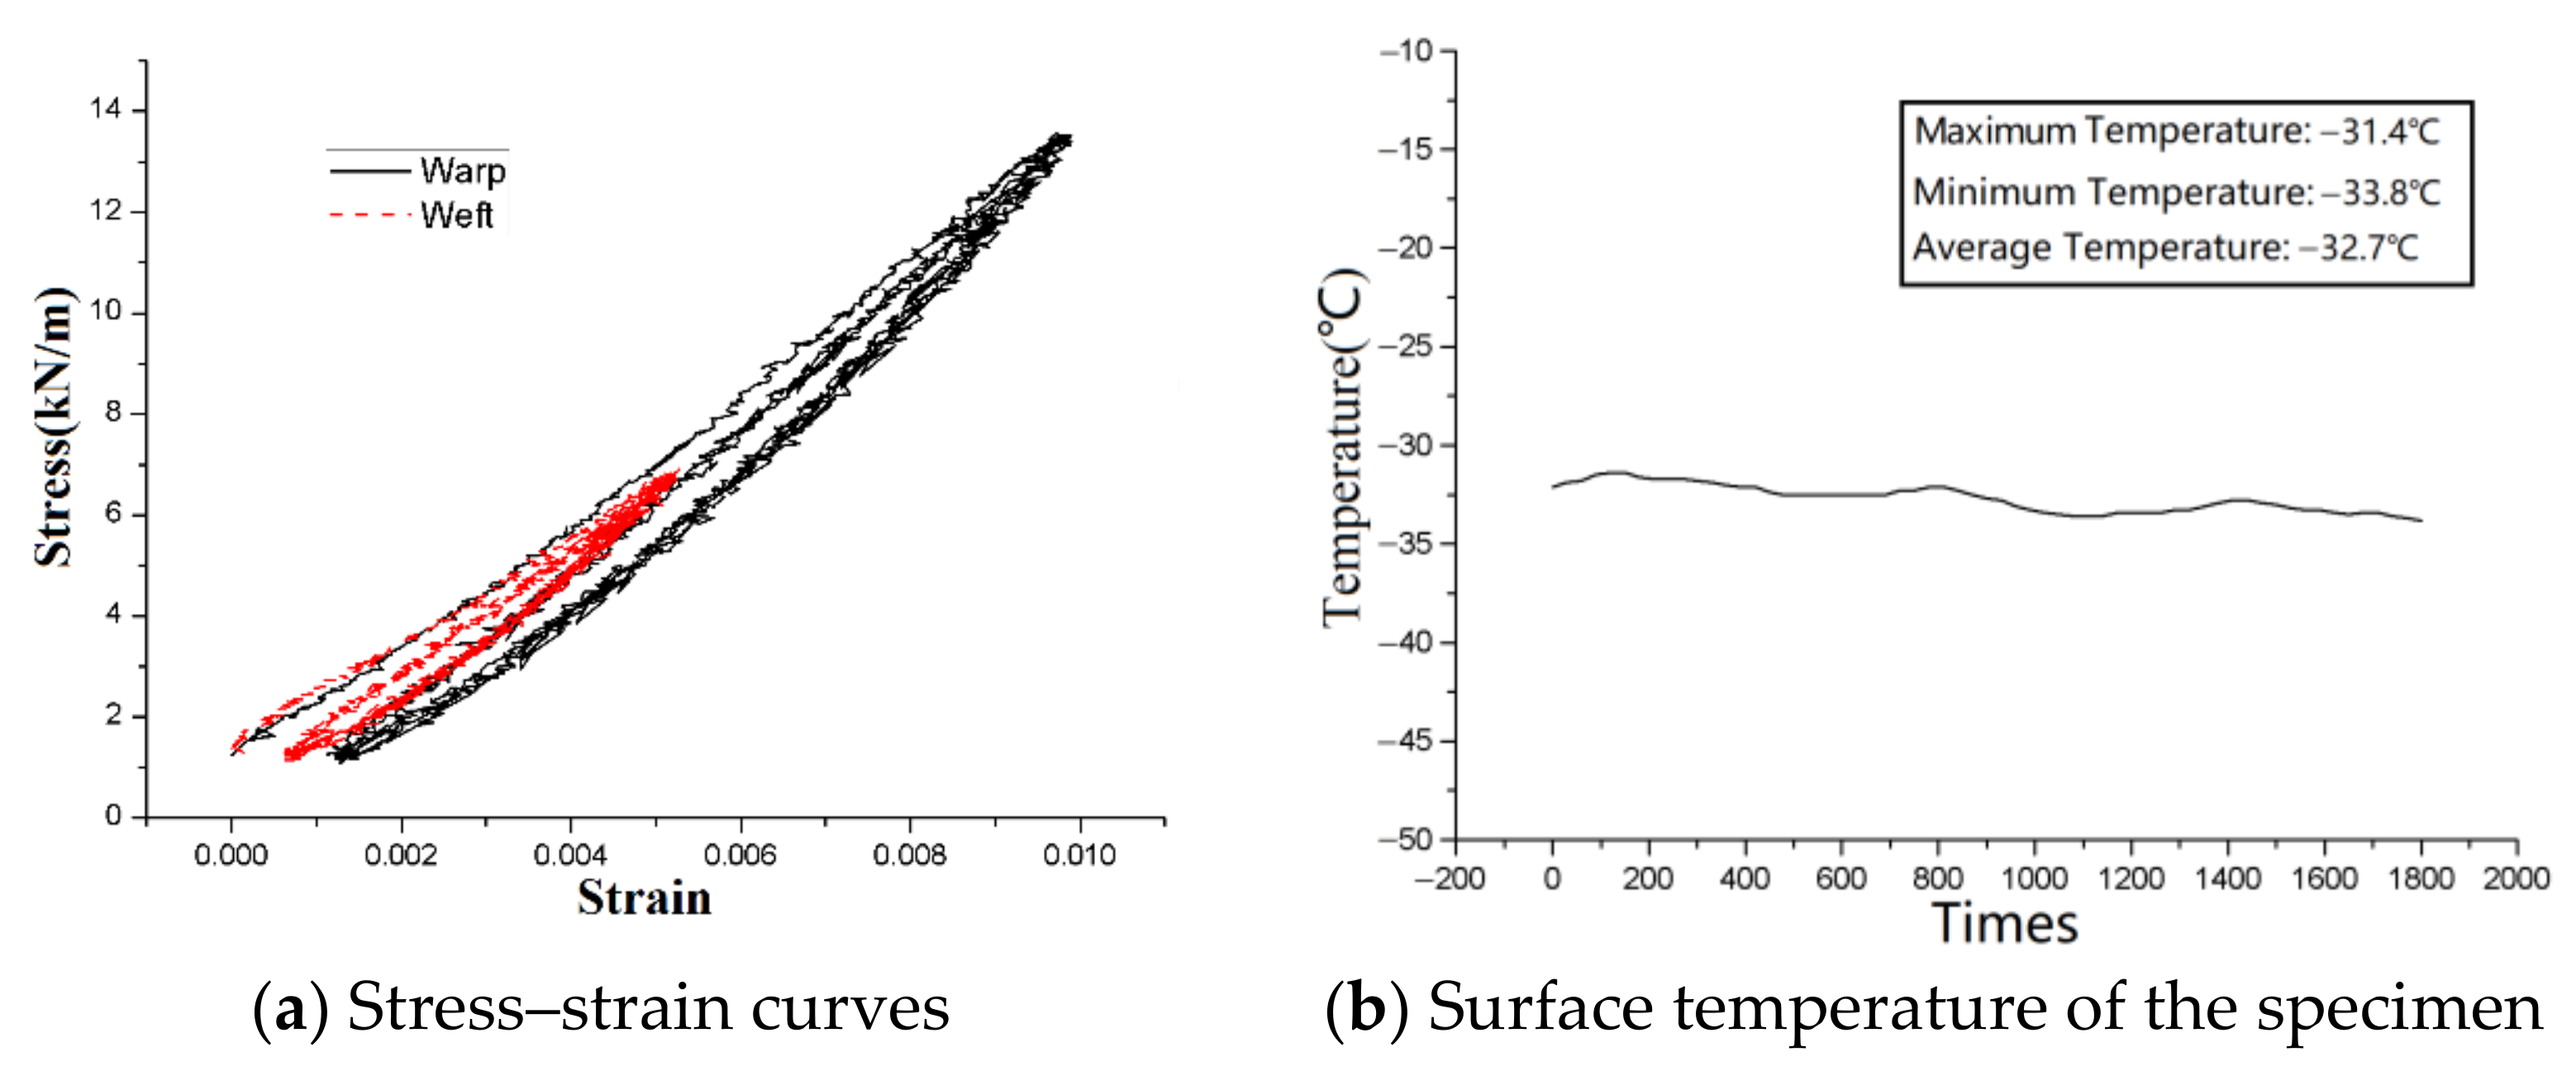
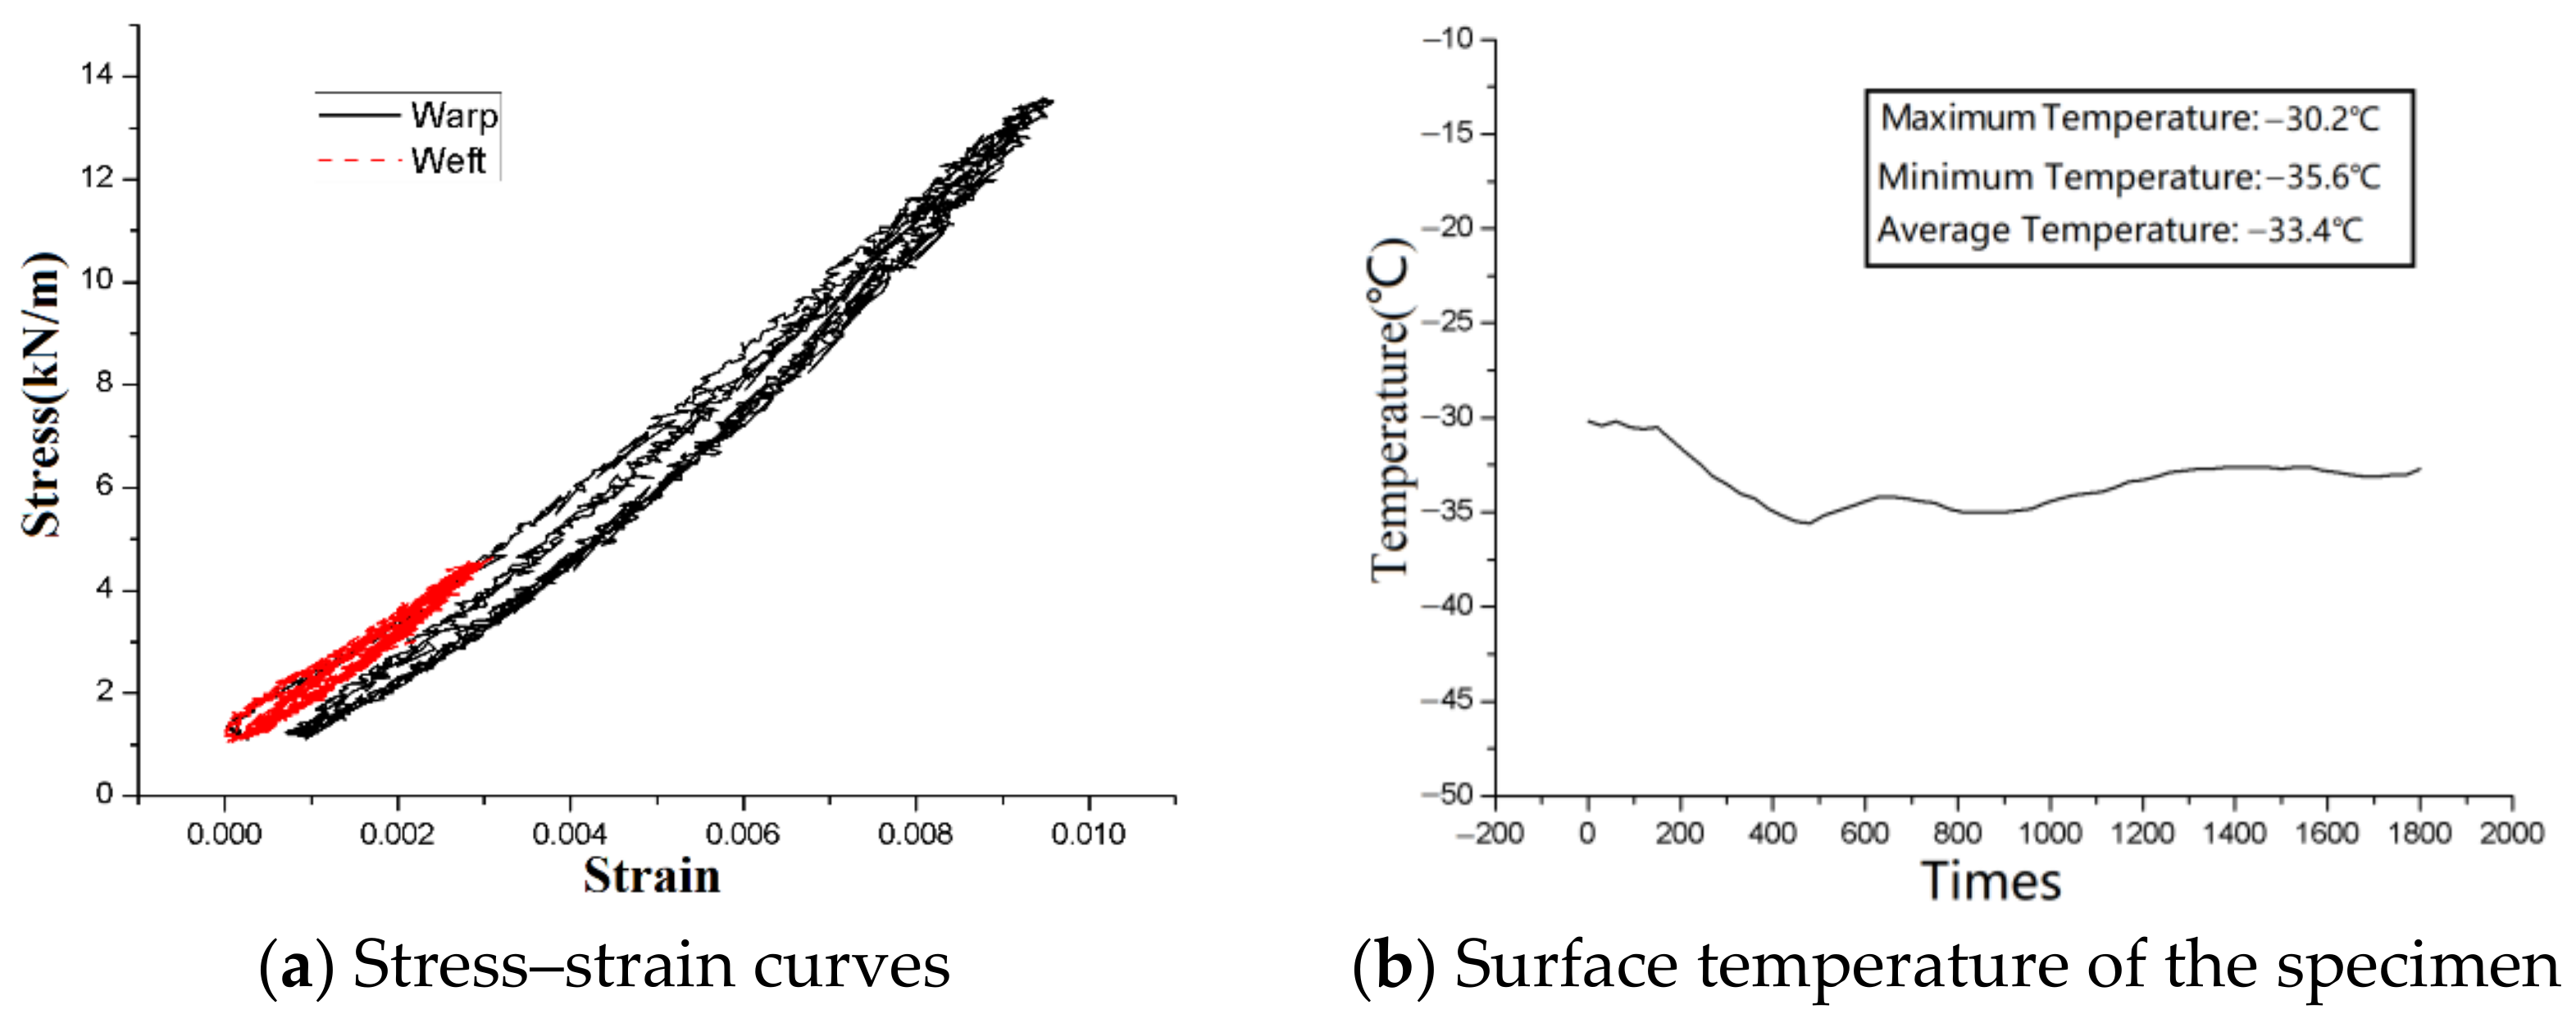
3.2. Verification of the Temperature Uniformity on the Specimen Surface

In the experiment, the temperature sensor is needed to monitor the surface temperature of the specimen. The fewer monitoring points, the better. The sponge size was designed to be larger than the flash spot range to ensure a uniform and stable temperature in the central strain test area of the specimen, so the sponge area outside the flash spot area can be used as one of the monitoring points. If the temperature in the sponge area is consistent, only one temperature sensor is needed to meet the temperature monitoring requirements. In order to verify the surface temperature uniformity of the specimen in the installation state, five temperature sensors (TempSir-VS 100) were used to monitor the temperatures of five temperature monitoring points in the central area of the specimen in the low-temperature environment. The distribution of the five temperature monitoring points is shown in Figure 6.
The temperature uniformity verification test was carried out on the specimen that was installed on the biaxial tensile machine, as shown in Figure 7a. In order to ensure the full contact of the temperature recorder’s temperature sensor with the surface of the specimen, the temperature sensor was wrapped with an insulation board and pasted onto the five temperature monitoring points of the specimen. The low-temperature environment was then selected: dry ice and 99% alcohol were added into the temperature source container of the temperature control box. This experiment can also verify whether the duration of the low temperature created by the cold source is sufficient. A TempSir-VS 100 temperature series instrument was used as a temperature sensor, which is an external RTD with a length of one meter, a temperature measuring range of −100 °C ~ +80 °C, and a temperature measuring accuracy of ˜s = 0.3 °C. This series of temperature sensors uses a 3.6 V Li battery and a USB that can record 16,000 temperature points and output an Excel file. The TempSir-VS 100 temperature recorder is shown in Figure 7b.
Figure 8 shows the temperature record curve of each temperature monitoring point.
As can be seen from the above figure, the temperature first dropped to −31 °C ~ −32 °C and then slowly rose to −29 °C. The temperature of the dry ice with 99% alcohol reached −75 °C. Due to the adsorption of the sponge, the liquid adsorbed by the upper part of the sponge had a certain distance from the liquid in the temperature source container and was in contact with the air and specimen, resulting in a temperature higher than −75 °C. The drop of the temperature oscillation in the figure occurred at the time of adding dry ice halfway through the experiment. During the experiment, this step can be carried out in the gap of changing the stress ratio to avoid a temperature oscillation. The experiment can adjust the content of dry ice according to the time required for stretching and generally ensure that the low-temperature time of each amount of added dry ice is greater than the time required for each stress ratio of 30 min. The temperature trend and value of each monitoring point were relatively close, which indicates that the temperature difference of each monitoring point was not large during the experiment. Monitoring point No. 5 was the main reference point for the temperature of the specimen, but the placement of the temperature sensor at this point during the experiment would have affected the measurement of the DIC non-contact strain. Therefore, considering that there is little difference between the five temperature monitoring points, monitoring point Nos. 1~4 were used to replace monitoring point No. 5 in the biaxial tensile test. The temperature transfer principle of the specimen at the high temperature was consistent with that at the low temperature, so the temperature uniformity verification at the low temperature was also applicable to the tensile test of the specimen at the high temperature; that is, the positions of monitoring point Nos. 1~4 were used to replace monitoring point No. 5.

3.3. Analysis of the Influence of the Device on the Experiment

In the temperature control device, the upper surface of the sponge is flat with the lower surface of the specimen, and the water absorbent sponge is used to transfer the temperature source liquid to the lower surface of the specimen to realize the temperature transfer. Although the sponge has no extrusion effect on the specimen in principle, the influence of humidity, liquid tension, or the possible expansion of the sponge on the specimen still needs to be considered. In this section, a comparative experiment with a temperature control device and specimens alone is designed to explore the influence of the temperature test chamber on the biaxial tensile test. This is shown in Figure 9.
The influence of the temperature control device on the specimen can be concluded by comparing the average mechanical properties parameters. According to the above theory, the experimental data were processed, and the elastic modulus and Poisson’s modulus were calculated, as shown in Table 1. From the calculation results, it can be seen that the elastic modulus that was measured with the temperature control device was similar to that without the temperature control device.

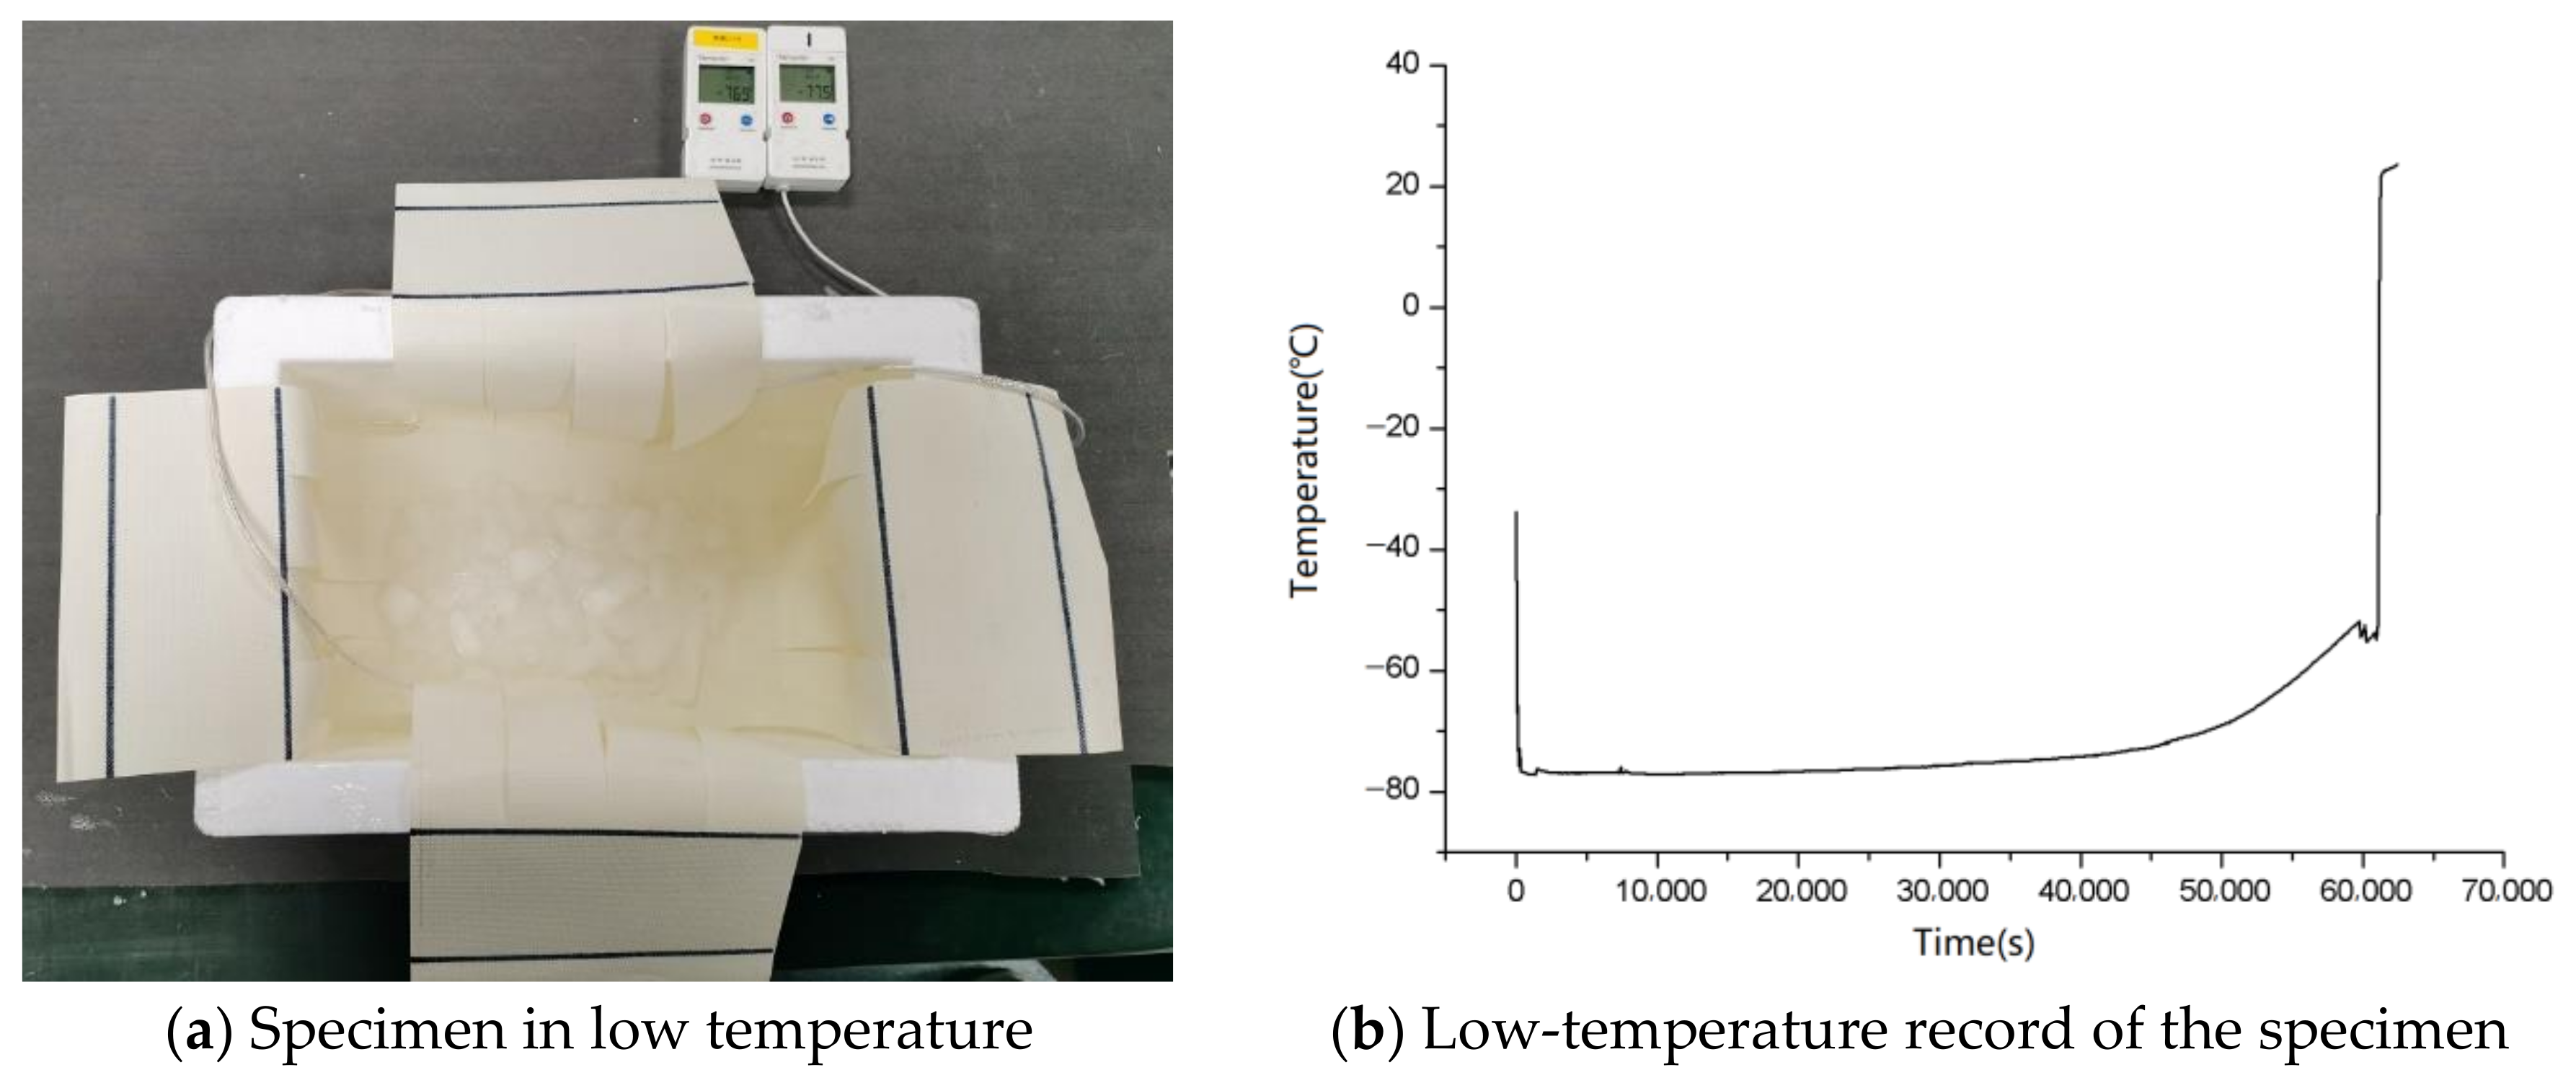
3.4. Analysis of the Influence of the Low-Temperature Alcohol Immersion Experience on the Specimens

Since alcohol was used in this study to create a low-temperature environment for the specimen, this section studied the effect of the alcohol on the specimen. The liquid’s temperature was measured and recorded by the temperature recorder. The dry ice and high-concentration ethanol in the incubator were arranged at the same time, and none were added midway. The low-temperature duration was 61,080 s, and the low-temperature range was −77.3~−52.4 °C. After the specimen was removed, the temperature returned to 23 °C, as shown in Figure 10.
After the specimen had returned to a normal temperature, the biaxial cyclic tensile test was carried out. Figure 11 shows the actual tensile situation of the specimen.
The corresponding mechanical property parameters were calculated as shown in Table 2. The results show that low temperature and alcohol have no or little influence on the average mechanical properties.

3.5. Biaxial Tensile Test at Low Temperatures

This section provides the stress–strain curve and the surface temperature curve of the specimen at −33 °C. (The stress–strain curves at 3 °C, 23 °C, 40 °C, and 80 °C are limited in length. A comparison with −33 °C will be made in the next section.) The liquid temperature in the temperature source container in the high-temperature environment can be accurately controlled by the temperature controller, while the liquid temperature in the temperature source container in the low-temperature environment is provided by dry ice and high-concentration alcohol, so the difficulty of low-temperature control is greater than that in the high-temperature environment. During the experiment, dry ice was continuously consumed as a carbon dioxide gas, and alcohol is also a volatile gas in the temperature source, so it was necessary to continuously supplement dry ice. In addition to adding dry ice, it was also necessary to add high-concentration alcohol in the experiment gap with different stress ratios, and the experiment could only be continued after the surface temperature of the specimen had reached the expected value. In addition to the decrease in the liquid level, long-time exposure to the air on the surface of the specimen would also cause an icing phenomenon. The treatment method in this study involved the use of alcohol-absorbent cotton to wipe the flash spot area at the interval of the camera shooting to ensure the clarity of the flash spot. Figure 12 shows the field experiment of the biaxial tension test at the low temperature.
The stress–strain curve and surface temperature of the specimen under different stress ratios are shown in Figure 13, Figure 14, Figure 15, Figure 16 and Figure 17.

4. Results and Discussion

The data of the third cycle under different temperatures were selected and the flash spot of the specimen was calculated using DIC image technology, and then the strain value under the corresponding stress was obtained. The stress–strain curves of different temperatures in longitude and latitude directions under different stress ratios were obtained as shown in Figure 18, Figure 19, Figure 20, Figure 21 and Figure 22.
From the comparison of the above curves, it can be seen that −33 °C is more prominent than the other temperature conditions under various stress ratios, and the strain is the smallest under the same stress. This shows that low temperatures have the most significant influence on the mechanical properties of the specimens. Under other temperature conditions, the slope of the stress–strain curve of each stress ratio is not obvious; that is, the environment above a normal temperature has a less significant effect on the mechanical properties of the UN-5100 membrane.
The mechanical properties of the membrane materials under different temperature conditions were counted, and the results in Table 3 were obtained. It can be seen from the table that the elastic modulus in the warp and weft decreases with the increase in the temperature. Above a normal temperature, the elastic modulus decreases slowly with the increase in the temperature and is less affected by temperature. In the low-temperature environment, the elastic modulus increases significantly, which indicates that the influence of the low-temperature environment on the membrane material is certain.

5. Conclusions

This study designed a temperature control device that is suitable for biaxial tension and that can realize the high and low temperatures of biaxial tension experiments. A series of verification tests were carried out to prove the effectiveness and rationality of the temperature control device. The biaxial tensile tests of UN-5100 membrane were carried out at −33 °C, 3 °C, 23 °C, 40 °C, and 80 °C. The following conclusions were obtained:
(1)
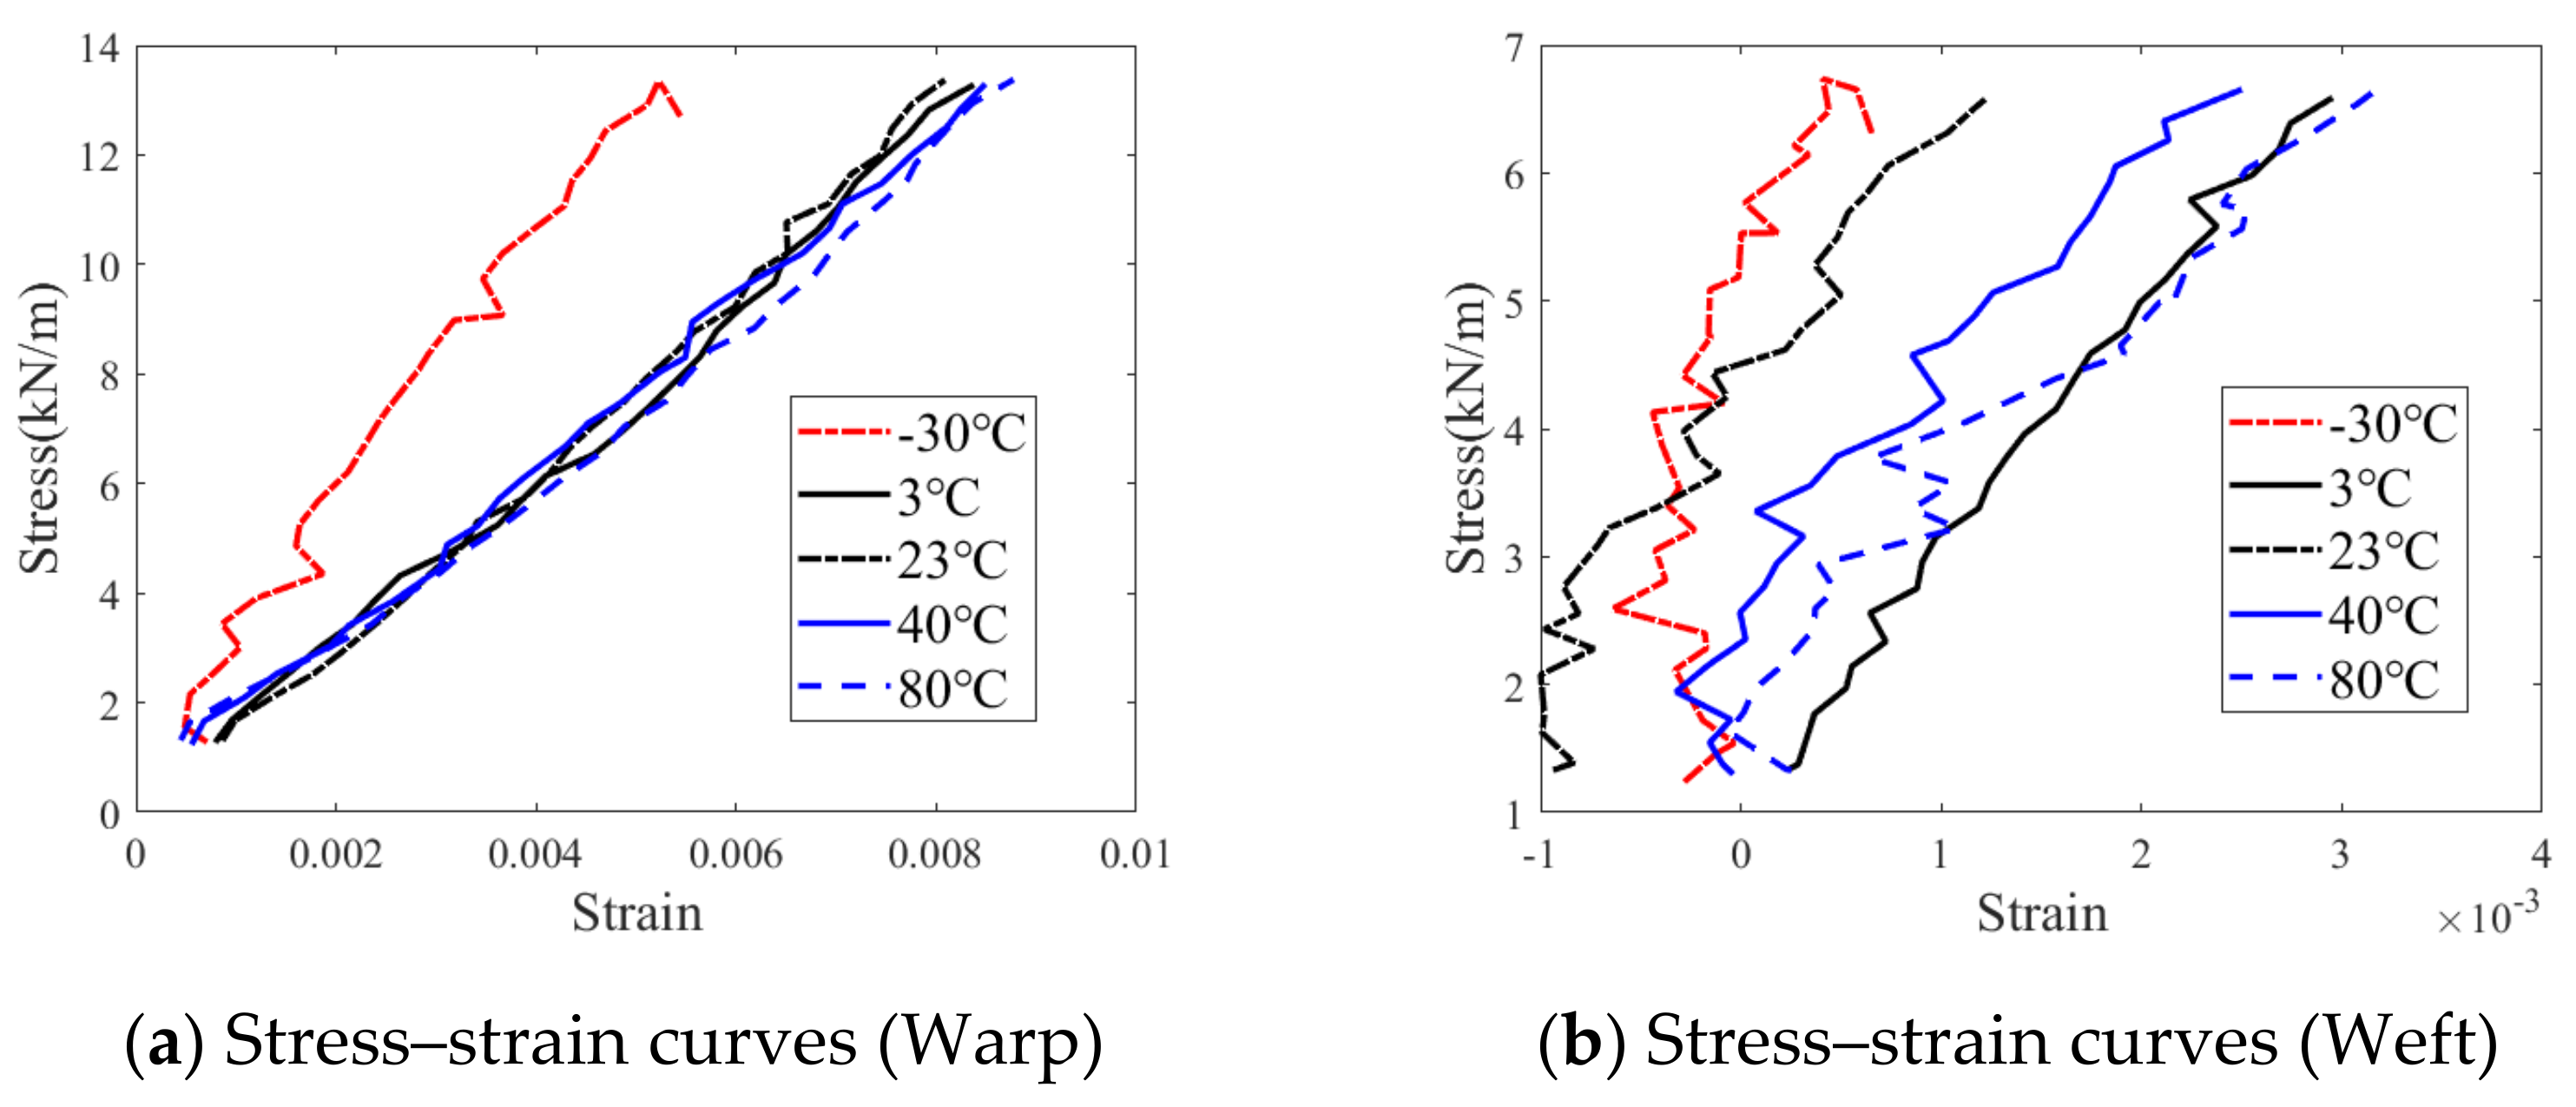
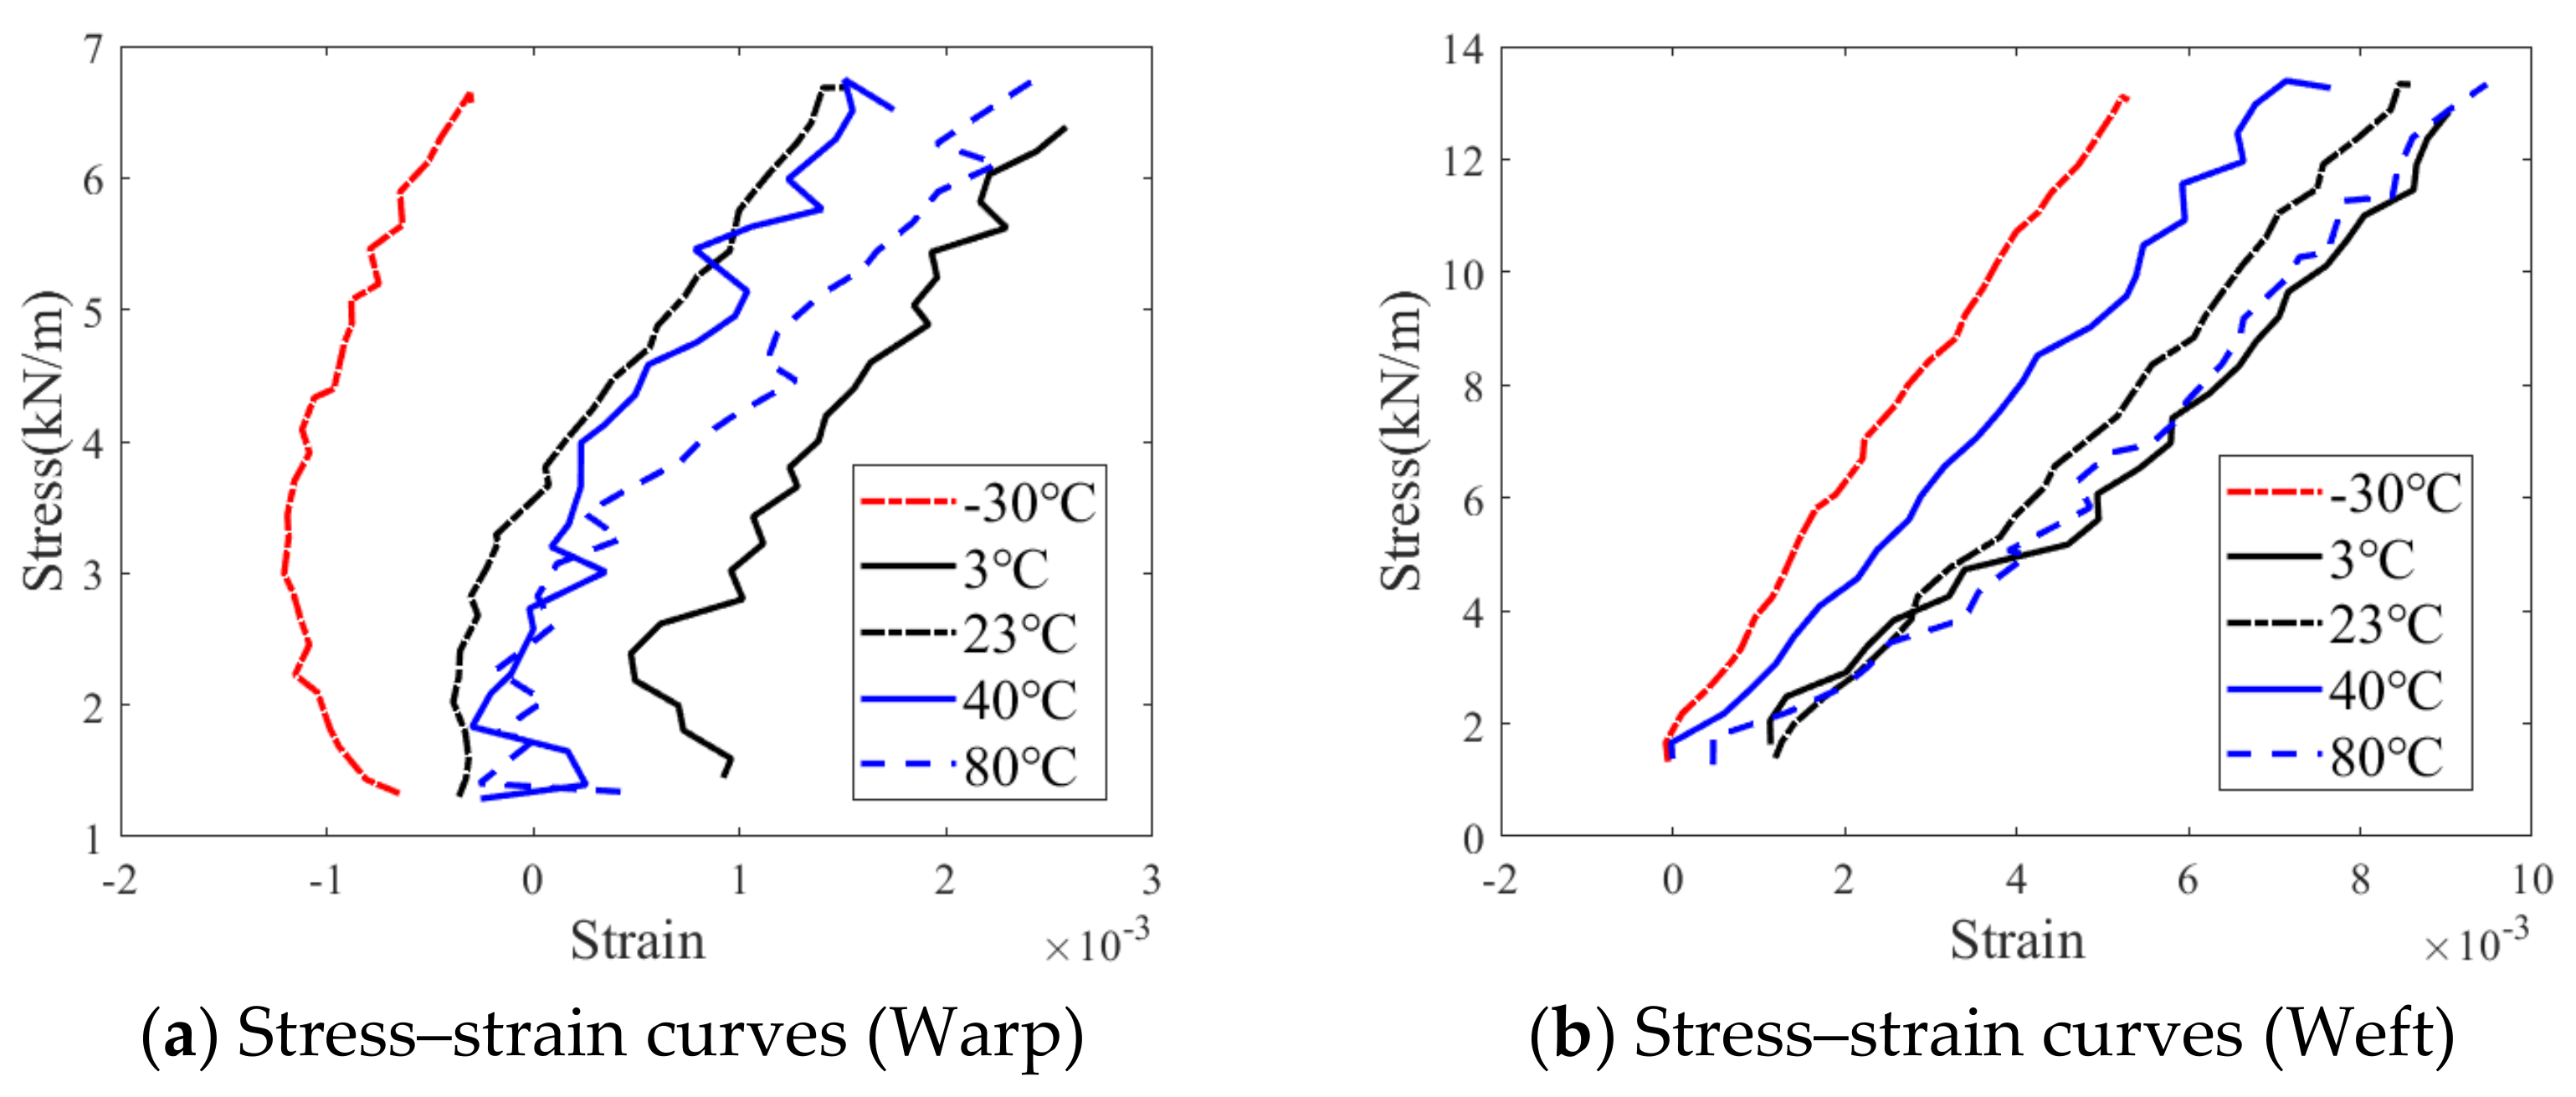
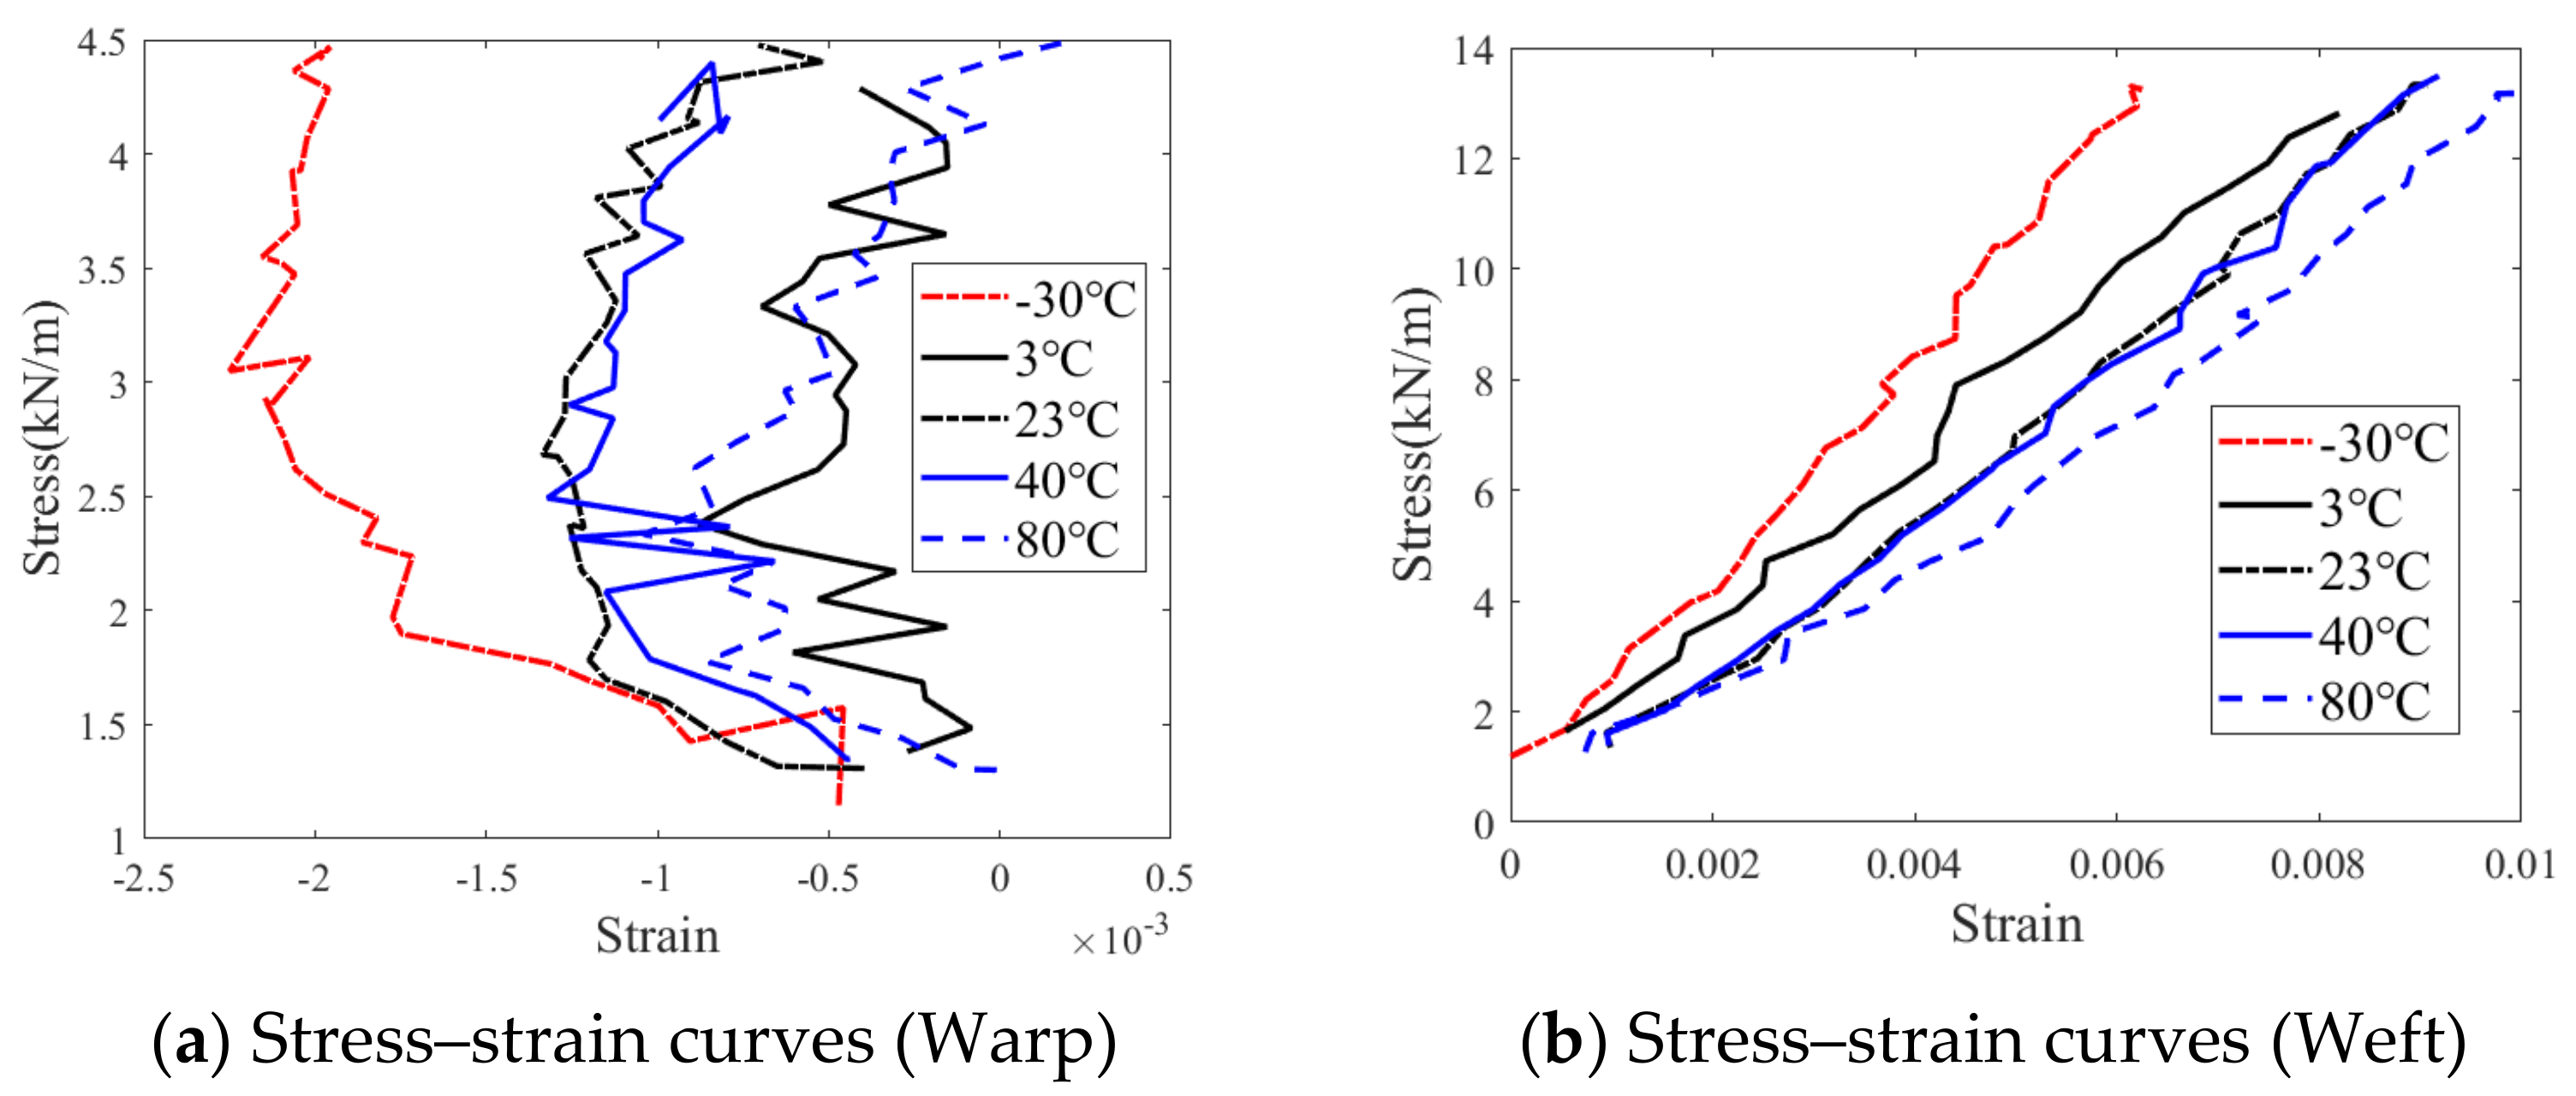
At each temperature, the stress–strain curves of the UN-5100 membrane in the low-stress direction shows a complex nonlinear relationship.
(2)
The elastic modulus of UN-5100 membrane materials show a similar change trend with the temperature, but the warp elastic modulus is always greater than the weft direction under all temperature conditions.
(3)
The elastic modulus and Poisson ratio of the materials at low temperatures are larger than those at high temperatures. This means that in a high-temperature environment, the material’s tolerable strength is reduced and is more prone to tensile damage.
(4)
Under low-temperature conditions, the warp elastic modulus of the membrane materials increased by 27.2% compared with the normal temperature, and the weft elastic modulus increased by 23.57%. At 80 °C, the elastic modulus decreased with rising temperature: the warp elastic modulus decreased by 12.53% and the weft elastic modulus decreased by 12.85% compared with that at room temperature.
There are two possible reasons for this phenomenon. One comes from the chemical point of view; that is, the low temperature affects the internal molecular structure of the fiber. Another is the effect of temperature on the structure size of the fiber, that is, the principle of thermal expansion and cold contraction. For near-space airships, the experimental results show that the increase in the elastic modulus of the near-space airship envelope material is conducive to its bearing strength at night under the influence of low temperatures. However, under high temperatures in the critical daytime, the pressure strength of the airship envelope materials decreases, and the pressure inside the envelope is greater, so it is more dangerous.

Author Contributions

Conceptualization, W.X. and X.W.; methodology, X.W.; software, W.X.; validation, J.T., X.W. and J.W.; formal analysis, W.X.; investigation, Y.C.; resources, Y.C.; data curation, X.W.; writing—original draft preparation, W.X.; writing—review and editing, J.T.; visualization, W.X.; supervision, J.T.; project administration, J.T.; funding acquisition, X.W. All authors have read and agreed to the published version of the manuscript.

Funding

This work was sponsored by the National Natural Science Foundation of China under Grant No. 61733017 and Grant No. 51906141, the Shanghai Science Foundation of China (Grant No. 18ZR1419000), and the Program of Shanghai Academic/Technology Research Leader (Project No. 20XD1430400).

Institutional Review Board Statement

Not applicable.

Informed Consent Statement

Not applicable.

Data Availability Statement

Not applicable.

Conflicts of Interest

The authors declare no conflict of interest.

References

  1. Zhang, L.; Li, J.; Jiang, Y.; Du, H.; Zhu, W.; Lv, M. Stratospheric airship endurance strategy analysis based on energy optimization. Aerosp. Sci. Technol. 2020, 100, 105794. [Google Scholar] [CrossRef]
  2. Manikandan, M.; Pant, R.S. Design optimization of a tri-lobed solar powered stratospheric airship. Aerosp. Sci. Technol. 2019, 91, 255–262. [Google Scholar] [CrossRef]
  3. Tang, J.; Duan, D.; Xie, W. Shape Exploration and Multidisciplinary Optimization Method of Semirigid Nearing Space Airships. J. Aircr. 2022, 59, 946–963. [Google Scholar] [CrossRef]
  4. Tang, J.; Wang, X.; Duan, D.; Xie, W. Optimisation and analysis of efficiency for contra-rotating propellers for high-altitude airships. Aeronaut. J. 2019, 123, 706–726. [Google Scholar] [CrossRef]
  5. Tang, J.; Pu, S.; Yu, P.; Xie, W.; Li, Y.; Hu, B. Research on Trajectory Prediction of a High-Altitude Zero-Pressure Balloon System to Assist Rapid Recovery. Aerospace 2022, 9, 622. [Google Scholar] [CrossRef]
  6. Zhang, L.; Zhu, W.; Du, H.; Lv, M. Multidisciplinary design of high altitude airship based on solar energy optimization. Aerosp. Sci. Technol. 2021, 110, 106440. [Google Scholar] [CrossRef]
  7. Yang, Y.; Xu, X.; Zhang, B.; Zheng, W.; Wang, Y. Bionic design for the aerodynamic shape of a stratospheric airship. Aerosp. Sci. Technol. 2020, 98, 105664. [Google Scholar] [CrossRef]
  8. Gonzalo, J.; Domínguez, D.; García-Gutiérrez, A.; Escapa, A. On the development of a parametric aerodynamic model of a stratospheric airship. Aerosp. Sci. Technol. 2020, 107, 106316. [Google Scholar] [CrossRef]
  9. Xie, W.C.; Wang, X.L.; Duan, D.P.; Tang, J.W. Finite Element Simulation of the Microstructure of Stratospheric Airship Envelopes. AIAA J. 2020, 58, 3690–3699. [Google Scholar] [CrossRef]
  10. Li, D. Environment Control for Stratospheric Airship. Spacecr. Recovery Remote Sens. 2006, 51–56. [Google Scholar] [CrossRef]
  11. Cheng, C. Transient Thermal Model and Thermal Characteristics Analysis of Near-Space Airships. Master’s Thesis, Shanghai Jiao Tong University, Shanghai, China, 2019. [Google Scholar]
  12. Wang, X.; Xie, W. Thermal Characteristics Analysis of Stratospheric Airships Envelope. Equip. Environ. Eng. 2020, 1, 13–19. [Google Scholar]
  13. Tang, J.; Xie, W.; Wang, X.; Chen, C. Simulation and Analysis of Fluid–Solid–Thermal Unidirectional Coupling of Near-Space Airship. Aerospace 2022, 9, 439. [Google Scholar] [CrossRef]
  14. Kang, W.; Suh, Y.; Woo, K.; Lee, I. Mechanical property characterization of film-fabric laminate for stratospheric airship envelope. Compos. Struct. 2006, 75, 151–155. [Google Scholar] [CrossRef]
  15. Maekawa, S.; Shibasaki, K.; Kurose, T.; Maeda, T.; Sasaki, Y.; Yoshino, T. Tear Propagation of a High-Performance Airship Envelope Material. J. Aircr. 2015, 45, 1546–1553. [Google Scholar] [CrossRef]
  16. Yamamoto, Y.; Nakagawa, J. 14The structure and properties of high-modulus, high-tenacity Vectran fibres. In Handbook of Textile Fibre Structure; Woodhead Publishing: Sawston, UK, 2009; pp. 413–428. [Google Scholar]
  17. McDaniels, K.; Downs, R.; Meldner, H.; Beach, C.; Adams, C. High Strength to Weight Ratio Non Woven Technical Fabrics for Aerospace Applications. In Proceedings of the AIAA Balloon Systems Conference, Seattle, DC, USA, 4–7 May 2009. [Google Scholar] [CrossRef]
  18. Xianghong, B. Research on the Evolution of Mechanical Properties of Airship Envelopes. Ph.D. Thesis, Harbin Institute of Technology, Harbin, China, 2009. [Google Scholar]
  19. Ambroziak, A.; Klosowski, P. Mechanical testing of technical woven fabrics. J. Rnforced Plast. Compos. 2013, 32, 726–739. [Google Scholar] [CrossRef]
  20. Komatsu, K.; Sano, M.A.; Kakuta, Y. Development of High Specific Strength Envelope Materials. J. Jpn. Soc. Aeronaut. Space Sci. 2013, 51, 158–163. [Google Scholar]
  21. Xie, W.; Wang, X.; Duan, D.; Tang, J.; Wei, Y. Mechanical properties of UN-5100 envelope material for stratospheric airship. Aeronaut. J. New Ser. 2020, 125, 472–488. [Google Scholar] [CrossRef]
  22. Tang, J.; Xie, W.; Wang, X.; Chen, Y.; Wu, J. Study of the Mechanical Properties of Near-Space Airship Envelope Material Based on an Optimization Method. Aerospace 2022, 9, 655. [Google Scholar] [CrossRef]
  23. Bridgens, B.; Gosling, P. Interpretation of results from the MSAJ Testing Method for Elastic Constants of Membrane Materials. Tensinet Symp. 2010, 2020, 49–57. [Google Scholar]
  24. MSAJ/M-02-1995; Testing Method for Elastic Constants of Membrane Materials. Membrane Structures Association of Japan: Tokyo, Japan, 1995.
  25. Shaeffer, R.E. Tensioned Fabric Structure-A Practical Introduction; American Society of Civil Engineers: New York, NY, USA, 1996. [Google Scholar]
Figure 1. Biaxial specimen (units in millimeters).
Aerospace 10 00413 g001
Figure 2. Specimen and temperature control device.
Aerospace 10 00413 g002
Figure 3. Structure of the temperature control device.
Aerospace 10 00413 g003
Figure 4. Thermostat heating system and testing machine.
Aerospace 10 00413 g004
Figure 5. Test protocol.
Aerospace 10 00413 g005
Figure 6. Monitoring points of the temperature uniformity verification experiment.
Aerospace 10 00413 g006
Figure 7. Verification test of temperature uniformity.
Aerospace 10 00413 g007
Figure 8. Temperature time curves of each temperature monitoring point.
Aerospace 10 00413 g008
Figure 9. Comparative experiment with and without the temperature control device. (a) Tensile test with the temperature control device. (b) Tensile test without the tem-perature control device.
Aerospace 10 00413 g009
Figure 10. Low-temperature treatment of the specimen.
Aerospace 10 00413 g010
Figure 11. Specimen prepared for the biaxial tension test after the low-temperature treatment.
Aerospace 10 00413 g011
Figure 12. Specimen at −33 °C.
Aerospace 10 00413 g012
Figure 13. Stress–strain curves with a stress ratio of 1:1 (−33 °C).
Aerospace 10 00413 g013
Figure 14. Stress–strain curves with a stress ratio of 2:1 (−33 °C).
Aerospace 10 00413 g014
Figure 15. Stress–strain curves with a stress ratio of 1:2 (−33 °C).
Aerospace 10 00413 g015
Figure 16. Stress–strain curves with a stress ratio of 3:1 (−33 °C).
Aerospace 10 00413 g016
Figure 17. Stress–strain curves with a stress ratio of 1:3 (−33 °C).
Aerospace 10 00413 g017
Figure 18. Stress–strain curves at different temperatures with a stress ratio of 1:1.
Aerospace 10 00413 g018
Figure 19. Stress–strain curves at different temperatures with a stress ratio of 2:1.
Aerospace 10 00413 g019
Figure 20. Stress–strain curves at different temperatures with a stress ratio of 1:2.
Aerospace 10 00413 g020
Figure 21. Stress–strain curves at different temperatures with a stress ratio of 3:1.
Aerospace 10 00413 g021
Figure 22. Stress–strain curves at different temperatures with a stress ratio of 1:3.
Aerospace 10 00413 g022
Table 1. Comparison of the mechanical property parameters with and without the temperature control device.
Elastic   Modulus   10 2   k N / m Poisson’s
Ratio
E x E y ν yx ν xy
Without the temperature control device13.9713.150.2150.203
With the temperature control device14.1113.270.2170.204
Table 2. Change in the mechanical properties of the specimen after the low-temperature treatment.
Elastic   Modulus   10 2   k N / m Poisson’s Ratio
E x E y ν yx ν xy
The specimen at 23 °C13.9713.150.2150.203
The specimen after the low-temperature treatment14.2312.990.2090.215
Table 3. Change in the mechanical properties of the specimen after the low-temperature treatment.
TemperatureElastic ModulusElastic ModulusPoisson’s RatioPoisson’s Ratio
(°C) E x 10 2   k N / m E y 10 2   k N / m ν yx ν xy
−33 °C17.7716.260.3810.348
3 °C14.5514.010.2230.242
23 °C13.9713.150.2150.203
40 °C13.0712.910.2280.225
80 °C12.2211.460.1990.187
Disclaimer/Publisher’s Note: The statements, opinions and data contained in all publications are solely those of the individual author(s) and contributor(s) and not of MDPI and/or the editor(s). MDPI and/or the editor(s) disclaim responsibility for any injury to people or property resulting from any ideas, methods, instructions or products referred to in the content.

