Article

ArticleGust Alleviation by Active–Passive Combined Control of the Flight Platform and Antenna Array for a Flying Wing SensorCraft

1
School of Aeronautic Science and Engineering, Beihang University, Beijing 100191, China
2
Hiwing General Aviation Equipment Co., Ltd., Beijing 100074, China
3
Research Institute of Unmanned Systems, Beihang University, Beijing 100083, China
4
AVIC (Chengdu) UAS Co., Ltd., Chengdu 611000, China
5
School of Engineering, University of Liverpool, Liverpool L693BX, UK
*
Author to whom correspondence should be addressed.
Aerospace 2023, 10(6), 511; https://doi.org/10.3390/aerospace10060511
Submission received: 6 April 2023 / Revised: 18 May 2023 / Accepted: 22 May 2023 / Published: 29 May 2023
(This article belongs to the Section Aeronautics)

Abstract

:
SensorCraft is an intelligence, surveillance, and reconnaissance (ISR) system that integrates unmanned flight platforms and airborne antenna arrays. Under gust loads, the high–aspect–ratio, light–wing structure of SensorCraft has considerable bending and torsion deformation, affecting the flight performance of unmanned flight platforms and leading to the loss of antenna arrays’ electromagnetic performance. Taking SensorCraft as the background, a wing conformal antenna array was designed, an aircraft model with a passive wingtip device was established, a control law was developed by the LQG/LTR method, and a gust alleviation active–passive combined control method of a “LQG/LTR active controller + passive wingtip device” was proposed. By constructing an unsteady aerodynamic reduced–order model (ROM) based on the Volterra series and a conformal array pattern fast method based on the modal form, the effectiveness of the gust alleviation active–passive combined control method on the aircraft platform and antenna array was analyzed. The results show that structural deformation of the wing conformal antenna leads to changes in the main lobe gain, beam direction, and sidelobe level. The active–passive gust alleviation method has obvious advantages. Compared with the LQG/LTR active gust alleviation method, the peak value of wingtip displacement is reduced by 15.6%, and the peak value of the gain loss is reduced by 0.72 dB, which is conducive to better performance of the airborne conformal antenna array.

1. Introduction

SensorCraft [1] is a priority proposed by the Air Force Research Laboratory (AFRL) at the end of the 20th century. For the concept of SensorCraft, platform–payload integrated design was proposed for the first time, and system–level integrated design of the flight platform and mission payload was carried out. SensorCraft has the following technical features:
  • Adopting a sensor–integrated design.
The antenna array and the airframe structure are conformally arranged, and various sensors are integrated to achieve 360° omnidirectional detection [2].
  • The high–aspect–ratio wing is designed to improve the cruise lift–to–drag ratio and extend the flight time in the mission area.
The cruising Mach can be 0.6~0.8, the flight altitude can reach 60,000 ft, and the endurance time can be more than 40 h [3].
With the support of AFRL, many units have participated in the SensorCraft project, and the research work has been steadily carried out. Systematic research results have been achieved in overall design, aerodynamics, structure, aeroelasticity, flight control, prototype manufacturing, and flight testing of scaled prototypes [1,2,3,4,5].
SensorCraft with low wing loads is sensitive to gusts, and the large–aspect–ratio lightweight wing structure has large bending torsion deformation under gust loads. This affects the flight performance of the aircraft platform and leads to the loss of antennas’ electromagnetic performance [4]. Gust alleviation control can reduce the wing’s elastic deformation and ensure the regular operation of the antenna array, which has become critical technology restricting the engineering application of SensorCraft. The methods include active gust alleviation and passive gust alleviation.
The idea of active gust alleviation is achieved by arranging multiple control surfaces on the aircraft and actively deflecting them to change the lift and moment through the control system. This design ensures that the airplane is as stable as possible under gust disturbance.
In recent years, with the development of control theory and sensor technology, various control methods have been gradually adopted in gust alleviation design. Eric et al. used the LQG controller to control the gust load of a flying wing SensorCraft, and evaluated the amplitude and phase margin of the system by the μ theory [5]. The results showed that the bending load was reduced by 53% when utilizing five inner and outer control surfaces. In comparison, it is reduced by 23% when using only three exterior control surfaces. Leeran et al. designed an H robust controller suitable for high–altitude long–endurance UAVs [6] which reduces the maximum gust–induced wing deformation by 54% under the harshest open–loop conditions. Federico et al. designed a wingtip device for maneuvering and gust load active alleviation, and compared two control strategies [7], i.e., static output feedback (SOF) controller and recursive neural network (RNN) controller. Castrichini studied a gust load alleviation (GLA) scheme of a folded wingtip [8], which was not coupled to aircraft attitude control but operated under gust disturbance, making the control design simple. However, the wingtip rotation needed to be driven by mechanical components, resulting in increased wingtip weight, which indicates a complex structural design.
The idea of passive GLA is to utilize predesign to provide additional lift or moment to maintain aircraft stability in the case of passive deformation. Traditional passive control methods are mainly realized by changing the aerodynamic load distribution and improving the structural stiffness by designing aerodynamic and structural aircraft parameters, such as additional winglets, bending–torsion coupling design, aeroelastic tailoring, etc. Perron [9] reduced gust loads through the bending torsion coupling design for the Boeing 737 wing. Cooper et al. carried out an aeroelastic tailoring design for the composite structure of SensorCraft [10], which realized the tradeoff between reducing gust loads and improving flutter speed. Limited by the overall aircraft performance, traditional passive methods often lead to excessive design and limited improvement to GLA problems.
Progress has recently been made in passive GLA using full–moving wingtip technology. The wingtip’s passive GLA device connects with the main wing through the rotating shaft, which rotates freely around the shaft, with the connection point located in front of the aerodynamic center. When encountering an upward gust, the wingtip deflects downward to reduce the wingtip load, alleviating the gust load for the wing. Cooper et al. tested a passive wingtip GLA device used for SensorCraft in the MACE wind tunnel [11], which reduced wing deformation by 50%. Recently, they designed an adaptive wingtip device [12], which adopted a chiral inner structure to achieve gust alleviation by controlling its bending, torsion, and rotation, which can save 2% of fuel consumption. Some other researchers also put forward the concept of passive GLA for full–moving wingtips. The project “Passive Gust Alleviation for a Flying Wing Aircraft” [13,14] showed that the full–moving wingtip device reduces the elastic deformation of the wingtip by 18% and the bending moment of the wing root by 15%. The project “Wind Tunnel Model and Test to Evaluate the Effectiveness of a Passive Gust Alleviation Device for a Flying Wing Aircraft” [15] showed that the full–moving wingtip device reduced the gust response by a maximum of 9.4%. In contrast, while in combination with the aeroelastic tailoring design, the gust response was decreased by 28.5%.
Research on the GLA technology of SensorCraft has made some progress. Related research has focused on flight platforms, and the effects of active and passive GLA techniques on flight performance have also been investigated. However, the gust response characteristics of wing–conformal antenna arrays have yet to be studied. The high–aspect–ratio lightweight wing of SensorCraft has bending–torsion deformation under gust loads, which not only harms the flight performance of the platform, but also changes the amplitude and phase of the wing–conformal antenna array, resulting in the deterioration of the antenna array’s electromagnetic performance. This includes an increase in the sidelobe level, a decline in pointing accuracy, and attenuation of the array gain [16,17]. conducting in–depth GLA technology research on such flight platforms and antenna arrays in the context of SensorCraft is urgent. The main contributions of this paper are summarized as follows:
(1)
Based on the Volterra series theory, an unsteady aerodynamic reduced–order model (ROM) is established, which ensures the flow field nonlinearity and reduces computational time. Coupled with the structural dynamics model, the aeroelastic model of the flying wing SensorCraft is obtained. The aeroelastic model of the AGARD445.6 wing verifies the accuracy and ef–ficiency of the aerodynamic reduced–order method.
(2)
The wing–conformal antenna array is designed. A method for calculating the far–field pattern of the antenna array based on mode superposition is proposed, which enables fast and quantitative analysis of the electromagnetic performance of antenna arrays under dynamic loads.
(3)
The passive wingtip device is designed, and the GLA control method is proposed by combining the LQG/LTR active controller with the passive wing–tip. Compared with the LQG/LTR active GLA method, the influence of the active–passiveactive–passive combined GLA method on the aircraft platform and the conformal antenna is analyzed in detail.
The remainder of this paper is organized as follows. The second section describes the physical model. The third section provides the calculation method. The fourth section describes the design of the active control system. The fifth section verifiesthe reduced–order aerodynamic process. The simulation results and an analysis of the active–passive combined gust load alleviation are shown in the sixth section. The impacts of wing deformation on the antenna array’s electromagnetic performance are provided in the seventh section. Finally, section eight concludes this paper.

2. Physical Model

2.1. Flying Wing SensorCraft Model

Referring to the SensorCraft designed by the Northrop Grumman company [18], the shape of the SensorCraft in this paper was as follows: a flying wing configuration was adopted, with a wingspan of 62 m, a fuselage length of 22 m, an average aerodynamic chord length of 7.6 m, a maximum takeoff weight of 56 t, a cruising altitude of 18 km, and a cruising Mach number of 0.65. The leading and trailing edges of the outer wing section were parallel, and four pairs of control surfaces were designed at the wing’s trailing edge. Control surface 1 was located on the trailing edge of the inner wing, control surfaces 2, 3, and 4 on the trailing edge of the outer wing; and the conformal antenna array on the wing’s leading edge. The coordinates are defined in Figure 1, where the Z–axis points outward perpendicular to the X–axis and Y–axis. Four sensors were arranged on the flight vehicle, including an angular rate gyro, an accelerometer at the center of mass, and an accelerometer at the wingtip.
The fuselage adopts a truss–beam structure composed of beams, ribs, and skins. The beams and ribs in the non–antenna area are made of aluminum alloy 7050, and the skin is made of T300/5222 carbon fiber composite. The antenna area adopts a wave–transparent design, and glass fiber composite material is used for rib and skin. Specific material properties are shown in Table 1. The front beam, rear beam, and upper and lower skin are employed to construct a wing box structure. Based on the principle of minimum force on the antenna components, the antenna elements are installed close to the front beam and designed to conform to the front beam structure.

2.2. Wing–Conformal Antenna Array Model

Referring to the EL/M–2075 radar of the Israeli “Falcon” early warning aircraft, the L–band was adopted as the antenna operation band, and the microstrip patch antenna was adopted as an element of the antenna array in order to utilize the installation space efficiently. The length and width of the antenna unit were both 100 mm, and the operating frequency was 1 GHz. The antenna array size was 2 × 50 units, forming a linear array, and the array element spacing was 150 mm, as shown in Figure 2.

2.3. Passive Wingtip Device Model

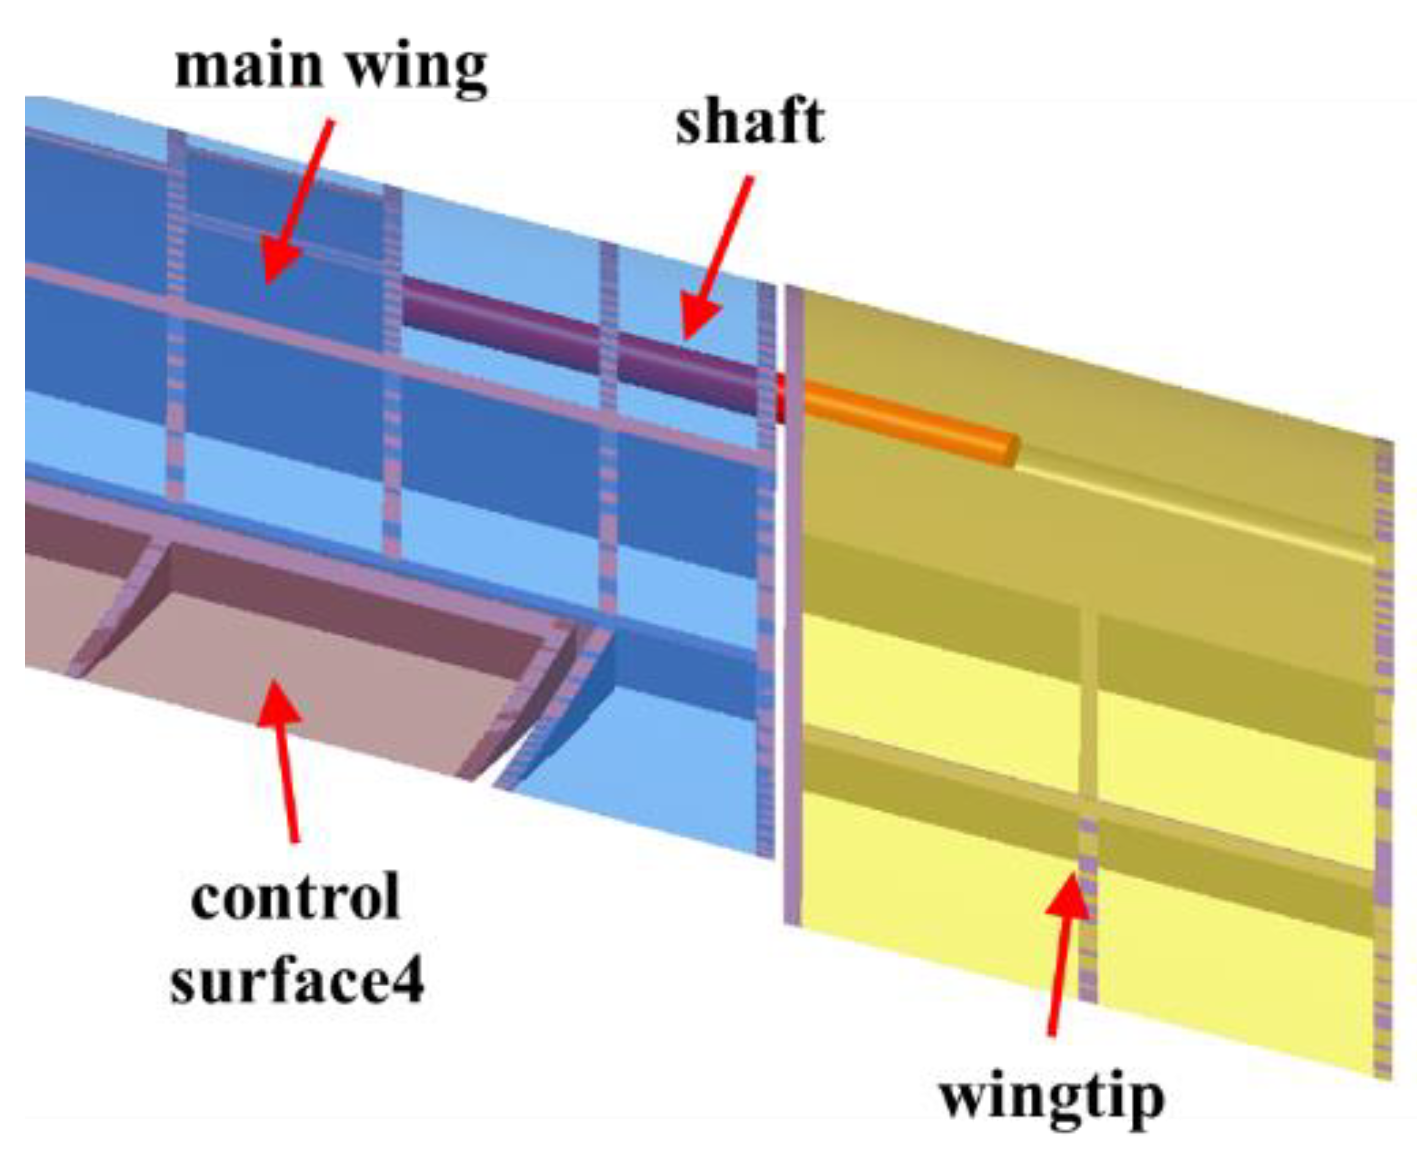
Figure 3 shows a diagram of the passive wingtip GLA device. The outer wing was divided into the main wing and passive wingtip device; the length of the wingtip device was 10% of the outer wingspan. The wingtip device was connected with the main wing through the rotation shaft, located at 0.1 c (chord length) from the leading edge and in front of the aerodynamic center. The shaft had a torsional degree of freedom, with a stiffness of 104 N∙m/rad, and the wingtip device was able to pitch around it. If gust disturbance was not detected, the wingtip device locked; when gusts did appear, the wingtip device was open and rotates around the shaft to achieve passive gust alleviation.

3. Calculation Method

3.1. Reduced–Order Aerodynamic Model Based on the Volterra Series

In the time domain solution process of the gust response, the most time–consuming part was the unsteady aerodynamic calculation. This paper used the Volterra series theory to establish the unsteady aerodynamic reduced–order model (ROM). The model used structural deformation as the input and aerodynamic force as the output, which can be directly coupled with the structural dynamics model to solve the gust response. Ensuring the flow field’s nonlinearity dramatically reduced computational time and resource consumption.
As a black–box model reduced–order method [19], the Volterra series method represents the nonlinear system with multiple convoluted forms of input. It obtains the Volterra kernel through the input and output data of the system. The reduced–order process can achieve the extraction of the dominant characteristics of the original nonlinear system. Hence, this reduced–order method can be used to identify the nonlinear aerodynamic model of SensorCraft, and the specified model can be ready to couple with the structural model for the aeroelastic system [20].
The time–domain discrete form of the Volterra series is as follows.
y [ n ] = h 0 + k = 0 N h 1 [ n k ] u [ k ] + k 1 = 0 N k 2 = 0 N h 2 [ n k 1 , n k 2 ] u [ k 1 ] u [ k 2 ] + + k 1 = 0 N k m = 0 N k n = o N h n [ n k 1 , , n k n ] u [ k 1 ] u [ k m ]
where hi is the i–th order kernel. Under the assumption of a minor disturbance, the unsteady aerodynamic force obtained from the N‒S equation was weakly nonlinear, and the first–order Volterra kernel was able to reflect the system’s characteristics. The first–order kernel could be identified through step signal input, and the unit step input was as follows.
u 0 s ( k ) = 1 , k N 0 , k N
The first–order kernel was obtained as follows.
h ( k ) = y ( 0 ) , k = 0 y ( k ) y ( k 1 ) , k > 0
The eigensystem realization algorithm (ERA) constructed the generalized aerodynamic low–order state space. The discrete state space equation of the generalized aerodynamic force can be expressed as follows.
x a ( k + 1 ) = A a x a ( k ) + B a u ( k ) F a ( k ) = C a x a ( k ) + D a u ( k )
where xa(k) is the aerodynamic state variable, u(k) is the generalized displacement of the structure, and Fa(k) is the generalized aerodynamic coefficient. Aa, Ba, Ca, and Da are the system matrix, input matrix, output matrix, and feedforward matrix obtained by reducing order.
For the first–order kernel h(k) identified by the Volterra series, the Hankel matrix can be written as follows.
x a ( k + 1 ) = A a x a ( k ) + B a u ( k ) F a ( k ) = C a x a ( k ) + D a u ( k )
where n is a positive integer, and r and s are used to determine the size of the matrix.

3.2. Structural Dynamics Model with the Passive Wingtip Device

To simplify the calculation, the modal superposition method was adopted to decouple the structural dynamic equation for the aircraft.
M 1 x ¨ 1 + C 1 x ˙ 1 + K 1 x 1 = F 1 + F 2
where x1 is the generalized displacement of the aircraft, M1 is the generalized mass of the aircraft, C1 is the generalized damping of the plane, K1 is the generalized stiffness of the plane, F1 is the generalized aerodynamic force of the plane, and F2 is the generalized aerodynamic force of the passive wingtip device. F 1 = A 1 u , u represents the input of the control surfaces, and A1 represents the aerodynamic influence matrix of the control surfaces.
The dynamic equation of the passive wingtip device can be written as follows.
M 2 x ¨ 2 + C 2 x ˙ 2 + K 2 x 2 = A 12 x 1 + A 2 x 2
where x2 is the generalized displacement of the passive wingtip device, M2 is the generalized mass of the passive wingtip device, C2 is the generalized damping, K2 is the generalized stiffness, and A12 and A2 are coefficient matrices corresponding to the aerodynamic model.
F2 is the dynamic load acting on the aircraft by the passive wingtip in Equation (6), and it can be obtained as follows.
M 2 x ¨ 2 + C 2 x ˙ 2 + K 2 x 2 = A 12 x 1 + A 2 x 2
Equation (9) can be obtained by combining Equations (6)–(8).
M s x ¨ s + C s x ˙ s + K s x s = F
Equation (9) can be written in state space form, as follows.
x ˙ s ( t ) = A s x s ( t ) + q B s F ( t ) u ( t ) = C s x s ( t ) + q D s F ( t )
The zero–order sample–and–hold method was used for discretization, and Equation (10) was converted into a discrete state space model.
x s ( k + 1 ) = A s x s ( k ) + q B s F ( k ) u ( k ) = C s x s ( k ) + D s F ( k )

3.3. Aeroelastic Coupled Model

The state space model of the aeroelastic system was obtained by combining the discrete aerodynamic state space model with the discrete structural state space model. Under a given dynamic pressure, the response of the aeroelastic system could be quickly calculated by this model.
x s ( k + 1 ) x a ( k + 1 ) = A s + q B s D a C s q B s C a B a C s A a x s ( k ) x a ( k ) u ( k ) = C s 0 x s ( k ) x a ( k )
where u(k) is the generalized displacement of the structure, xa(k) and xs(k) are the discrete aerodynamic and structural state space equation state variables, and q is the dynamic pressure.

3.4. Flight Dynamics Model

The average shafting theory establishes the full–order equations of flight dynam–ics, and the linear model of flight dynamics is obtained by linearizing the full–order equations under the condition of straight and level flight.
M Δ u ˙ + M g Δ θ cos θ 0 = Δ X M w ˙ + M g Δ θ sin θ 0 + M u 0 q = Δ Z I y y q ˙ = Δ M [ M ] η ¨ + [ C ] η ˙ + [ K ] η = [ F ]
where Δ u and Δ θ are the incoming flow velocity and pitch angle deviated from the balance position; θ 0 and u 0 are the pitch angle and forward flight speed in the trim state, η is the generalized coordinate of the elastic mode.
The longitudinal linearization equation was written as a state space, and the aerodynamic derivative was substituted.
x ˙ = A f x + B f u

3.5. Actuator Model

The second–order system was used to simulate the response process of the actuator. The transfer function of the second–order system was as follows.
G d = K d s 2 + 2 ε d ω n d s + ω 2 n d

3.6. Discrete Gust Model

The 1–cos discrete atmospheric model was used for the gust disturbance [21], and the discrete gust full wavelength (1–cosine) model was as follows.
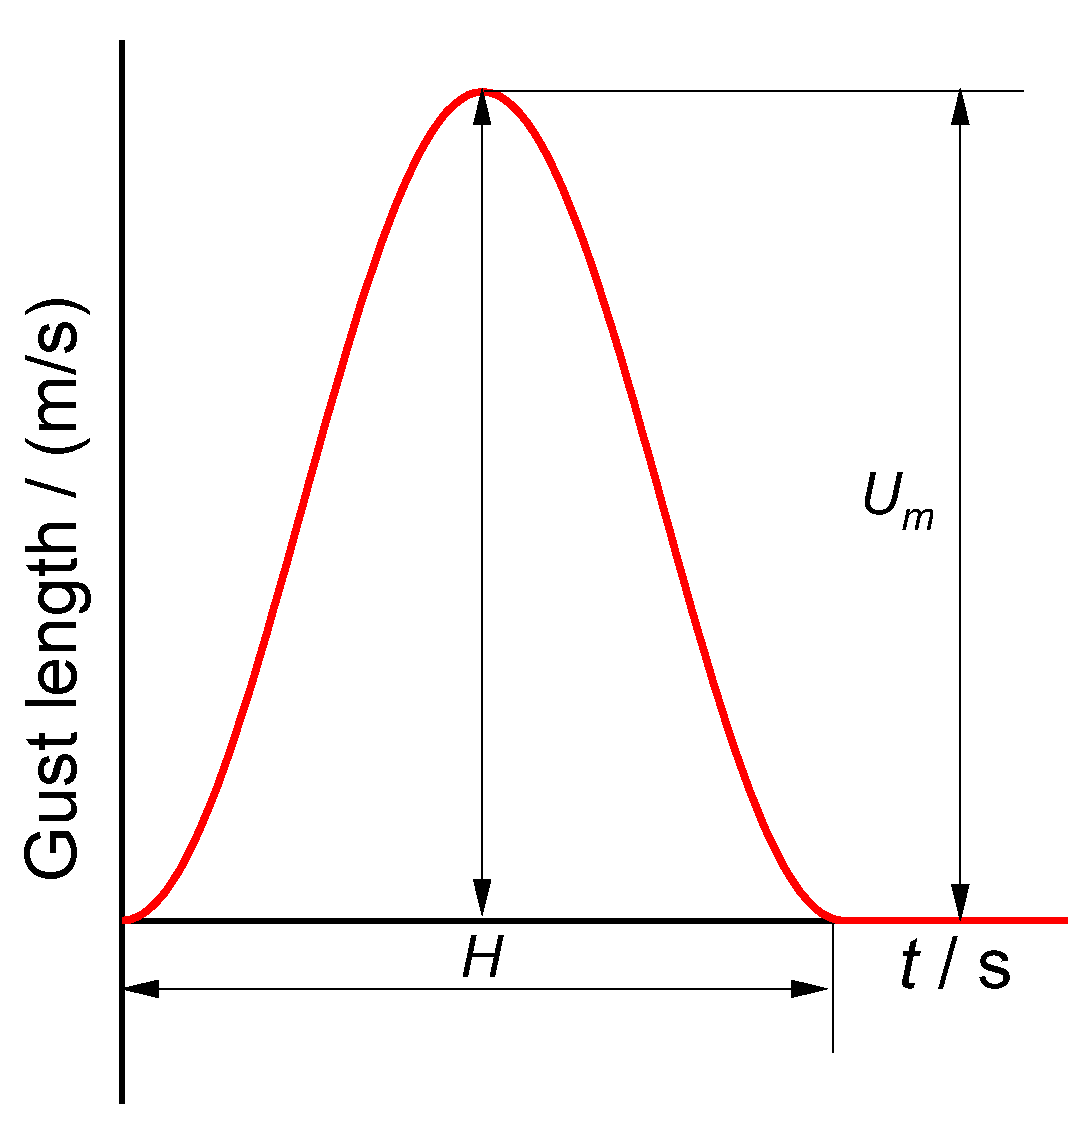
U = U m 2 1 cos 2 π s H 0 < s H 0 s > H
The shape of the discrete gust is shown in Figure 4, mainly defined by the length H and strength Um of the gust. When using the gust model, the space domain was converted to the time domain, and the transformation relation was as follows.
s = V t H = 2 V t m
where tm is the time taken for the wind speed to reach the maximum value, and s represents the aircraft’s position.

3.7. Gust Response Model

The state space equation of the gust response could be obtained by coupling the flight dynamics, atmospheric, and actuator models in the form of state space.
x ˙ = Ax + Bu + Γ ω y = Cx + v
where ω and v are the input noise and measurement noise. We assume that ω and v were independent of each other, satisfying E [ ω ν T ] = 0 .

3.8. Fast Method of Antenna Array Pattern Based on Modal Superposition

Affected by the deformation of the wing, the spatial distribution of the conformal antenna array element changed, resulting in a difference in the electromagnetic performance, which is challenging to model and estimate. In this paper, the pattern of the antenna elements was obtained by the adaptive iterative method based on the finite element method. The homemade program achieved conformal antenna array modeling, information on the position and angle of each element in the array was obtained quickly by the modal method, and the antenna array pattern was obtained by superimposing the patterns of each array element. Compared with commercial software, this method requires much less time and can reflect the influence of dynamic deformation of the array on its electromagnetic performance [22]. The modeling process of the conformal antenna array was as follows.
(1)
According to the modal method, the node displacement vector Δ r ( t ) of the antenna carrier under dynamic load was obtained, and each array element’s distribution position and deflection angle were calculated. Δ r ( t ) could be expressed as the linear combination of each order vibration mode P i of the antenna carrier.
Δ r ( t ) = i = 1 I P i x i ( t ) = P x
where P is the vibration mode matrix of all nodes of the antenna carrier, and x is the generalized displacement of the mode obtained from Equation (10), which represents the weight of each order vibration mode in the structural deformation Δ r ( t ) .
(2)
The pattern of each array element was rotated according to its deflection angle.
(3)
The phase difference of each array element was calculated according to its distribution position.
(4)
Each array element’s pattern was superimposed to obtain the antenna array’s pattern.
The coordinate transformation process of each array element is shown in Figure 5.
Step 1: The conversion formula from spherical to rectangular coordinates was as follows.
x y z = f ( θ p , φ p ) sin ( θ p ) cos ( φ p ) f ( θ p , φ p ) sin ( θ p ) sin ( φ p ) f ( θ p , φ p ) cos ( θ p )
Step 2: The conversion formula of the pattern of antenna elements was as follows.
X Y Z = x y z R x R y R z
where R x , R y , and R z are the rotation matrices, and R x is a matrix that rotates θ x degrees around the X–axis.
Step 3: The conversion formula from rectangular to spherical coordinates was as follows.
φ g = arctan y x f = x 2 + y 2 + z 2 θ g = arccos z f
The polarization direction of the array element changed with its deflection angle, meaning that was necessary to calculate the polarization direction after a deflection and then superimpose the radiation intensity of each array element through the polarization vector. This process was similar to the coordinate transformation of the array element pattern. Finally, the polarization vector g g ( φ g , θ g ) was obtained, and the polarization vector of the antenna array was as follows.
C ( φ g , θ g ) = i = 1 M e j ϕ i f g i ( φ g , θ g ) g g i ( φ g , θ g )
where C ( φ g , θ g ) is the polarization vector of the array at φ g , θ g , ϕ i is the spatial delay phase of the i–th array element at φ g , θ g , f g i ( φ g , θ g ) is its pattern, g g i ( φ g , θ g ) is its polarization vector in φ g , θ g , and the pattern of the conformal antenna array is as follows.
F ( φ g , θ g ) = c x 2 ( φ g , θ g ) + c y 2 ( φ g , θ g ) + c z 2 ( φ g , θ g )

4. Design of the Active Control System

4.1. Active Control Scheme

The aircraft was actively controlled by control surfaces 1, 2, and 4, demonstrating different control properties. Control surface 1 provided a large lift, control surface 4 yielded a significant pitching moment, and control surface 2 and control surface 4 provided efficient control of the elastic deformation. Considering the vertical gust acting on the aircraft, the wingtip displacement and center of gravity overload response were taken as the alleviation targets.
A closed–loop control system was adopted in this paper, as shown in Figure 6. We assumed that the aircraft would encounter gusts under longitudinal motion, where the Kalman filter observer was utilized, and the LQR/LTR method was used for the controller design.
The main control conflicts of the flying wing SensorCraft studied in this paper were robustness and multivariate optimal control. The aeroelastic aircraft model has many uncertainties and requires a robust control system. The LQG control method is essentially an optimal control method with less energy to obtain more minor errors, but its stability margin is small when the parameters are disturbed. Loop transmission recovery technology is used to compensate for LQG method’s shortcomings and to increase the control system’s robustness.

4.2. LQG/LTR Control Method

The LQG/LTR control algorithm can be divided into two steps.
(1)
Solving the Riccati equation to determine the observer gain Kf.
(2)
Designing the optimal control gain Kc and selecting the appropriate weighting matrices Q and R cause the system to approach the open–loop gain of the Kalman filter observer as closely as possible.
The Kalman filter was used for the state estimation, and the gain matrix Kf was obtained from the following equation.
K f = P f H T G 1
where Pf satisfies the Riccati equation.
P f A d T + AP f P f G 1 CP f + Γ F Γ T = 0
where Pf is the symmetric semidefinite matrix, and G and F are the covariance matrices of input noise and measurement noise.
The optimal state feedback gain satisfied the Riccati equation.
A T P + P c A P c BR 1 B T P c + M T QM = 0
The optimal feedback matrix Kc could be obtained by solving the Riccati equation.
K c = R 1 B T P c
The optimal feedback control law was obtained as follows.
u = K c x ^

5. Verification of the Reduced–Order Aerodynamic Method

The AGARD 445.6 wing is an example which we used to validate the aerodynamic ROM method, and the parameters are described in references [23,24,25]. The first four modes of the wing were obtained by the finite element method, and the modal vibrations of each mode were put into the CFD mesh as structural deformations to obtain the generalized aerodynamic force. Then, according to the step response identification method, the first–order Volterra kernel was obtained. Finally, the convolution form of the system was converted into the state space form by the eigensystem realization algorithm, and the aerodynamic reduced–order model based on the Volterra series was established.
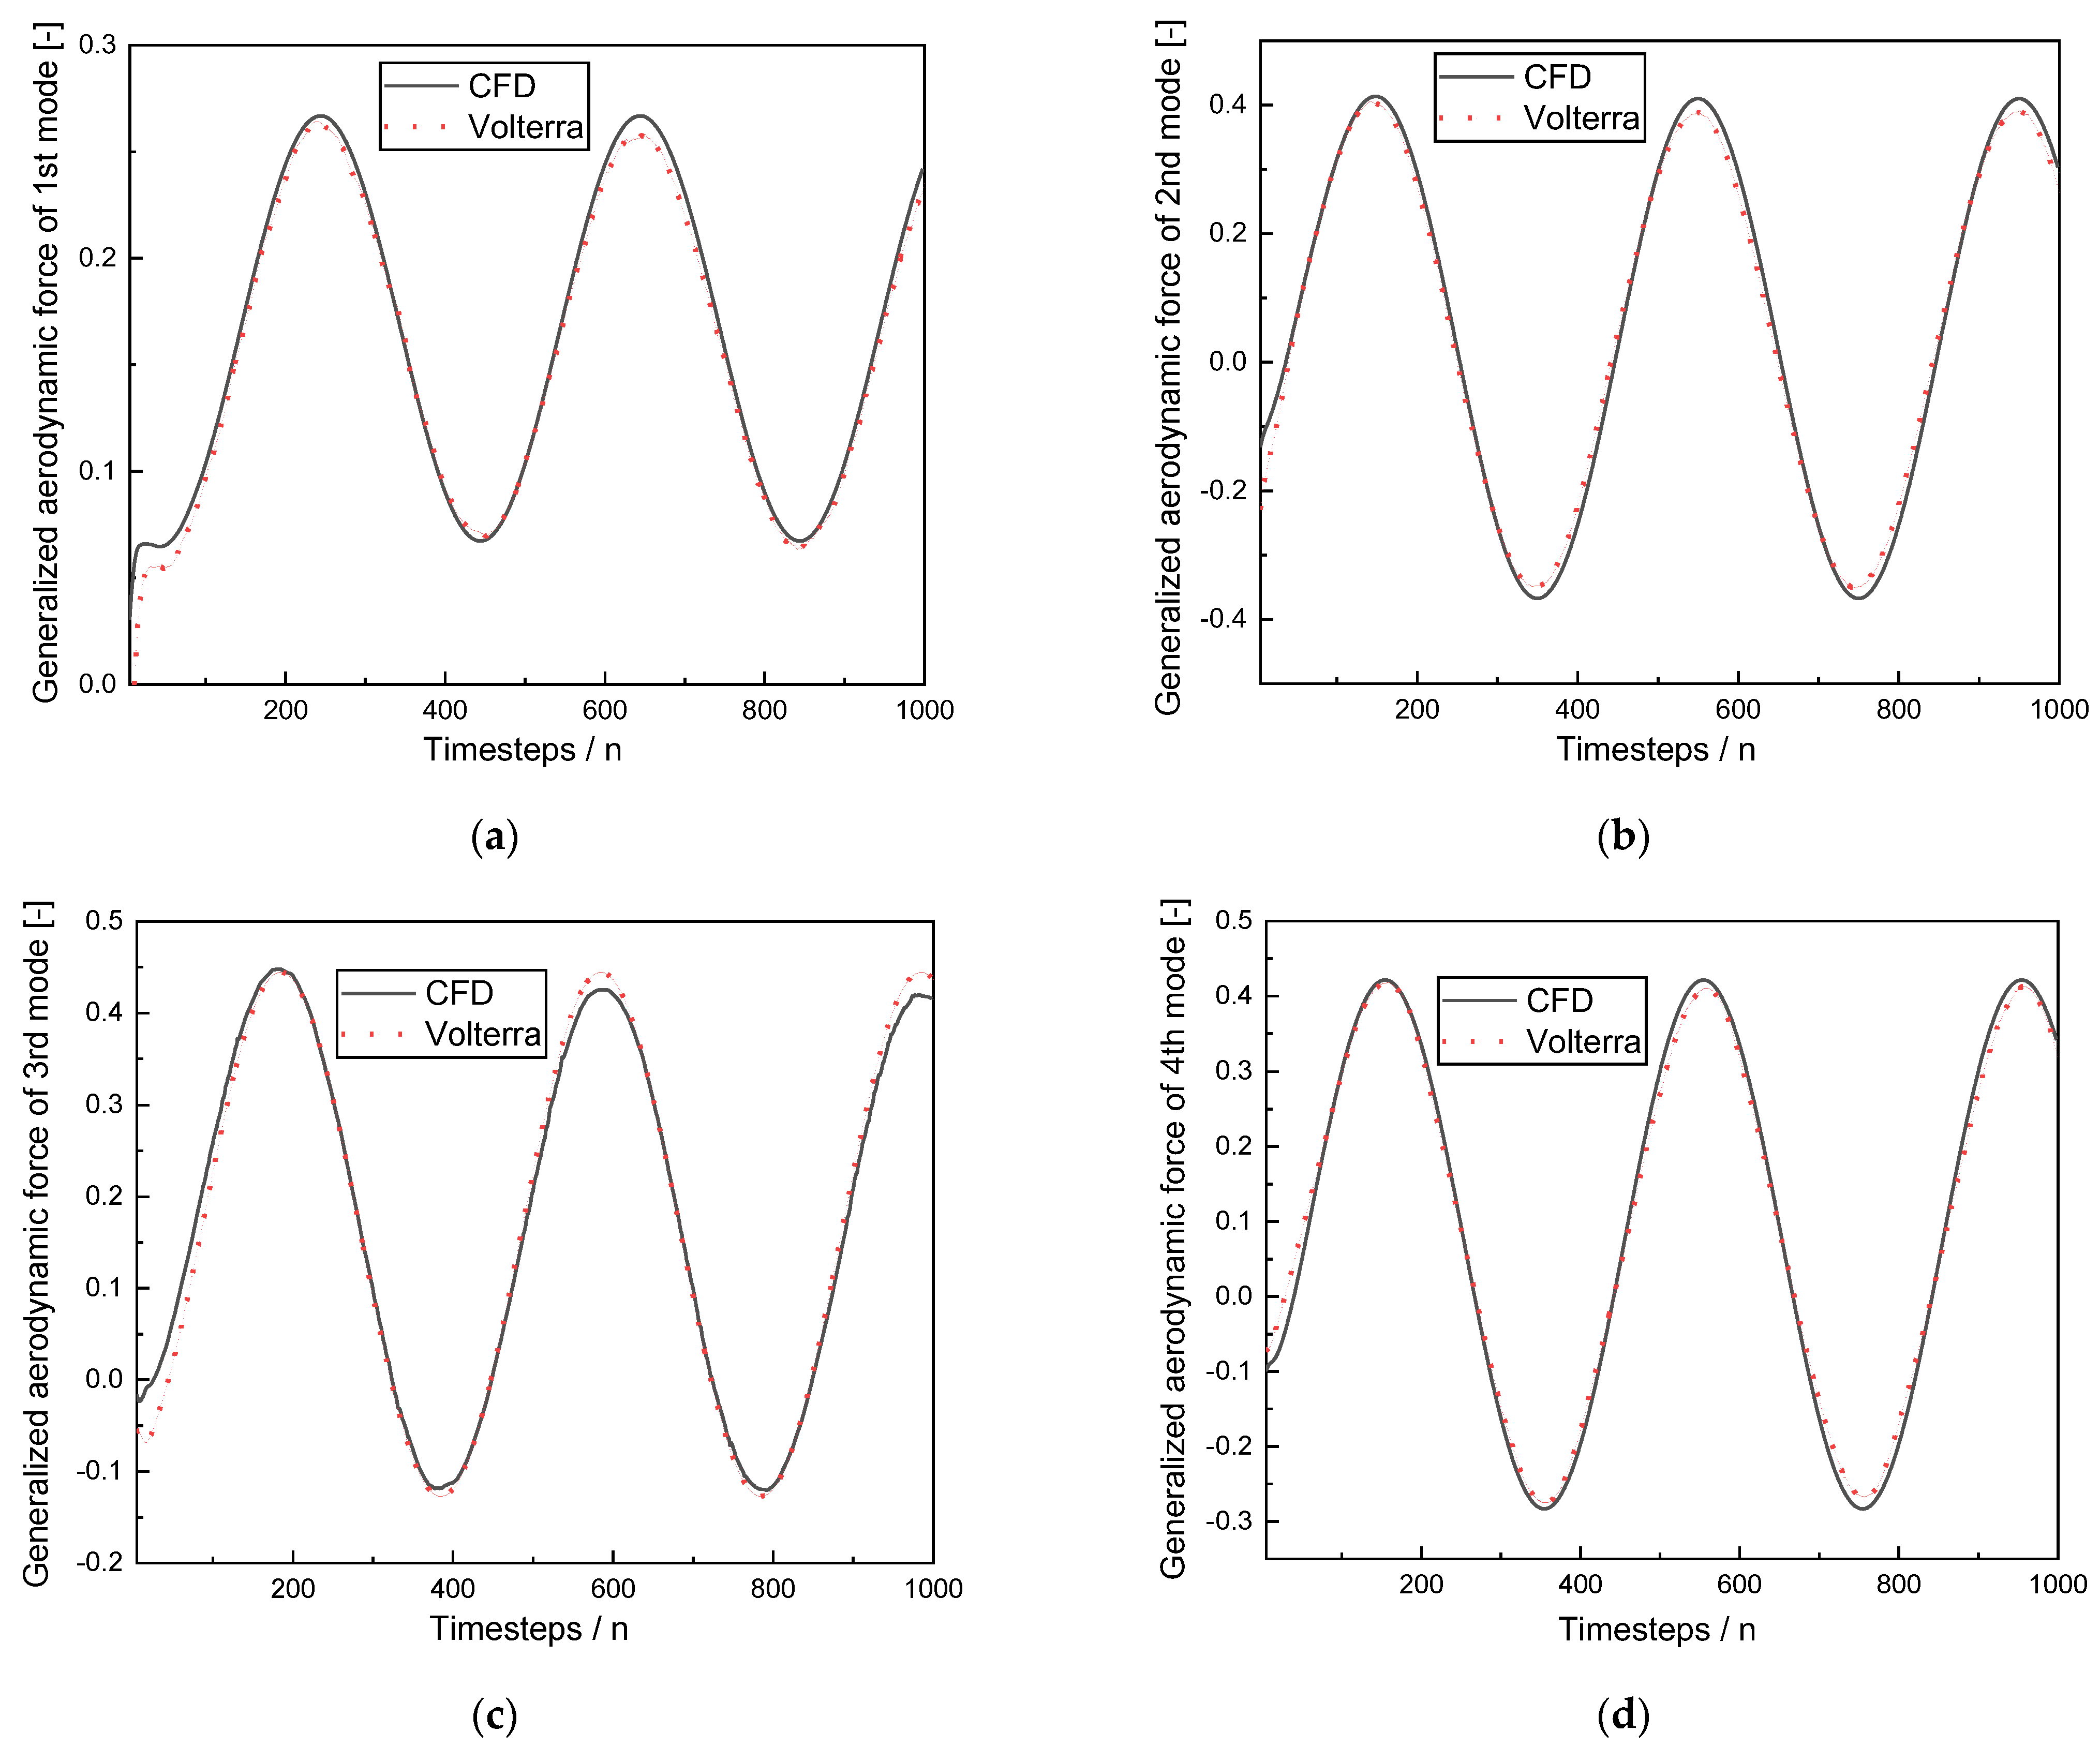
To validate the aerodynamic model by the ROM method, the responses of each mode under sinusoidal input with a frequency of 100 Hz were calculated by the CFD and ROM method.
The CFD solution used the finite volume method to solve the Reynolds–averaged N–S equation, the spatial discretization used the Roe format, the time advance used the LU–SGS dual time step implicit approach, and the central difference with second–order accuracy solved the S–A turbulence model.
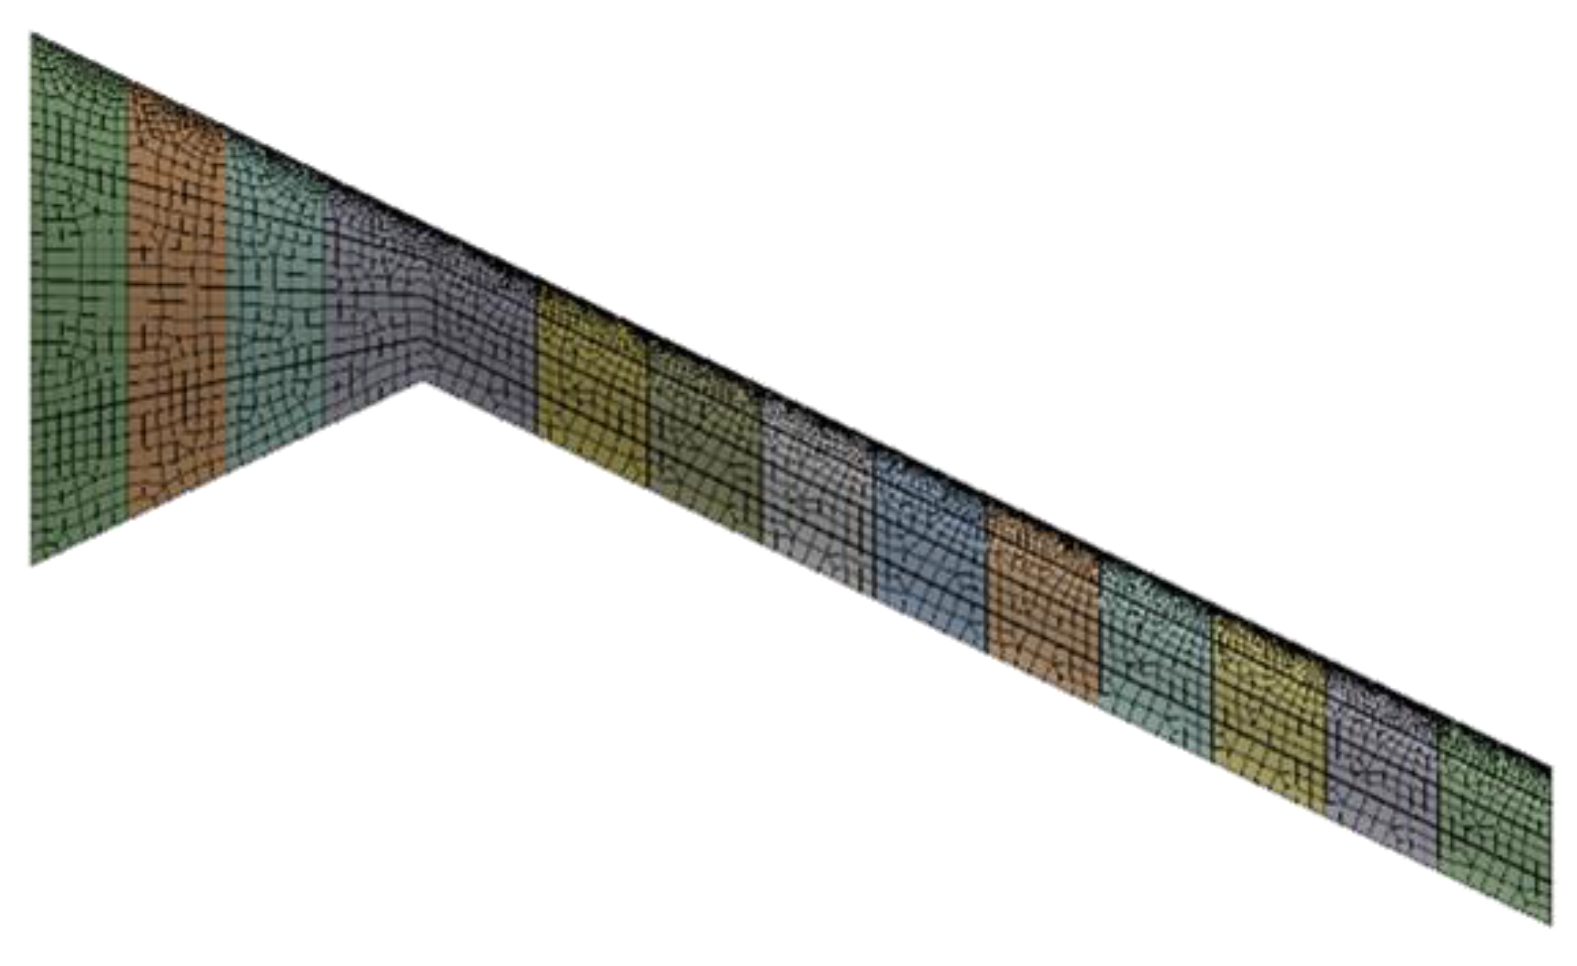
The unstructured mesh was chosen for the CFD calculation, and the dynamic mesh was generated by the spring smooth method to accommodate the dynamic deformation of the boundary. The outer boundary was set as the pressure far–field boundary condition, the wing surface was set as the wall boundary condition, the near–wall mesh was encrypted, and the mesh number was about 520,000. The Mach number was 0.9, and the angle of attack was 0°. In the CFD calculation process, the function of each order of modal vibration was obtained by polynomial fitting, and the variation of the vibration pattern with time was loaded into the CFD program.
The results in Figure 7 demonstrate that the CFD and the ROM methods showed a consistent trend, with only slight differences at the peaksand good agreement. The CFD method required approximately 40 h computer hours (i7–9700 CPU, 16G RAM, 8 cores in parallel), while the ROM method only required about 0.5 h. It is shown that the unsteady aerodynamic reduced–order model based on the Volterra series was able to effectively predict the system’s response and significantly reduce the demand for computational resources.
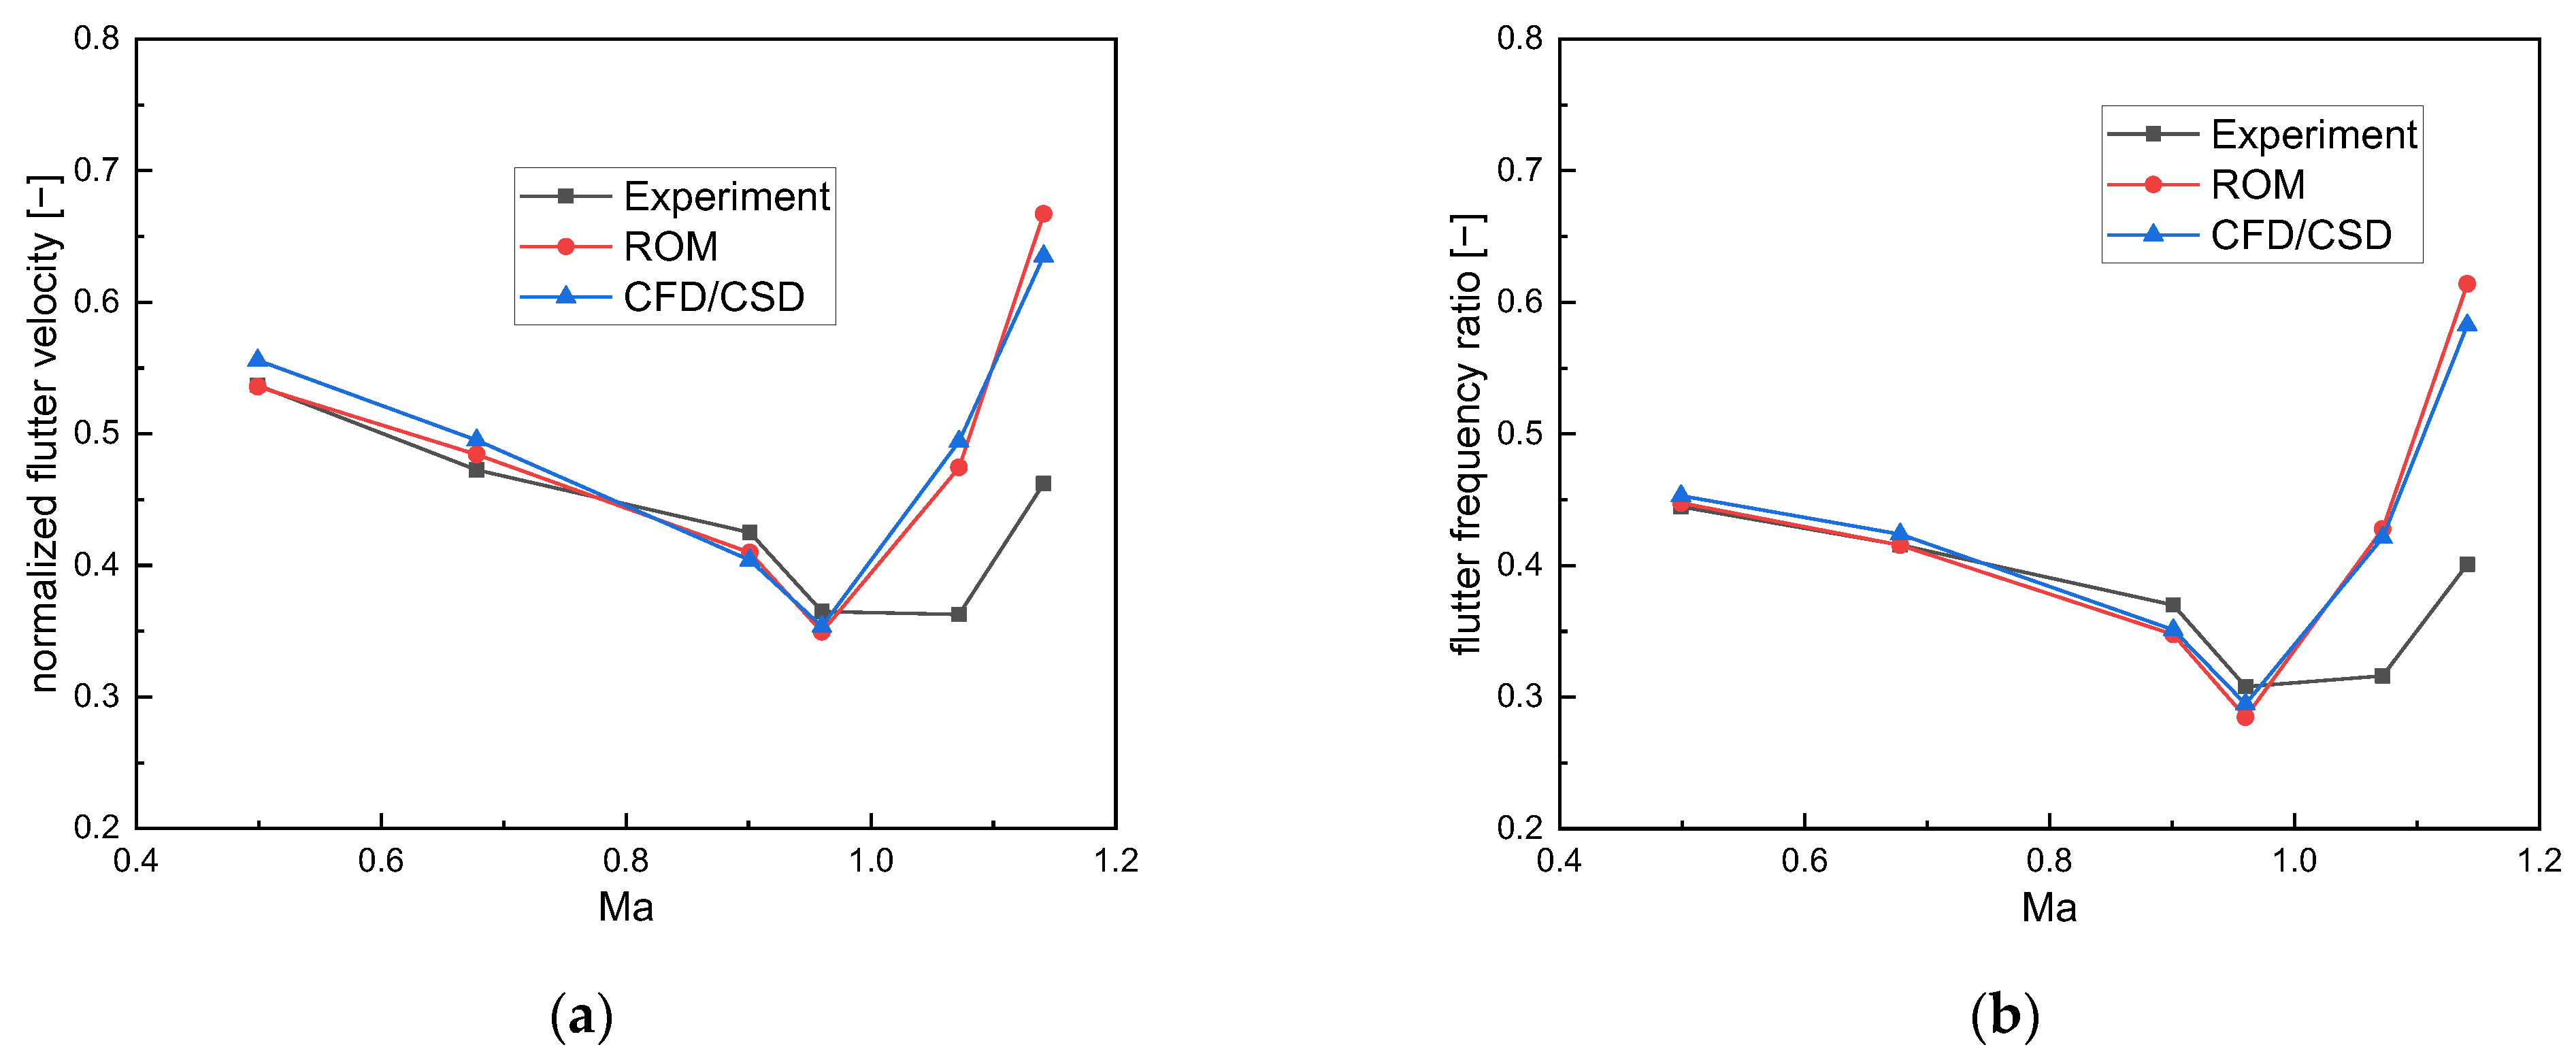
The corresponding reduced−order models were established at different Mach numbers, and the flutter boundaries of the aeroelastic system with Mach numbers could be predicted quickly by changing the dynamic pressure q. The results of the normalized flutter velocity and flutter frequency ratio are shown in Figure 8. The results expected by the reduced−order model matched those obtained by the CFD/CSD coupled method and the transonic dip phenomenon was accepted. A comparation comparison of the results confirmed the correctness of the reduced–order method for solving the aeroelastic response.

6. Analysis of the Active–Passive Combined Gust Load Alleviation

6.1. Structural Modal of the SensorCraft

The semi–modal finite element model of the SensorCraft is illustrated in Figure 9, with a fixed boundary condition in the symmetry plane. The Lanczos method was adopted to calculate the inherent structural frequencies and vibrations. The structural modes of each order were obtained for the aeroelastic model. The parameters of the first four modes are shown in Table 2 and Figure 10. From the modal characteristics, it was known that the SensorCraft structure was incredibly flexible.

6.2. The Effects of the Active–Passive Combined Method on the Flight Platform

The shaft position of the passive wingtip was 0.1 c from the leading edge and the torsional stiffness was 104 N∙m/rad. The effects of the active–passive combined GLA system were investigated with a gust length of 95 m and a gust strength of 10 m/s. Time domain response curves are shown below.
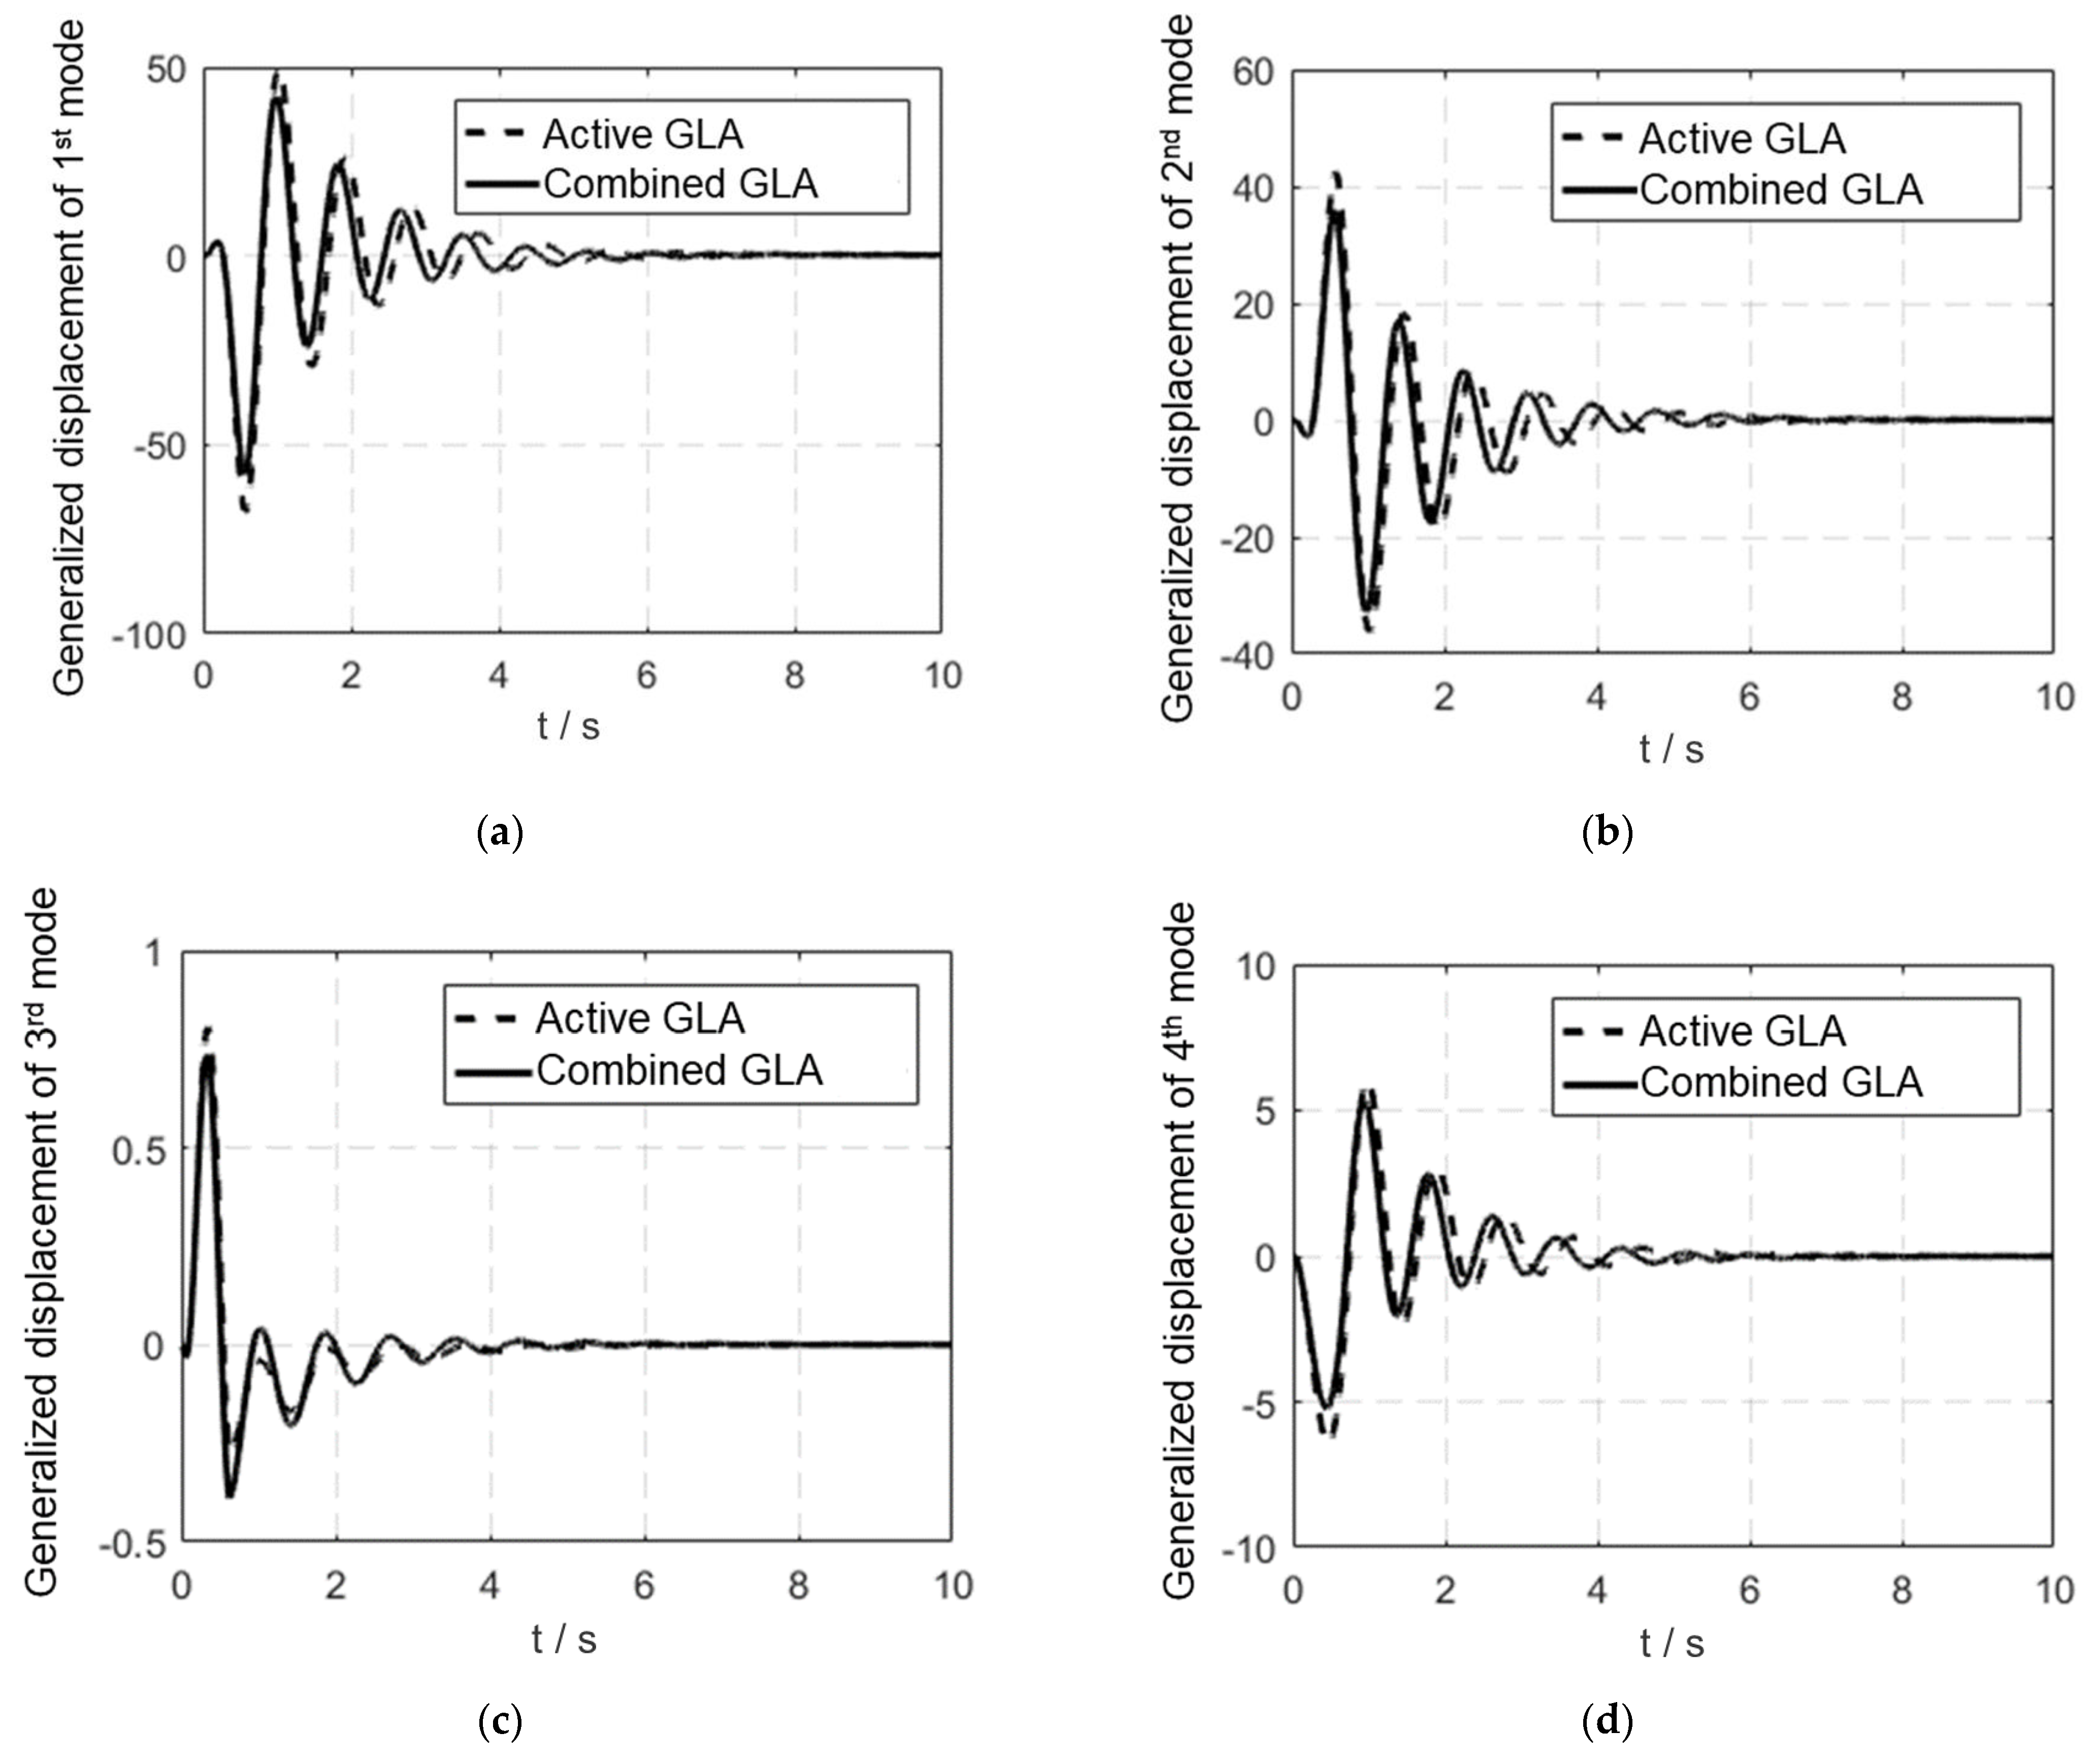
Figure 11a shows the responses of the gravity center overload. Compared with the active GLA method, the gravity center overload under the active–passive combined GLA method changed little. The response curves of the wingtip displacement are shown in Figure 11b. Compared with the active GLA method, the wingtip displacement showed an apparent decrease under the active–passive combined GLA method, and the peak value of wingtip displacement in this state was reduced by 15.6%, which is conducive to the performance of airborne equipment. The response curves of the pitch angle are shown in Figure 11c. The peak value of the pitch angle was significantly reduced under the active–passive combined GLA method compared with the active GLA method. The peak value of the pitch angle in this state decreased by 26.4%, and the trend became smoother, with the flight quality improving. Figure 12a–d, in which the vertical axis represents generalized displacements of each order of modes, shows the response curves of modal displacements. It can be concluded that compared with the active GLA method, the peak values of displacement can be reduced, and the convergence can be accelerated by the active–passive combined GLA method, which is caused by the additional aerodynamic damping generated by the passive wingtip device during rotation.
Then, simulations were conducted to investigate the applicability of the combined GLA method for different operating conditions with gust length of 60 m–120 m and gust strength of 5 m–15 m. The results showed that compared with the active method, the combined approach reduced the peak value of the gravity center overload by 0.6–6.1%, the wingtip displacement by 14.3–17.2%, and the pitch angle by 22.5–28.7%.
The time response curves of the rotation angles of the passive wingtip and control surfaces are shown below. Figure 13a shows the response curve of the passive wingtip rotation angle (maximum angle limit of 25°). Figure 13b,c, show the response curves of control surface 1 and control surface 2. It can be concluded that the active–passive combined GLA method resulted in lower peak values for the control surfaces: 4.7° for control surface 1 and 5.9° for control surface 2. This indicates that the passive wingtip was instrumental to active control in the inner control surfaces. However, as shown in Figure 13d, the active–passive combined GLA method increased the peak value of control surface 4 by 4.1°, making it possible to exceed the control limit and increase the control difficulty. This is because control surface 4 was located on the outer side, which controlled the aircraft attitude angle and the wingtip displacement, resulting in a significant deflection of the control surface.

6.3. Influences of the Passive Wingtip Parameters on Gust Response

The shaft position of the passive wingtip changed between 0 and 0.9 c from the leading edge and torsional stiffness varied between 103 N∙m/rad and 104 N∙m/rad. The effects of shaft position and torsional stiffness on the gust response with a gust length of 95 m and a gust strength of 10 m/s were investigated.
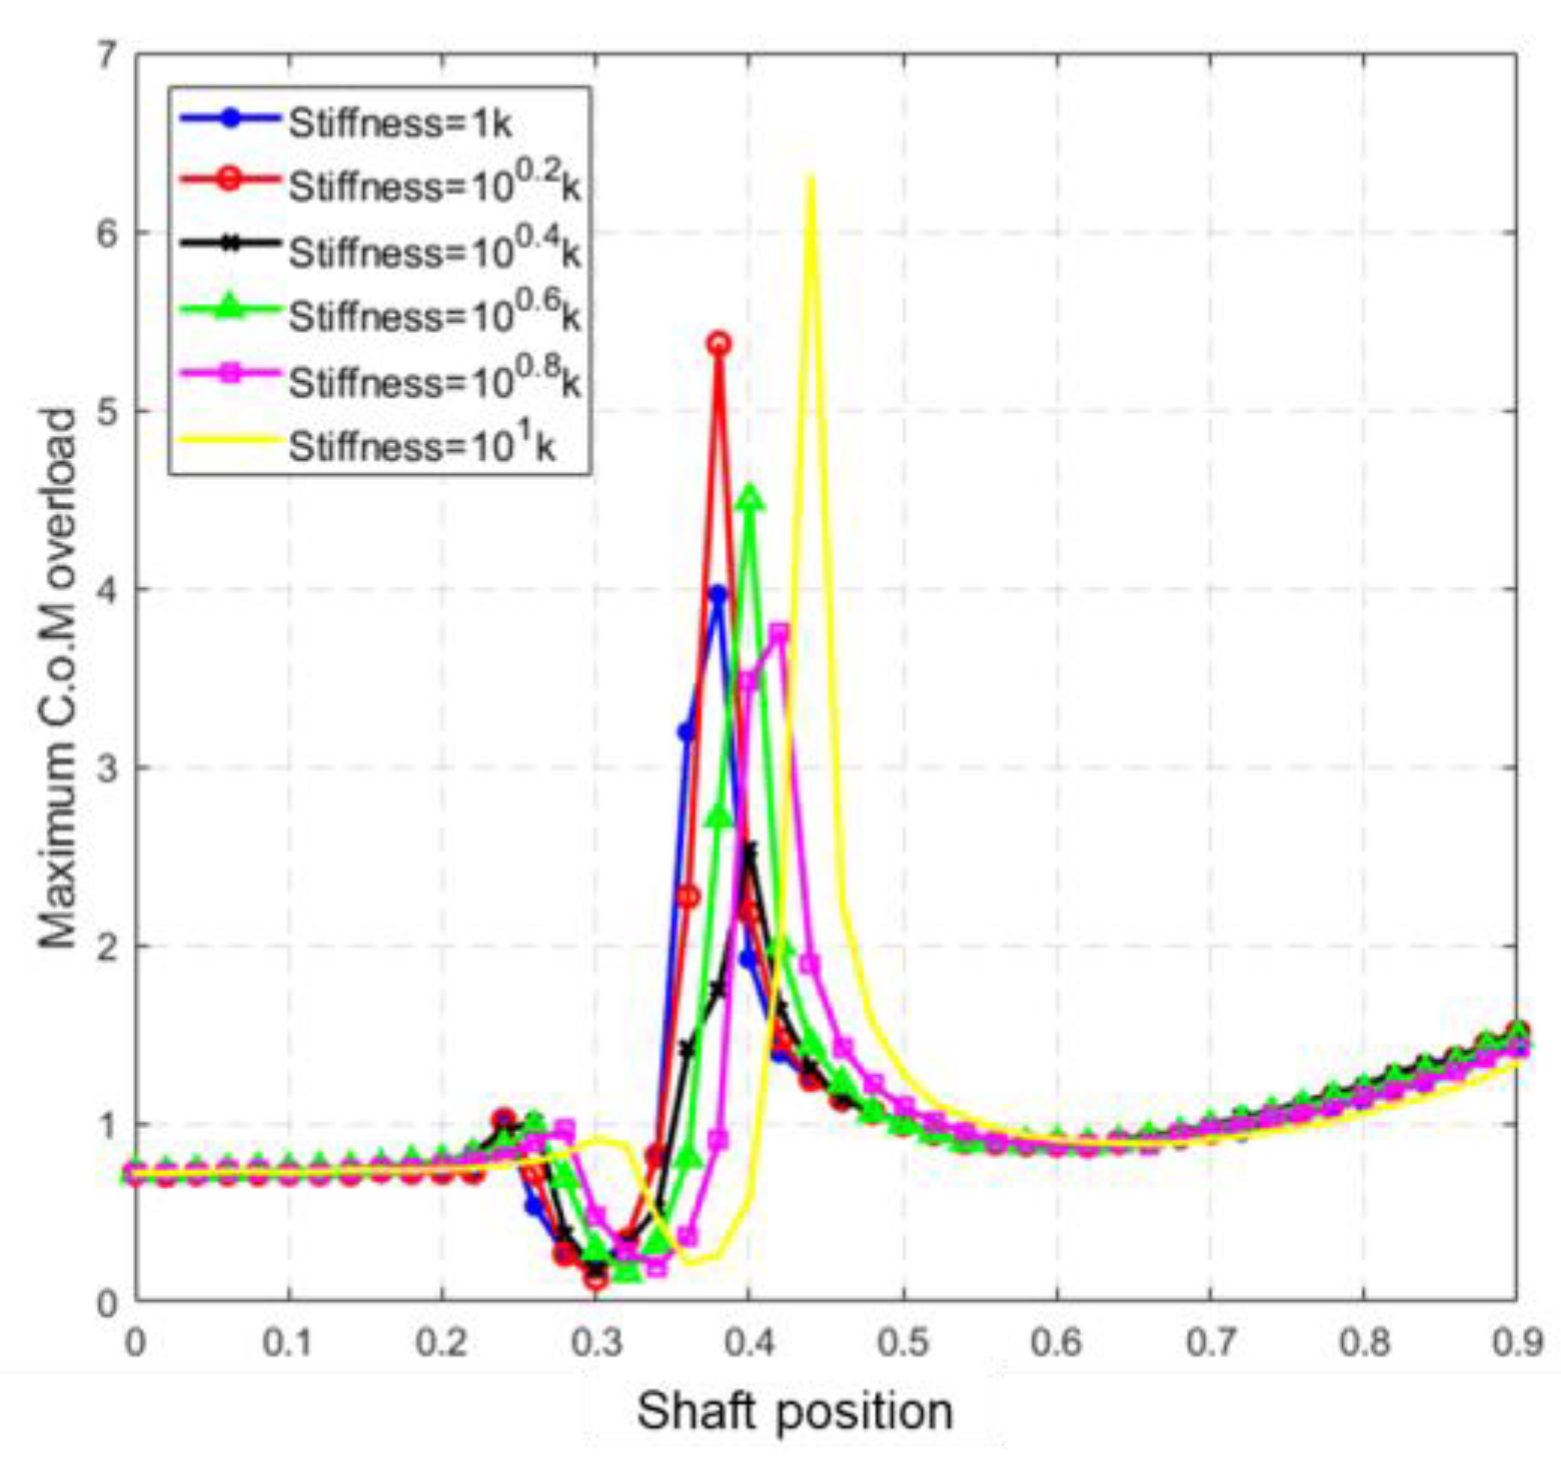
The effects of the shaft position and torsional stiffness on the peak value of the gravity center overload are shown in Figure 14. Different torsional stiffnesses led to almost the same maximum gravity center overload when the shaft position was close to the leading edge (0–0.2 c). Because, in this state, the shaft was far from the aerodynamic center, causing a significant pitching moment, the aerodynamic force tended to cause passive wingtip deflection, and the deflection angle of the passive wingtip did not change significantly. It is worth noting that the passive wingtip had little effect on the peak gravity center overload, which was almost the same as that without the passive wingtip.
The peak gravity center overload increased slowly then dropped to the minimum value, rose to the maximum value subsequently, and finally decreased to a specific value as the shaft position moved back. In the case of low shaft torsional stiffness, the peak gravity center overload value reached the minimum when the shaft position was distributed at 0.3–0.4 c from the leading edge, which was located behind the aerodynamic center of the passive wingtip. This indicates that for an active–passive combined GLA system, the best position for the passive wingtip shaft can be chosen as behind the aerodynamic center under low torsional stiffness, making the passive wingtip easier to deflect under aerodynamic force. As torsional stiffness increases, the minimum value of the peak gravity center overload moves back. Still, the peak value of gravity center overload tends to remain constant when torsional stiffness reaches a certain value. The shaft’s torsional stiffness is so great that the passive wingtip has almost no deflection.
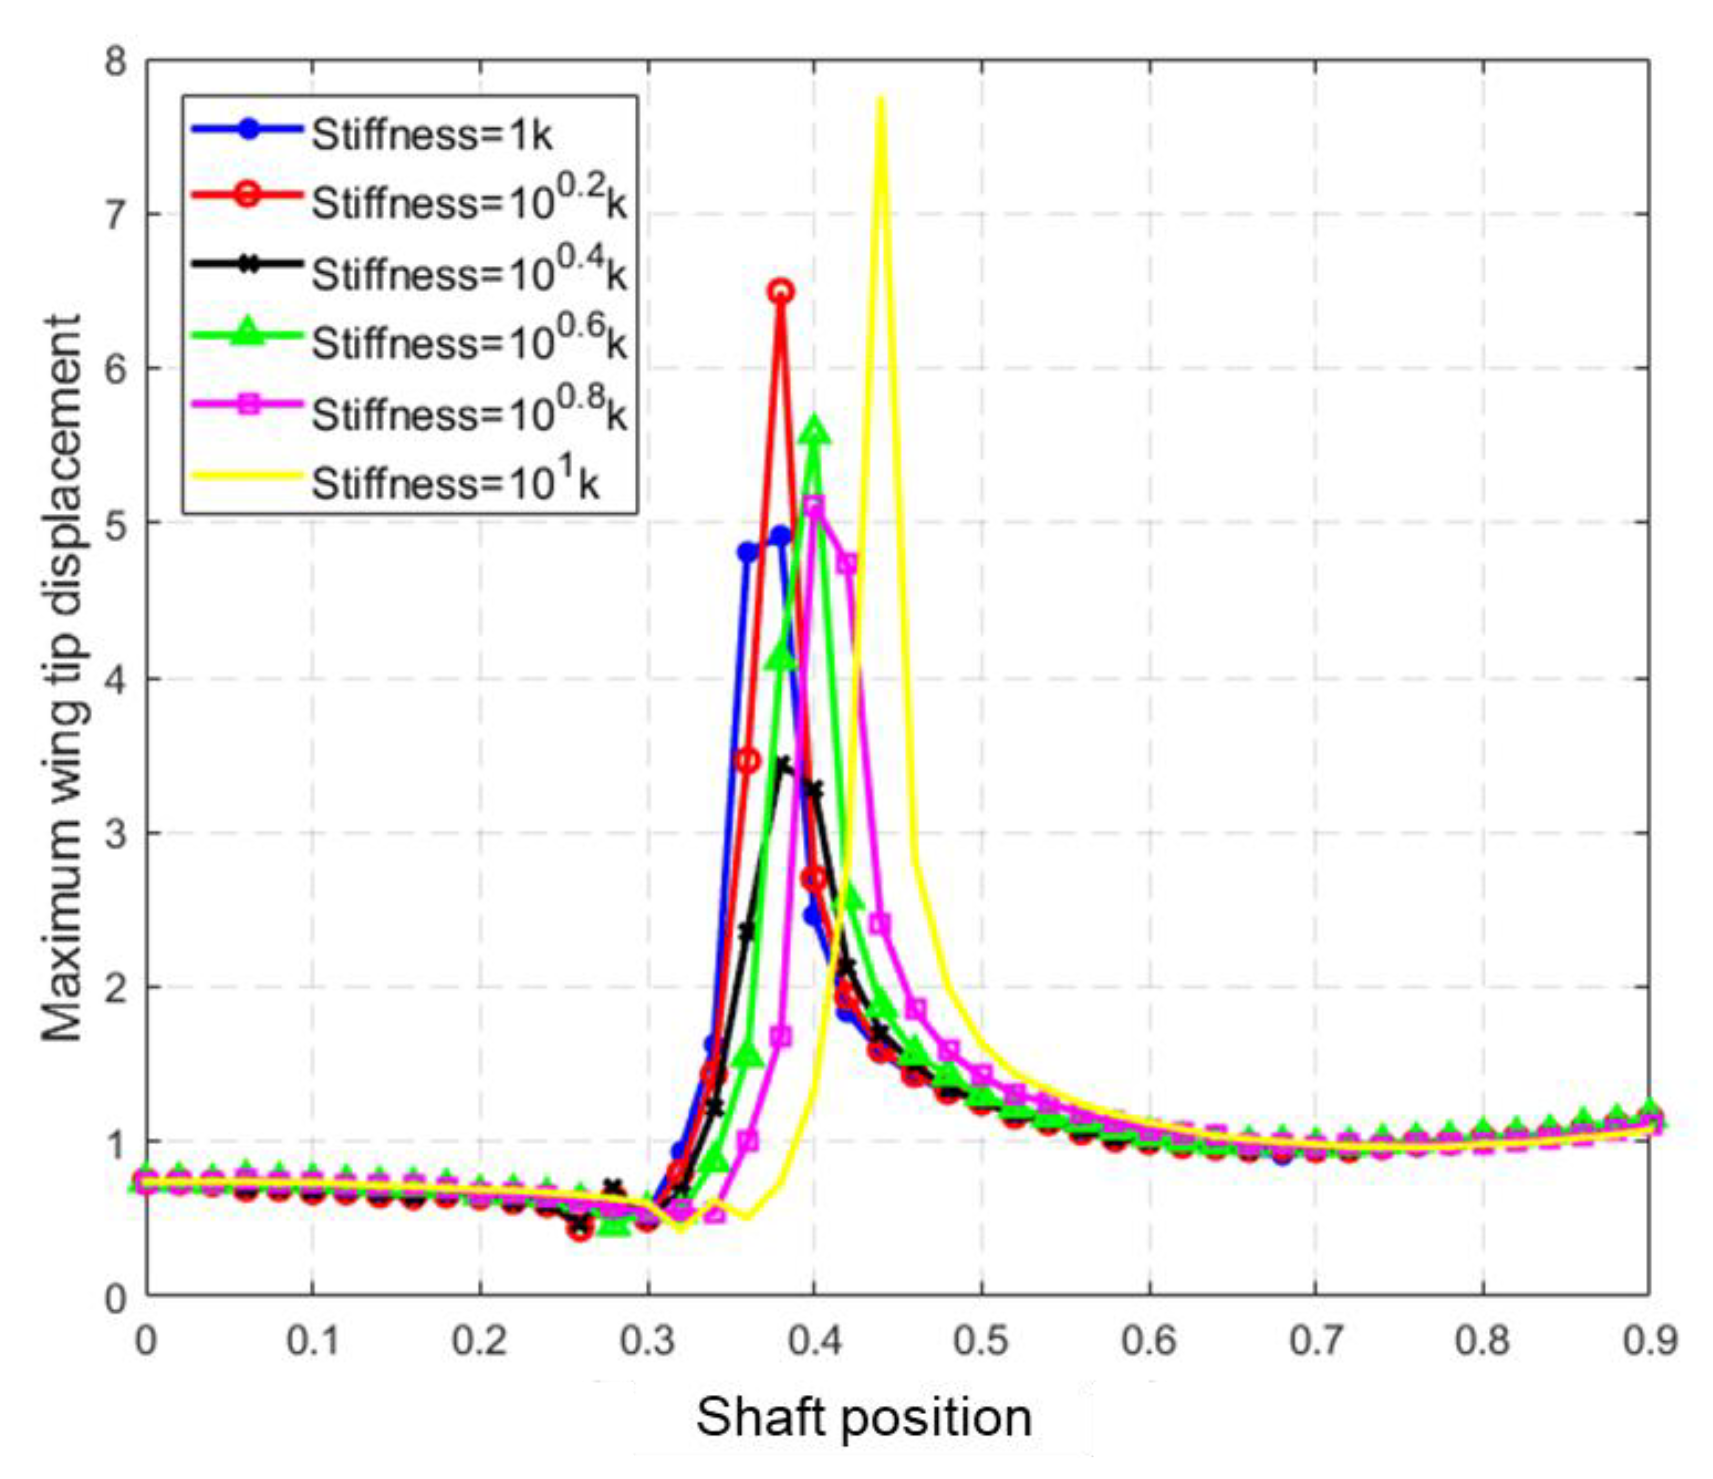
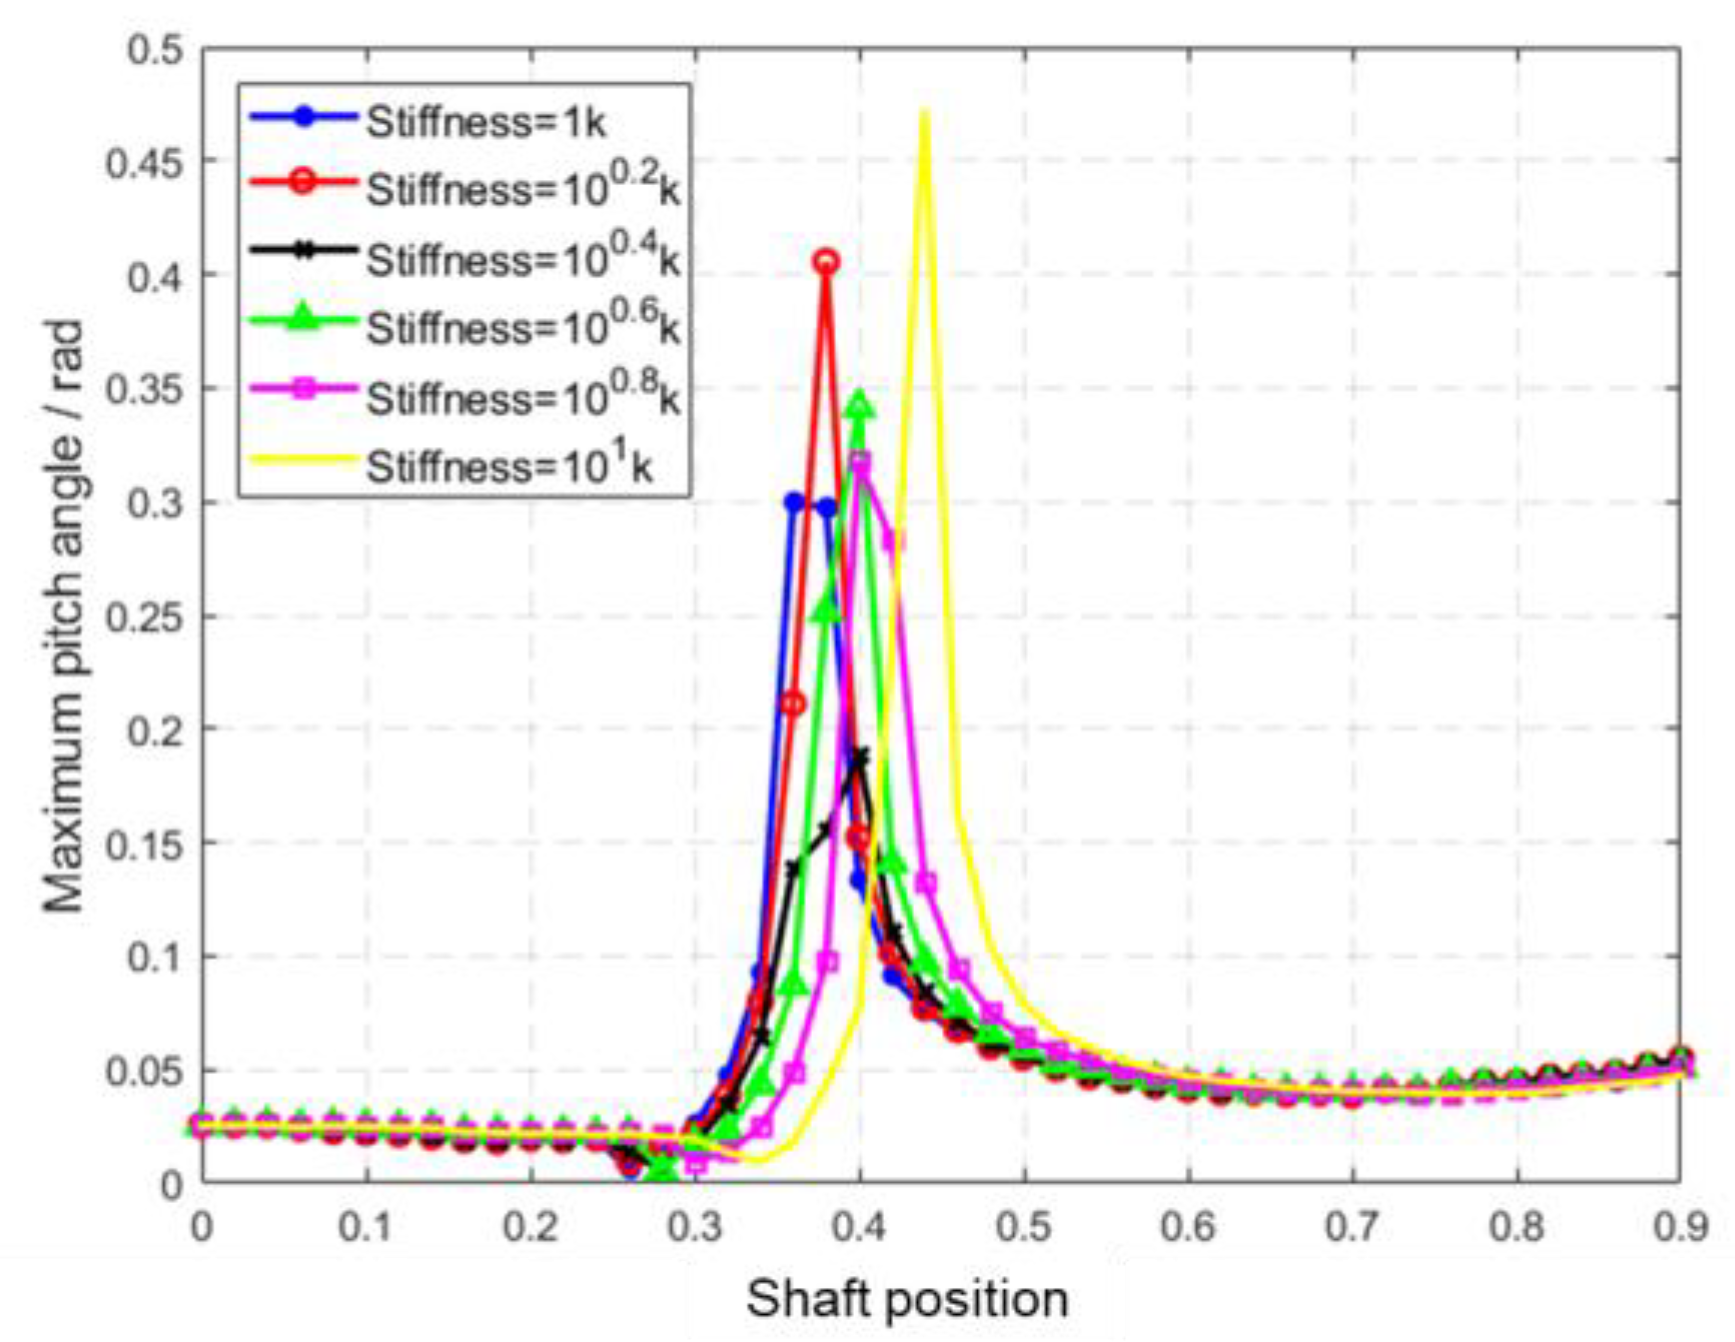
Figure 15 and Figure 16 show the effects of the shaft position and torsional stiffness on the peak value of the wingtip displacement and pitch angle. The curves show that the shaft position and torsional stiffness similarly impacted the peak value of the wingtip displacement, pitch angle, and gravity center overload. The difference is that the minimum values of the wingtip displacement and pitch angle moved forward relative to the minimum values of the peak center of gravity overload, distributed between 0.25–0.35 c from the leading edge. This indicates that when using passive wingtips for GLA, a trade–off assessment of various objectives needs to be performed, and the shaft position must be reasonably defined.

6.4. Gust Responses under Different Gust Conditions

The passive wingtip shaft was located0.3 c from the leading edge, and the torsional stiffness was 104 N∙m/rad. An analysis was carried out for conditions with a gust length of 50~200 m and strength of 5~20 m to investigate the effects of gust length and strength on gust response.
Figure 17a shows that the peak value of the gravity center overload first increased and then decreased with increasing gust length, and continued to decrease as the gust strength dropped. When the gust strength was minor, the gust had little impact on the aircraft. The control surfaces were sufficient to adjust the lift and attitude, making it impossible for gust length to impact the gravity center overload even if it changed greatly. When the gust strength became significant, the influence improved even further. When the gust length was minor, the result of the gust was small and did not lead to a significant gravity center overload. When the gust length increased to a certain magnitude, the rigid excitation and the elastic mode were easily coupled, leading to a significant overload of the gravity center. The external disturbance approached a constant state as the gust length increased when the control surfaces and passive wingtip had enough time to adjust the lift and attitude, leading to a decrease in gravity center overload.
The impacts of the gust length and strength on the peak values of the wingtip displacement and pitch angle are shown in Figure 17b,c. The figures show that the peak value trend of the pitch angle was similar to that of the gravity center overload. However, the peak value of wingtip displacement reached the maximum when the gust length was approximately 150 m and remained almost constant when the gust length was more than 150 m. The peak value of the pitch angle reached the maximum when the gust length was approximately 100 m.
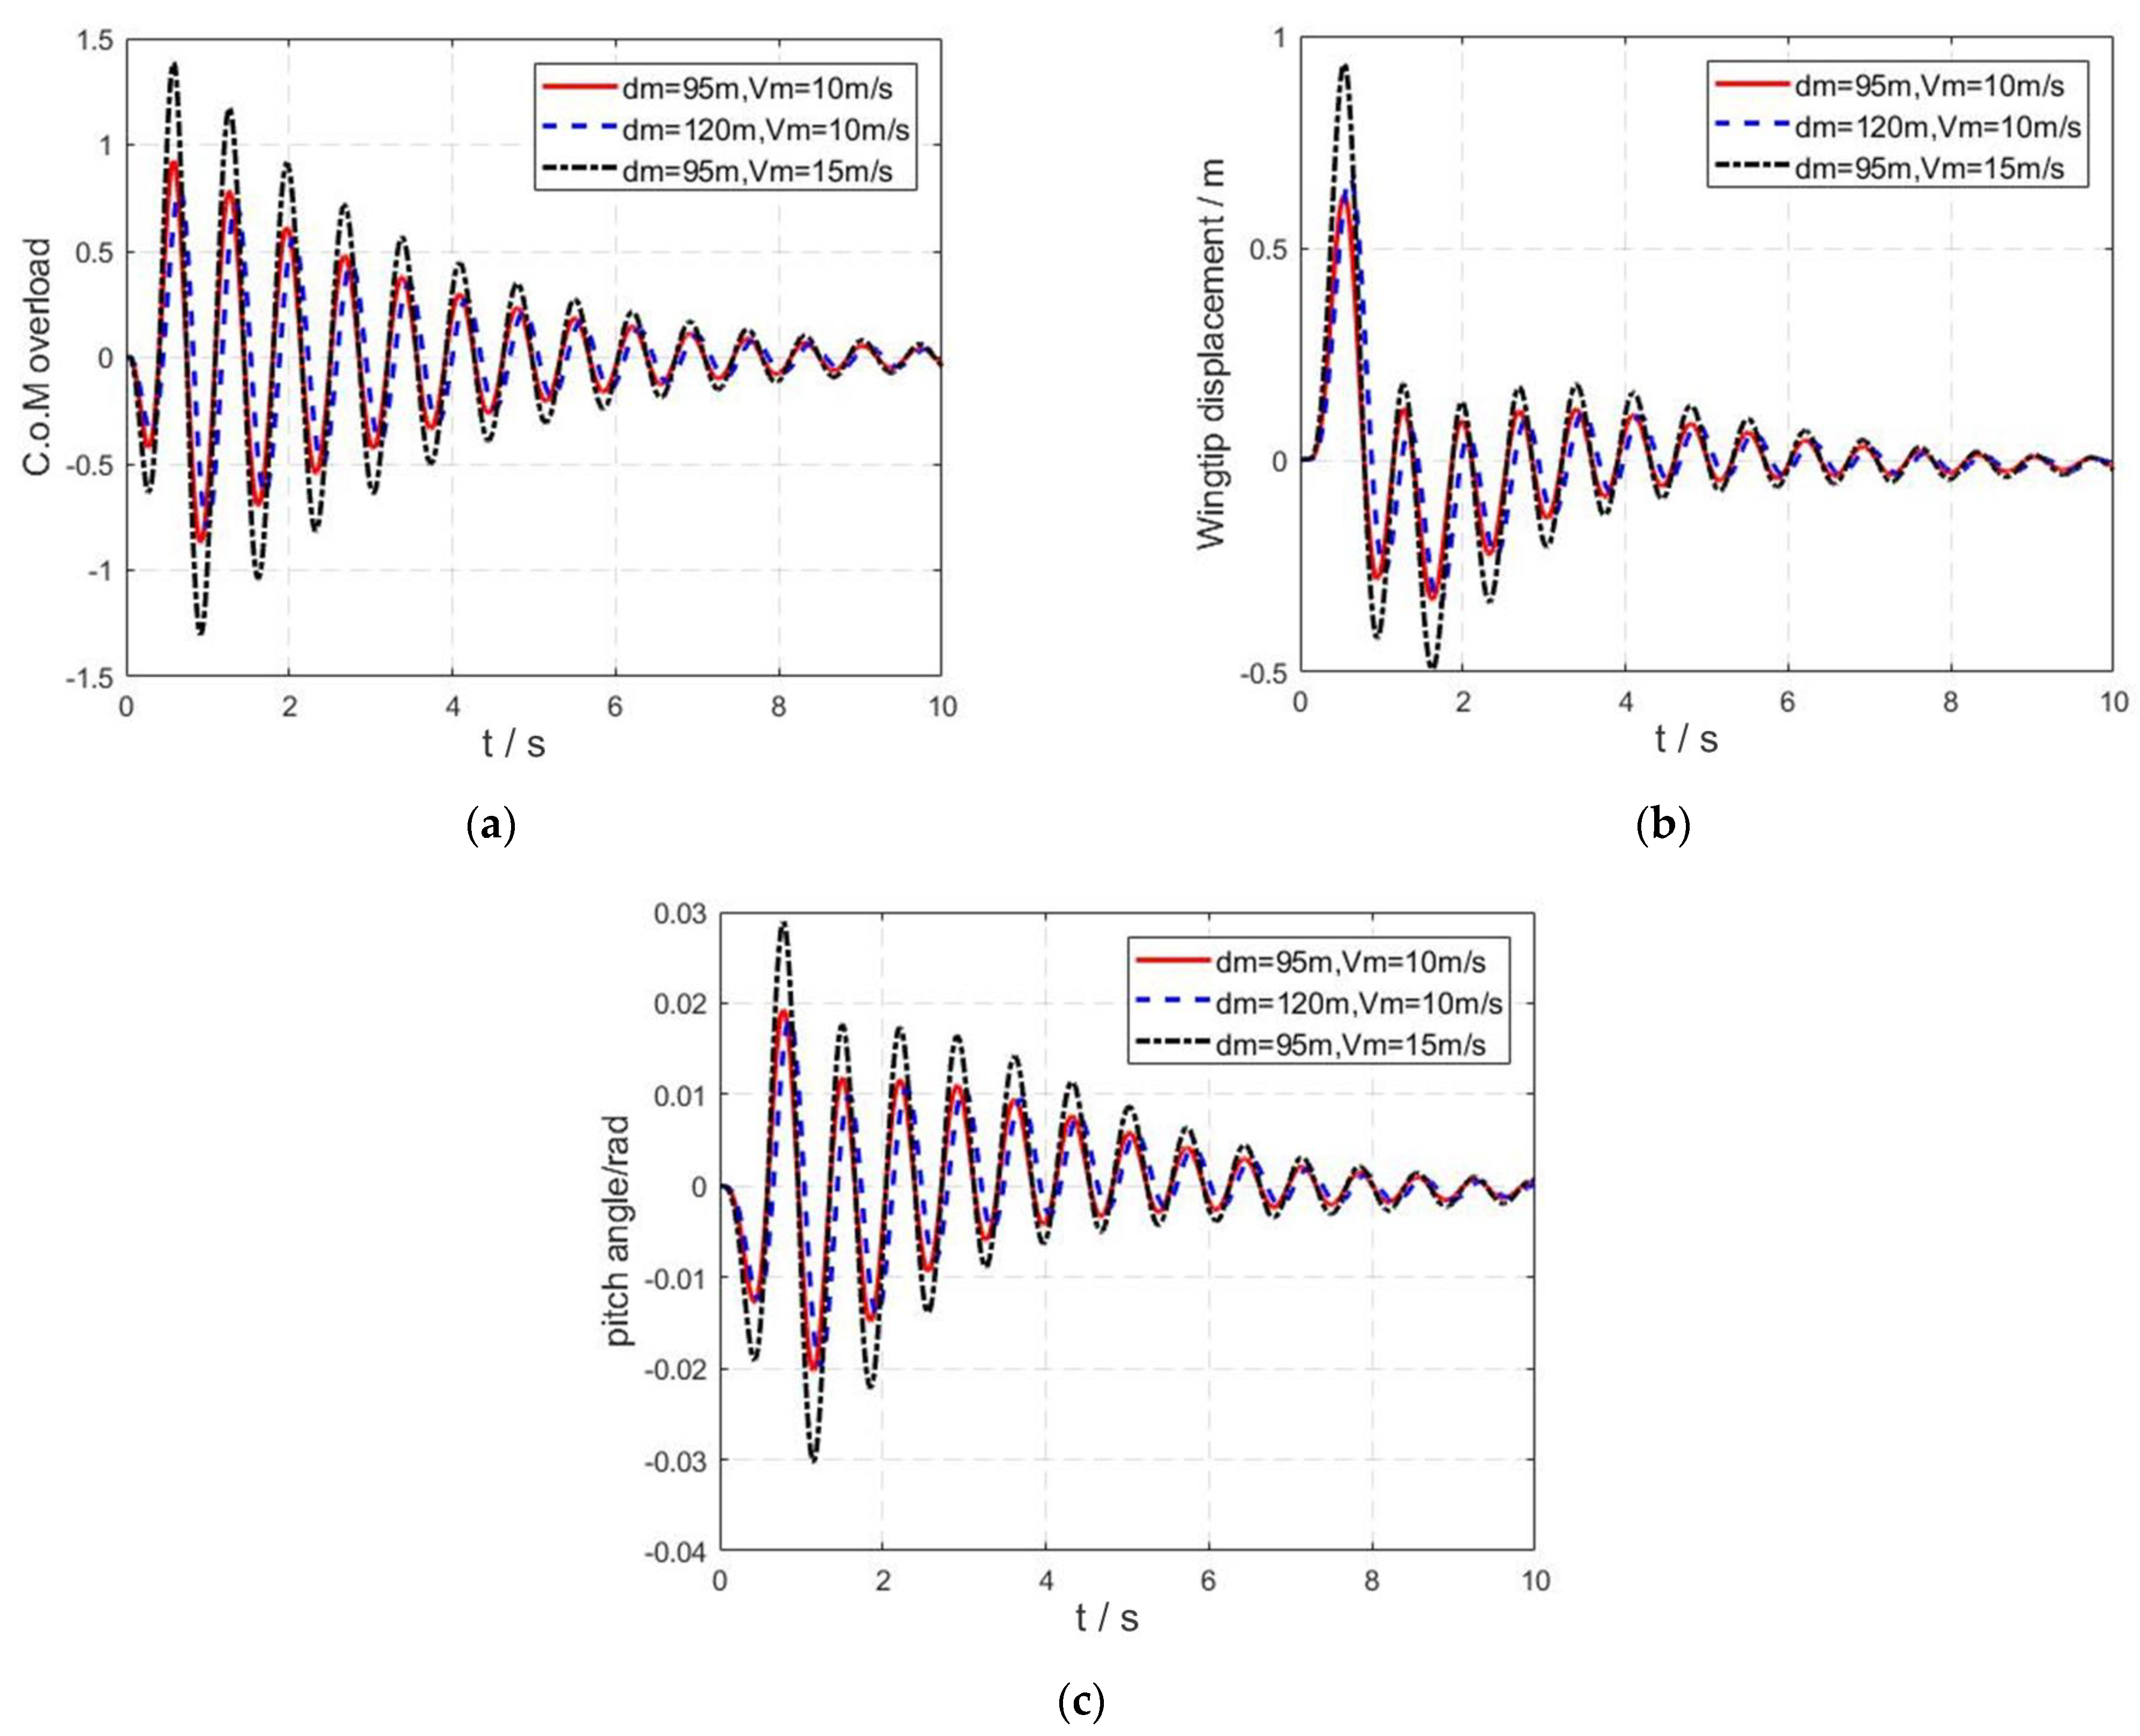
Figure 18 shows the time domain response curves under three different gust conditions. It can be concluded that the peak values had little relationship with the gust length. Nevertheless, when the gust strength increased, the peak values showed an apparent increase, resulting in aggravated wing vibration. The trend of response values remained consistent as time progressed.

7. Impact of Wing Deformation on the Electromagnetic Performance of the Antenna Array

Many indices exist to evaluate the electromagnetic performance of antenna arrays. According to the array form and the application scenario, this paper focuses on three parameters: the main beam angle, gain loss, and sidelobe level. These parameters are related to the detection and anti−jamming performance of the airborne radar.

7.1. The Impact of Static Deformation

The influence of static deformation of the 1st– to 4th– order mode of the antenna array on the pattern was investigated using the rapid method of conformal array far−field pattern based on the modal method. Figure 19a,b show the results of the E−plane and H−plane patterns, respectively. The maximum gain of the undeformed antenna array pattern was 20.37 dB, and the beam was directed in the normal direction of the wing’s front beam, which was the 155° direction in the E−plane and the 92° in the H−plane. The 1st−order deformation was mainly in the Z direction, while the deformation in the X and Y directions was small, leading to the low impact of the 1st−order deformation on the E−plane’s pattern. The influence of the 2nd–4th order deformation on the pattern was mainly reflected in the beam angle offset and change in the sidelobe level, while the maximum gain showed little difference.
For the E−plane pattern, the sidelobe level of the 2nd−order deformation increased the most, by 0.4 dB, and the 4th–order deformation beam showed a maximum leftward shift of 2.0°. In contrast, the 3rd−order deformation beam demonstrated a full rightward change of 0.8°. Regarding the H−plane pattern, the 2nd−order deformation sidelobe level rose the most, by 1.3 dB, and the 4th−order deformation beam showed a maximum leftward shift of 13.5°. In contrast, the 3rd−order deformation beam demonstrated a full rightward change of 6.0°.

7.2. The Impact of Dynamic Deformation

The passive wingtip rotation shaft was located at 0.1 c from the leading edge with a torsional stiffness of 104 N∙m/rad, a gust length of 95 m, and a gust strength of 10 m/s. The effects of the active–passive combined GLA method were investigated. The time domain response curves of the conformal antenna array are shown below.
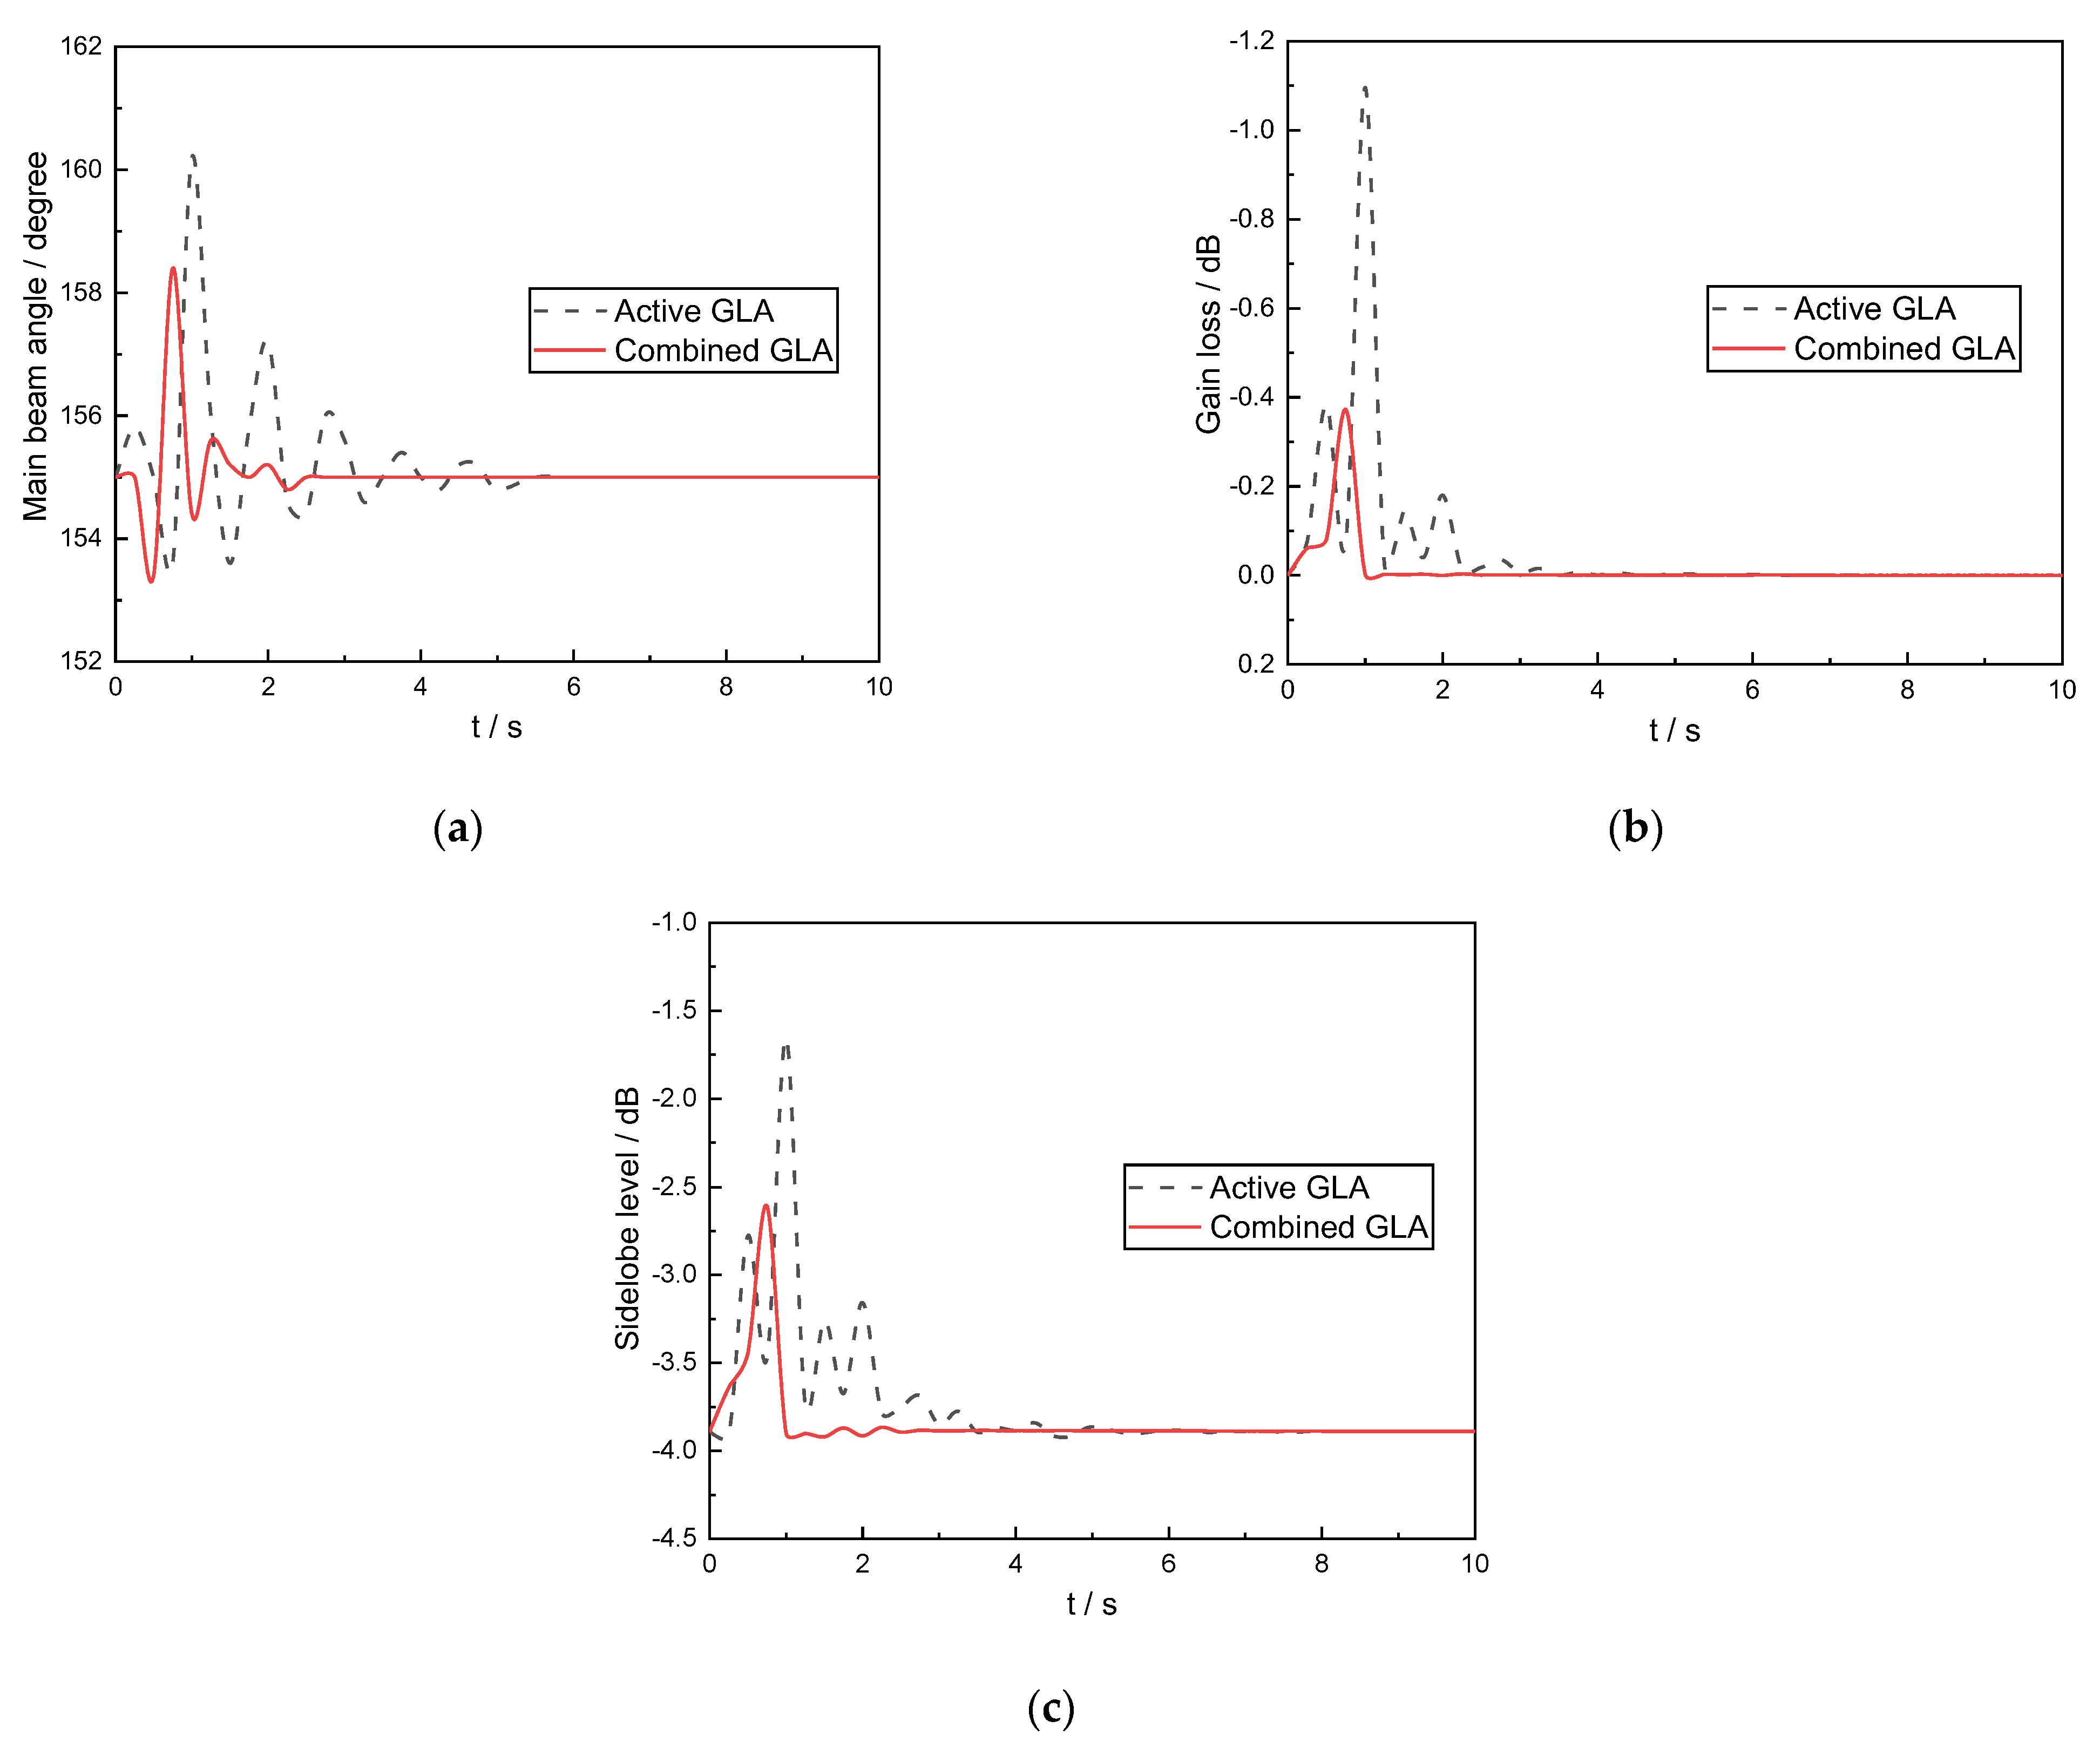
Figure 20a shows the beam angle’s response curves. The peak values of the two methods were 160.2° and 158.4°, respectively, and it was found that the active–passive combined GLA method worked better, achieving a reduction of 34.6%. From the curves of the gain loss response shown in Figure 20b, the gain loss of the active–passive combined GLA method decreased compared with that of the active GLA method, with the peak value dropping by 0.72 dB in this state. This was beneficial for maintaining the detection capability of the antenna array. Figure 20c shows the response curves of the sidelobe level. Compared with the active GLA method, the active–passive combined GLA method was able to significantly decrease the sidelobe level. In this state, the peak value was reduced by 0.96 dB, and its trend became flatten, which was beneficial for the subsequent electromagnetic performance compensation of the antenna array.

8. Conclusions

Under the gust load, the wing of the SensorCraft was incredibly bent and twisted, resulting in the performance loss of the aircraft platform and conformal antenna array. To address this problem, a wing conformal antenna array was designed, a dynamic aircraft model with a passive wingtip device was established, the control law was designed by the LQG/LTR method, and the active–passive combined GLA method was proposed. The unsteady aerodynamic reduced–order model based on the Volterra series was established, the rapid approach of conformal array far–field pattern based on the modal method was proposed, and the influence of the active–passive combined GLA method on the aircraft platform and the conformal antenna was analyzed in detail. From the results, we were able to reach the following conclusions.
(1)
The unsteady aerodynamic reduced–order model based on the Volterra series is effective for predicting the modal response of the system, and can be used for rapid analysis of the aeroelastic response of the SensorCraft platform under gust. The far–field pattern method based on modal superposition can be used to rapidly evaluate the electromagnetic performance of conformal arrays under dynamic loads.
(2)
Compared with the LQG/LTR active GLA method, the active–passive combined GLA method of “LQG/LTR active controller + passive wingtip” can significantly reduce the peak response of wingtip displacement and pitch angle. The peak response of the inner control surface decreases, and the outer control surface increases under the active–passive combined GLA method. The reason for this is that the outer control surface needs to control both the attitude angle and wingtip displacement, causing a large surface deflection.
(3)
As the shaft position of the passive wing moves backward, the peak value of gravity overload reaches the minimum when the shaft position is at 0.3–0.4 c from the leading edge, which is located behind the aerodynamic center, where the wingtip is easier to deflect. The peak values of the wingtip displacement and pitch angle reach the minimum when the shaft of the passive wingtip is located at 0.25–0.35 c from the leading edge. When using a passive wingtip for GLA, it is necessary to conduct a trade–off evaluation of various targets and reasonably define the position of the shaft.
(4)
With the increase in gust length, the peak values of gravity center overload, wingtip displacement, and pitch angle increase and decrease. The wingtip displacement peaks when the gust length is approximately 150 m, and the peak value of the pitch angle is achieved when the gust length is about 100 m.
(5)
The 1st–order deformation has little impact on the pattern. The effects of the 2nd–4th order deformation on the pattern are mainly reflected in the main beam angle and sidelobe level, and the main lobe gain exhibits little change.
Compared with the active method, the active–passive combined GLA method reduces the peak values of the main beam angle, main lobe gain loss, and sidelobe level. The peak value of gain loss drops by 0.72 dB, which is beneficial for maintaining the detection and anti–jamming capabilities of the antenna array.
The detailed scheme design of the aircraft platform and the antenna array was completed, and some progress was made in the simulation analysis. Subsequently, a test prototype will be manufactured and a ground test will be carried out.

Author Contributions

Conceptualization, S.H., T.M. and P.T.; methodology, Y.W. and P.T.; software, S.H.; validation, S.Z., Y.W. and H.L.; formal analysis, P.T. and T.M.; investigation, S.H.; resources, S.Z.; data curation, Y.W.; writing—original draft preparation, S.H., T.M. and P.T.; writing—review and editing, S.Z., Y.W. and H.L.; visualization, H.L.; supervision, T.M.; project administration, T.M.; funding acquisition, S.Z. All authors have read and agreed to the published version of the manuscript.

Funding

This research was funded by National Natural Science Foundation of China, grant number 52202430.

Conflicts of Interest

The authors declare no conflict of interest.

References

  1. Cord, T.; Newbern, S. Unmanned air vehicles: New challenges in design. In Proceedings of the Aerospace Conference, Big Sky, MT, USA, 10–17 March 2001. [Google Scholar]
  2. Hall, J.K.; Clark, C.S. SensorCraft Mission Simulation Study; Air Force Research Laboratory, Wright–Patterson AFB OH Air Vehicles Directorate: Dayton, OH, USA, 2002. [Google Scholar]
  3. Genello, G.J.; Baldygo, W.J., Jr.; Callahan, M.J. Modeling and simulation for Sensor Craft multi–mission radar. In Proceedings of the Aerospace Conference, Big Sky, MT, USA, 10–17 March 2001. [Google Scholar]
  4. Smallwood, B.; Canfield, R.; Terzuoli, A. Structurally integrated antennas on a joined–wing aircraft. In Proceedings of the 44th AIAA/ASME/ASCE/AHS/ASC Structures, Structural Dynamics, and Materials Conference, Norfolk, VA, USA, 7–13 April 2003. [Google Scholar]
  5. Vartio, E.; Shaw, E.; Vetter, T. Gust load alleviation flight control system design for a SensorCraft vehicle. In Proceedings of the 26th AIAA Applied Aerodynamics Conference, Honolulu, HI, USA, 18–21 August 2008. [Google Scholar]
  6. Yagil, L.; Raveh, D.E.; Idan, M. Elastic deformations control of highly flexible aircraft in trimmed flight and gust encounter. J. Aircr. 2017, 55, 829–840. [Google Scholar] [CrossRef]
  7. Fonte, F.; Toffol, F.; Ricci, S. Design of a wing tip device for active maneuver and gust load alleviation. In Proceedings of the 2018 AIAA/ASCE/AHS/ASC Structures, Structural Dynamics, and Materials Conference, Kissimmee, FL, USA, 8–12 January 2018. [Google Scholar]
  8. Castrichini, A.; Hodigere Siddaramaiah, V.; Calderon, D.E.; Cooper, J.E.; Wilson, T.; Lemmens, Y. Nonlinear folding wing tips for gust loads alleviation. J. Aircr. 2016, 53, 1391–1399. [Google Scholar] [CrossRef]
  9. Perron, G.; Drela, M. Competition passive gust load alleviation through the bend–twist coupling of composite beams on typical commercial airplane wings. In Proceedings of the 54th AIAA/ASME/ASCE/AHS/ASC Structures, Structural Dynamics, and Materials Conference, Boston, MA, USA, 8–11 April 2013. [Google Scholar]
  10. Cooper, J.E.; Miller, S.; Vio, G.A.; Sensburg, O. Optimization of a scaled SensorCraft model with passive gust alleviation. In Proceedings of the 12th AIAA/ISSMO Multidisciplinary Analysis & Optimization Conference, Victoria, TX, USA, 10–12 September 2008. [Google Scholar]
  11. Cooper, J.E. Structural Design and Analysis of an Aeroelastic Tailoring and Passive Load Alleviation Concept for A Sensor Craft; Manchester University: Manchester, UK; EOARD: London, UK, 2007. [Google Scholar]
  12. Cooper, J.E.; Chekkal, I.; Cheung, R.; Wales, C.; Allen, N.J.; Lawson, S.; Peace, A.J.; Cook, R.; Standen, P.; Hancock, S.D.; et al. Design of a morphing wingtip. J. Aircr. 2014, 52, 1394–1403. [Google Scholar] [CrossRef]
  13. Guo, S.; Li, D.; Sensburg, O. Optimal design of a passive gust alleviation device for a flying wing aircraft. In Proceedings of the 12th AIAA Aviation Technology, Integration, and Operations (ATIO) Conference and 14th AIAA/ISSMO Multidisciplinary Analysis and Optimization Conference, Indianapolis, IN, USA, 17–19 September 2012. [Google Scholar]
  14. Guo, S.; Sensburg, O. Passive Gust Alleviation for a Flying Wing Aircraft; Cranfield University: Bedford, UK; AFRL: Dayton, OH, USA, 2013. [Google Scholar]
  15. Guo, S.; Sensburg, O. Wind Tunnel Model and Test to Evaluate the Effectiveness of a Passive Gust Alleviation Device for a Flying Wing Aircraft; Cranfield University: Bedford, UK; AFRL: Dayton, OH, USA, 2016. [Google Scholar]
  16. Roberts, R.W. Sensor–Craft Analytical Certification; Air Force Institute of Technology, Wright–Patterson AFB OH School of Engineering and Management: Dayton, OH, USA, 2003; pp. 22–36. [Google Scholar]
  17. Knott, P. Deformation and Vibration of Conformal Antenna Arrays and Compensation Techniques; Fgan–Fhr Research Institute for High Frequency Physics and Radar Techniques Wachtberg: Waterberg, Germany, 2006. [Google Scholar]
  18. Lucia, D. The SensorCraft configurations: A non–linear aeroservoelastic challenge for aviation. In Proceedings of the 46th AIAA/ASME/ASCE/AHS/ASC Structures, Structural Dynamics and Materials Conference, Austin, TX, USA, 18–21 April 2005. [Google Scholar]
  19. Silva, W. Identification of nonlinear aeroelastic systems based on the Volterra theory: Progress and opportunities. Nonlinear Dyn. 2005, 39, 25–62. [Google Scholar] [CrossRef]
  20. Marzocca, P.; Librescu, L.; Silva, W. Nonlinear open/closed–loop aeroelastic analysis of airfoils via Volterra series. AIAA J. 2004, 42, 673–686. [Google Scholar] [CrossRef]
  21. Vartio, E.; Shimko, A.; Tilmann, C.; Flick, P. Structural modal control and gust load alleviation for a SensorCraft concept. In Proceedings of the 46th AIAA/ASME/ASCE/AHS/ASC Structures, Structural Dynamics, and Materials Conference, Austin, TX, USA, 18–21 April 2005. [Google Scholar]
  22. Song, L.; Lu, S.; Han, C.; Zhou, J.; Huang, J.; Li, P.; Ghorbani, K. Efficient computation of real–time distorted conformal load–bearing antenna structure under dynamic mechanical load based on modal superposition. IEEE J. Multiscale Multiphys. Comput. Tech. 2018, 3, 246–254. [Google Scholar] [CrossRef]
  23. Gao, C.; Liu, X.; Zhang, W. On the dispersion mechanism of the flutter boundary of the AGARD 445.6 wing. AIAA J. 2021, 8, 2657–2669. [Google Scholar] [CrossRef]
  24. Yateo, E.C.J. AGARD Standard Aeroelastic Configurations for Dynamic Response Wing 445.6; NASA Langley Research Center: Hampton, VA, USA, 1988.
  25. Goura, G.; Badcock, K.J.; Woodgate, M.A.; Richards, B.E. Implicit Methods for the Time Marching Analysis of Flutter. Aeronaut. J. 2001, 105, 199–214. [Google Scholar] [CrossRef]
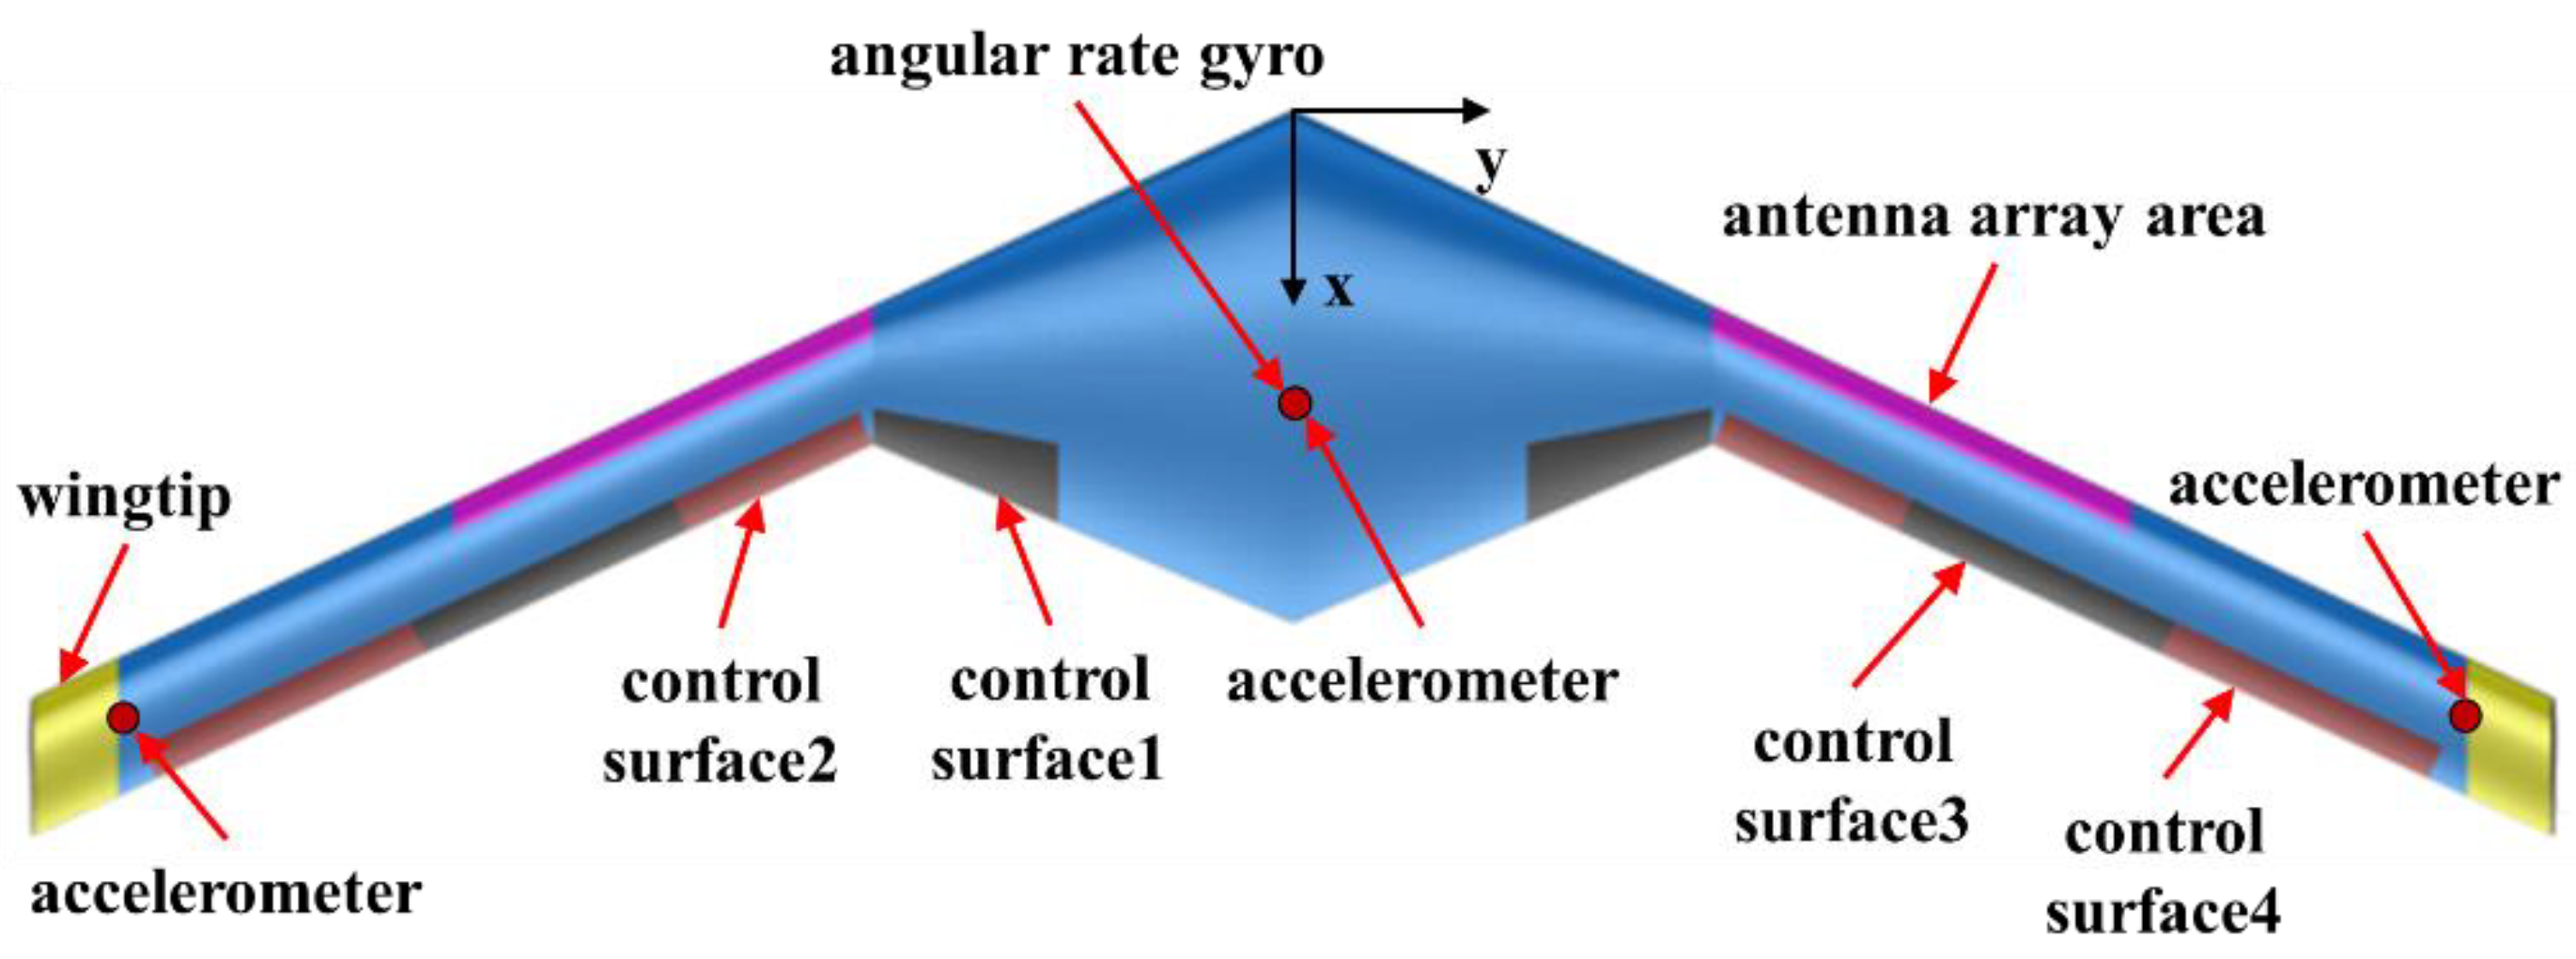
Figure 1. Model of the flying wing SensorCraft.
Aerospace 10 00511 g001
Figure 2. Diagram of the wing–conformal antenna array.
Aerospace 10 00511 g002
Figure 3. Diagram of the passive wingtip device.
Aerospace 10 00511 g003
Figure 4. The spatial shape of a discrete gust.
Aerospace 10 00511 g004
Figure 5. Coordinate transformation process of the element pattern. where φ p , θ p , f p is the local spherical coordinate form of the pattern of each array element, and x p , y p , z p is the local rectangular coordinate form. In step 1, the pattern was converted from local spherical to rectangular coordinates. In step 2, the pattern was rotated from the local rectangular coordinates and converted to the pattern of the global rectangular coordinates. In step 3, the pattern was converted from the global Cartesian coordinates to the pattern of the global spherical coordinates.
Aerospace 10 00511 g005
Figure 6. Diagram of the active GLA system.
Aerospace 10 00511 g006
Figure 7. Sine response of AGARD 445.6 wing modes: (a) sine response of the 1st−order mode; (b) sine response of the 2nd−order mode; (c) sine response of the 3rd−order mode; and (d) sine response of the 4th−order mode.
Aerospace 10 00511 g007
Figure 8. Comparison of AGARD 445.6 wing flutter boundaries: (a) normalized flutter velocity and (b) flutter frequency ratio.
Aerospace 10 00511 g008
Figure 9. Finite element model of the SensorCraft.
Aerospace 10 00511 g009
Figure 10. Modal parameters of the SensorCraft: (a) 1st−order mode of the SensorCraft; (b) 2nd−order mode of the SensorCraft; (c) 3rd−order mode of the SensorCraft; and (d) 4th−order mode of the SensorCraft.
Aerospace 10 00511 g010aAerospace 10 00511 g010b
Figure 11. Comparison between the active method and the combined method. (a) Response curve of gravity center overload; (b) response curve of wingtip displacement; and (c) response curve of pitch angle.
Aerospace 10 00511 g011aAerospace 10 00511 g011b
Figure 12. Response curve of the modal displacement. (a) Generalized displacement of 1st−mode; (b) generalized displacement of 2nd−mode; (c) generalized displacement of 3rd−mode; and (d) generalized displacement of 4th−mode.
Aerospace 10 00511 g012
Figure 13. Response curve of the wingtip and control surfaces. (a) response curve of the passive wingtip rotation angle; (b) response curve of the control surface 1; (c) response curve of the control surface 2; and (d) response curve of the control surface 4.
Aerospace 10 00511 g013
Figure 14. Effects of shaft position and torsional stiffness on the maximum center of gravity overload.
Aerospace 10 00511 g014
Figure 15. Effects of shaft position and torsional stiffness on the maximum center of gravity overload.
Aerospace 10 00511 g015
Figure 16. Effects of shaft position and torsional stiffness on maximum pitch angle.
Aerospace 10 00511 g016
Figure 17. Effects of gust length and gust strength. (a) Maximum gravity center overload; (b) maximum wingtip displacement; and (c) maximum pitch angle.
Aerospace 10 00511 g017
Figure 18. Time domain response under different gust conditions. (a) Response curve of gravity center overload; (b) response curve of wingtip displacement; and (c) response curve of pitch angle.
Aerospace 10 00511 g018
Figure 19. Influence of the 1st–4th order static deformation on the antenna array pattern. (a) Comparison of the E–plane pattern; and (b) comparison of H–plane pattern.
Aerospace 10 00511 g019
Figure 20. Comparison between the active method and the combined method. (a) Comparison of the main beam angle; (b) comparison of the gain loss; and (c) comparison of the sidelobe level.
Aerospace 10 00511 g020
Table 1. Parameters of the glass fiber composites.
Compressive Modulus (MPa)Tensile Modulus (MPa)Shear Modulus (MPa)
22,00030003000
Compressive strength (MPa)Tensile strength (MPa)Shear strength (MPa)
388540120
Table 2. Modal parameters of the SensorCraft.
Mode ShapeFrequency (Hz)
1st bending mode0.763
2nd bending mode4.336
1st torsion mode8.502
3rd bending mode10.559
Disclaimer/Publisher’s Note: The statements, opinions and data contained in all publications are solely those of the individual author(s) and contributor(s) and not of MDPI and/or the editor(s). MDPI and/or the editor(s) disclaim responsibility for any injury to people or property resulting from any ideas, methods, instructions or products referred to in the content.