Article

Mathematical Modelling and Fluidic Thrust Vectoring Control of a Delta Wing UAV

by
Ahsan Tanveer
1 and
Sarvat Mushtaq Ahmad
2,3,*
1
Department of Mechanical & Aerospace Engineering, Institute of Avionics & Aeronautics, Air University, Islamabad 44000, Pakistan
2
Control & Instrumentation Engineering Department, King Fahd University of Petroleum and Minerals, Dhahran 31261, Saudi Arabia
3
Interdisciplinary Research Center for Intelligent Manufacturing and Robotics, King Fahd University of Petroleum and Minerals, Dhahran 31261, Saudi Arabia
*
Author to whom correspondence should be addressed.
Aerospace 2023, 10(6), 563; https://doi.org/10.3390/aerospace10060563
Submission received: 16 April 2023 / Revised: 9 June 2023 / Accepted: 13 June 2023 / Published: 16 June 2023
(This article belongs to the Section Aeronautics)

Abstract

:
Pitch control of an unmanned aerial vehicle (UAV) using fluidic thrust vectoring (FTV) is a relatively novel technique requiring no moving control surfaces, such as elevators. In this paper, the authors’ previous work on the characterization of a static co-flow FTV rig is further validated using the free to pitch dynamic test bench. The deflection of a primary jet after injection of a high-velocity secondary jet was captured using the tuft flow visualization technique, along with the experimental recording of subsequent normal force impinged on the Coanda surface resulting in the pitching moment. The effect of primary and secondary flow velocities on exhaust jet deflection, as well as on the pitch angle of the aircraft, is examined. Aerodynamic gain as well as the inertia of a delta wing UAV test bench are computed through experiments and fed into the equation of motion (e.o.m). The e.o.m developed aided in the design of a model-based PID controller for pitch motion control using the multi-parameter root locus technique. The root locus tuned controller serves as a benchmark controller for performance evaluation of the genetic algorithm (GA) and particle swarm optimization (PSO) tuned controllers. Furthermore, the frequency domain metric of gain and phase margins were also employed to reach a robust control design. Experiments conducted in a simulation environment reveal that PSO-PID results in a better response of the UAV in comparison to the baseline pitch controller.

1. Introduction

Maneuverability—a key feature in aerial vehicles—is traditionally achieved using conventional control surfaces. However, this approach is not effective in an operational envelope where dynamic pressure is low, such as high-altitude operations where the air is thin. In such a regime, mechanical thrust vectoring (MTV) has shown to be more effective in combination with conventional aerodynamic control surfaces [1,2,3,4,5], in particular for military aircraft such as the Lockheed Martin F-22 Raptor, VAAC Harrier, and Sukhoi Su-30 MKI. In MTV, the control is transferred to the power plant instead of the control surfaces. This is rendered by gimbaling the nozzle or deflecting the flaps/vanes, leading to increased complexity and weight [2].
In recent years, however, a novel concept called fluidic thrust vectoring (FTV) has gained a fair bit of attention due to its several inherent advantages such as having no moving parts, being less complex compared to MTV, and its low weight penalty. As a consequence, FTV has emerged as an attractive alternative to MTV. FTV works on the concept of moving the primary jet emanating from the engine away from its principle axis by injecting a high-velocity secondary jet in the vicinity of the primary jet to achieve pitch [6,7] or yaw [7,8] moments. The underlying phenomenon enabling FTV is the Coanda Effect, which is the tendency of a flowing fluid to attach itself to a solid convex surface in its proximity [9]. FTV sparked a lot of interest because of its ability to considerably reduce aircraft size and weight owing to the absence of any moving components [10], fast response [11], and stealth properties [12]. Moreover, the control of an unmanned aerial vehicle (UAV) using FTV is more energy efficient than using conventional aerodynamic surfaces [13], in particular at high altitudes with the added benefit of reduced radar signature [12].
A fluidic thrust vectoring nozzle utilizes a secondary air source to redirect the thrust vector of the primary jet off-axis. Various fluidic thrust vectoring techniques, including co-flow, counter-flow, shock vector control, throat skewing, and synthetic jet actuation, are employed in practice [14]. These techniques differ in how the secondary air source is utilized. Among them, co-flow FTV is the most commonly used and fundamental technique in subsonic UAVs [12]. In co-flow FTV, thrust vectoring is achieved by positioning curved surfaces, known as Coanda surfaces, toward the rear of the exhaust nozzle. As illustrated in Figure 1, a secondary stream of air flows parallel to the Coanda surface, generating shear forces that cause the air to attach to the curved surface. This attachment creates a pressure gradient perpendicular to the primary jet centerline, resulting in the deflection of the primary jet [12].
Work of similar nature is the authors’ previous work on the characterization of a co-flow FTV rig [6]. The study, however, makes use of a static test bench as opposed to the dynamic test rig being investigated in this work. Additionally, Saghafi et al. [15] and Wu et al. [16] have developed a detailed model for co-flow FTV drones using numerical simulation data.
The two dominant FTV mechanisms are co-flow [6,7,8] and counter-flow mechanisms [17,18,19], wherein the jet is blown in the same direction as the primary jet in the case of the former. In the latter mechanism, the secondary jet is sucked in against the outgoing primary jet. The co-flow and its variant have been investigated by a number of researchers in recent times. For instance, Maruyama et al. [18] examined the flow characteristics of a two-dimensional dual-throat nozzle (DTN) using numerical analysis. Computational work on flow dynamics behavior in two-dimension DTN using different input functions, such as step and ramp, were carried out by Ferlauto and Marsilio [19]. Another interesting work in the area of co-flow FTV is Wen et al. [20], who modified secondary co-flow from conventional steady flow to a sweeping jet. In this approach, the authors claimed to have better flow mixing, leading to better efficiency.
Most of the work available in the literature focuses on the study of static behavior of FTV phenomenon with next to none on its application to a dynamic UAV. Gu et al. [21] used actuator models to design a robust controller of an FTV UAV; however, the research focused on supersonic flight using advanced control. Similarly, Cen et al. [10] have developed simplified models of an FTV nozzle for a Vertical Take-off and Landing (VTOL) UAV and tested a Non-linear Dynamic Inversion (NDI) control law for autopilot flight control in a simulation environment. Kikkawa et al. [22] designed and tested a PD controller for position control and a non-linear controller with active disturbance rejection for heading control for a fixed-winged thrust-vectoring UAV. Other than that, there is no work in the literature, to authors’ knowledge, on the capability analysis of co-flow FTV for a UAV model, and the design of an overarching controller to control UAV motion is often ignored in the prior work.
With the exception of subsonic vehicles, such as MAGMA UAVs [23], VTOL UAVs [10], and fixed-wing UAVs [22], most of the cited work is confined to static test benches that too predominantly limited to the computational realm. This work, on the other hand, is a continuation of the author’s previous work on co-flow static FTV actuator characterization [6]. Here, a dynamic test rig is custom designed, instrumented, and integrated with a dynamic free-to-pitch test bench (Section 2) with a low aspect ratio delta wing. The key relationships in the authors’ previous work dealt with estimating the normal force as a function of primary jet deflection. In the present work, the magnitude of the normal force was measured experimentally using a load cell, and the corresponding jet angles were measured using the tufts visualization technique in real time. This enabled accurate calculation of aerodynamic gain, which is an important control derivative. The rest of the stability derivatives that characterized the dynamic behavior of a FTV controlled UAV were computed using Newton–Euler approach to arrive at the pitch equation of motion (Section 3). The developed e.o.m is employed for model-based pitch attitude control design in a simulation environment (Section 4). In particular, the benchmark multi-parameter root locus (MPRL) tuned PID controller is compared with genetic algorithm (GA) and particle swarm optimization (PSO) tuned controllers.
The structure of the paper is as follows. Section 2 provides a description of the dynamic test rig used in the study. The dynamic model for pitch control of the UAV is presented in Section 3. Section 4 focuses on the design and analysis of the PID controller, including a review of the main results, with tuning methods using root locus, GA, and PSO. The paper concludes in Section 5.

2. Experimental Setup

The delta wing configuration has been selected for FTV demonstration in this study due to the exceptional qualities that set it apart from other configurations. There are several compelling reasons for choosing the delta wing UAV as the preferred option in this context. Firstly, the delta wing configuration provides inherent stability and control, making it easier to fly and control the UAV. The unique shape of the delta wing generates lift efficiently [24], allowing the UAV to maintain stable flight even at low speeds or high angles of attack [25]. This stability is crucial for tasks such as aerial surveillance, mapping, or payload delivery, where steady flight and accurate positioning are essential. Additionally, the delta wing design offers a relatively large internal volume, allowing for greater payload capacity. This means that delta wing UAVs can carry more sensors, cameras, or other equipment, enabling them to perform a wider range of missions and gather more comprehensive data during each flight.
Furthermore, delta wing UAVs often have a reduced radar cross-section, making them less detectable and more suitable for stealth operations or applications that require a lower radar signature [26]. Lastly, the delta wing configuration typically has a higher lift-to-drag ratio, resulting in increased fuel efficiency and longer endurance [27]. This extended flight time allows for prolonged missions, reducing the need for frequent landings and increasing overall operational efficiency.
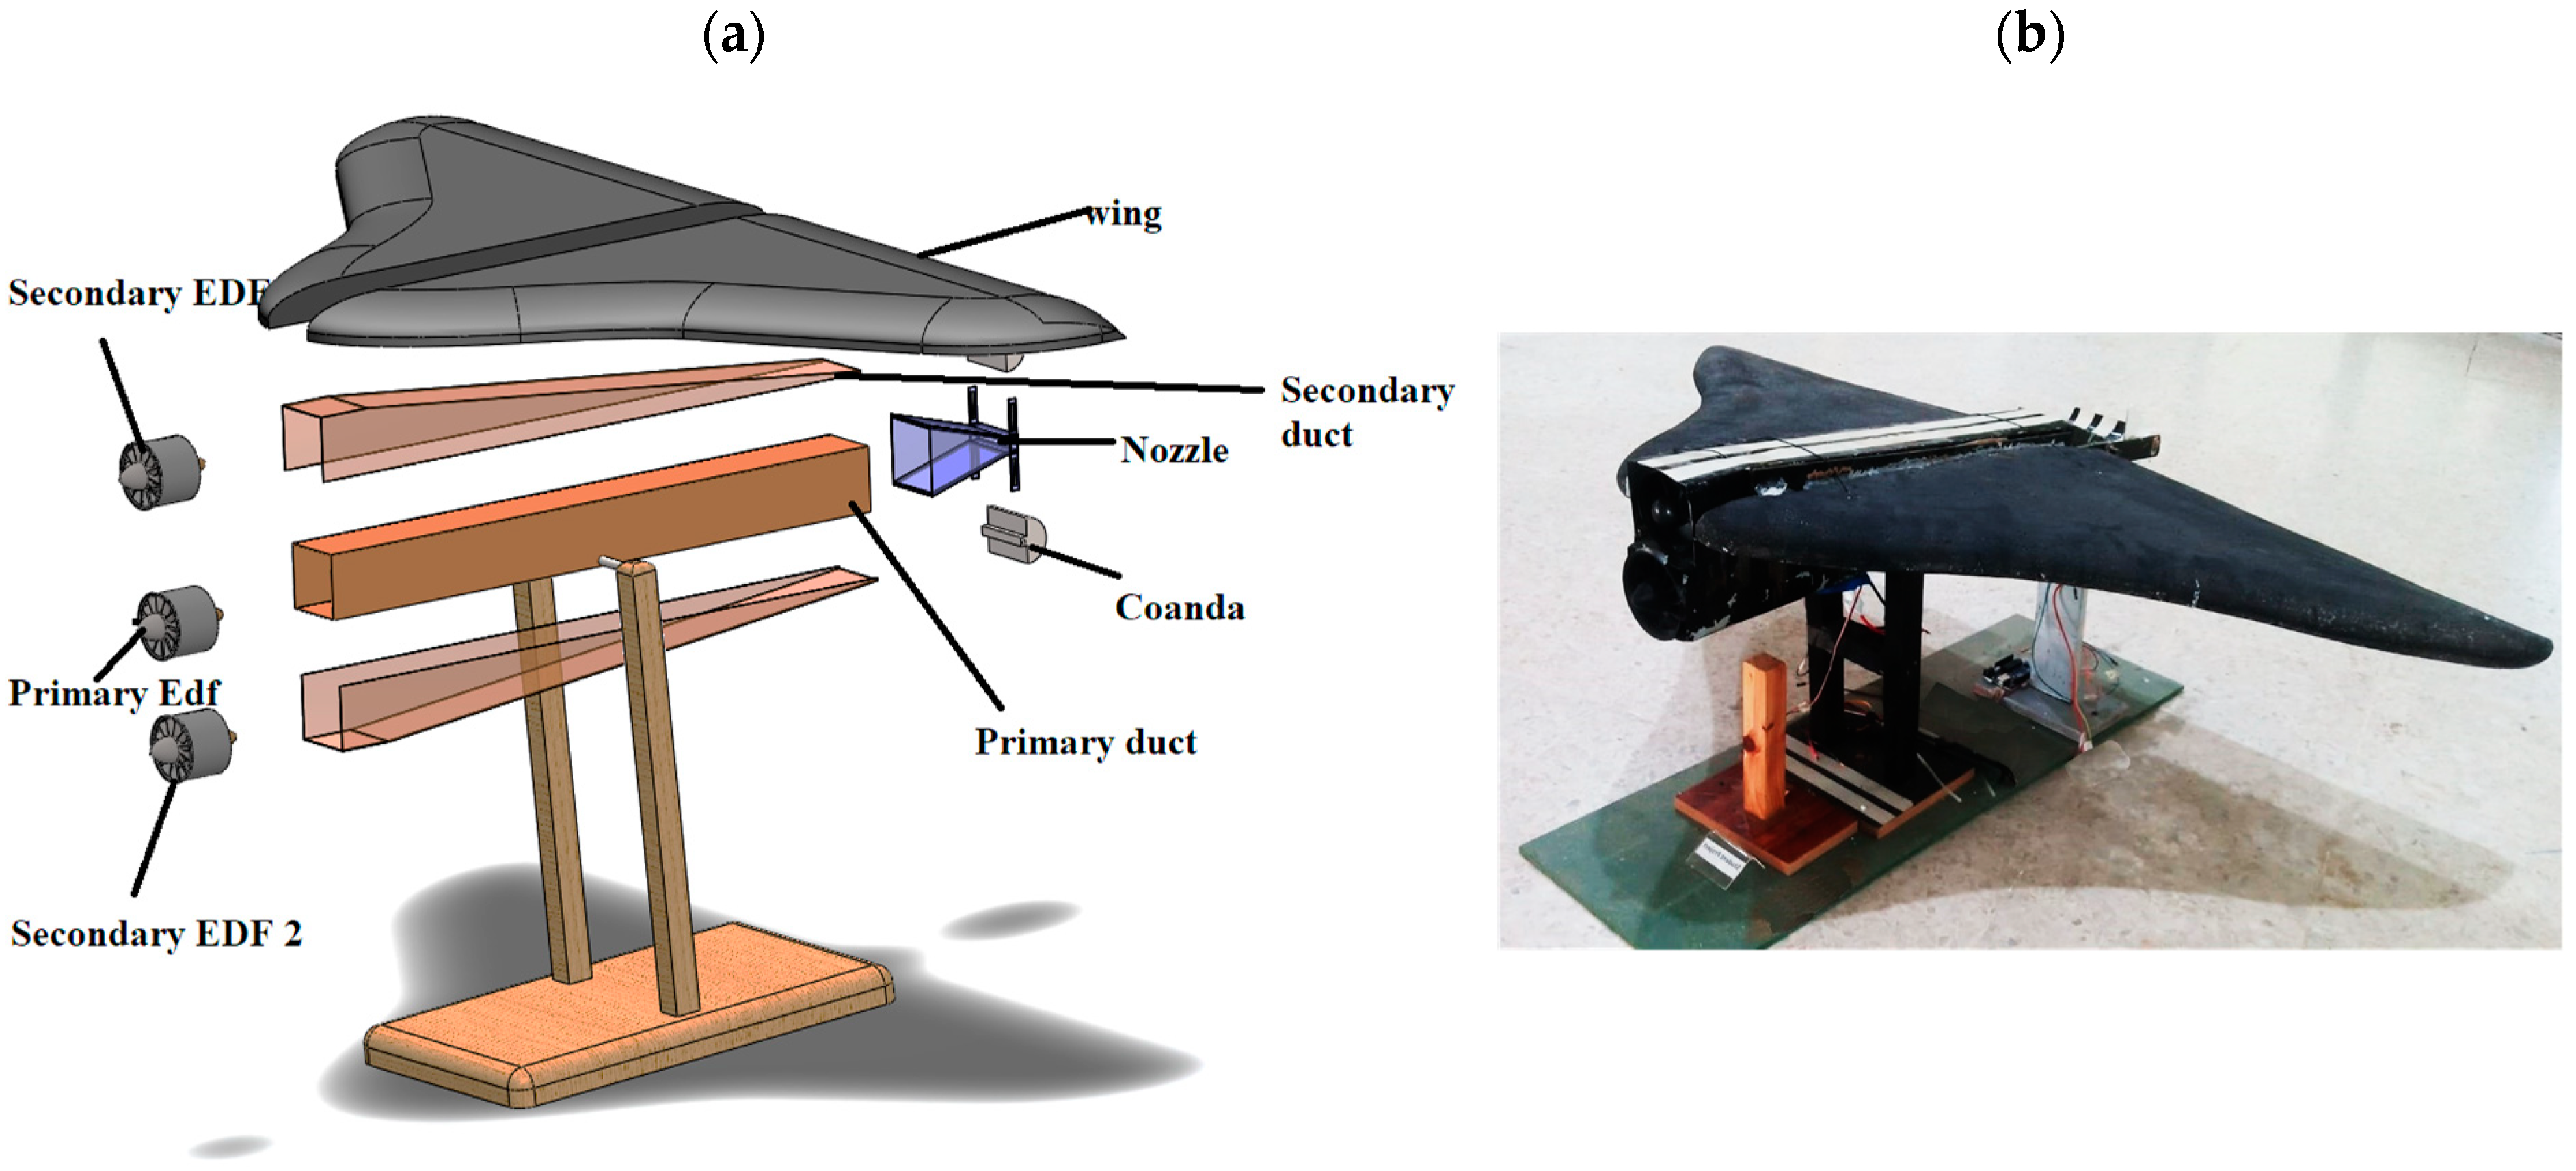
In consideration of the overall superiority of the delta wing design and with the aim of showcasing the effectiveness of co-flow FTV in subsonic test conditions, a dynamic test rig has been specifically designed and employed as an experimental platform. The fuselage is mounted in such a way that it can pivot and freely rotate around its center of gravity, as depicted in Figure 2. The maximum permissible pitching angle for the rig is set at 40°.
The intake of the system utilizes two Electric Ducted Fans (EDF) with a rotor diameter of 70 mm to generate primary and secondary airflows, respectively. In terms of orientation sensing, a rotary potentiometer is employed, with the potentiometer serving to determine the pitch angle of the UAV. The jet velocity is measured using a pitot tube, while the lift force is measured with a load cell. To facilitate communication with the sensors and actuators, an ATmega328P microcontroller is utilized. Figure 3 depicts the schematic as well as the actual UAV fuselage. The microcontroller is interfaced with the PC for data acquisition and control of the ducted fans.

2.1. Experimentation

2.1.1. Velocity and Thrust Force Measurement

Using the Bernoulli equation, primary and secondary exit velocities may be calculated from pressure data. The MPXV7002DP pressure sensor is used to calculate differential pressure.
v = 2 ( P s t a g P s t a t ) ρ
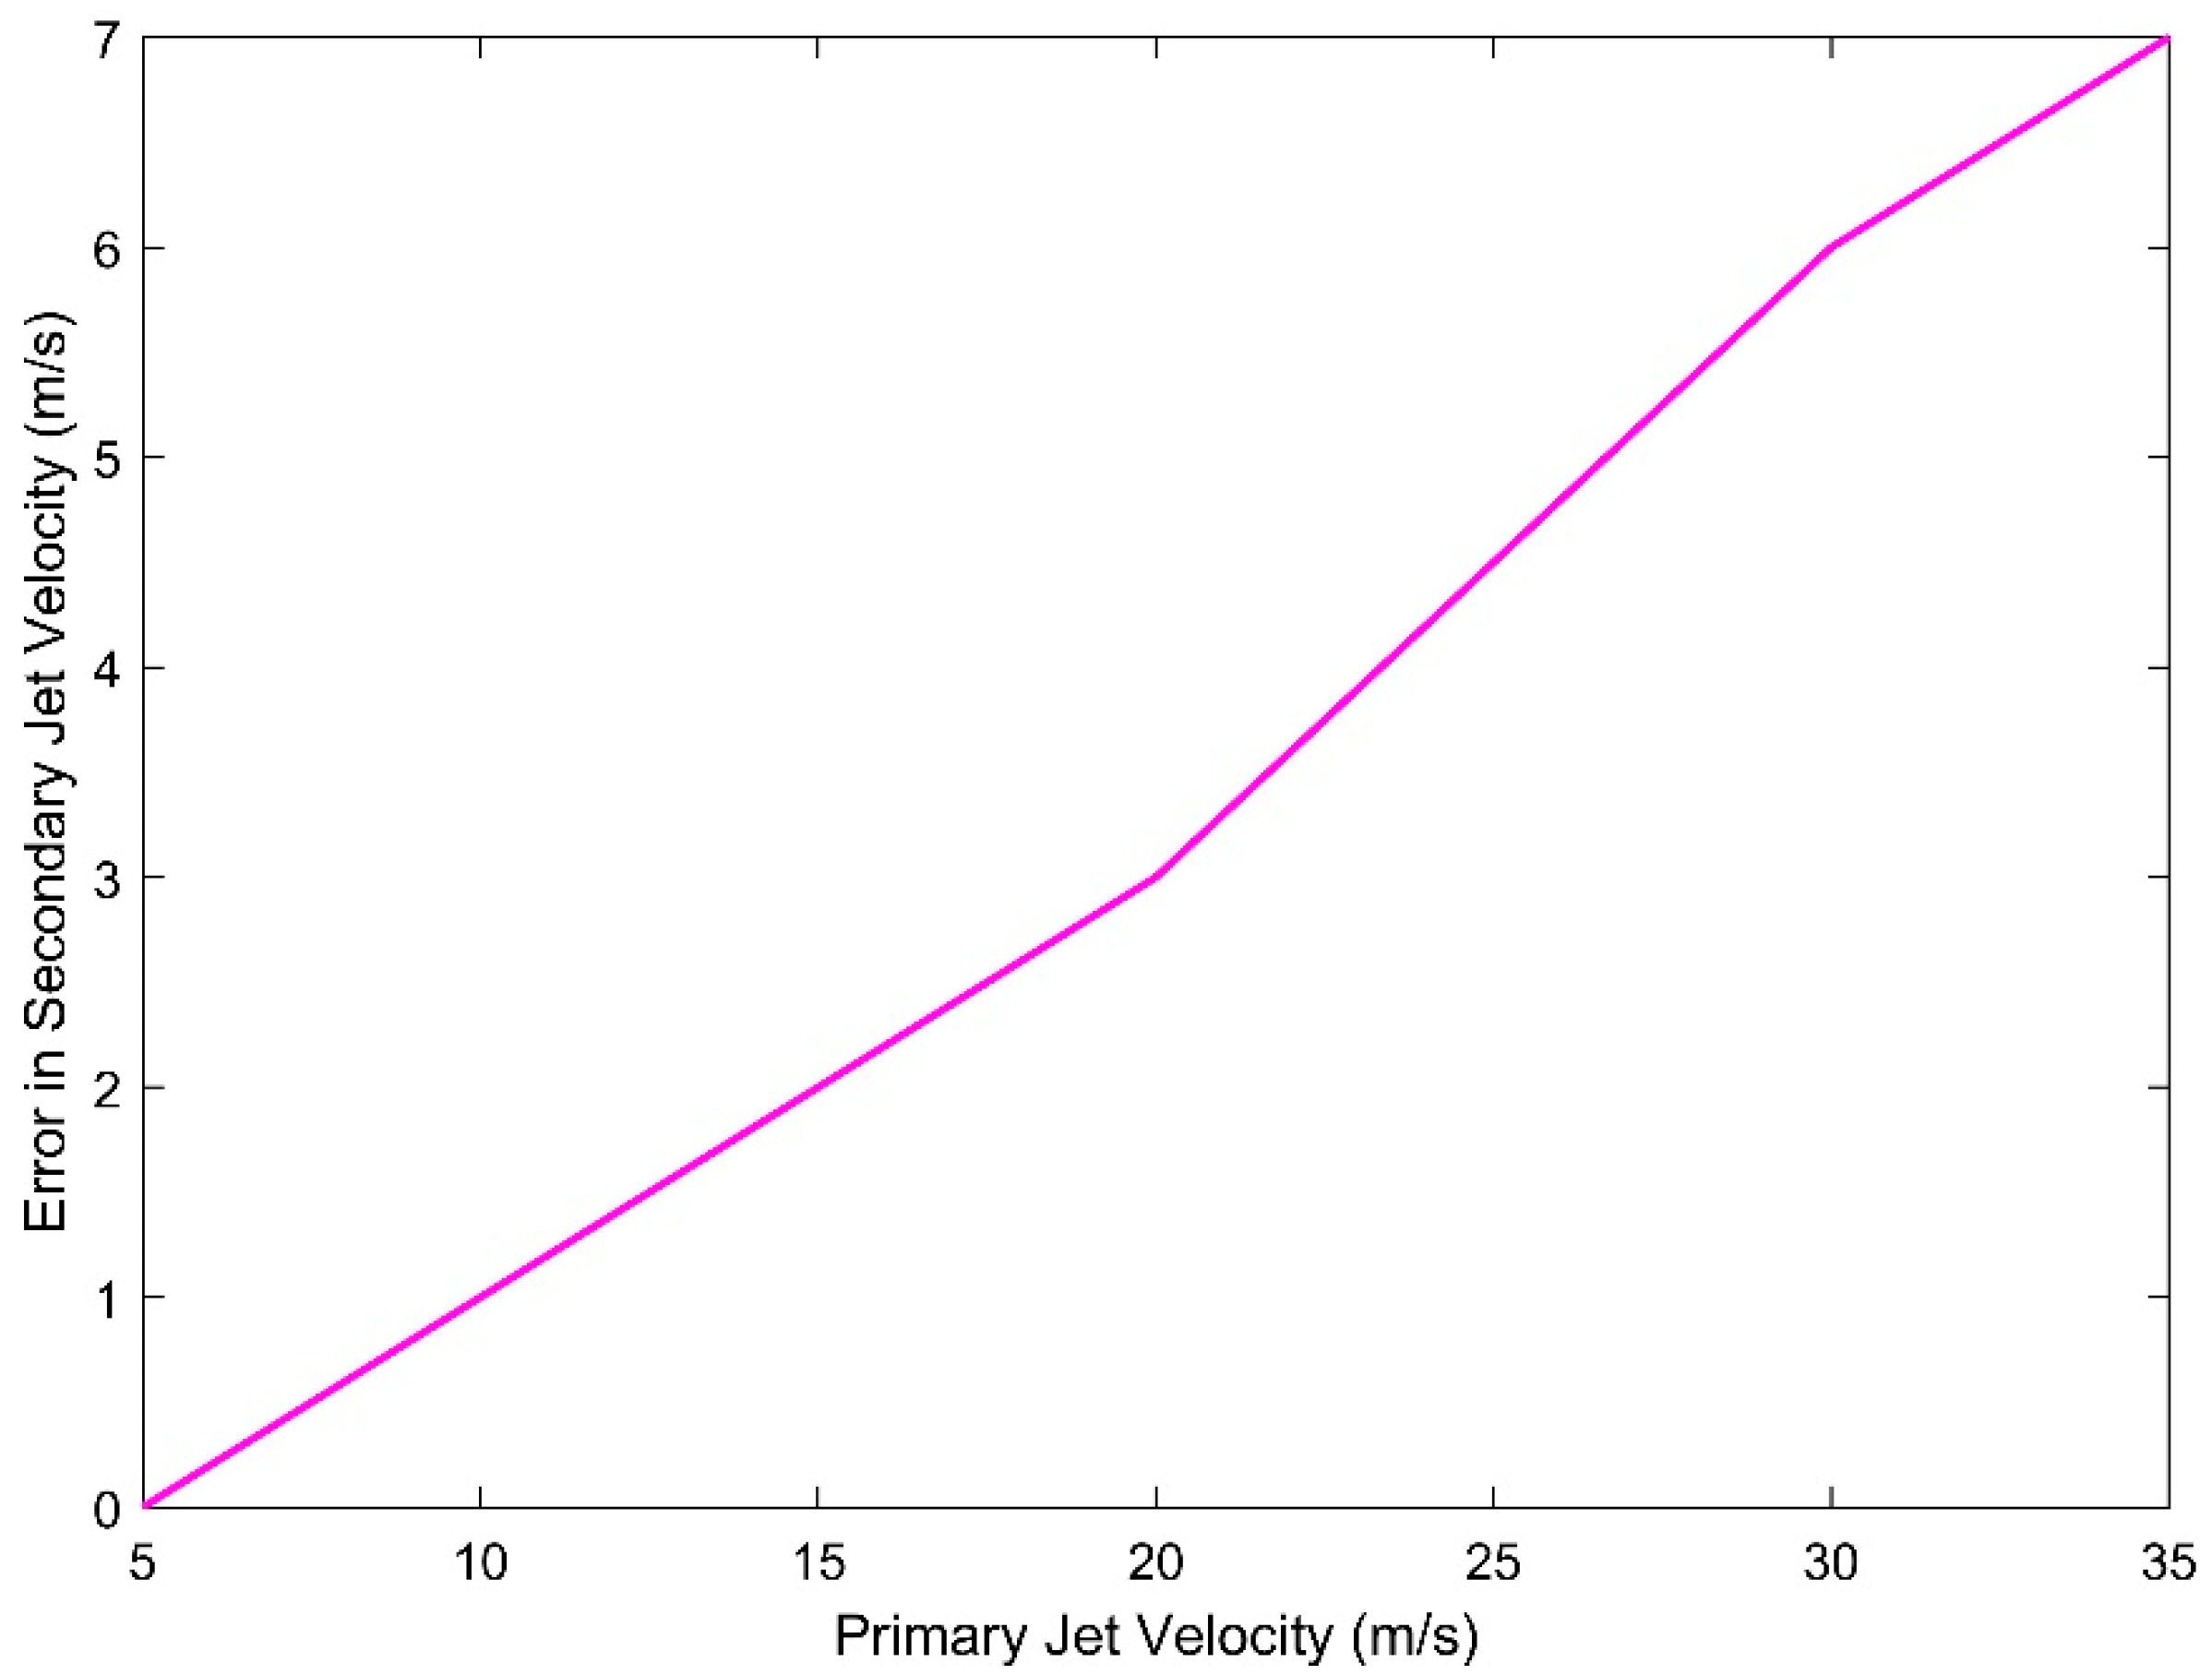
where ρ denotes air density, P s t a g is stagnation pressure, and P s t a t is static pressure inside the fuselage. An anemometer is used to calibrate pressure sensors. To remove noise from the velocity data, a high pass filter is used. Additionally, due to its high sensitivity, the sensor reading necessitates the implementation of a running average in order to obtain a stable and reliable measurement. Furthermore, it is observed during experimentation that the position of the sensor inside the ducted fuselage is very crucial. Foul readings are expected due to boundary layer formation if the sensor is placed at the fluid–solid interface. Therefore, care must be exercised while installing the velocity sensor. For the rig under consideration, sensors for both the primary and the secondary jet are positioned at the exit nozzle. It is observed that an increase in primary flow velocity influences the secondary flow velocity readings, so the error must be subtracted from the secondary flow data, as seen in Figure 4. The error observed in the secondary flow can be attributed to the mixing of flow and turbulent effects that occur when higher velocities are encountered.
The lift force generated as a result of jet deflection is amplified for visualization using the load cell with an HX711 Analog to Digital Converter (ADC) module. The load sensor is calibrated against a standard mass of known value. A calibration factor is used in the code to offset any error in the sensor reading.

2.1.2. Experimental Measurement of Jet Deflection Angle

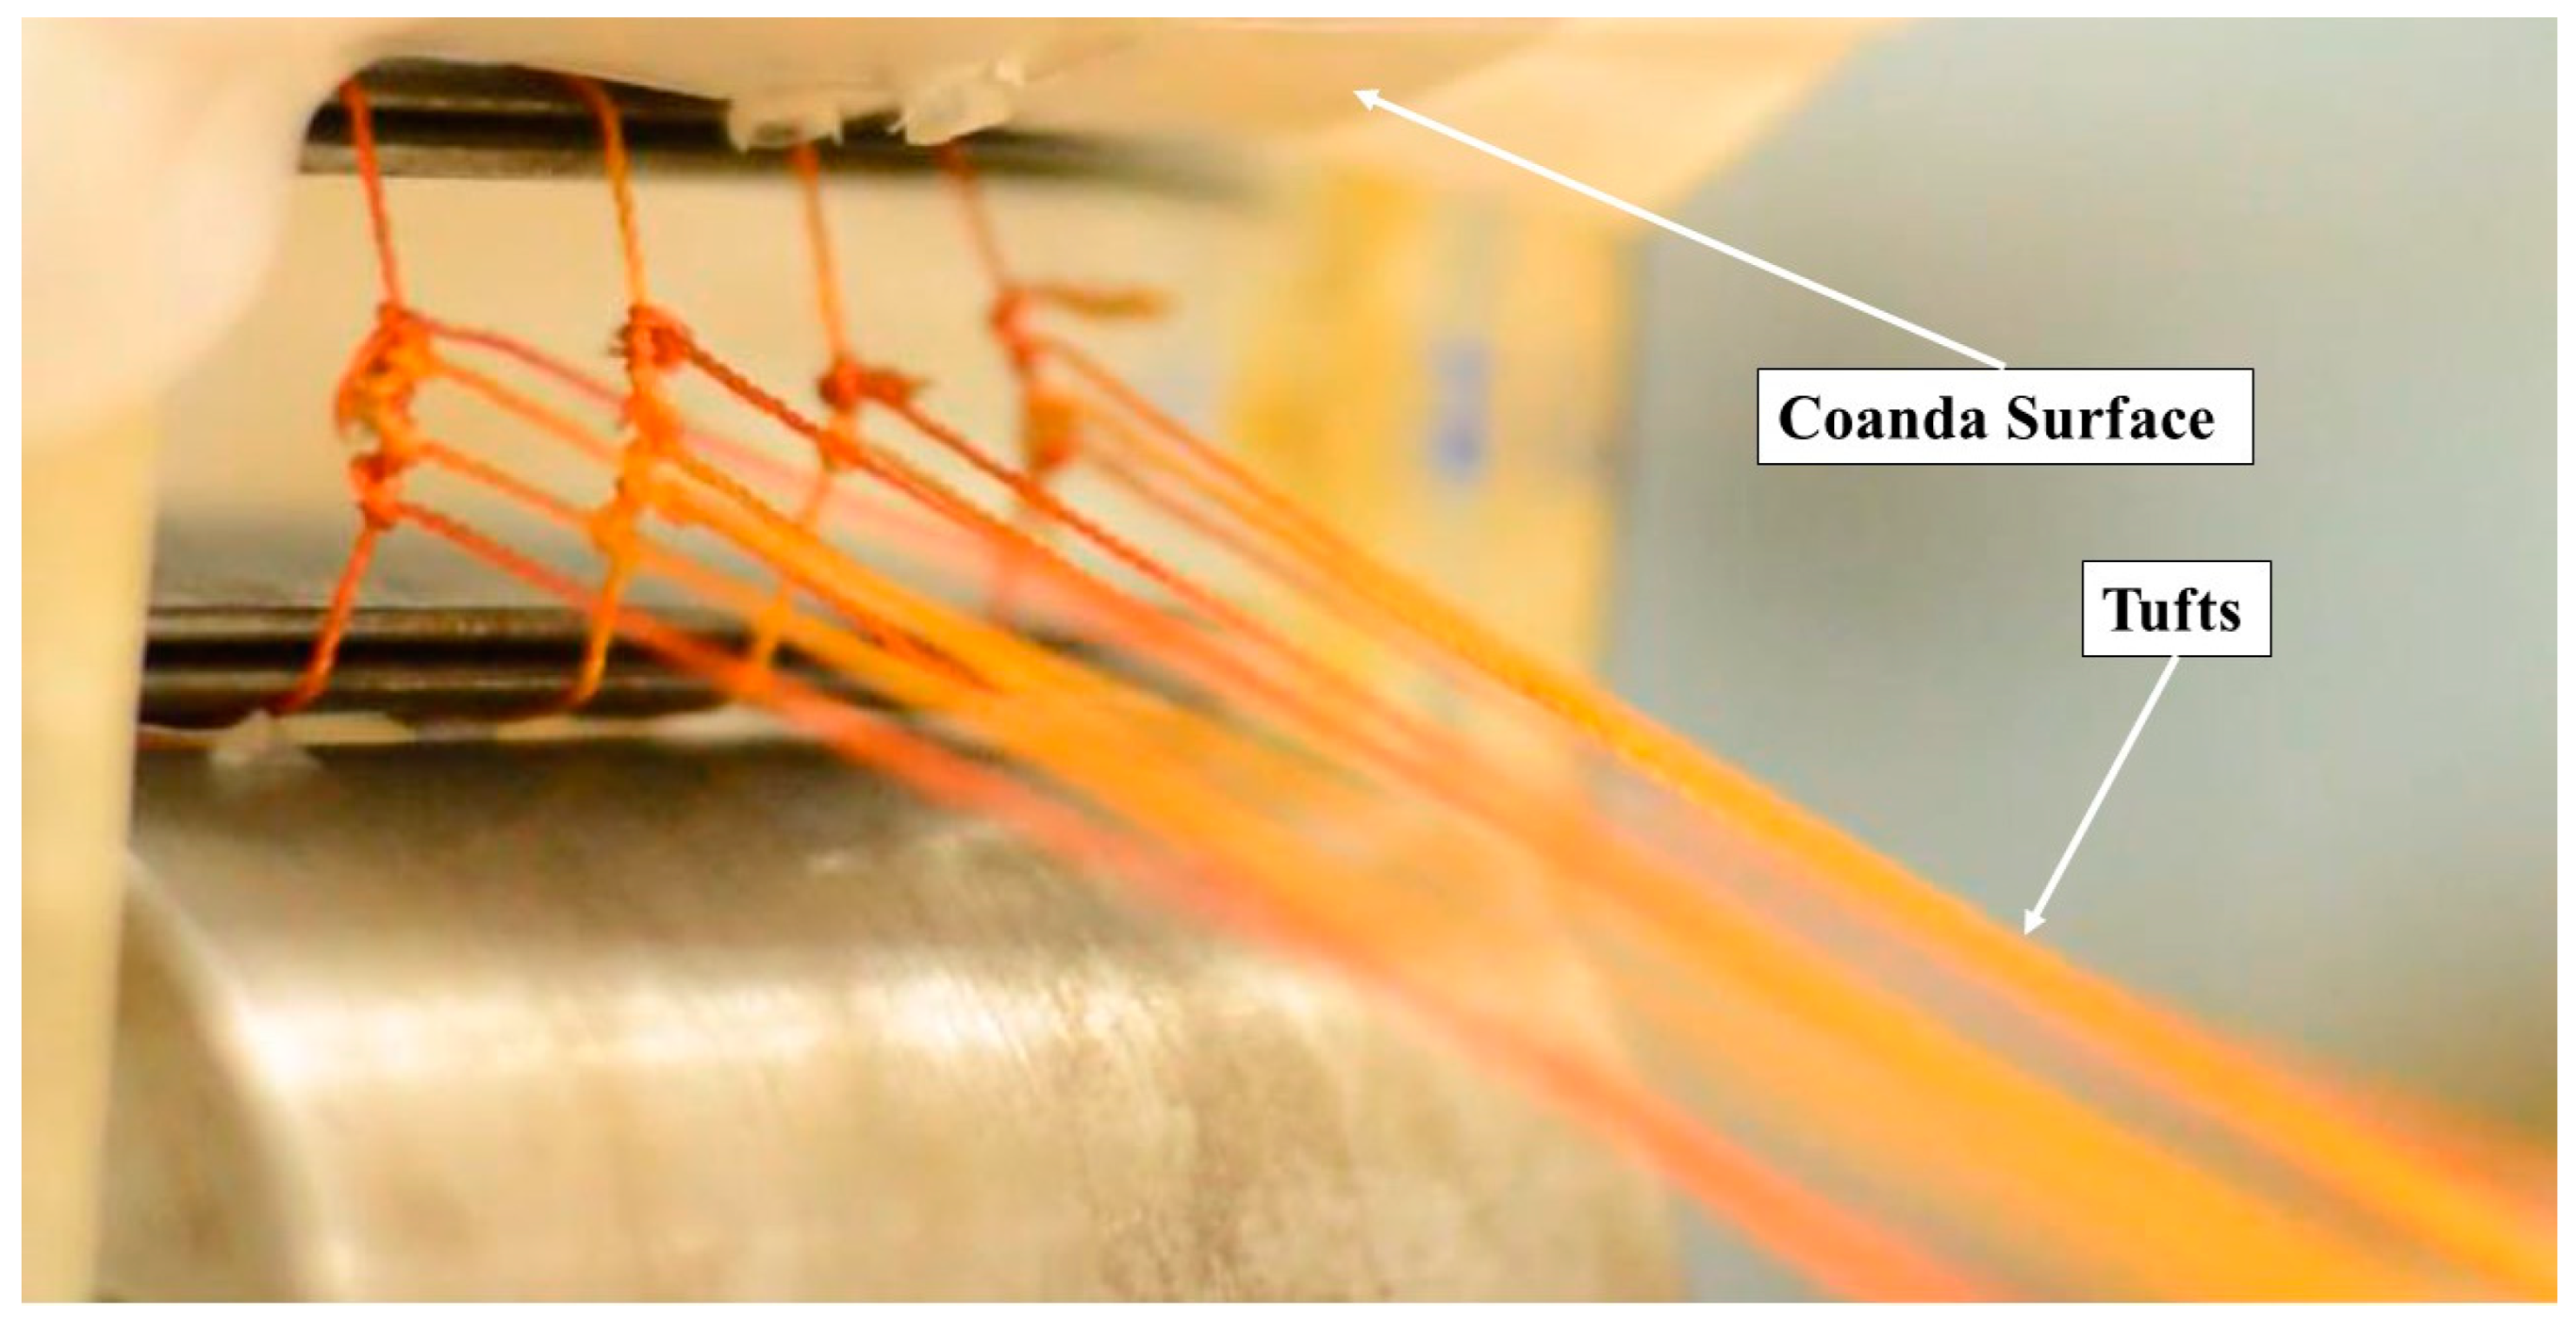
In order to determine the efficacy of the FTV mechanism for the UAV, acquiring experimental data becomes crucial. To accomplish this, real-time tests are conducted on the test rig. During these tests, the primary velocity is maintained at a constant level, while the secondary velocity is incrementally increased. The authors’ previous work [6] relied on computational fluid dynamics and a high-speed camera to capture the deflected jet angles at various secondary flow velocities. In this work, however, tufts are used for flow visualization. The tufts were placed along the geometric centerline of the exit nozzle. The tufts were adjusted so that when there is no injection of a secondary jet, the tufts are perfectly parallel to the main jet flow. Experiments were conducted after ascertaining that the tufts flow pattern matches the main jet flow. A sample primary jet deflection using tufts is shown in Figure 5, wherein tufts are clearly tracing the flow trajectory. The actual primary jet deflection angle is read manually from the protractor placed coincident with the thrust axis. The process is repeated at various secondary flow velocities while noting down the corresponding jet deflection.
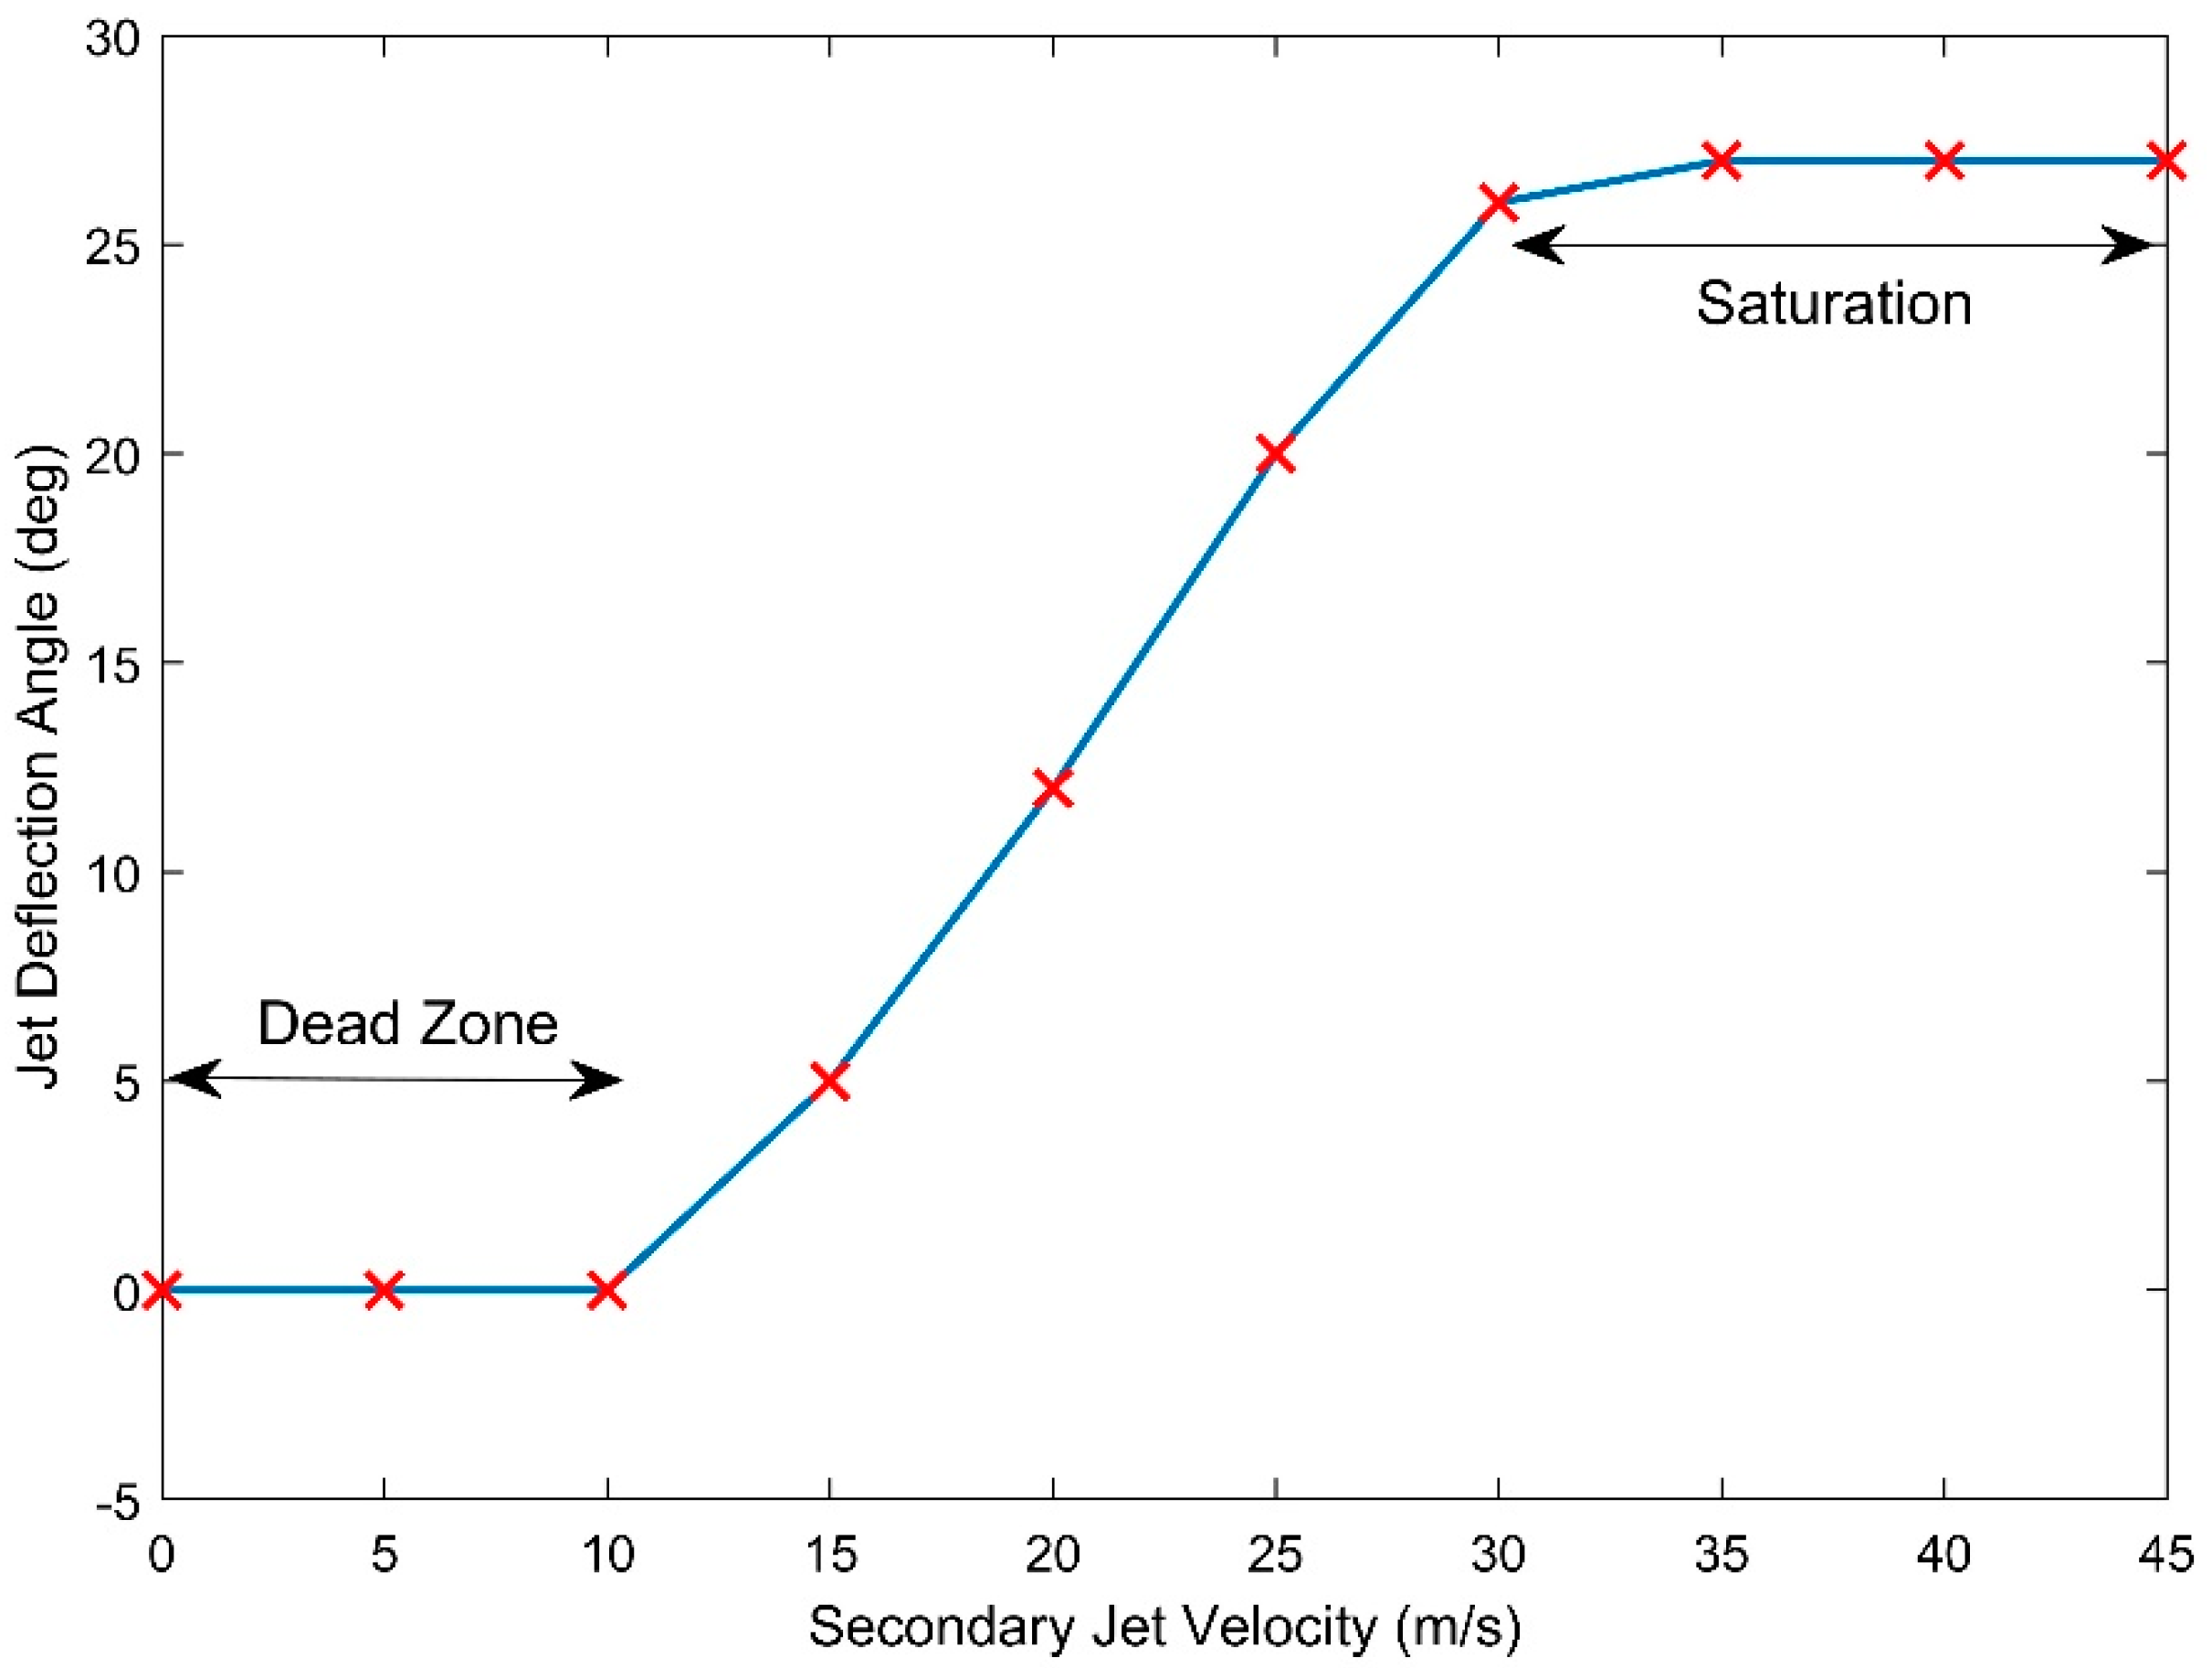
Figure 6 summarizes and depicts the deflection angles obtained as a result of secondary velocity alteration while a primary flow velocity of 19 m/s is maintained throughout the experiments.
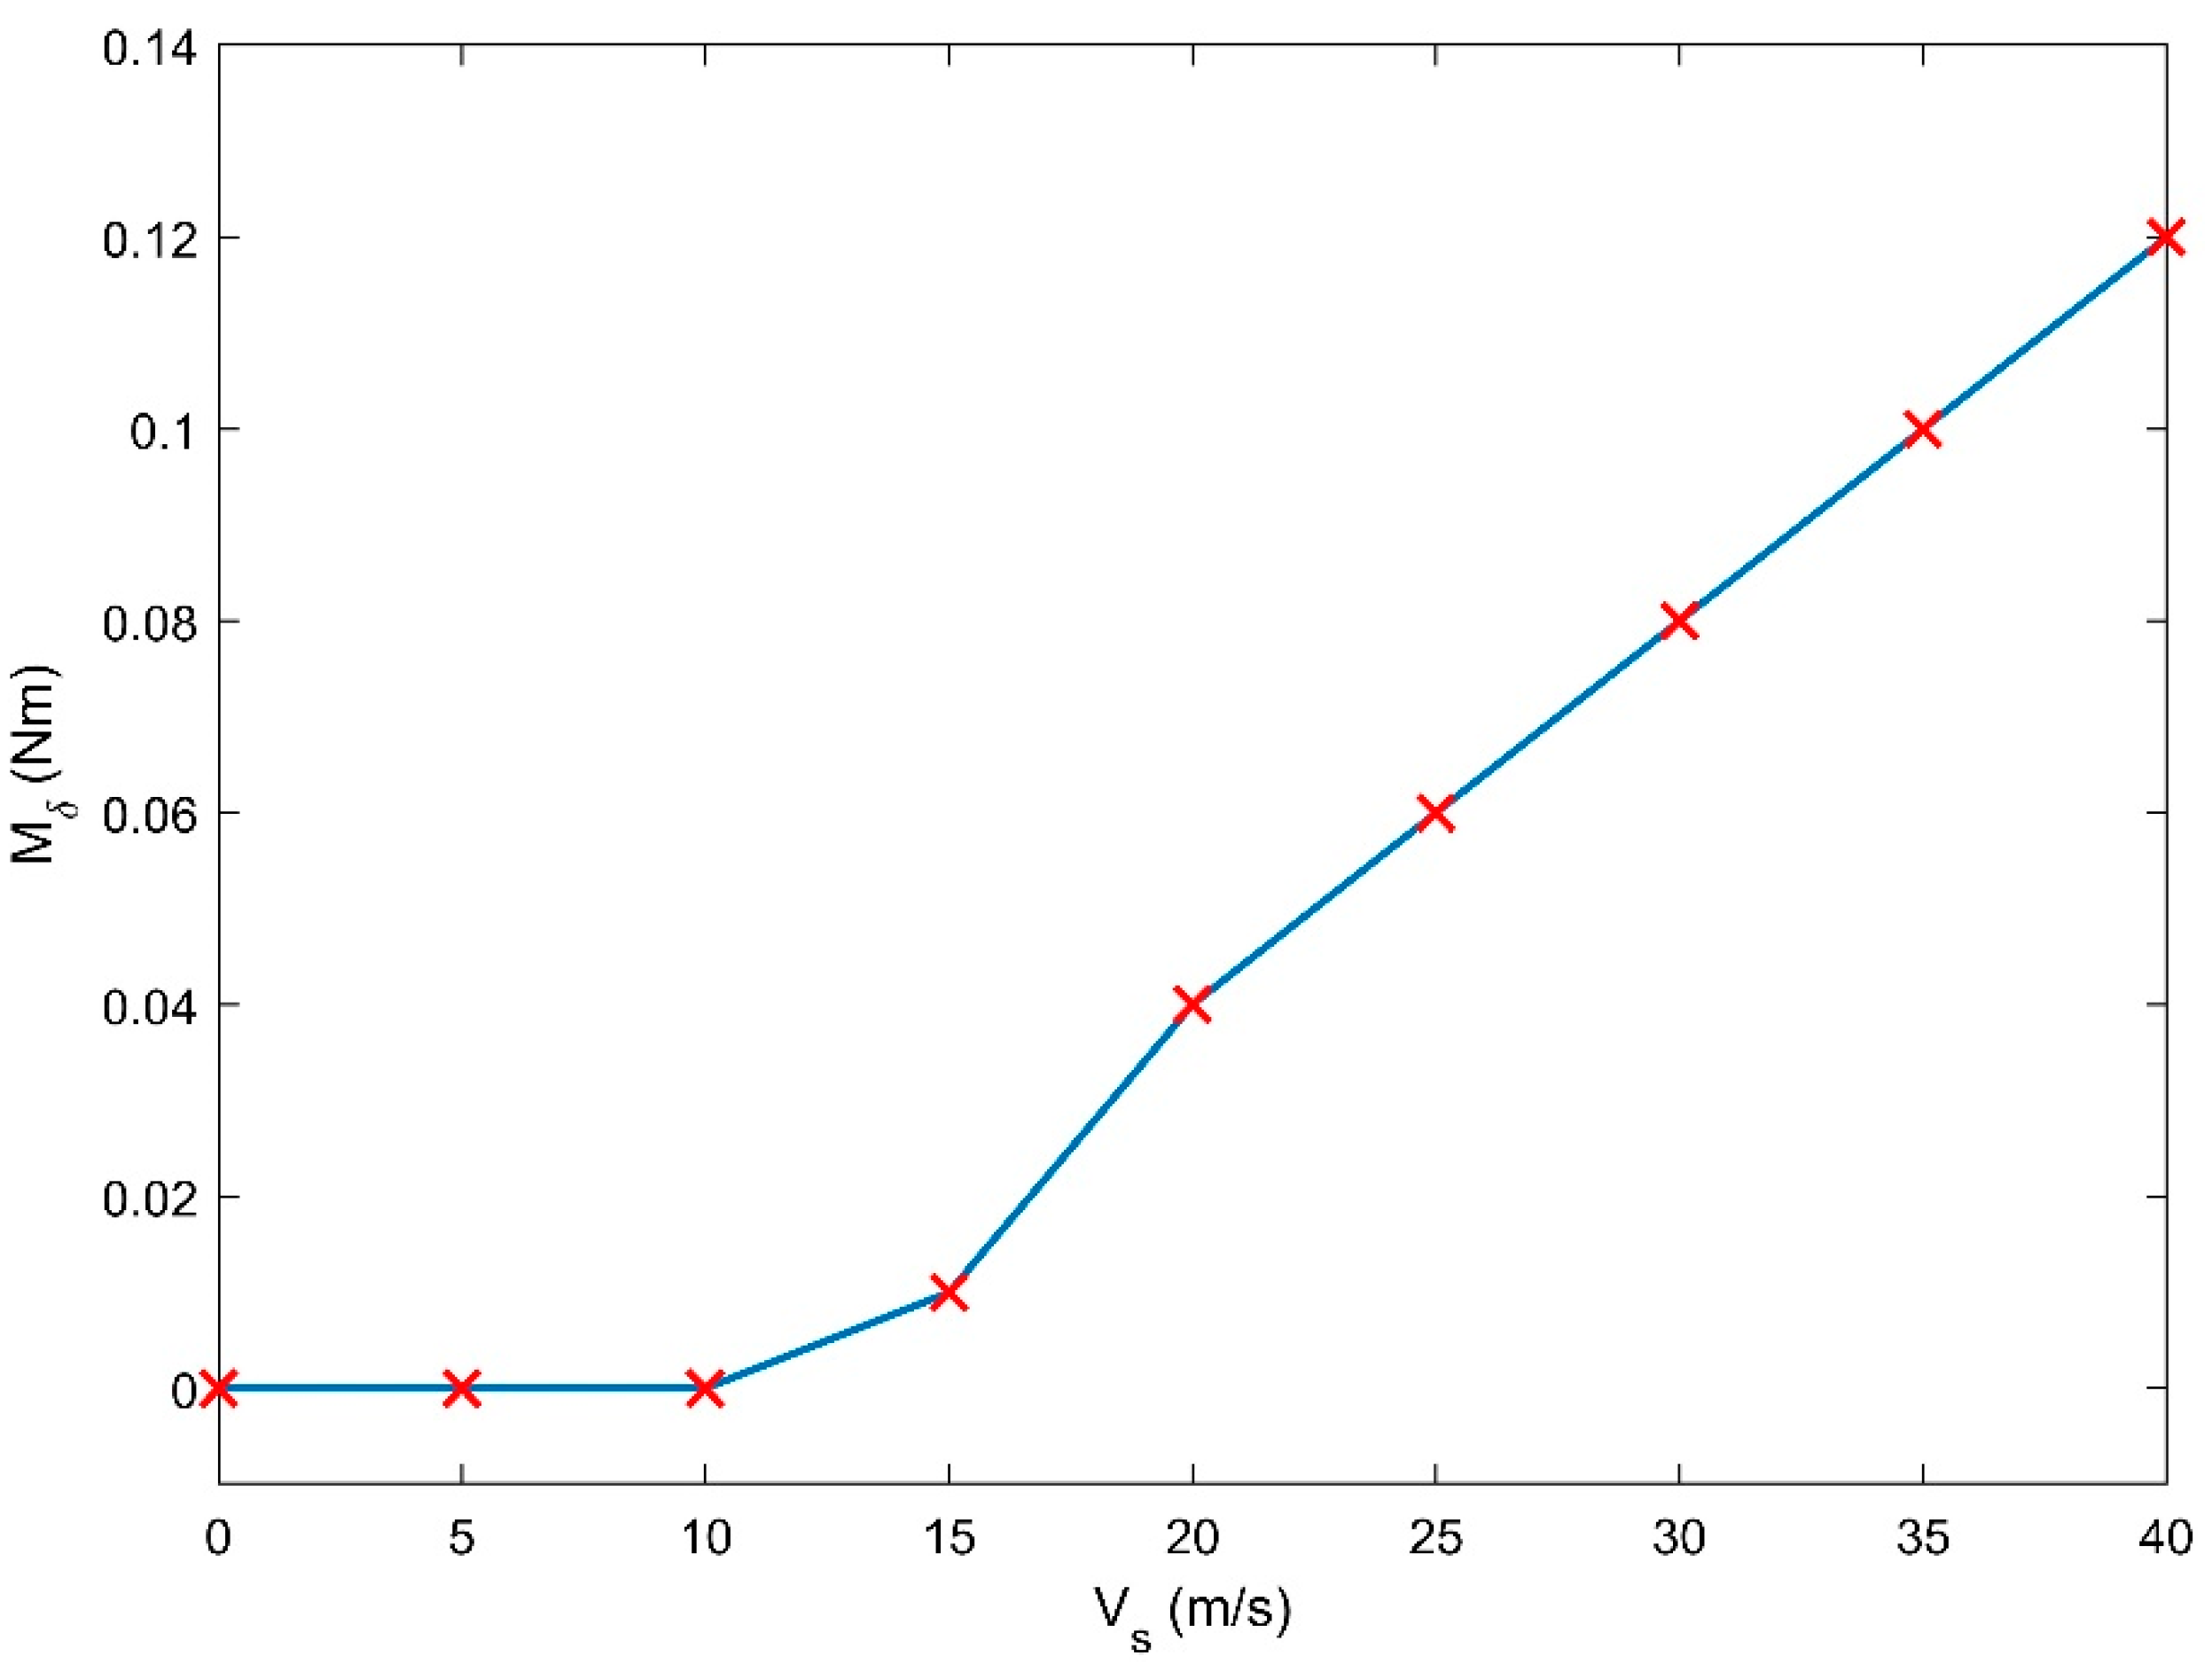
As seen in Figure 6, the jet deflection angle is proportional to the secondary flow velocity. However, a dead zone is detected between 0 and 5 m/s, while saturation occurs at 40 m/s. Despite an increase in secondary velocity, no change in deflection angle is detected in the dead zone or saturation. Maximum jet deflection of 27° is noted at primary and secondary flow velocities of 19 m/s and 40 m/s, respectively. Trimming a UAV is of interest in the zone where the maximum deflection occurs, which is between 15 and 30 m/s of the secondary velocity. Similarly, the moment produced by the jet deflection about c.g. can be seen in Figure 7.
In addition to v p = 19 m/s, experiments are carried out at the primary jet velocity of v p = 25 m/s for completeness. Figure 8 illustrates a comparison of moments generated at primary jet velocities of 19 m/s and 25 m/s.

3. Dynamic Modelling

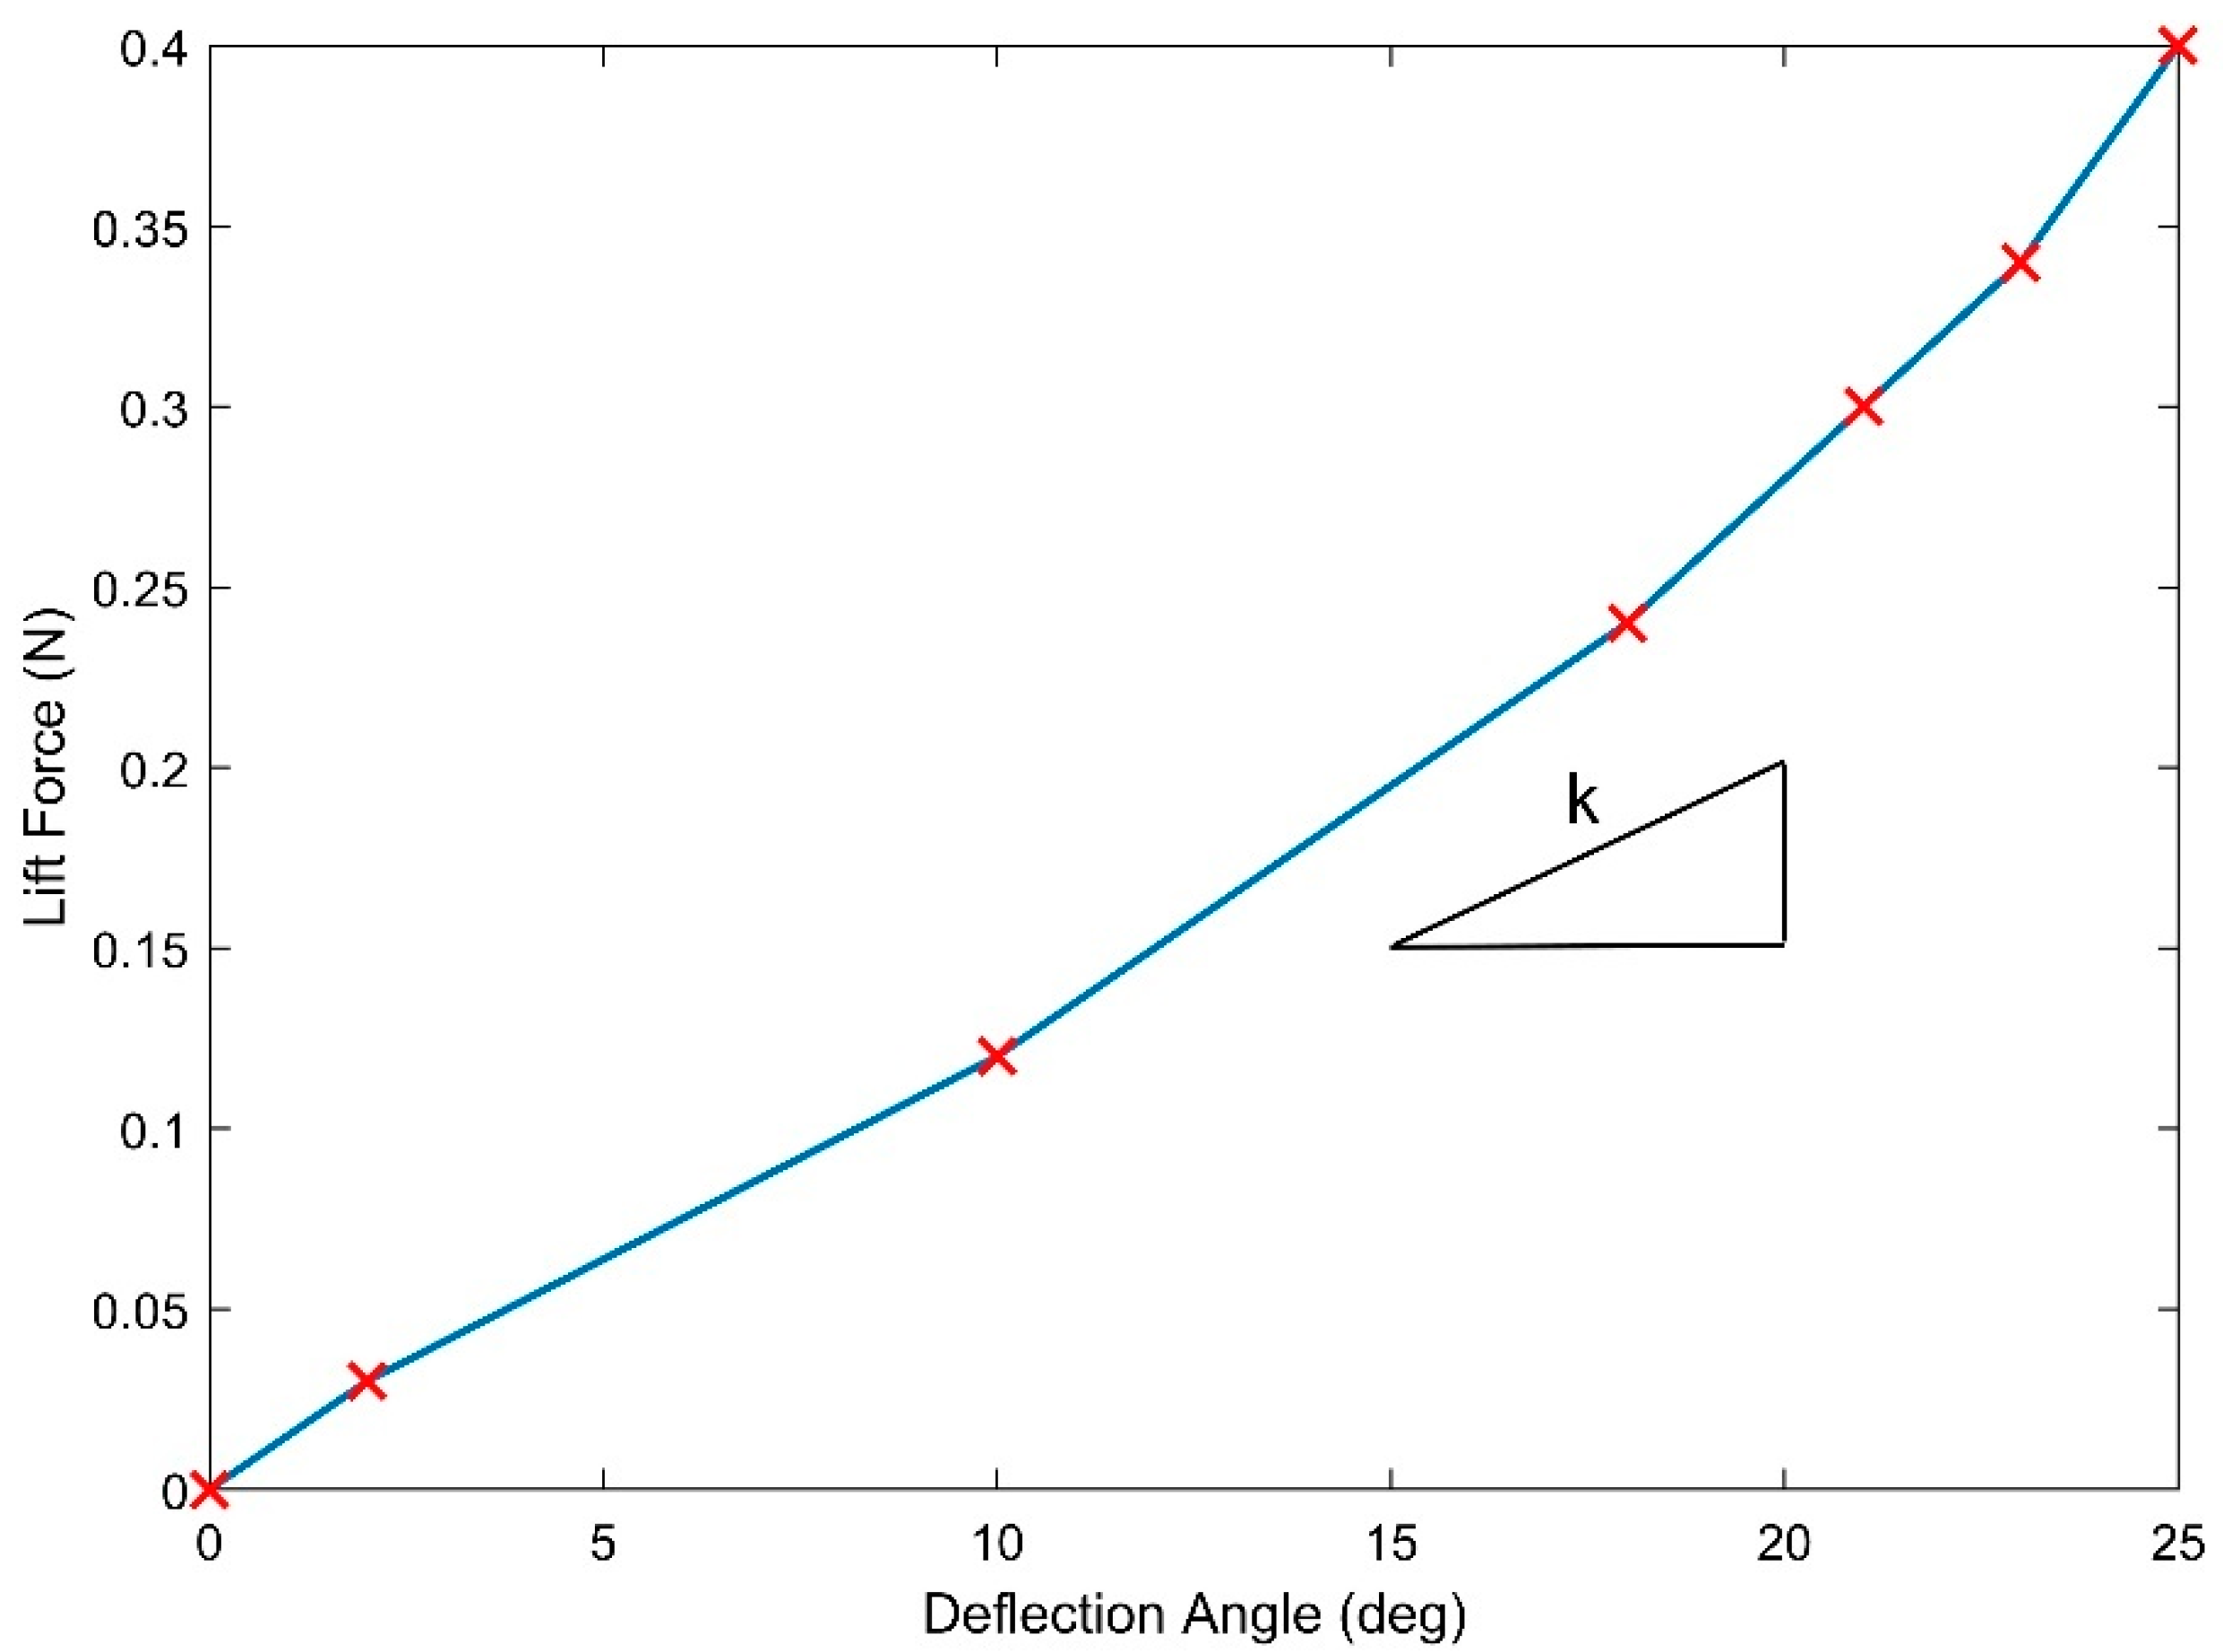
The ultimate objective is to design a closed-loop control system, thus requiring an accurate dynamic model. Using Newton’s second law, the governing equation for a free-to-pitch test rig may be found [28,29]. The test rig is constrained to move about its pivot point, which is also c.g. location. In this work, inertia is obtained experimentally through the Bifilar pendulum method. M δ , which is regarded as aerodynamic gain, is also determined experimentally (refer to Figure 9).
I y θ ¨ M q q M α α = M δ δ ( t )
where θ is the pitch angle. A comprehensive list of model nomenclature can be found in Appendix A.
For c.g. constrain, q = θ ˙ ; α = θ . Dividing Equation (2) by I y .
θ ¨ M q I y q M α I y α = M δ I y δ ( t )
where M α ( t ) = M α = l × C L α × Q × S e . For thin airfoil, C l α = 2 π .
C L α = C l α 1 + C l α π × A R
where A R   3 for the delta wing aircraft. Using the value of the aspect ratio in Equation (4), C L α = 3.78   rads , which is similar to what is reported by Wang et al. [30]. Additionally, rewriting M α ( t ) with Q = ρ × v p 2 2 .
M α = l × 3.78 × ρ × v p 2 2 × S e
Using ρ = 1.29   kg / m 3 , l = 0.5   m , and v p = 19   m / s in Equation (5), M α ( t ) = 42.25   kg · m 2 / s 2 . Similarly, for the pitching moment:
M q = l 2 × C l α × ρ × v p 2 × S e = 1.11   kg · m 2 / s
Additionally, the moment due to jet deflection:
M δ = M δ = k × l = F l | m a x   δ m a x × l = 0.4 0.4363 × 5 = 0.46   kgm 2 / s 2
where k is the slope of jet deflection and lift force curve shown in Figure 9.
Using Equations (5)–(7) in Equation (3):
θ ¨ + 27.79   θ ˙ + 1056   θ = 11.46   δ ( t )
Taking Laplace transform and rewriting Equation (8):
θ ( s ) δ ( s ) = 11.46 s 2 + 27.79   s + 1056
Equation (9) demonstrates the relationship between pitch angle and jet deflection angle, which in turn depends on primary and secondary flow velocities. With both poles in the left-hand plane (eigenvalues = −13 ± 82.84), analysis of the transfer function indicates that the system is stable. The developed model’s eigenvalues when compared (at 12 m/s operating velocity) with similar blended wing UAVs [31] were found to be quite similar. Figure 10 displays the frequency response for the open-loop system. The section that follows deals with the experimental aspect of this study.

4. Controller Design

4.1. Benchmark Controller Design

4.1.1. Selection of Control Paradigm

Outlining performance criteria is the first step in every control design problem. These performance specifications may include intended peak time, maximum permissible overshoot, and settling time requirements. A cautious performance criterion of 10% acceptable overshoot and a 2 s settling time are specified for the system under investigation. The damping ratio and natural frequency are calculated from the specified performance parameters as 0.6 and 2.5 rad/s, respectively.
Selecting an appropriate control paradigm is key once the performance criteria have been determined. While contemporary controllers are better equipped to handle multiple-input, multiple-output (MIMO) systems, classical controllers are best suited for single-input, single-output (SISO) systems. In its pitch motion, a thrust-vectoring UAV is a SISO system. Therefore, the conventional control scheme is preferred. The proportional integral derivative (PID) controller is the most often used control strategy within the classical control framework. Nearly all commercially available open-source autopilots employ PID, which accounts for around 80% of all industrial control systems [32]. As a result, the design of a traditional PID controller employing the multi-parameter root contour approach is covered in the next subsection. Following that, the tuned controller’s performance is evaluated against a GA-PID and a PSO-PID.

4.1.2. Multi-Parameter Root Contour Method

The root locus approach is often used to design a straightforward proportional controller, but by leveraging the multi-parameter root contour method, it may also be expanded to design a full-fledged PID controller. This approach begins by converting the characteristics equation of the closed-loop transfer function into the standard root locus format, which is:
1 + k × G r = 1 + k n u m ( s ) d e n u m ( s ) = 0
The so-called root contour plot is then produced by generating numerous root locus plots for various combinations of PID gains and superimposing them on one another in a single plot [33]. The closed-loop transfer function for Equation (9) is given as:
G c l = 11.46 ( k d s 2 + k p s + k i ) s 3 + ( 11.46 k d + 27.79 ) s 2 + ( 11.46 k p + 1056 ) s + 11.46 k i
whereas Equation (11) in a standard multi-parameter root locus form is:
1 + k i 11.46 s 3 + ( 11.46 k d + 27.79 ) s 2 + ( 11.46 k p + 1056 ) s = 0
Comparing Equation (10) and Equation (12):
G r = 11.46 s 3 + ( 11.46 k d + 27.79 ) s 2 + ( 11.46 k p + 1056 ) s
The position of the closed-loop poles for various combinations of k p and k d with differing k i is shown by the contour plot of Equation (13). The required controller gains are the gain values at which the system’s closed-loop poles reach the desired closed-loop pole location. For the intended performance, the closed-loop pole position is determined to be s 1 , 2 = 1.5 ± 2 i . Figure 11 highlights the placement of the intended closed-loop poles.
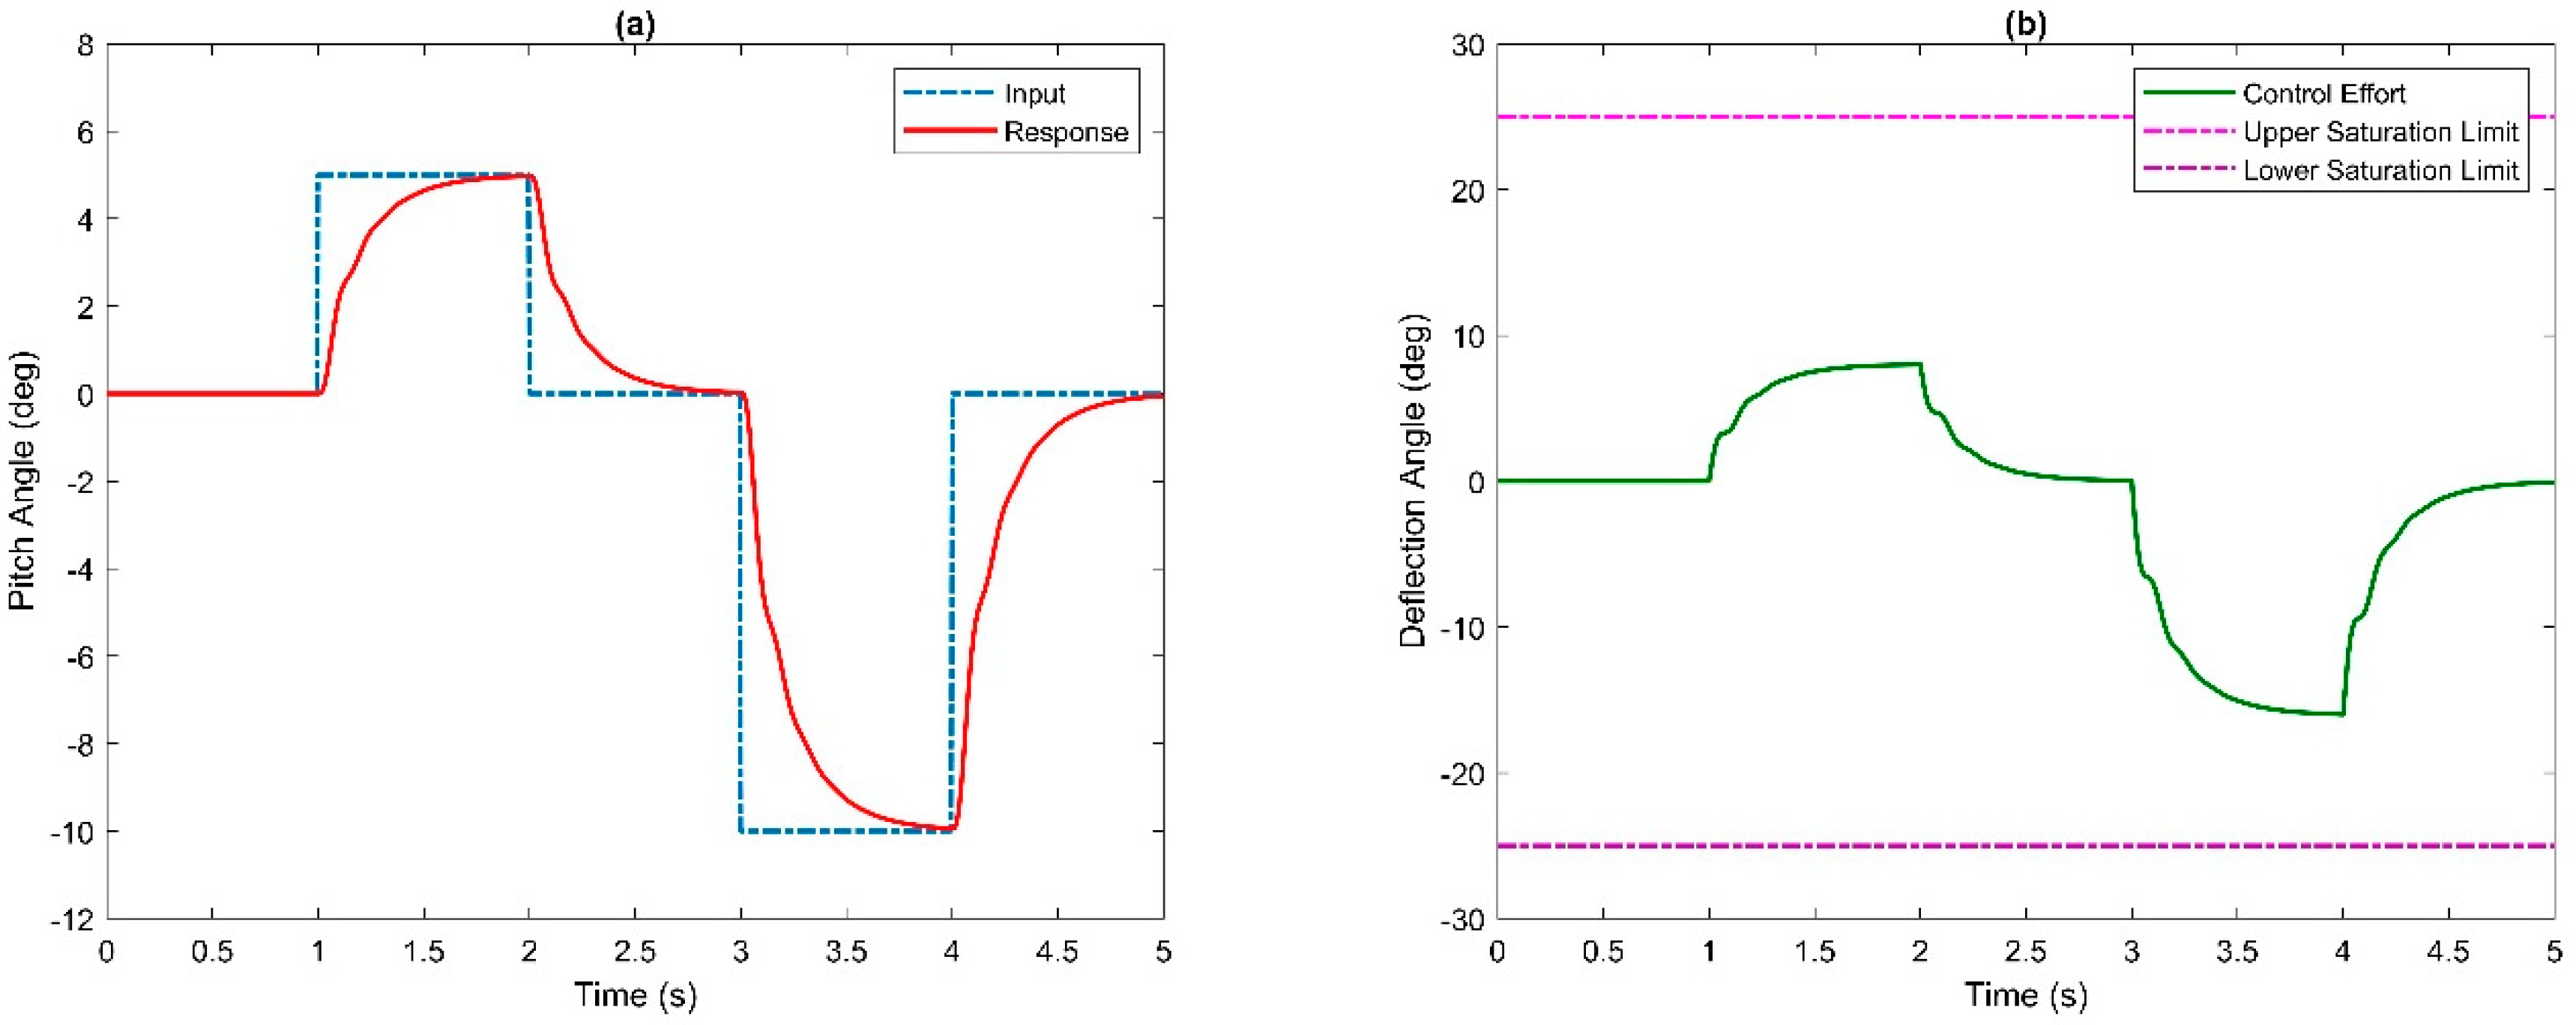
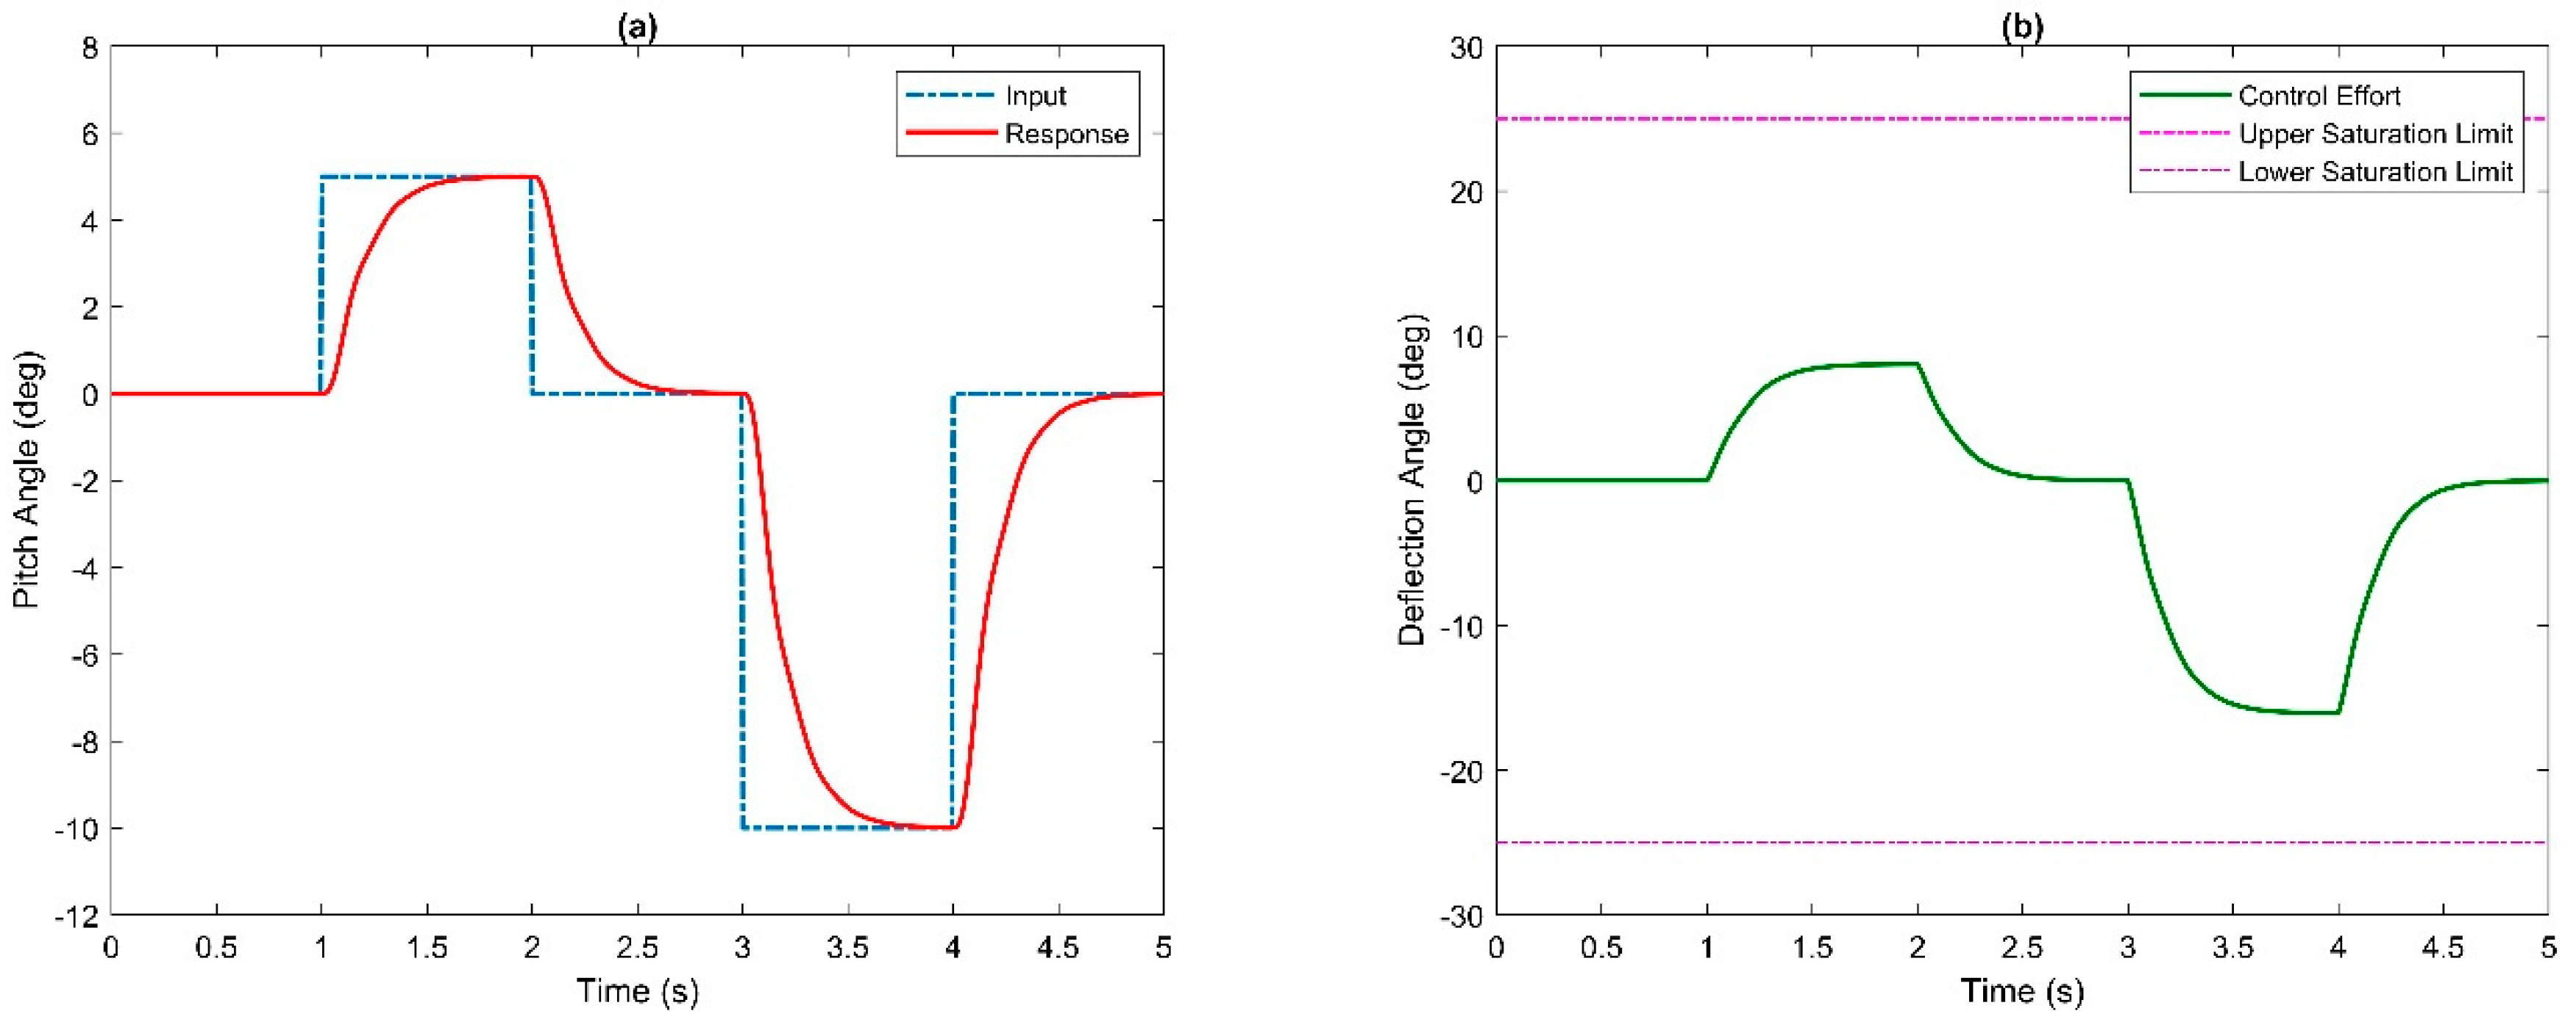
According to the root contour map shown above, the closed-loop transfer function’s poles are at the desired location when the gain values for k p , k i , and k d are 175, 825, and 13. The closed-loop PID controller for the pitch axis is subsequently developed. The proposed controller must then be assessed and tweaked in simulations. Hence, the controller is simulated on a high-fidelity UAV model. A doublet input is provided to the model, and the controller gains obtained by the root contour method are implemented. The simulations are carried out for 5 s, and the output response of the model is shown in Figure 12.
Figure 12 illustrates that the root contour controller is capable of delivering a response that is satisfactory, with no overshoot, a 0.485 s rise time, and a setting time of 1.04 s, as expected. Additionally, it is evident that the thrusters are not saturated. The frequency response of the system with the root locus tuned PID controller is shown in Figure 13.
Despite the fact that the model’s response is satisfactory and fulfills the performance criteria, the root locus tuned controllers are not optimal. In aerial vehicle applications, controllers that can deliver optimal performance are required so that the intended response may be achieved with the least amount of control effort. The genetic algorithm (GA) and particle swarm optimization (PSO) are the most widely used methods for optimal tuning of PID controllers. The sections that follow cover PID tuning using the GA and PSO.

4.2. Genetic Algorithm (GA) Optimization

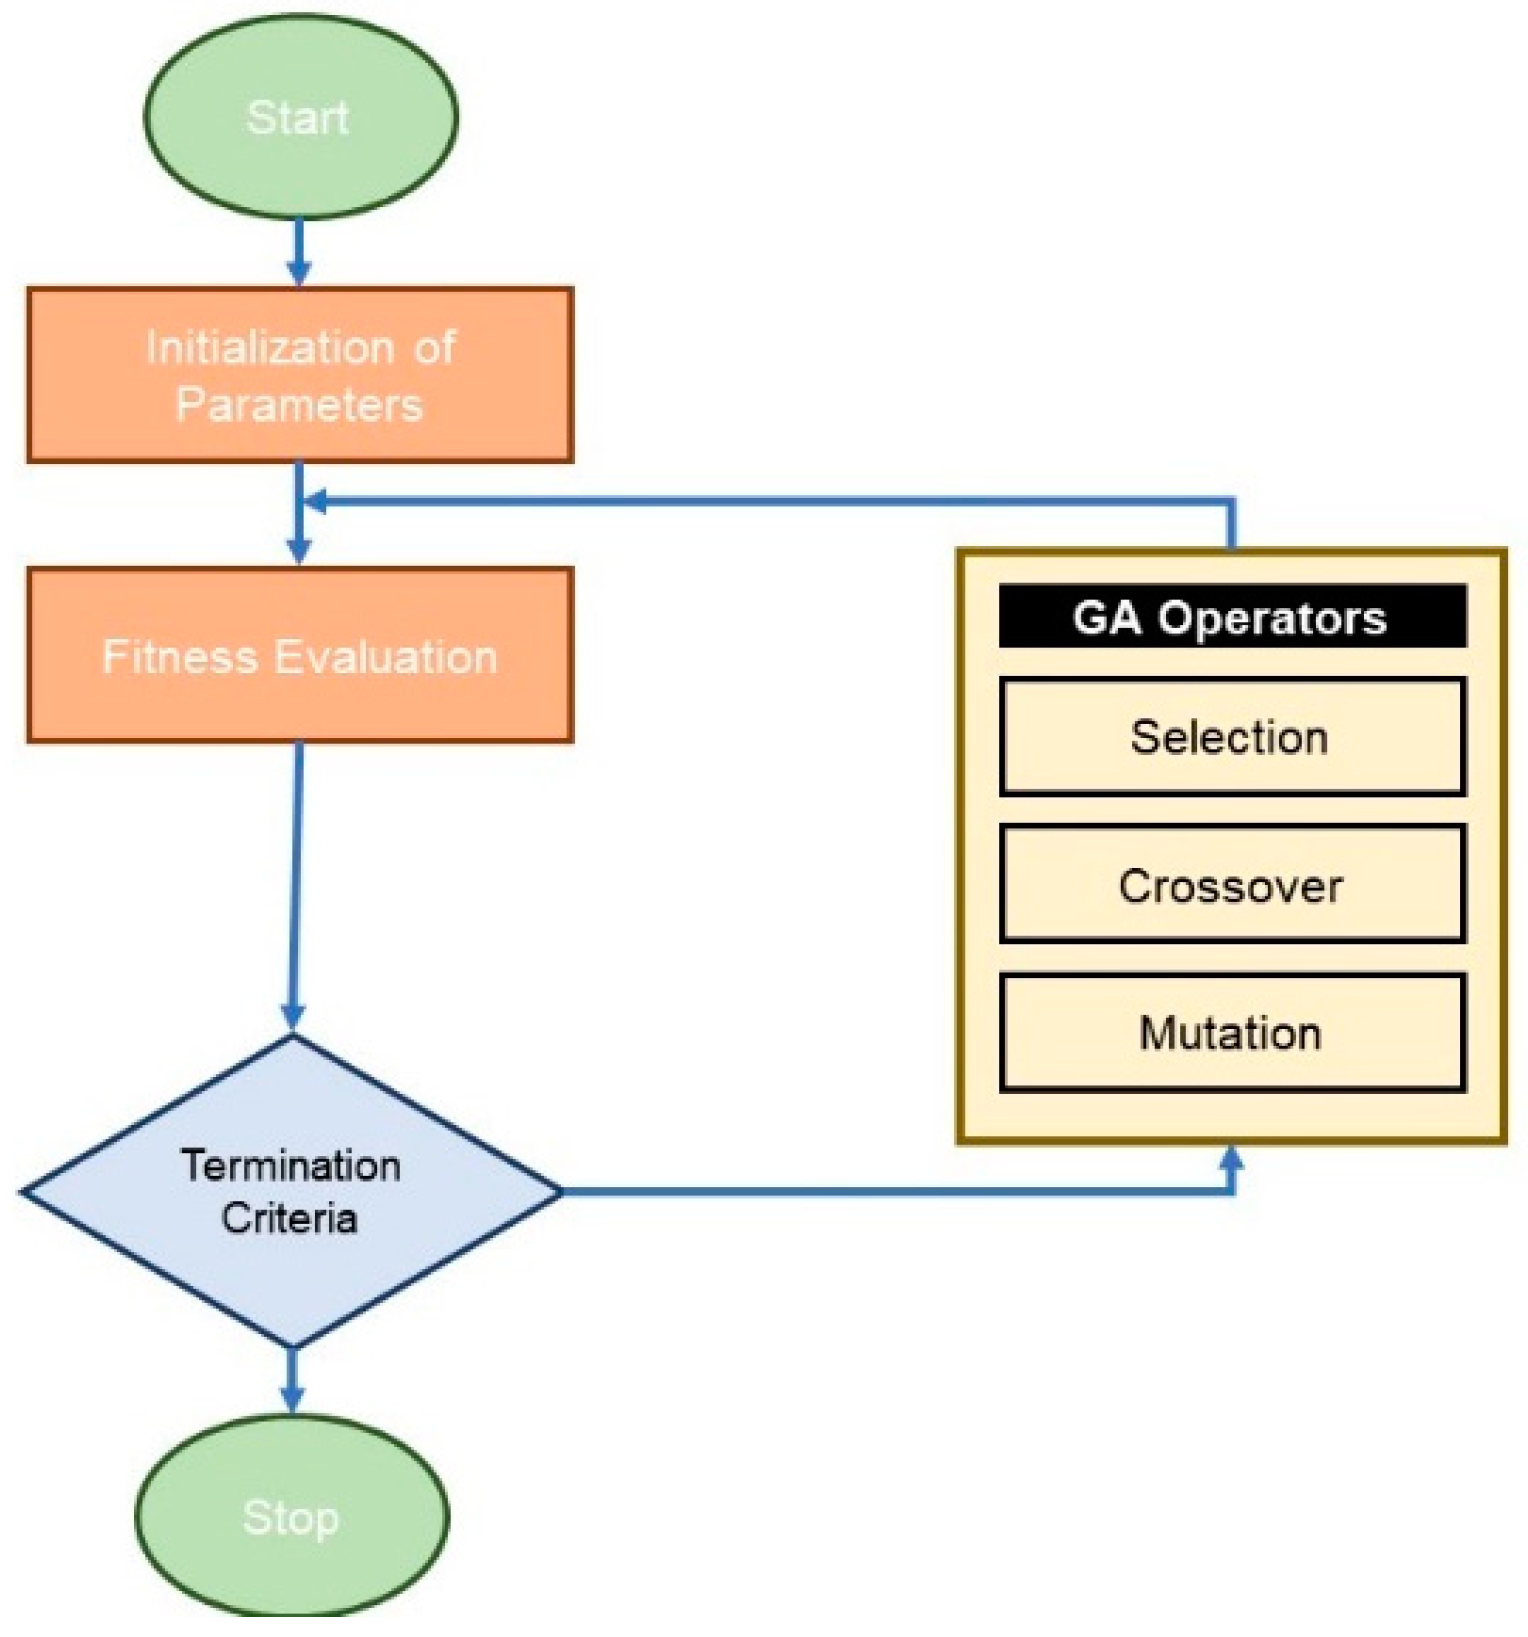
The genetic algorithm (GA), an important evolutionary technique, provides approximate solutions to a wide range of optimization problems. It incorporates various biological strategies such as selection, crossover, mutation, and reproduction [34]. The algorithm follows several steps:
  • The starting population is defined either randomly or heuristically.
  • The fitness value of each population member is calculated.
  • A selection probability proportional to the fitness rating is assigned to each member.
  • Desired individuals are selected from the current generation to produce offspring for the next generation.
  • Steps 1 to 4 are repeated, and the objective function is evaluated for each chromosome (member) of the new generation until a satisfactory solution is found.
The GA results in the proliferation of the fittest members after each iteration by using a predetermined fitness function. Figure 14 depicts the basic flowchart of the GA.
The cost function for the system under discussion is the Integral of Time-weighted Absolute Error (ITAE). Minimizing the error function yields proportional, integral, and derivative gains for the controller. Table 1 contains an overview of the various parameters employed in the problem setup.
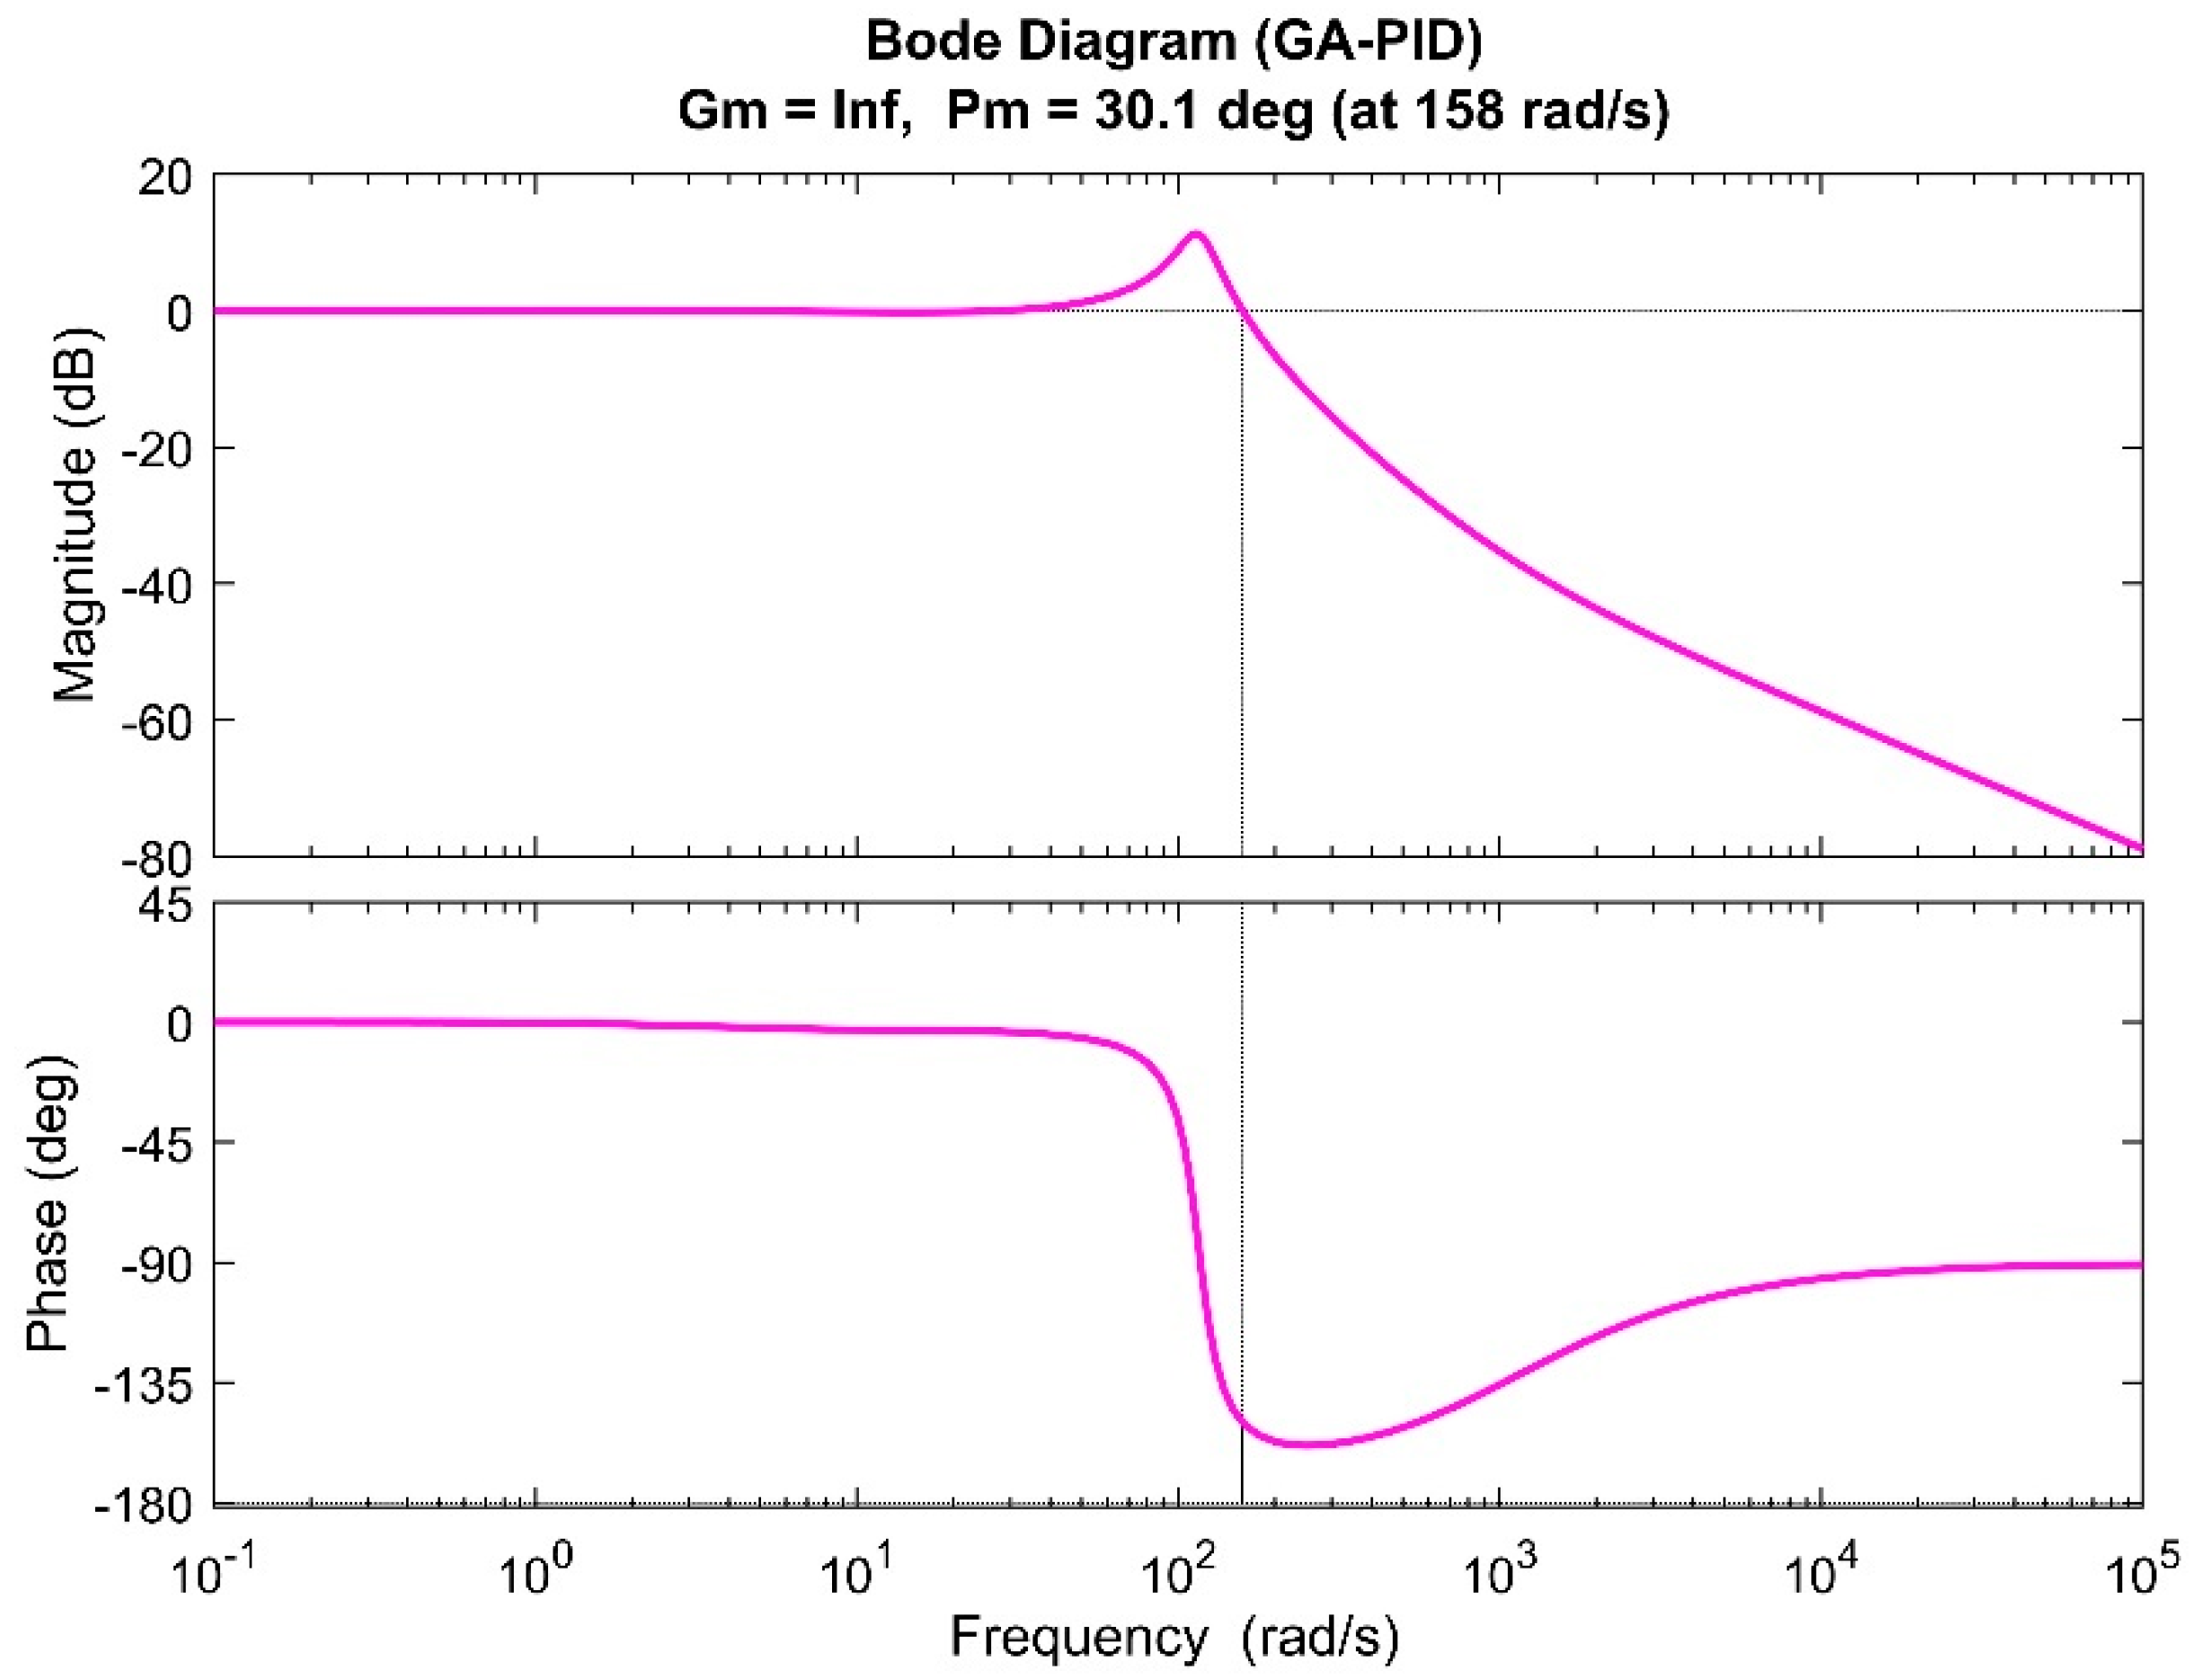
After the setup is complete, the algorithm is executed to minimize the cost function. The optimization results in the minimum value of the cost function, which is then converted into PID gains. Specifically, proportional, integral, and derivative gains of 110, 981, and 0.1 are obtained through GA optimization. These gains are then simulated on the FTV model. The simulation demonstrates that the response falls within the desired performance range, with a rise time of 0.390 s, a settling time of 0.75 s, and no overshoot. Figure 15 shows the response of the system with the GA-PID controller, whereas the frequency response is depicted in Figure 16.
While GA-PID meets the performance requirements and outperforms root locus PID, it should be noted that the population density in the solution space is lower, and the GA may not be able to generate all viable solutions [35]. On the other hand, PSO exhibits a unique behavior, where the best solution has a significant influence over the entire search space, resulting in better solutions in a shorter time frame [36]. Nonetheless, the GA has attracted a lot of attention from academics in recent years and is now being used as an established optimization method in a wide range of academic arenas [37]. Katoch et al. have gone into great detail about current applications and possible areas of research where the GA might be used [38]. The next section explains the tuning of PID using PSO.

4.3. Particle Swarm Optimization (PSO)

Particle swarm optimization (PSO) is an evolutionary algorithm that operates by forming a swarm of particles that adhere to predetermined principles. The particle’s previous position and the best-known position across the entire search space determine the changes in particle values [39]. Initially, the particles are randomly positioned, and with each iteration, the position and velocity of each particle are adjusted to move toward the individual best and global best locations. By applying arbitrary factors to the acceleration coefficients, the efficiency of local search and convergence to a globally optimal solution is enhanced [40].
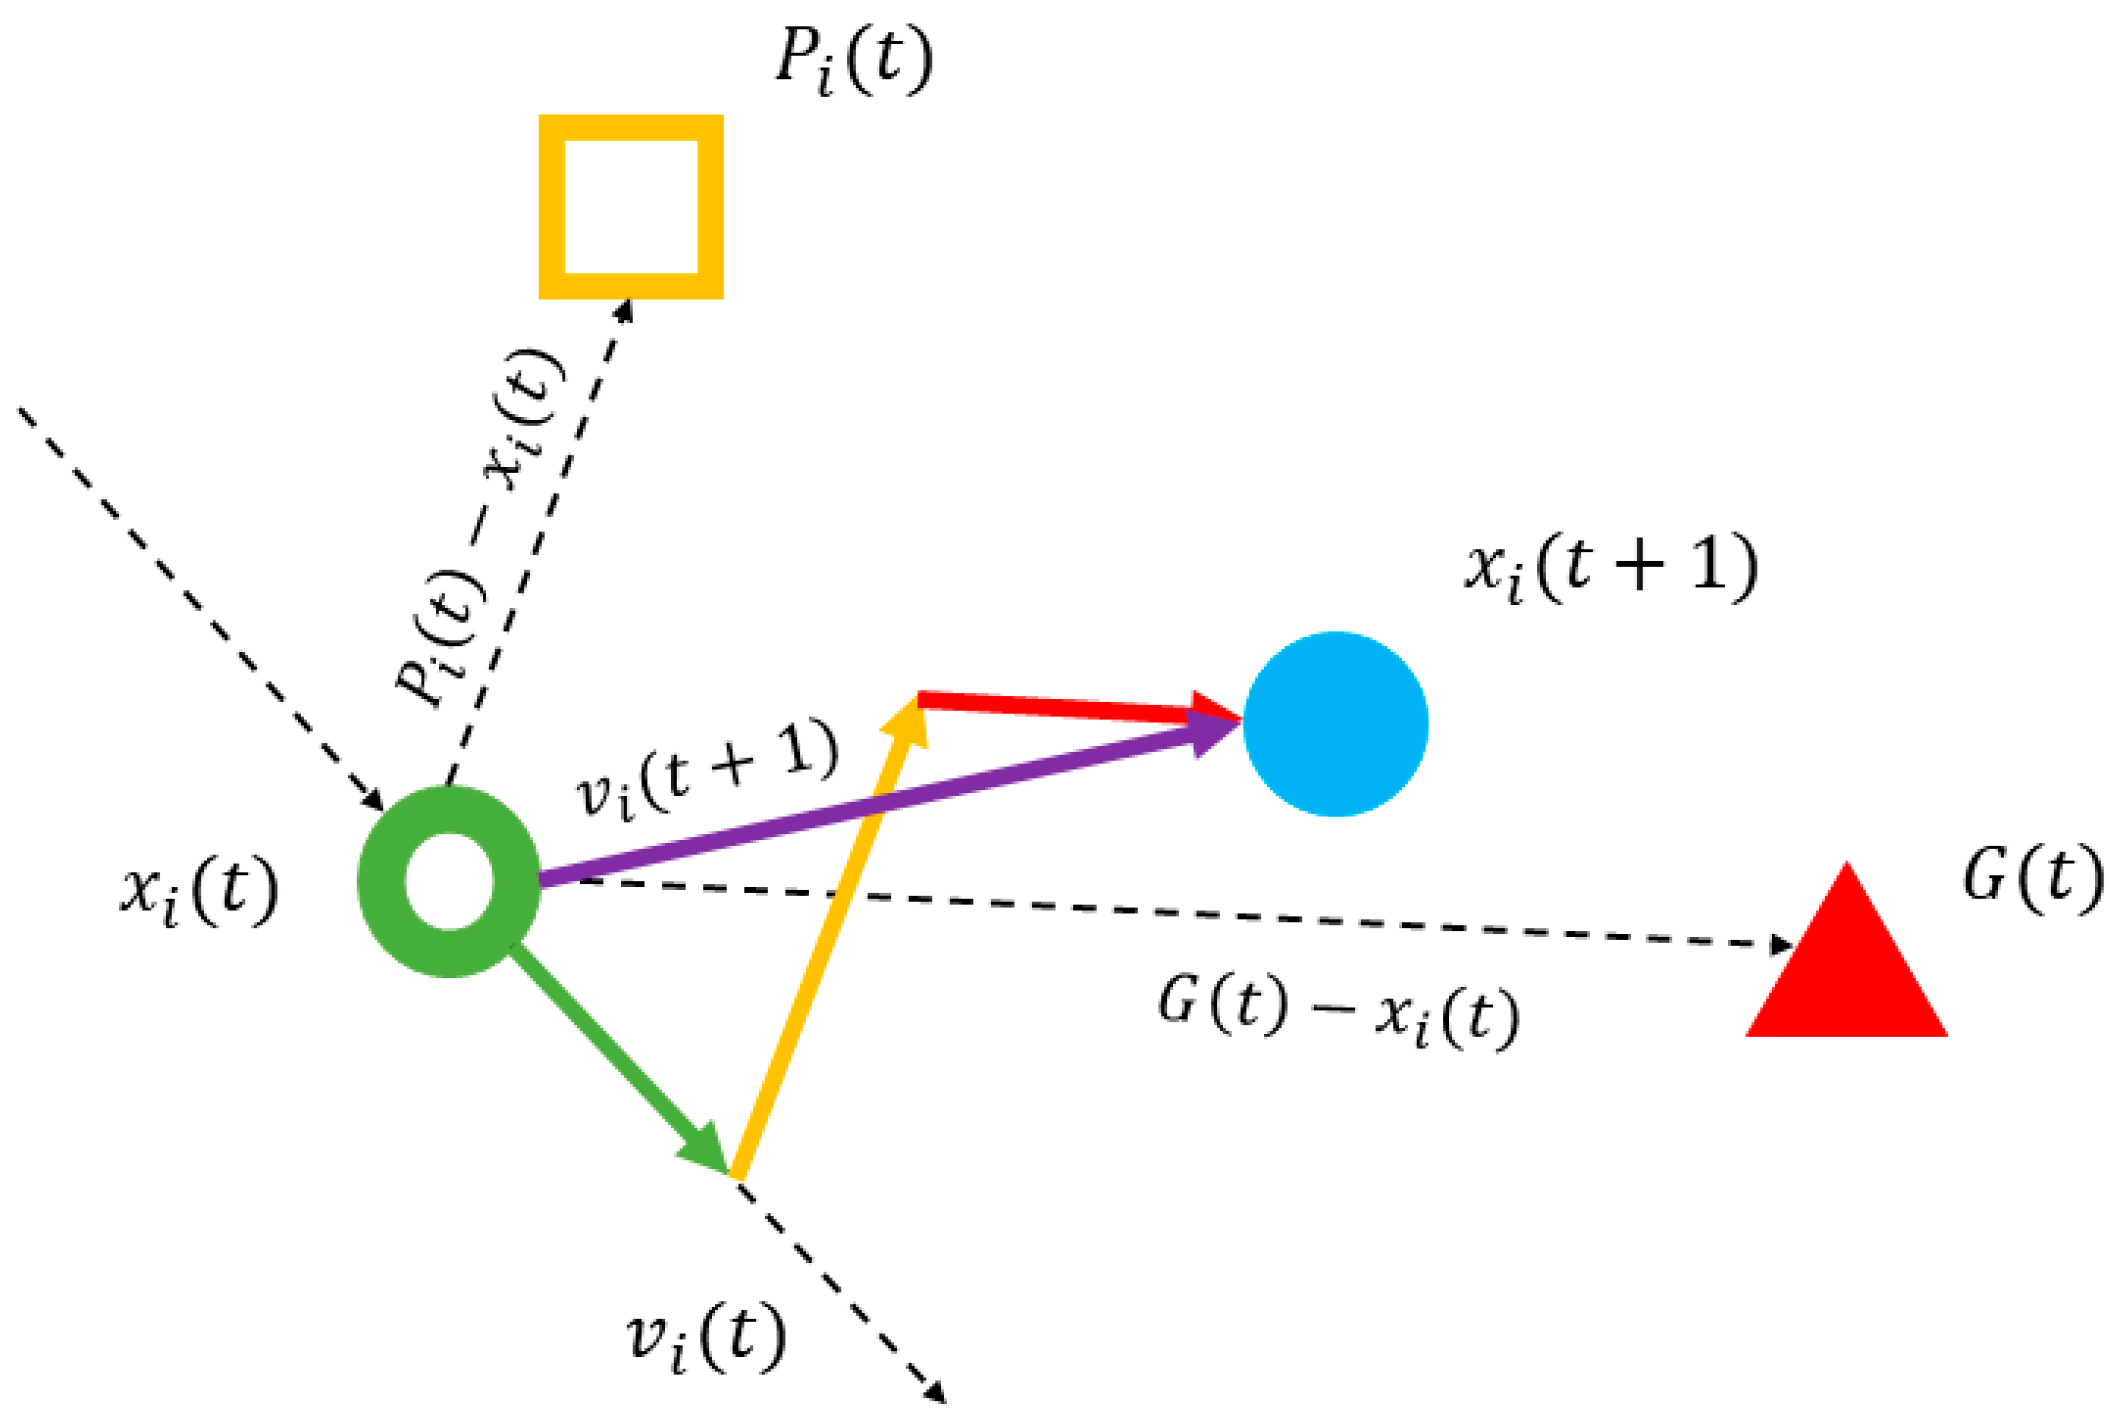
To understand how PSO works, consider a particle i such that the position vector of the particle at any instant in time x i ( t ) is a member of search space. In addition to position, there is a velocity vector for every particle, which is denoted by v i ( t ) . Furthermore, every particle has a memory of its own best position or experience denoted by personal best P i ( t ) and a common best experience among the members of the search space denoted by G ( t ) . Let us say the particle moves at a newer or updated position denoted by x i ( t + 1 ) . Now, the path followed by the particle to reach the updated position is dictated by its velocity vector v i ( t ) and the vectors from the particle’s initial position to personal and global best, as shown in Figure 17. The mathematical expression of the motion of particles in PSO is as follows:
x i ( t + 1 ) = x i ( t ) + v i ( t + 1 )
where v i ( t + 1 ) is the velocity of the particle at the updated position and is given as:
v i ( t + 1 ) = w v i ( t ) + r 1 c 1 ( P i ( t ) x i ( t ) ) + r 2 c 2 ( G ( t ) x i ( t ) )  
where c 1 and c 2 are called acceleration coefficients and w , r 1 , and r 2 are all real value coefficients such that r 1 ,   r 2   ~   U ( 0 ,   1 ) .
As with the GA, the cost function is the Integral of Time-weighted Absolute Error (ITAE). The error function is minimized to obtain proportional, integral, and derivative gains for the controller. PSO setup parameters are similar to those used in GA optimization. Figure 18 depicts the PSO implementation flowchart.
The algorithm is then executed, yielding proportional, integral, and derivative gains of 26, 900, and 0.9, respectively. After simulating the model, the response is determined to be within the intended performance range, with a rise time of 0.328 s, a settling time of 0.75 s, and a zero-percent overshoot. Figure 19 shows the response of the system with the PSO-PID controller, whereas the frequency response is depicted in Figure 20.
The performance of the controllers used in this investigation is summarized in Table 2. Based on the analysis presented in the table, it is evident that all controllers meet the predetermined performance criteria. However, PSO demonstrates superior performance compared to the GA and root locus PID controllers across all performance indicators. These results also validate the suitability of the employed modeling approach.
In Table 2, it is evident that the gains obtained from PSO yield a more optimal performance compared to the other two methods. The improved performance of PSO over the GA can be attributed to the following factors:
  • PSO employs velocity and location update equations that generate a new swarm of particles, allowing for significant differences between the new particles and existing ones.
  • Compared to solutions generated by the GA, PSO maintains a higher density of candidate solutions within the solution space.
  • Each solution in the population is influenced by the best particle’s experience in the swarm, facilitating rapid convergence.
In summary, PID gains obtained using PSO yield the most desirable performance among the three methods. Additionally, with an equal number of iterations, PSO achieves a lower value for the cost function and faster convergence to the optimal solution compared to the GA.

5. Conclusions

This study examines a delta wing UAV test bench equipped with co-flow FTV for pitch control. The research focuses on the challenging tasks of modeling and closed-loop control design associated with the delta wing UAV with novel co-flow FTV control. This article utilizes the Newton–Euler approach to derive the equation of motion for a free-to-pitch UAV test bed. To obtain a high-fidelity model, the experimentally obtained pitching moment of inertia and aerodynamic gain were incorporated in the e.o.m. Consequently, a linear single-input, single-output (SISO) transfer function model is obtained for the dynamic UAV. The modeling procedure employed in this study is deemed suitable for a class of blended/delta wing UAVs.
In relation to vehicle control, several performance measures, such as stability, reference tracking, quick response time, and robustness, were defined. Analysis of the test rig’s response revealed that accomplishing these objectives solely through open-loop mechanisms was not feasible, thus necessitating the examination of closed-loop strategies. A multi-parameter root contour method was utilized as a reference point to assess the performance of a PID controller based on the genetic algorithm (GA) and particle swarm optimization (PSO). The inadequacy of the conventional tuning procedure to attain optimal controller gains necessitates the use of meta-heuristics.
Finally, experiments were conducted in simulation environment to assess the performance of the controllers both in the time and frequency domain. The simulation results demonstrated that the PSO-PID controller exhibits significantly enhanced performance compared to the root locus and GA-PI controllers. Furthermore, the findings demonstrated that the PSO-PID controller outperformed the other examined algorithms in terms of performance capabilities (up to 32% improvement in rise time, 83% in peak time, and 70% in settling time) while demanding a comparable control effort. Consequently, PSO-PID has been demonstrated to be an effective choice for FTV control of delta wing UAVs and comparable systems.

Author Contributions

Conceptualization, A.T. and S.M.A.; methodology, A.T.; software, A.T.; validation, A.T. and S.M.A.; formal analysis, A.T.; investigation, A.T.; resources, S.M.A.; data curation, A.T.; writing—original draft preparation, A.T.; writing—review and editing, S.M.A.; visualization, A.T.; supervision, S.M.A.; project administration, S.M.A. All authors have read and agreed to the published version of the manuscript.

Funding

This research received no external funding.

Data Availability Statement

Data will be made available upon request.

Conflicts of Interest

The authors declare that they have no known competing financial interest or personal relationship that could have appeared to influence the work reported in this paper.

Appendix A

Table A1. Comprehensive model nomenclature.
SymbolDescription
I y Mass moment of inertia in pitch plane
θ Pitch angle
M q Pitching moment or stability derivative due to pitch rate
M α Pitching moment due to angle of attack α
α Angular acceleration in pitch
q Pitch angular velocity
δ Jet deflection angle
l Distance between c.g. and exhaust nozzle
C L α Lift curve slope
Q Dynamic pressure
S e Effective planform area
C l α Lift curve slope of a 2D infinite flat plate
v p 2 Primary flow velocity
k Aerodynamic gain
F l Lift force
ARAspect ratio

References

  1. Gal-Or, B. Vectored Propulsion, Supermaneuverability and Robot Aircraft; Springer: Berlin/Heidelberg, Germany, 1990. [Google Scholar]
  2. Gal-Or, B. Fundamental concepts of vectored propulsion. J. Propuls. Power 1990, 6, 747–757. [Google Scholar] [CrossRef]
  3. Alcorn, C.; Croom, M.; Francis, M.; Ross, H. The X-31 aircraft: Advances in aircraft agility and performance. Prog. Aerosp. Sci. 1996, 32, 377–413. [Google Scholar] [CrossRef]
  4. Bowers, A.H.; Pahle, J.W. Thrust Vectoring on the NASA F-18 High Alpha Research Vehicle; NASA: Washington, DC, USA, 1996.
  5. Vickers, J. Propulsion Analysis of the F-16 Multiaxis Thrust Vectoring Aircraft; NASA: Washington, DC, USA, 1994.
  6. Ahmad, S.M.; Siddique, S.M.; Yousaf, M.S.; Tariq, M.; Khan, M.I.; Alam, M.A. Computational and experimental investigation of fluidic thrust vectoring actuator. J. Braz. Soc. Mech. Sci. Eng. 2018, 40, 315. [Google Scholar] [CrossRef]
  7. Crowther, W.J.; Wilde, P.I.A.; Gill, K.; Michie, S.M. Towards Integrated design of fluidic flight controls for a flapless aircraft. Aeronaut. J. 2009, 113, 699–713. [Google Scholar] [CrossRef]
  8. Sekar, T.C.; Kushari, A.; Mody, B.; Uthup, B. Fluidic thrust vectoring using transverse jet injection in a converging nozzle with aft-deck. Exp. Therm. Fluid Sci. 2017, 86, 189–203. [Google Scholar] [CrossRef]
  9. Shi, N.-X.; Gu, Y.-S.; Zhou, Y.-H.; Wang, L.-X.; Feng, C.; Li, L.-K. Mechanism of hysteresis and uncontrolled deflection in jet vectoring control based on Coanda effect. Phys. Fluids 2022, 34, 084107. [Google Scholar] [CrossRef]
  10. Cen, Z.; Smith, T.; Stewart, P.; Stewart, J. Integrated flight/thrust vectoring control for jet-powered unmanned aerial vehicles with ACHEON propulsion. Proc. Inst. Mech. Eng. Part G J. Aerosp. Eng. 2015, 229, 1057–1075. [Google Scholar] [CrossRef] [Green Version]
  11. Mangin, B.; Chpoun, A.; Jacquin, L. Experimental and numerical study of the fluidic thrust vectoring of a two-dimensional supersonic nozzle. In Proceedings of the 24th AIAA Applied Aerodynamics Conference, San Francisco, CA, USA, 5–8 June 2006. [Google Scholar]
  12. Mason, M.; Crowther, W. Fluidic Thrust Vectoring for Low Observable Air Vehicles. In Proceedings of the 2nd AIAA Flow Control Conference, Portland, OR, USA, 28 June–1 July 2004. [Google Scholar]
  13. Fielding, J.P.; Mills, A.; Smith, H. Design and manufacture of the DEMON unmanned air vehicle demonstrator vehicle. Proc. Inst. Mech. Eng. Part G J. Aerosp. Eng. 2009, 224, 365–372. [Google Scholar] [CrossRef]
  14. Das, A.K.; Acharyya, K.; Mankodi, T.K.; Saha, U.K. Fluidic Thrust Vector Control of Aerospace Vehicles: State-of-the-Art Review and Future Prospects. J. Fluids Eng. 2023, 145, 080801. [Google Scholar] [CrossRef]
  15. Saghafi, F.; Banazadeh, A. Co-flow fluidic thrust vectoring requirements for longitudinal and lateral trim purposes. In Proceedings of the 42nd AIAA/ASME/SAE/ASEE Joint Propulsion Conference & Exhibit, Sacramento, CA, USA, 9–12 July 2006; p. 4980. [Google Scholar]
  16. Wu, K.; Jin, Y.; Kim, H.D. Study on the Fluidic Thrust Vector Control Using Co-Flow Concept. Korean Soc. Propuls. Eng. Conf. Proc. 2017, 48, 675–678. [Google Scholar]
  17. Forliti, D.J.; Diaz-Guardamino, I.E. Exploring Mechanisms of Fluidic Thrust Vectoring Using a Transverse Jet and Suction. AIAA J. 2009, 47, 2329–2337. [Google Scholar] [CrossRef]
  18. Maruyama, Y.; Sakata, M.; Takahashi, Y. Performance analyses of fluidic thrust vector control system using dual throat nozzle. AIAA J. 2022, 60, 1730–1744. [Google Scholar] [CrossRef]
  19. Ferlauto, M.; Marsilio, R. Numerical Investigation of the Dynamic Characteristics of a Dual-Throat-Nozzle for Fluidic Thrust-Vectoring. AIAA J. 2017, 55, 86–98. [Google Scholar] [CrossRef]
  20. Wen, X.; Zhou, K.; Liu, P.; Zhu, H.; Wang, Q.; Liu, Y. Schlieren Visualization of Coflow Fluidic Thrust Vectoring Using Sweeping Jets. AIAA J. 2022, 60, 435–444. [Google Scholar] [CrossRef]
  21. Gu, D.-W.; Natesan, K.; Postlethwaite, I. Modelling and robust control of fluidic thrust vectoring and circulation control for unmanned air vehicles. Proc. Inst. Mech. Eng. Part I J. Syst. Control. Eng. 2008, 222, 333–345. [Google Scholar] [CrossRef] [Green Version]
  22. Kikkawa, H.; Uchiyama, K. Attitude Control of a Fixed-Wing UAV Using Thrust Vectoring System; IEEE: Piscataway, NJ, USA, 2017; pp. 264–269. [Google Scholar]
  23. Warsop, C.; Crowther, W. NATO AVT-239 task group: Flight demonstration of fluidic flight controls on the MAGMA subscale demonstrator aircraft. In Proceedings of the AIAA Scitech 2019 Forum, San Diego, CA, USA, 7–11 January 2019; p. 282. [Google Scholar]
  24. Nelson, R.C.; Pelletier, A. The unsteady aerodynamics of slender wings and aircraft undergoing large amplitude maneuvers. Prog. Aerosp. Sci. 2003, 39, 185–248. [Google Scholar] [CrossRef]
  25. Polhamus, E.C. A Concept of the Vortex Lift of Sharp-Edge Delta Wings Based on a Leading-Edge-Suction Analogy; NASA: Washington, DC, USA, 1966.
  26. Vaitheeswaran, S.M.; Gowthami, T.S.; Prasad, S.; Yathirajam, B. Monostatic radar cross section of flying wing delta planforms. Eng. Sci. Technol. Int. J. 2017, 20, 467–481. [Google Scholar] [CrossRef]
  27. Lyddon, J.; Nguyen, M.; Quackenbush, J.; Schadegg, T.; Takahashi, T.T. Optimum Design of a Fuel Efficient Mid-Size Business Jet. In Proceedings of the 10th AIAA Multidisciplinary Design Optimization Conference, National Harbor, MD, USA, 13–17 January 2014; p. 1337. [Google Scholar]
  28. Ahmad, S. Flight dynamics, parametric modelling and real-time control of a 1-DOF Tailplane. Math. Comput. Model. Dyn. Syst. 2013, 19, 220–237. [Google Scholar] [CrossRef]
  29. Khan, Y.M.; Ahmad, S.M.; Ali, M.; Khan, M. Flight dynamics and parametric modeling of a 2-DOF lab aircraft. Proc. Inst. Mech. Eng. Part G J. Aerosp. Eng. 2019, 233, 2923–2931. [Google Scholar] [CrossRef]
  30. Wang, K.; Zhou, Z. Aerodynamic Design, Analysis and Validation of a Small Blended-Wing-Body Unmanned Aerial Vehicle. Aerospace 2022, 9, 36. [Google Scholar] [CrossRef]
  31. Min, B.-M.; Shin, S.-S.; Shim, H.-C.; Tahk, M.-J. Modeling and Autopilot Design of Blended Wing-Body UAV. Int. J. Aeronaut. Space Sci. 2008, 9, 121–128. [Google Scholar] [CrossRef] [Green Version]
  32. Lim, S.; Yook, Y.; Heo, J.P.; Im, C.G.; Ryu, K.H.; Sung, S.W. A new PID controller design using differential operator for the integrating process. Comput. Chem. Eng. 2023, 170, 108105. [Google Scholar] [CrossRef]
  33. Golnaraghi, F.; Kuo, B.C. Automatic Control Systems; McGraw-Hill Education: New York, NY, USA, 2017. [Google Scholar]
  34. Mirjalili, S.; Mirjalili, S. Genetic algorithm. In Evolutionary Algorithms and Neural Networks: Theory and Applications; Springer: Cham, Switzerland, 2019; pp. 43–55. [Google Scholar]
  35. Kachitvichyanukul, V. Comparison of three evolutionary algorithms: GA, PSO, and DE. Ind. Eng. Manag. Syst. 2012, 11, 215–223. [Google Scholar] [CrossRef] [Green Version]
  36. Pratchayaborirak, T.; Kachitvichyanukul, V. A two-stage PSO algorithm for job shop scheduling problem. Int. J. Manag. Sci. Eng. Manag. 2011, 6, 83–92. [Google Scholar] [CrossRef]
  37. Lambora, A.; Gupta, K.; Chopra, K. Genetic Algorithm—A Literature Review; IEEE: Piscataway, NJ, USA, 2019; pp. 380–384. [Google Scholar]
  38. Katoch, S.; Chauhan, S.S.; Kumar, V. A review on genetic algorithm: Past, present, and future. Multimed. Tools Appl. 2021, 80, 8091–8126. [Google Scholar] [CrossRef]
  39. Eberhart, R.C.; Shi, Y.; Kennedy, J. Swarm Intelligence; Elsevier: Amsterdam, The Netherlands, 2001. [Google Scholar]
  40. Ratnaweera, A.; Halgamuge, S.; Watson, H. Self-Organizing Hierarchical Particle Swarm Optimizer with Time-Varying Acceleration Coefficients. IEEE Trans. Evol. Comput. 2004, 8, 240–255. [Google Scholar] [CrossRef]
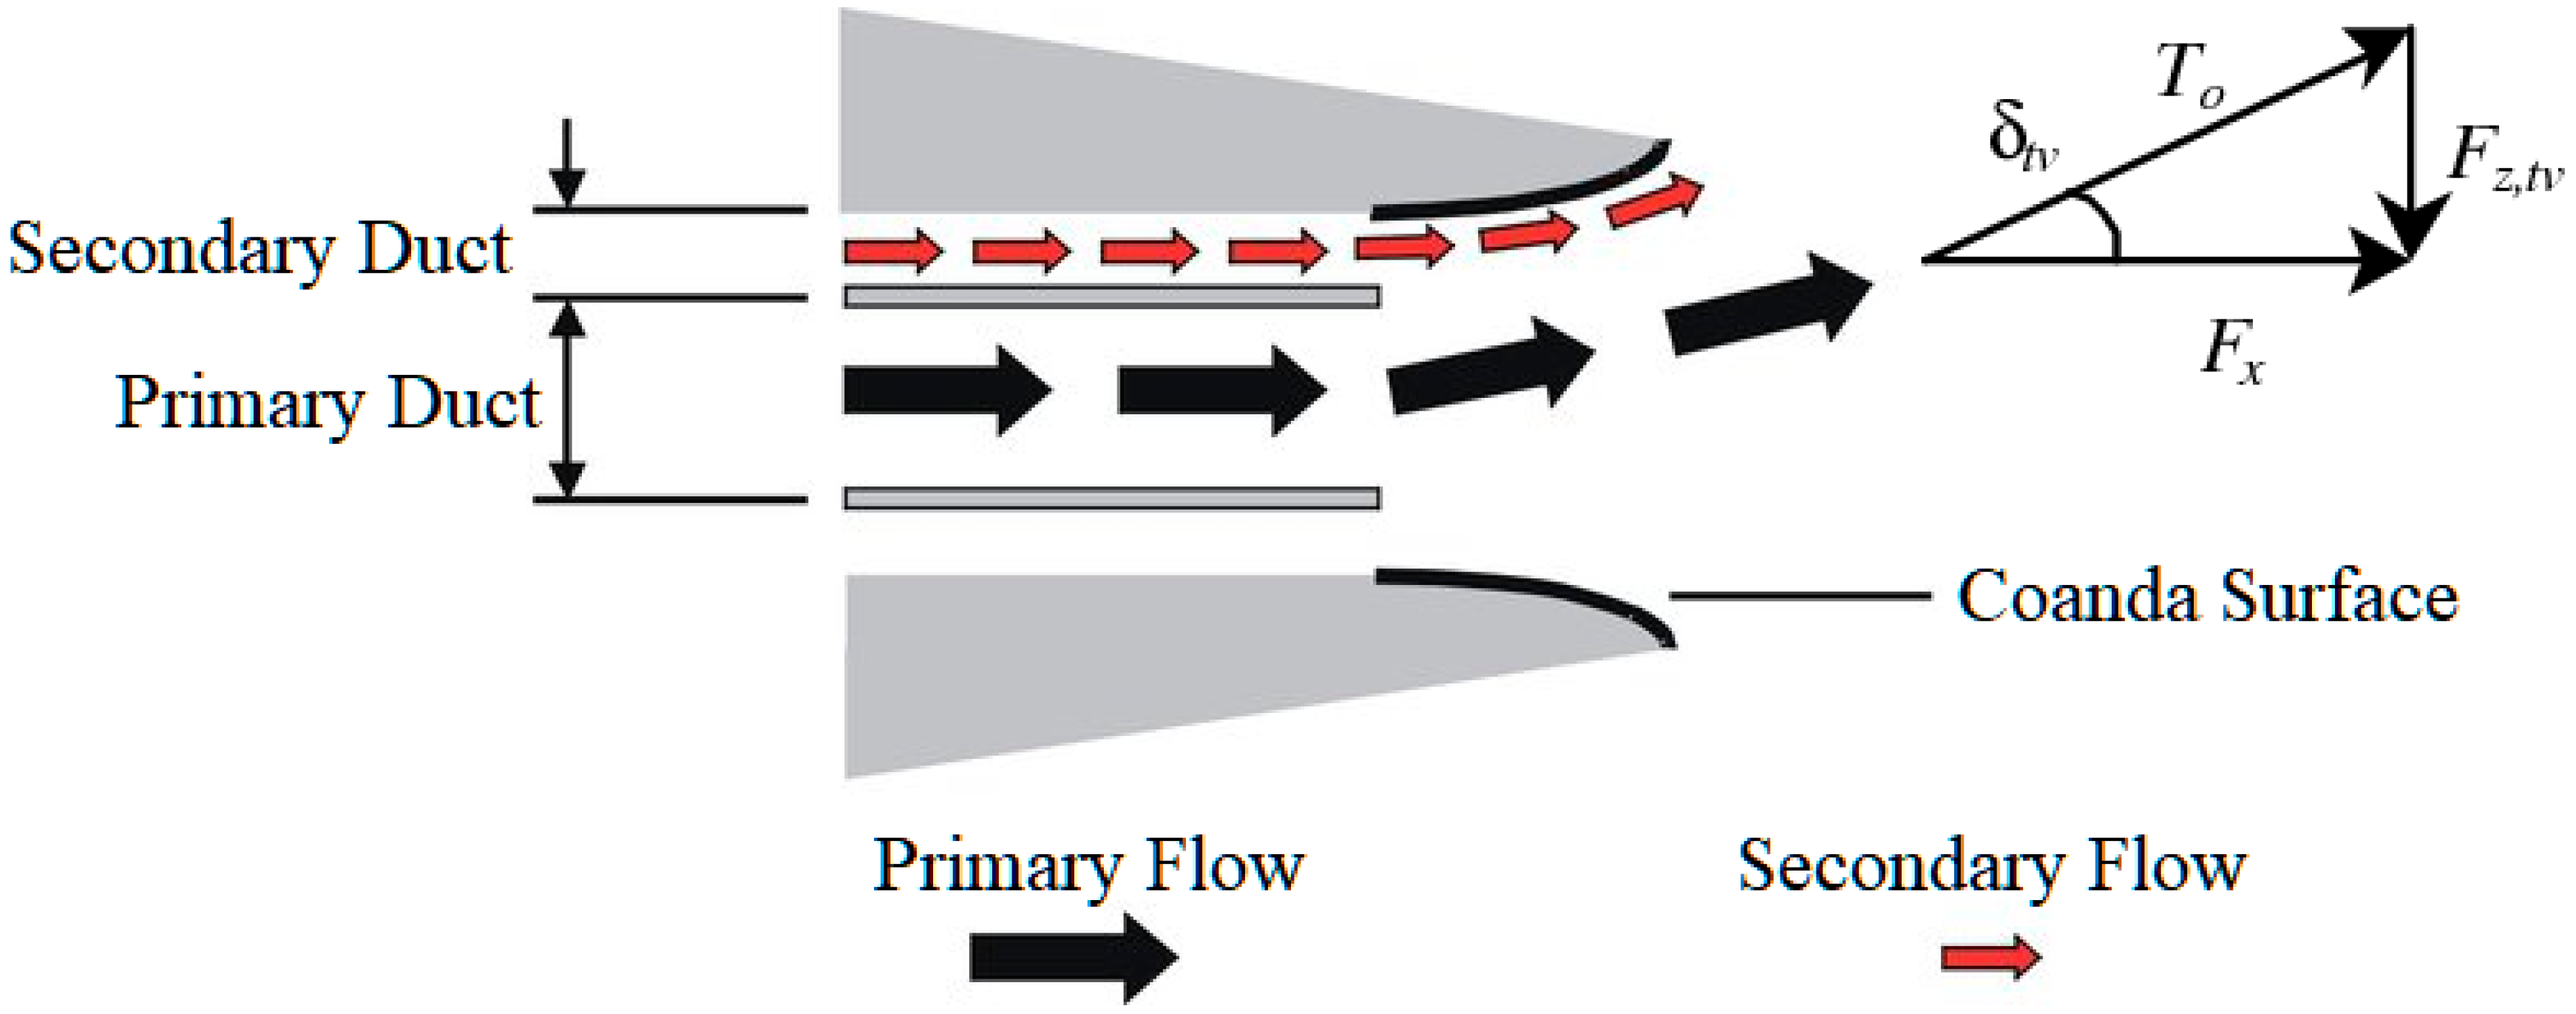
Figure 1. Schematic illustrating the co-flow thrust vectoring principle.
Aerospace 10 00563 g001
Figure 2. Fully assembled delta wing UAV: (a) exploded CAD model, (b) assembled UAV.
Aerospace 10 00563 g002
Figure 3. UAV fuselage: (a) schematic, (b) actual.
Aerospace 10 00563 g003
Figure 4. Error induced in secondary flow speed measurement.
Aerospace 10 00563 g004
Figure 5. Deflected primary jet flow visualization using tufts.
Aerospace 10 00563 g005
Figure 6. Variation in jet deflection angle with secondary jet velocity.
Aerospace 10 00563 g006
Figure 7. Moment generated as a result of jet deflection.
Aerospace 10 00563 g007
Figure 8. Deflection moment at 19 m/s and 25 m/s.
Aerospace 10 00563 g008
Figure 9. Lift force produced for various jet deflection angles.
Aerospace 10 00563 g009
Figure 10. Frequency response of the pitch dynamics.
Aerospace 10 00563 g010
Figure 11. Root contour plot for pitch controller.
Aerospace 10 00563 g011
Figure 12. Closed-loop performance of the PID controller: (a) pitch response, (b) control effort.
Aerospace 10 00563 g012
Figure 13. Frequency response with the root locus tuned PID controller.
Aerospace 10 00563 g013
Figure 14. A basic GA flowchart.
Aerospace 10 00563 g014
Figure 15. Closed-loop performance of the GA-PID controller: (a) pitch response, (b) control effort.
Aerospace 10 00563 g015
Figure 16. Frequency response with GA-PID.
Aerospace 10 00563 g016
Figure 17. A basic PSO schematic.
Aerospace 10 00563 g017
Figure 18. A basic PSO implementation flowchart.
Aerospace 10 00563 g018
Figure 19. Closed-loop performance of the PSO-PID controller: (a) pitch response, (b) control effort.
Aerospace 10 00563 g019
Figure 20. Frequency response with PSO-PID.
Aerospace 10 00563 g020
Table 1. GA setup parameters.
ParameterValue
Gain Bounds0–1000
Initial Population Size50
Stopping Criteria300 Generations
Creation FunctionUniform
Selection FunctionStochastic Selection Function
CrossoverIntermediate
MutationAdaptive Feasible
Table 2. Quantitative performance comparison of the investigated controllers.
k p k i k d T r   ( s ) T p   ( s ) T s   ( s ) %   O S PM
PID175825130.4852.331.0390179°
GA-PID1109810.10.3901.9230.749030.1°
PSO-PID269000.90.3281.2730.6100173°
Disclaimer/Publisher’s Note: The statements, opinions and data contained in all publications are solely those of the individual author(s) and contributor(s) and not of MDPI and/or the editor(s). MDPI and/or the editor(s) disclaim responsibility for any injury to people or property resulting from any ideas, methods, instructions or products referred to in the content.