Article

Study on Low-Velocity Impact Performance of Coal-Based Carbon Foam Sandwich Structures in Thermal Protection Systems

1
School of Aeronautic Science and Engineering, Beihang University, Beijing 100191, China
2
State Key Laboratory of NBC Protection for Civilian, Research Institute of Chemical Defense, Beijing 100191, China
*
Author to whom correspondence should be addressed.
Aerospace 2023, 10(7), 630; https://doi.org/10.3390/aerospace10070630
Submission received: 16 May 2023 / Revised: 4 July 2023 / Accepted: 11 July 2023 / Published: 12 July 2023
(This article belongs to the Special Issue Structural Design of Aerospace Vehicles)

Abstract

:
Coal-based carbon foam (CCF) has been widely used in the hypersonic vehicles’ thermal protection system (TPS) due to its good thermal insulation and mechanical properties. In addition, CCF can absorb large quantities of energy when crushed so that the CCF sandwich structure can effectively improve the impact resistance of the TPS. However, there are few studies on the impact performance of CCF sandwich structures, even the mechanical constitutive model (MCM) of CCF. This research work built the CCF MCM and studied the low-velocity impact properties. A large number of experiments were implemented to establish an effective and comprehensive CCF MCM which has three parts: basic mechanical properties, multiaxial loading failure criteria, and hardening rules. A series of tests on the low-velocity impact performance of two CCF sandwich structures were carried out, and finite element models (FEMs) were established according to the CCF MCM to simulate these tests. The experimental and simulation results were in good agreement. The impact damage mechanism was revealed by the tests and the FEMs. The MCM can be used not only for the simulation of low-velocity impact process but also for failure analysis of other CCF structures, which will help to design CCF structures at a low cost.

1. Introduction

Hypersonic vehicles (HVs) have serious aerodynamic thermal problems, which require a thermal protection system (TPS) to protect the vehicle [1,2,3,4,5]. With the development of HVs, the vehicle has higher comprehensive demands for thermal insulation materials for the TPS: (1) Higher thermal stability. Insulation materials need to maintain stable high-temperature performance to ensure a longer flight cycle [4]. (2) Higher impact resistance. HVs are under threat of impact, including low-velocity impacts during transportation, installation, and runway take-off and landing and high-velocity impacts by space debris outside the atmosphere shock [6,7,8,9,10,11]. The impacts might cause the TPS to fall off in a large area, or local penetrating damage, which will seriously weaken the thermal insulation performance of the TPS and affect the safety of the HV.
Scholars [12] have studied a variety of insulation materials that meet the above comprehensive demands and found that coal-based carbon foam (CCF) is one of them. CCF is a porous material made of raw coal that is foamed and carbonized [13], which has the following characteristics that make it suitable for TPS: (1) The thermal conductivity can be as low as 0.1 W/(m·K) after depositing carbon aerogel in its cells [14], and it is equivalent to that of the third generation ceramic tile aluminum-enhanced thermal barrier (AETB) at high temperatures [15,16,17]. (2) The high-temperature performance can be stable for a long time at 3000 °C under the condition of isolated air [18,19]. (3) The compressive modulus and strength are 1.5–2.5 GPa and 10–17 Mpa, respectively, at room temperature [19,20,21,22], and their reductions are less than 45% and 5%, respectively, at 1800 °C [23]. Compared with AETB’s compressive modulus and strength, which are 0.153 GPa and 0.689 MPa [24], respectively, at room temperature, CCF’s relatively high mechanical properties allow it to absorb more impact energy, which enable the TPS to withstand greater impact energy before overall or partial failure.
The above properties have led scholars to apply CCF to the TPS. Grujicic [25] studied an integrated thermal protection system (ITPS) consisting of C/C composite materials and CCF on common aviation vehicles (CAVs). A CAV is a small, unpowered, autonomously navigating supersonic vehicle that can carry a variety of weapons and launch them from space. ITPS enables the aircraft to maintain the temperature of the internal aluminum alloy structure within 160 °C under extreme aerodynamic heating conditions of up to 3000 s and bear the aerodynamic load as the skin. Ogasawara et al. [26,27,28] studied two types of TPS prepared with different sandwich panels: one TPS panel was made of a carbon-fiber-reinforced resin matrix composite, and the other TPS outer panel was made of C/C composite material. Using a three-point bending test, the authors measured the flexural strength and flexural modulus of the sandwich structures at room temperature and elevated temperatures. The results showed that the bending strength of the sandwich panel remained basically unchanged at high temperatures. The authors also evaluated the thermal insulation performance of the sandwich structure, and it was found to have a good thermal insulation performance. The solar probe Parker Solar Probe launched by the United States in 2018 also adopted the CCF TPS manufactured by Ultramet [29,30,31,32,33], and its structure was “alumina coating-isolation layer-C/C panel-CCF-C/C Panel.” The alumina coating was used to radiate energy outward to dissipate heat. The C/C panel was made of chopped carbon fiber and resin. CCF was filled between the panels as the insulation material with a thickness of 11.43 cm, so the satellite’s internal structure could maintain 30 °C, while the external temperature was 1371 °C. The application of CCF in TPS has clear application prospects. However, there are few studies on the impact properties of CCF TPSs, which may not be conducive to the further development of CCF TPSs.
This study investigated the low-velocity impact performance of the CCF TPS for a runway take-off HV. This type of HV flies in the atmosphere and will not be threatened by the high-velocity impact of space debris, but it might be impacted by the low-velocity impact of debris on the runway during takeoff. The typical structures of CCF TPSs are CCF sandwich structures. According to different protection positions, the panel materials are carbon-fiber-reinforced bismaleimide composite material (CFRC) and carbon fiber/silicon carbide ceramics composite material (C/SiC). The CFRC’s strength and modulus reduce less than 50% and 40% at 200 °C, respectively, compared with those at room temperature [34,35]. Cai [36] studied the thermophysical properties of C/SiC and found that the tensile strength was nearly unchanged, the specific heat of increased from 0.7 to 1.6 JK−1g−1, and the thermal conductivity decreased from 32 to 23 Wm−1K−1 as the temperature changed from 25 °C to 900 °C. Patel [37] also found a similar variation trend. However, the HV is still at normal temperature when it takes off, so we need to focus only on the normal temperature and low-velocity impact performance of the CCF sandwich structures.
A series of low-velocity impact tests have been carried out in this study. Before discussing them, we first need to clarify the mechanical constitutive model (MCM) of CCF. Although scholars [38,39,40,41] have researched the CCF’s mechanical properties, it is still incomplete. In addition, there is no research on the failure behavior and the CCF MCM. Since CCF is an anisotropic brittle cellular foam, we combined the research results of Gibson et al. [42] on anisotropic brittle reticulated vitreous carbon foam (RVC) and the research results of Deshpande and Fleck [43] on isotropic cellular foam to propose an MCM suitable for CCF.
This study aimed to build the MCM of CCF and investigate the low-velocity impact properties and damage mechanism of CCF sandwich structures. A large number of experiments were implemented to establish a relatively accurate and comprehensive CCF MCM, which is divided into three parts: basic mechanical properties, multiaxial loading failure criteria, and hardening rules. A series of tests on the low-velocity impact performance of two CCF sandwich structures were carried out, and finite element models (FEMs) were established according to the CCF MCM to simulate these tests. The experimental and simulation results were in good agreement. Some important details of the damage mechanism were revealed by the FEMs.

2. Materials and Methods

2.1. Structures and Materials

We studied the impact resistance performance of two CCF sandwich structures, shown in Figure 1, whose impacted side panels were carbon-fiber-reinforced bismaleimide composite material (CFRC) and carbon fiber/silicon carbide ceramics composite material (C/SiC), respectively. The two sandwich structures were named resin matrix composite panel sandwich structure (RPS) and ceramic matrix composite panel sandwich structure (CPS). The maximum long-term use temperature of RPS was 270 °C, and that of CPS could reach 900 °C. The CFRC structures with the grade IS2101/T800 were manufactured by Tianjin Istar Aerospace Technology Co., Ltd. The C/SiC structures with the grade GSI31 were manufactured by National University of Defense Technology. Table 1 lists the mechanical and thermophysical properties provided by the manufacturer.
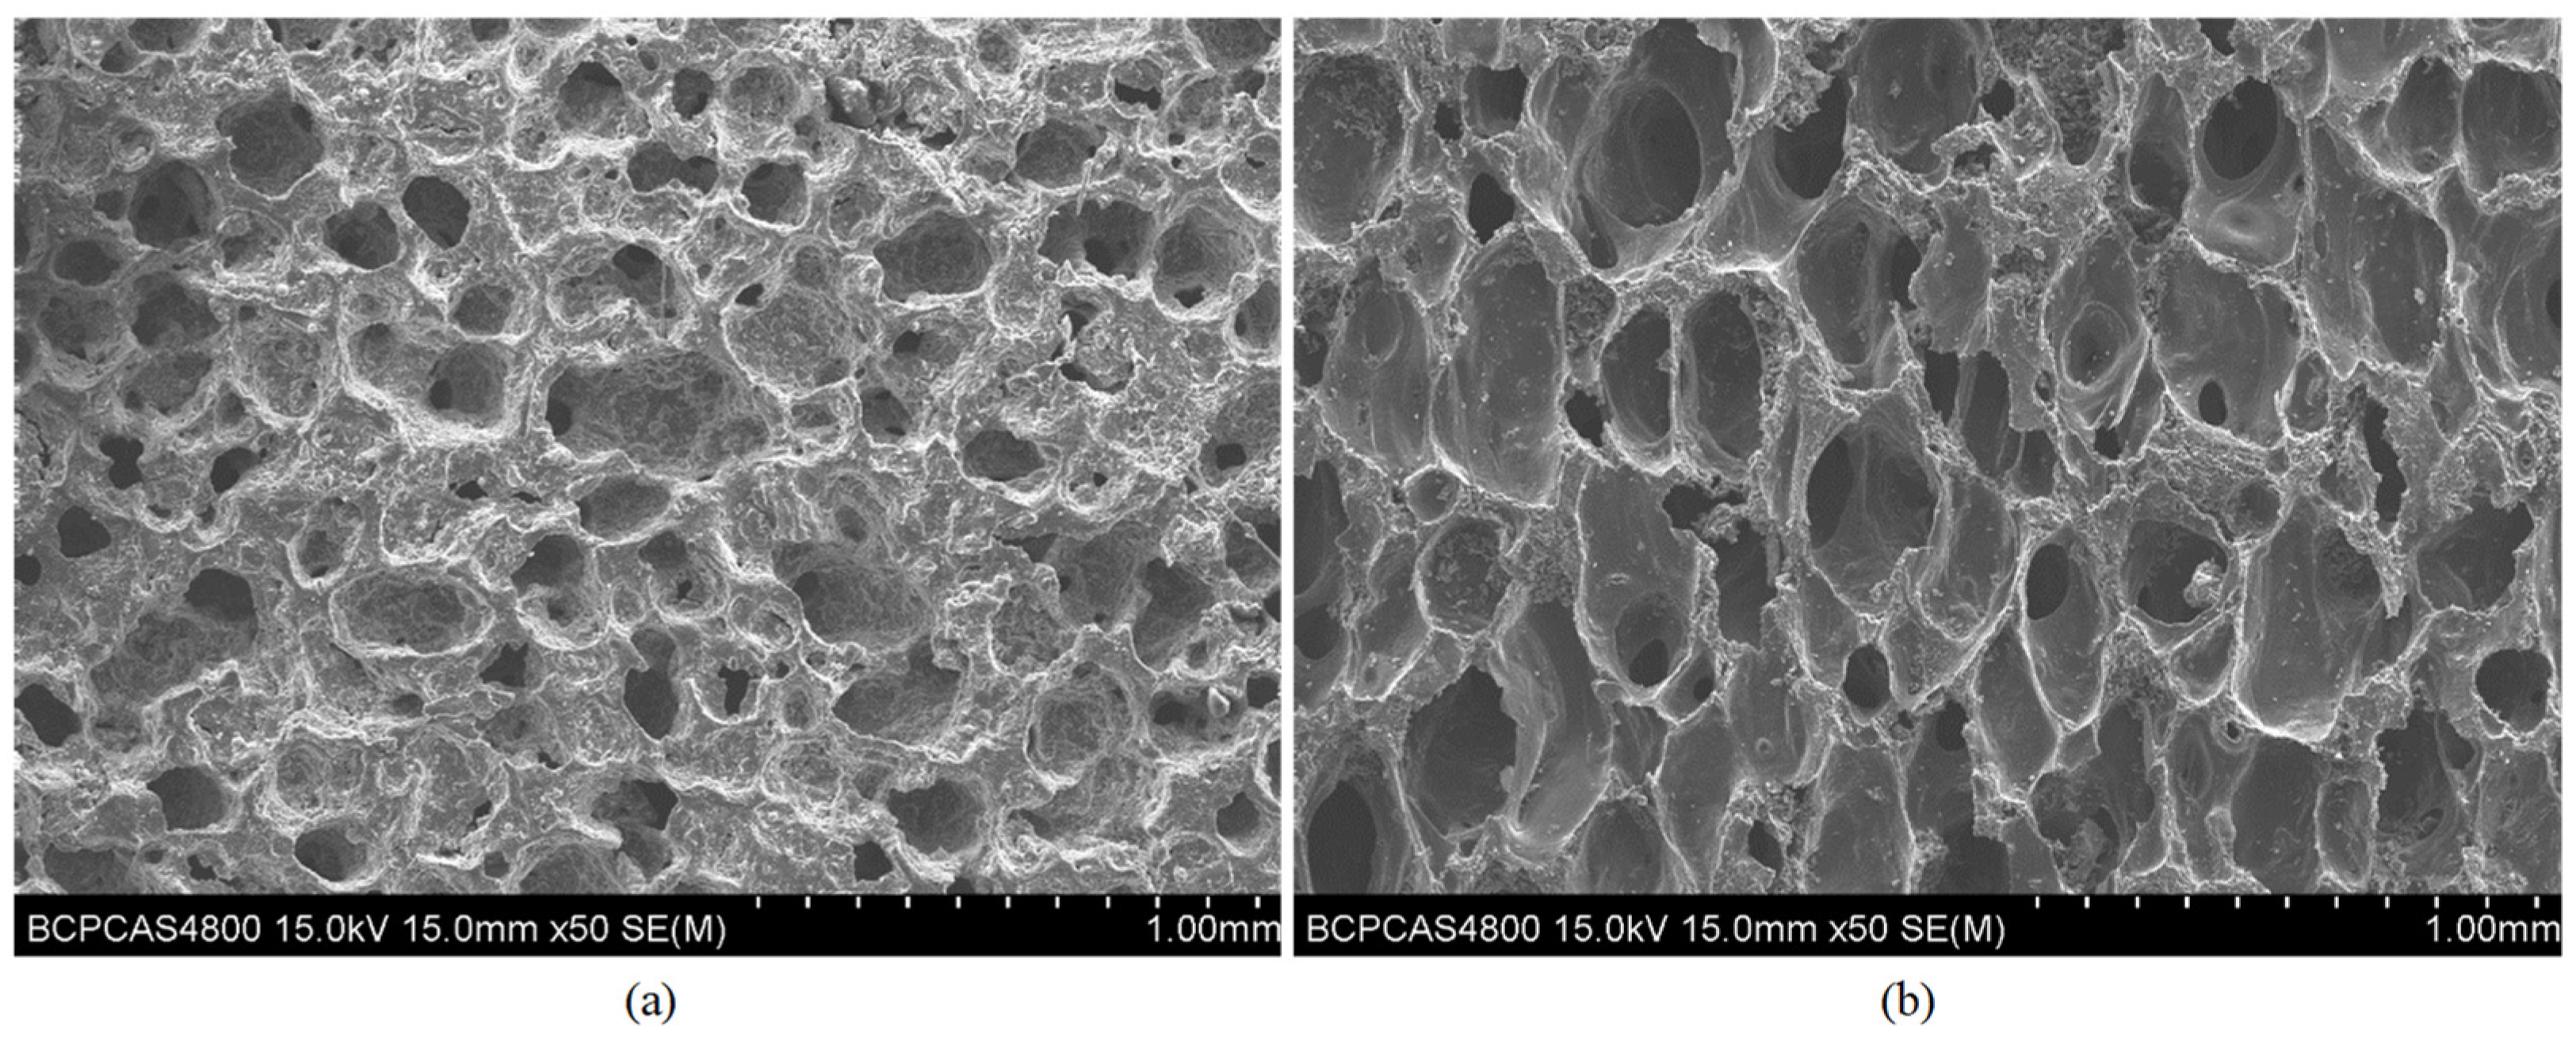
The CCF’s production process was introduced in our previous work [20], and Figure 2 shows its mesoscopic structure. It can be seen that the cells are approximately circular in the in-plane direction but elliptical in the out-of-plane direction. Therefore, it is reasonable to assume that the CCF we studied was a transverse isotropic foam, and the mechanical performance parameters obtained from the later experiments also confirmed this assumption.

2.2. Tests

2.2.1. Tests for CCF

When the sandwich structure was subjected to low-velocity impact, the sandwich core collapsed under multiaxial loading conditions. Hence, to simulate this process, it was necessary to study the comprehensive mechanical properties of CCF. Carbon foam is a type of brittle foam whose stress-strain curve under uniaxial compression is usually divided into three parts: elastic section, platform section, and densification section. CCF’s mechanical properties include basic mechanical properties, multiaxial loading failure criteria, and hardening rules.
The basic mechanical properties of CCF include uniaxial modulus, strength, and Poisson’s ratio in all three directions in the elastic section, which can be obtained by conventional test methods, including uniaxial tension (UT) test, uniaxial compression (UC) test, and single shear (SS) test.
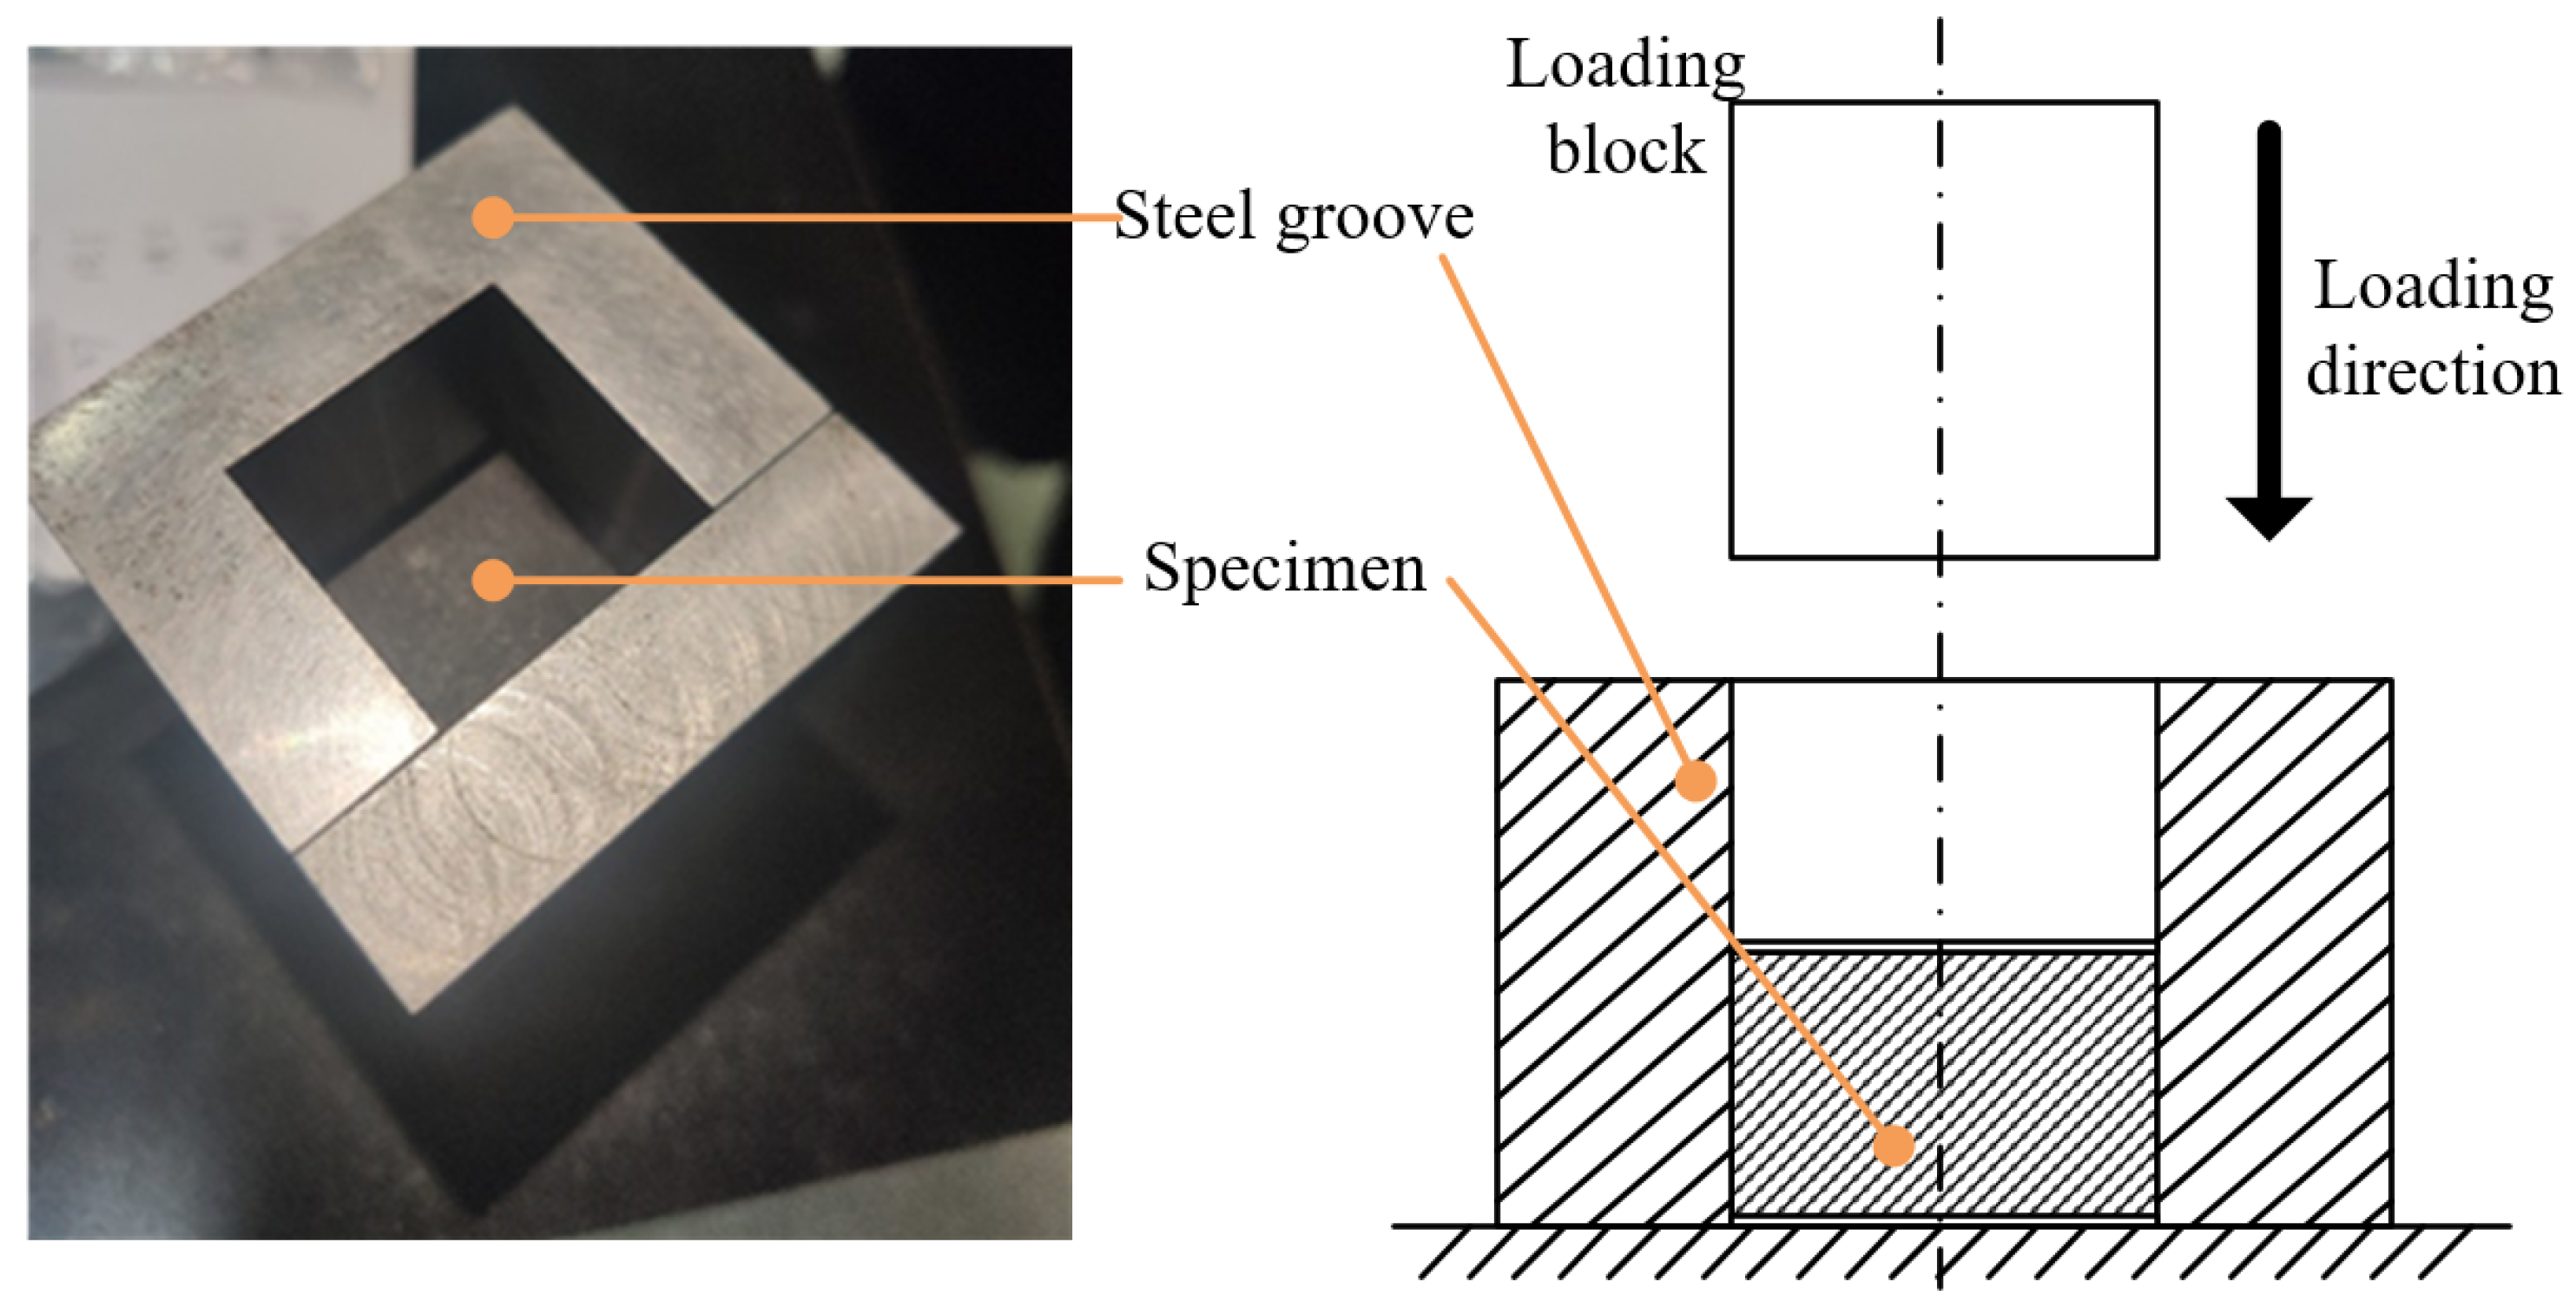
However, measuring the basic mechanical properties of porous materials cannot describe their failure behavior under multiaxial loading conditions. Therefore, multiaxial loading failure criteria must be established to solve this problem, which requires the multiaxial loading test of CCF. Gibson et al. [42] and Kolluri et al. [43] used the passive confining pressure (PC) test, as shown in Figure 3, to perform multiaxial loading on other foams and obtain valid data. The specimen coated with lubricating oil was set in a steel groove with an interference fit whose magnitude was 0.05 mm. The groove needed to be heated above 70 °C before assembly. The specimen was compressed by the loading block after cooling. The wall thickness of the steel groove should be large enough to ensure that the transverse strain of the specimen is approximately equal to 0 during the test so that the constraining force of the steel groove on the specimen can be solved according to the constitutive equation. Then, the stress in all directions can be obtained when the CCF fails under multiaxial loading. This test method is simple and reliable, so we conducted a PC test in all three directions on CCF.
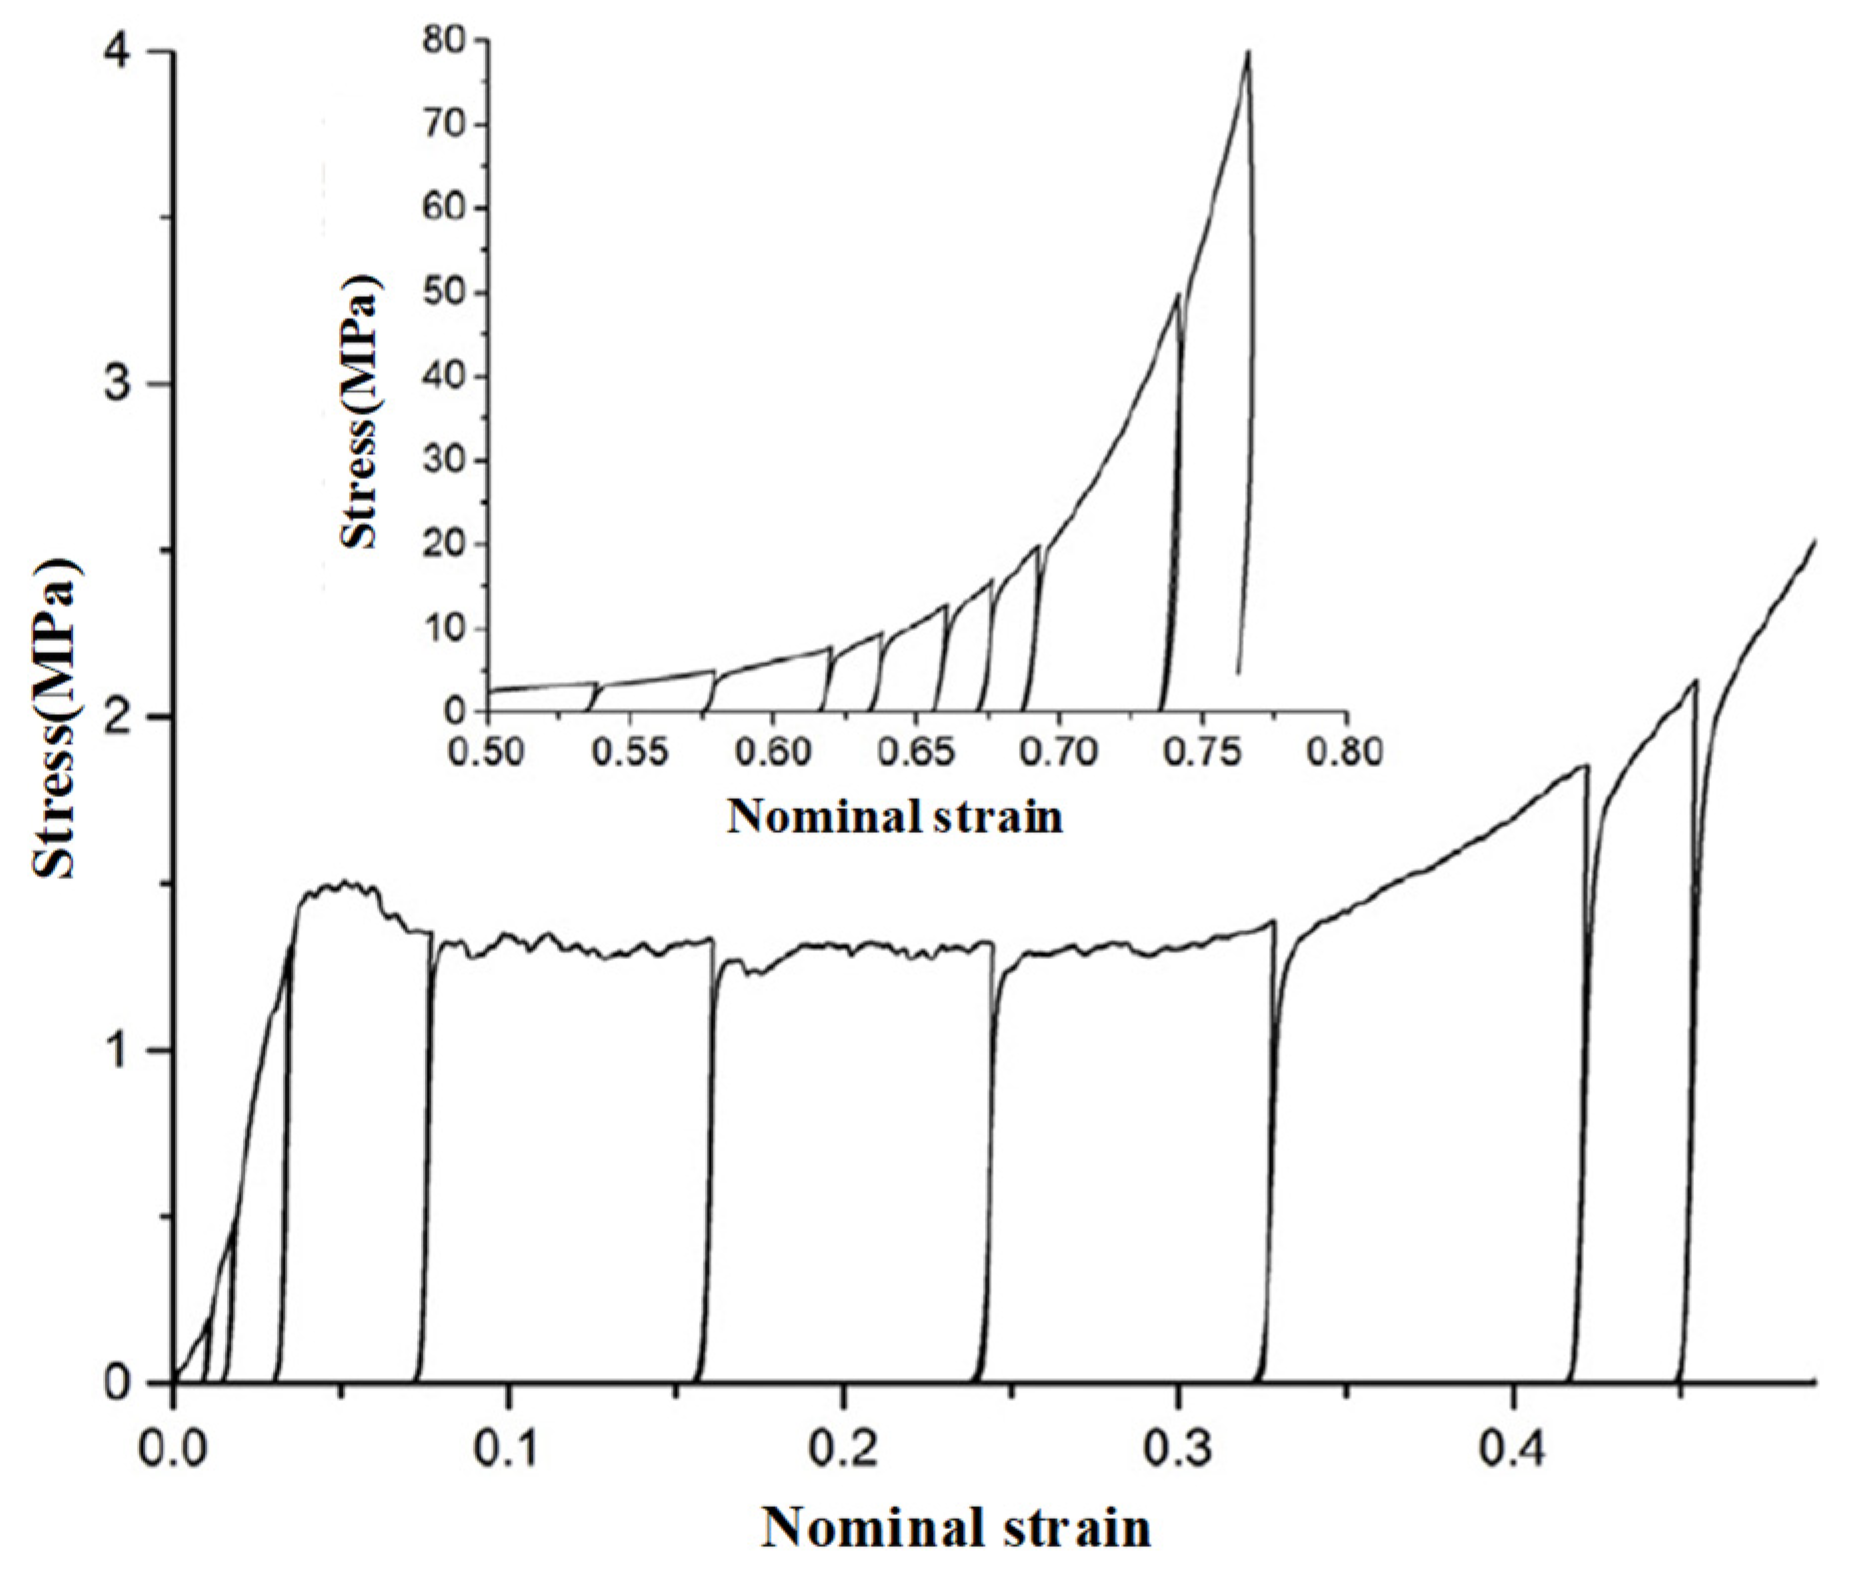
The hardening rules describe the mechanical characteristics of CCF in the platform section. The mechanical characteristics of other brittle foams are shown in Figure 4 [44]: (1) The maximum stress reached its peak when it entered the platform section, then dropped sharply and fluctuated in a small range around a value. The value was defined as platform stress σ p , whose equation is
σ p = ε 1 ε 2 σ ( ε ) d ε / ( ε 2 ε 1 )
where σ ( ε ) is the function of the stress-strain curve, and ε 1 and ε 2 are the strains of two points in the platform section. (2) The modulus of the remaining material remained unchanged in the platform section. We measured σ ( ε ) in the uniaxial compression and PC tests to obtain CCF’s multiaxial loading mechanical behavior in the platform section. We also unloaded and reloaded multiple times during the PC test to measure the change of CCF modulus in the platform section. The reason for choosing the PC test instead of the UC test was that in the UC test, after the CCF entered the platform section, the side of the CCF would fall off, resulting in the loss of material in the loading direction, and the accurate platform stress could not be measured, while the groove restricted the specimen of PC test.
The maximum compressive failure stress and compressive modulus of CCF in the densification section proliferated with the increase of strain. Our study did not characterize the mechanical behavior of the densification section because the CCF would absorb the impact energy through continuous crushing during the impact process. The CCF would enter the densification section when wholly crushed in the thickness direction. Simplifying the mechanical behavior of the compaction section would not affect the influence of the simulation results.
Table 2 shows the test matrix of CCF, and Figure 5 shows the photograph of specimens. There were 42 CCF tests in total. The specimens used in this study were all derived from the same CCF blank, which has insufficient research, so further tests are needed to confirm our findings, such as tests with different processes or batches of CCF. All the tests were conducted on a hydraulic mechanics testing machine (Instron 8801, Instron, Norwood, MA, USA). The loading speed was 0.5 mm/min. It should be noted that the cell wall on the surface of the specimens needed to be completed, resulting in the surface strength being much smaller than the true strength of the CCF. Hence, the surface of the compression specimens needed to be pasted with a metal sheet, and the adhesive had to penetrate the specimens to a thickness of 0.5~1 mm to enhance the surface strength.
The gas inside the brittle foam was able to flow freely when the cell wall was crushed, unlike that inside the plastic foam, which remained in the cell wall and affected the mechanical properties. Coupled with the large modulus of the CCF skeleton material, the effect of the strain rate of the CCF on the mechanical properties under low-velocity impact could be negligible [12].

2.2.2. Tests for RPS and CPS

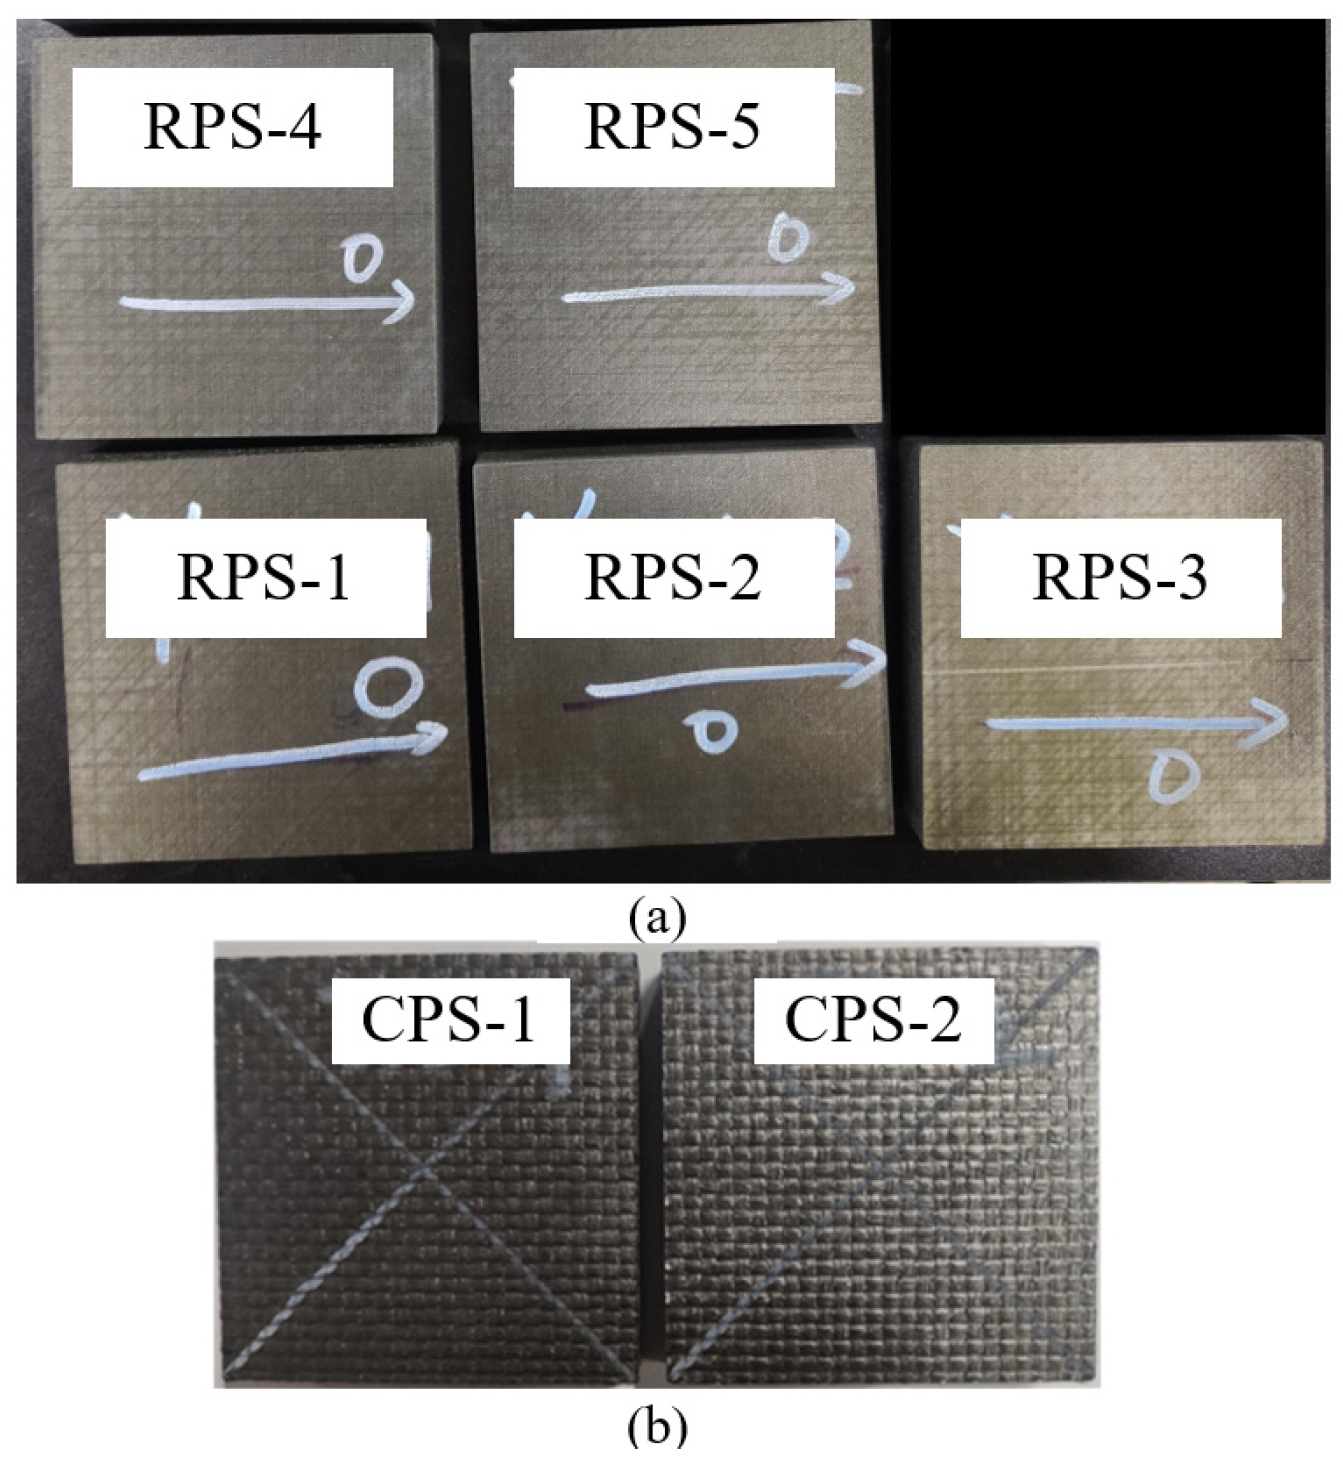
Low-velocity impact tests and quasi-static indentation tests were conducted to study the impact performance of RPS. During low-velocity impact, the effect of strain rate on the mechanical performance of CFRC and CCF could be negligible, so it was reasonable to replace the load-displacement curve of low-velocity impact tests with the load-displacement curve measured by quasi-static indentation tests. Due to the high cost of C/SiC, only two CPS specimens were prepared in this study, all of which were subjected to low-velocity impact tests. The test matrix in this section is shown in Table 3. The impact energy of RPS-1 and RPS-2 was 20 J, which could verify the repeatability of the experiment. The specimens for the two tests were the same, as shown in Figure 6, and the size was 100 × 100 mm2 (referenced ASTM D7766 [49]).
The experimental facility is shown in Figure 7. Two metal plates clamped the specimen with eight bolts, and the size of the hollow area in the middle of the metal plate was 80 × 80 mm2. The bolt was tightened by hand until the specimen could not shake freely in the tooling, avoiding excessive constraints on the free boundary conditions of the specimen. The lower metal plate was bonded to the test platform to prevent the specimen from bouncing during impact. The diameter of the impactor and indentator was 16 mm. The load sensor connected the impactor and the counterweight to collect load data. The total mass of the impactor, load sensor, and counterweight was 5.275 kg.

2.3. Simulations

2.3.1. Mechanical Constitutive Model of CCF

The stress-strain relation of the transverse isotropic CCF in the elastic section is
σ = C ε
where σ , ε , and C are the stress vector, strain vector, and stiffness matrix, respectively. We defined the z direction as the foaming direction. Therefore, the mechanical properties in the x and y directions were the same, and C could be expressed as
C = 1 Ω [ C x x C x y C x z 0 0 0 C y y C y z 0 0 0 C z z 0 0 0 Ω G x y 0 0 S y m Ω G y z 0 Ω G x z ] E x = E y ν x y = ν y x ν x z E x = ν z x E z C x x = E x ( 1 ν x z ν z x ) = C y y C x y = E x ( ν x y + ν x z ν z x ) C x z = E x ( ν x z + ν x y ν x z ) C y z = E x ( ν x z + ν x y ν x z ) C z z = E z ( 1 ν x y 2 )   Ω = 1 ν x y 2 2 ν x z ν z x 2 ν x y ν x z ν z x
There are currently no studies on multiaxial loading failure criteria and hardening rules of CCF. We referred to the characterization method of failure criteria of anisotropic reticulated vitreous carbon foam (RVC) by Gibson et al. [42] and proposed a modified characterization method for CCF. We placed the failure points of anisotropic CCF in the p ˜ q ˜ space, where p ˜ is the modified mean stress and q ˜ is the modified von Mises stress, which can be expressed as
p ˜ = 1 3 ( c x + c y + c z )
q ˜ = 1 2 ( c x c y ) 2 + ( c x c z ) 2 + ( c z c y ) 2 + c s ( c x y 2 + c x z 2 + c z y 2 )
c i = { σ i / S i c σ i 0 σ i / S i t σ i 0 i = x , y , z
c j = τ j / S j j = x y , y z , z x
where c s is the strength factor determining the proportion of normal and shear stress when CCF fails; this value cannot be obtained directly through tests, and its defining method will be described later.
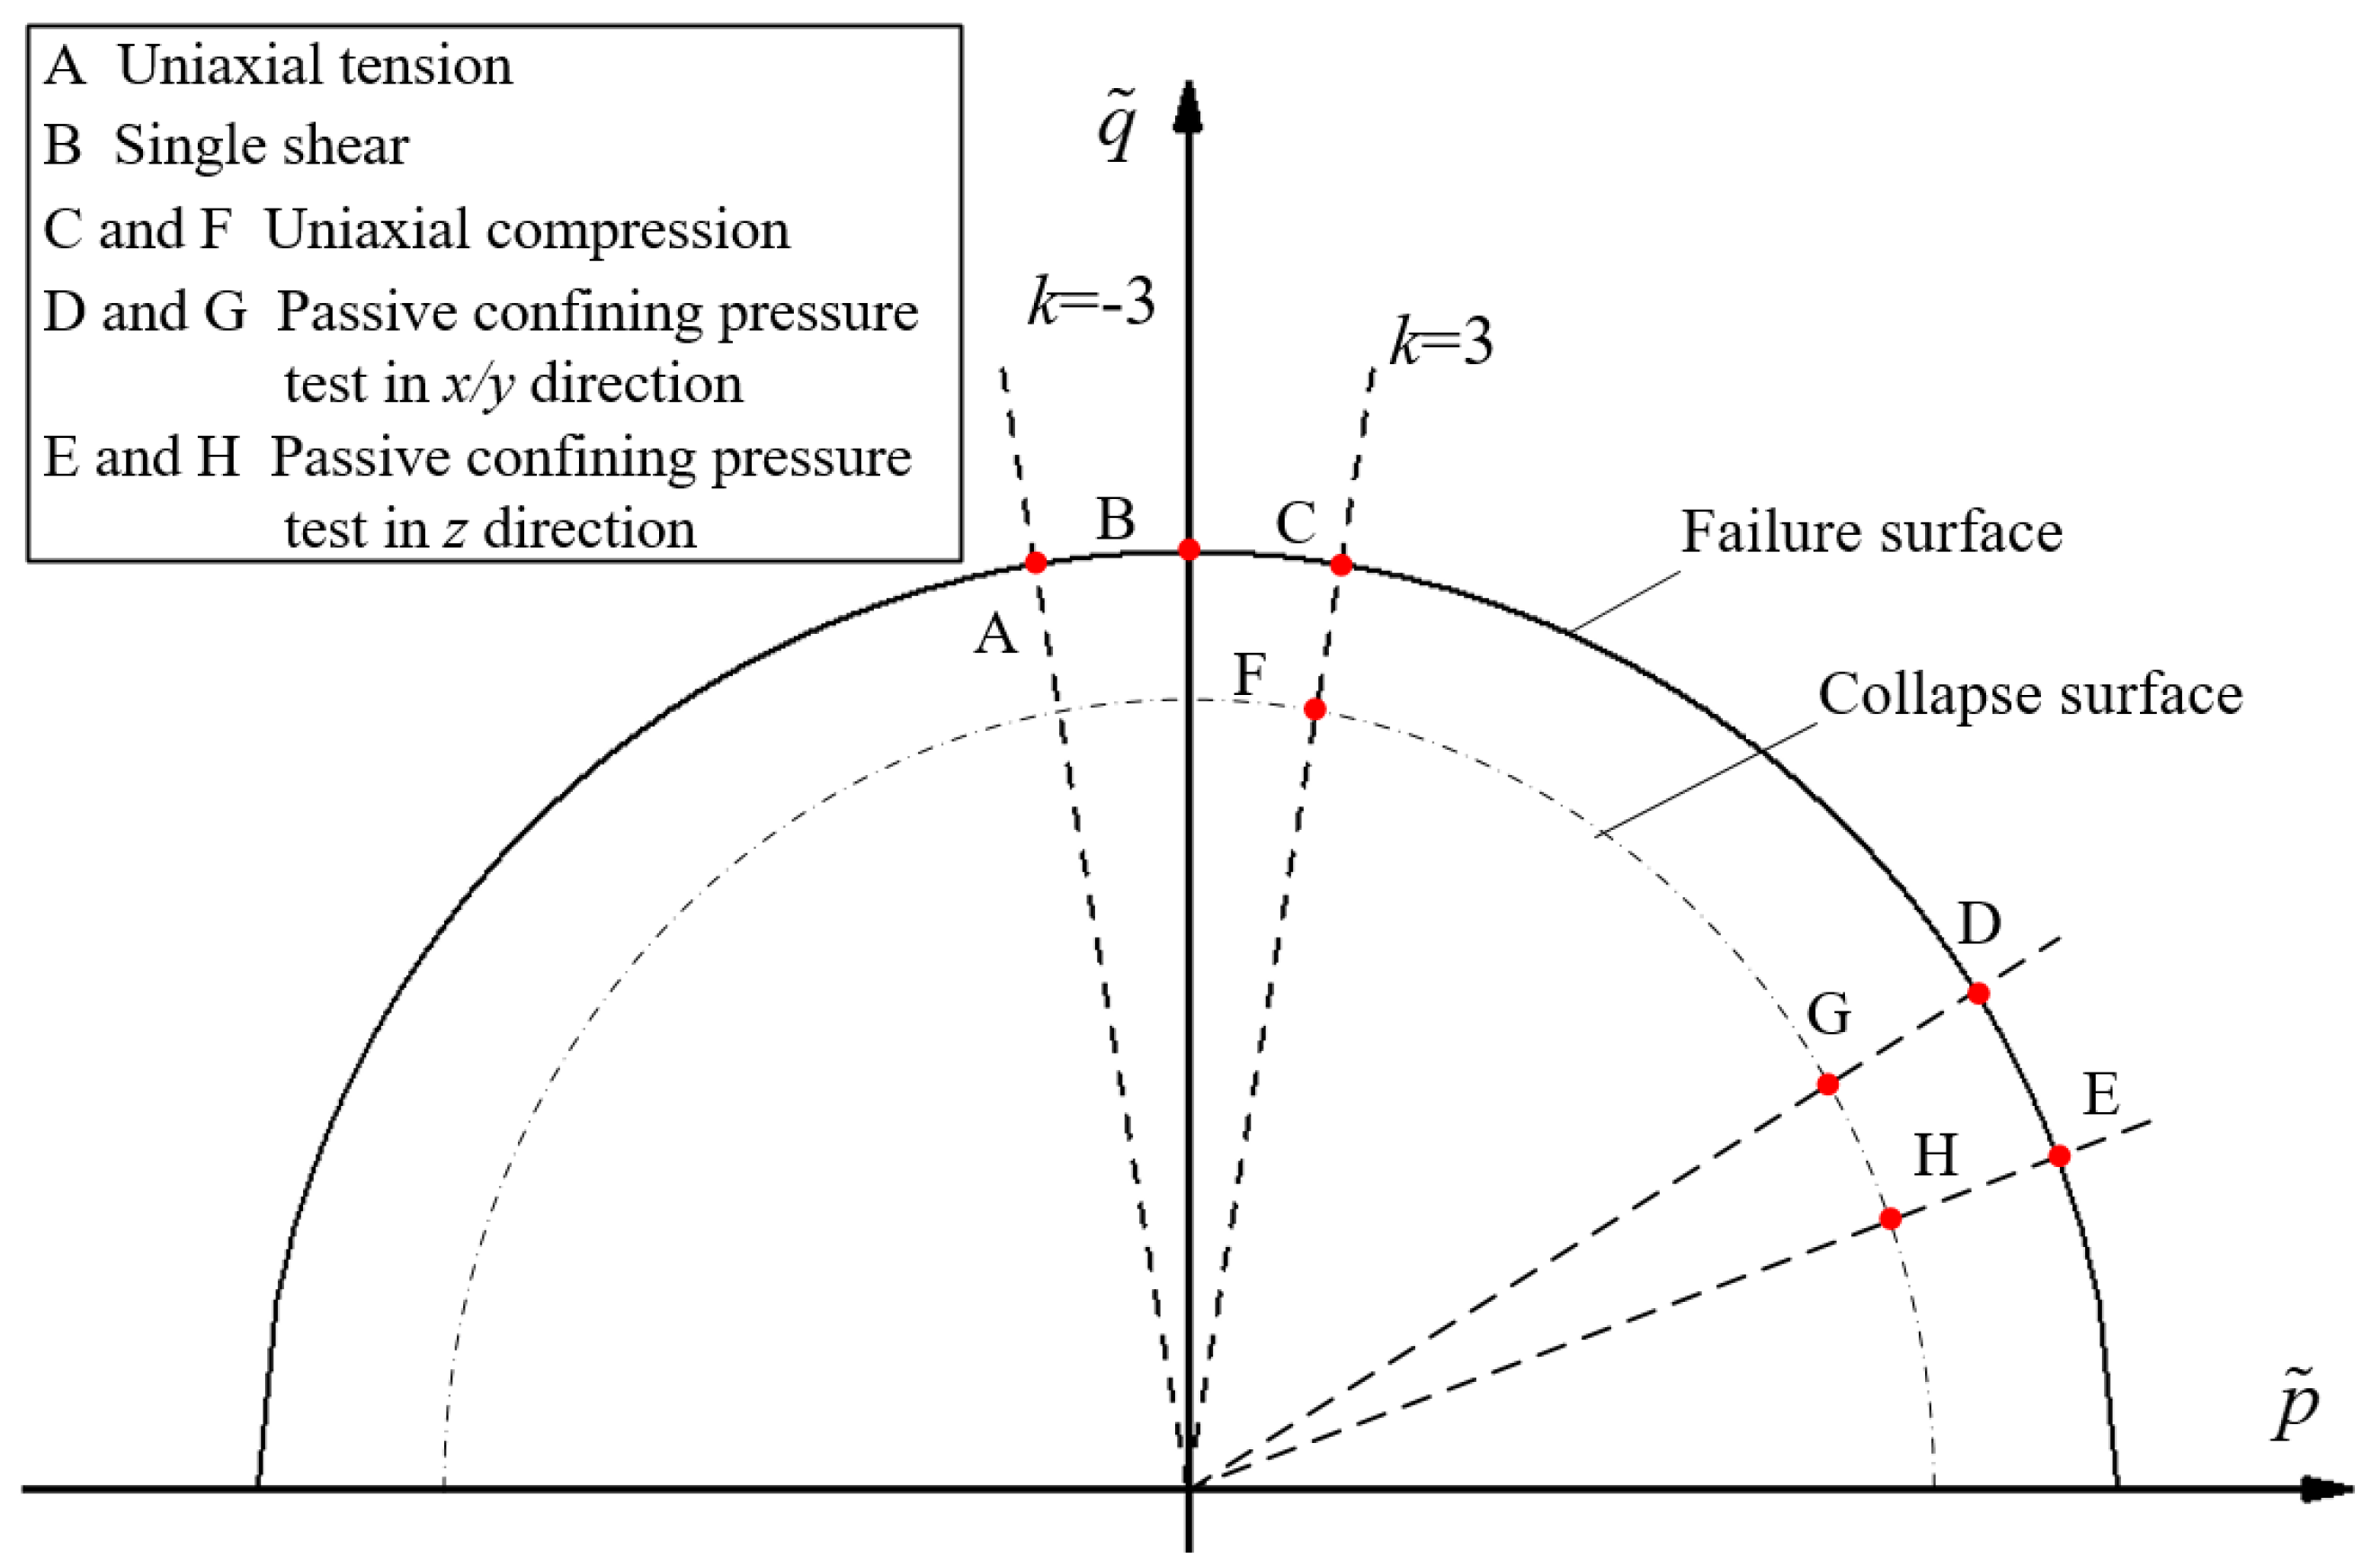
When the CCF was under uniaxial loading, the stresses in the non-loading direction were 0. In this case, q ˜ = 3 p ˜ (when p ˜ 0 ) and q ˜ = 3 p ˜ (when p ˜ < 0 ) are always established according to Equations (4)–(7), and their corresponding failure points are always (1/3, 1) or (−1/3, 1). When the CCF was under single shear loading, the normal stresses were 0 and shear stress was σ j . It had p ˜ = 0 and q ˜ = ( σ j / S j ) c s / 2 , and its corresponding failure point was ( 0 ,   c s / 2 ) . In conclusion, CCF’s failure surface in the p ˜ q ˜ space had to pass through the above three failure points. Gibson et al. [42] found that the failure surfaces of isotropic and anisotropic RVC had similar shapes, so we also phenomenally assumed that anisotropic and isotropic CCF had similar failure surfaces. CCF is a type of cellular foam, and the failure surface of isotropic cellular foam in p ˜ q ˜ space is semi-elliptical [43]. We also assumed that CCF in this study had a semi-elliptical failure surface. According to the three coordinate points above, the function of the failure surface is
q ˜ 2 = a p ˜ 2 a / 9 + 1 ,   c s = 2 2 a / 9
where a reflects the ellipticity of the failure surface; it can be obtained by fitting the failure points measured by PC tests, and then the value c s can also be obtained.
When the CCF failed under compressive loading, a damaged surface was generated inside the foam. As the loading continued, the foam collapsed at the damaged surface, and the CCF entered the platform section. The cell wall on the damaged surface was incomplete, resulting in the failure stress, which was the platform stress σ p , which was smaller than the strength of the complete cell wall. The collapse points in the platform section under different loading constituted the collapse surface, and its expression in the p ˜ q ˜ space was assumed to be
q ˜ 2 = b p ˜ 2 + c
where b and c are the shape parameter obtained by relevant test results; in summary, the relationship between mechanical test results and failure surface and collapse surface is shown in Figure 8.

2.3.2. Finite Element Models of RPS and CPS

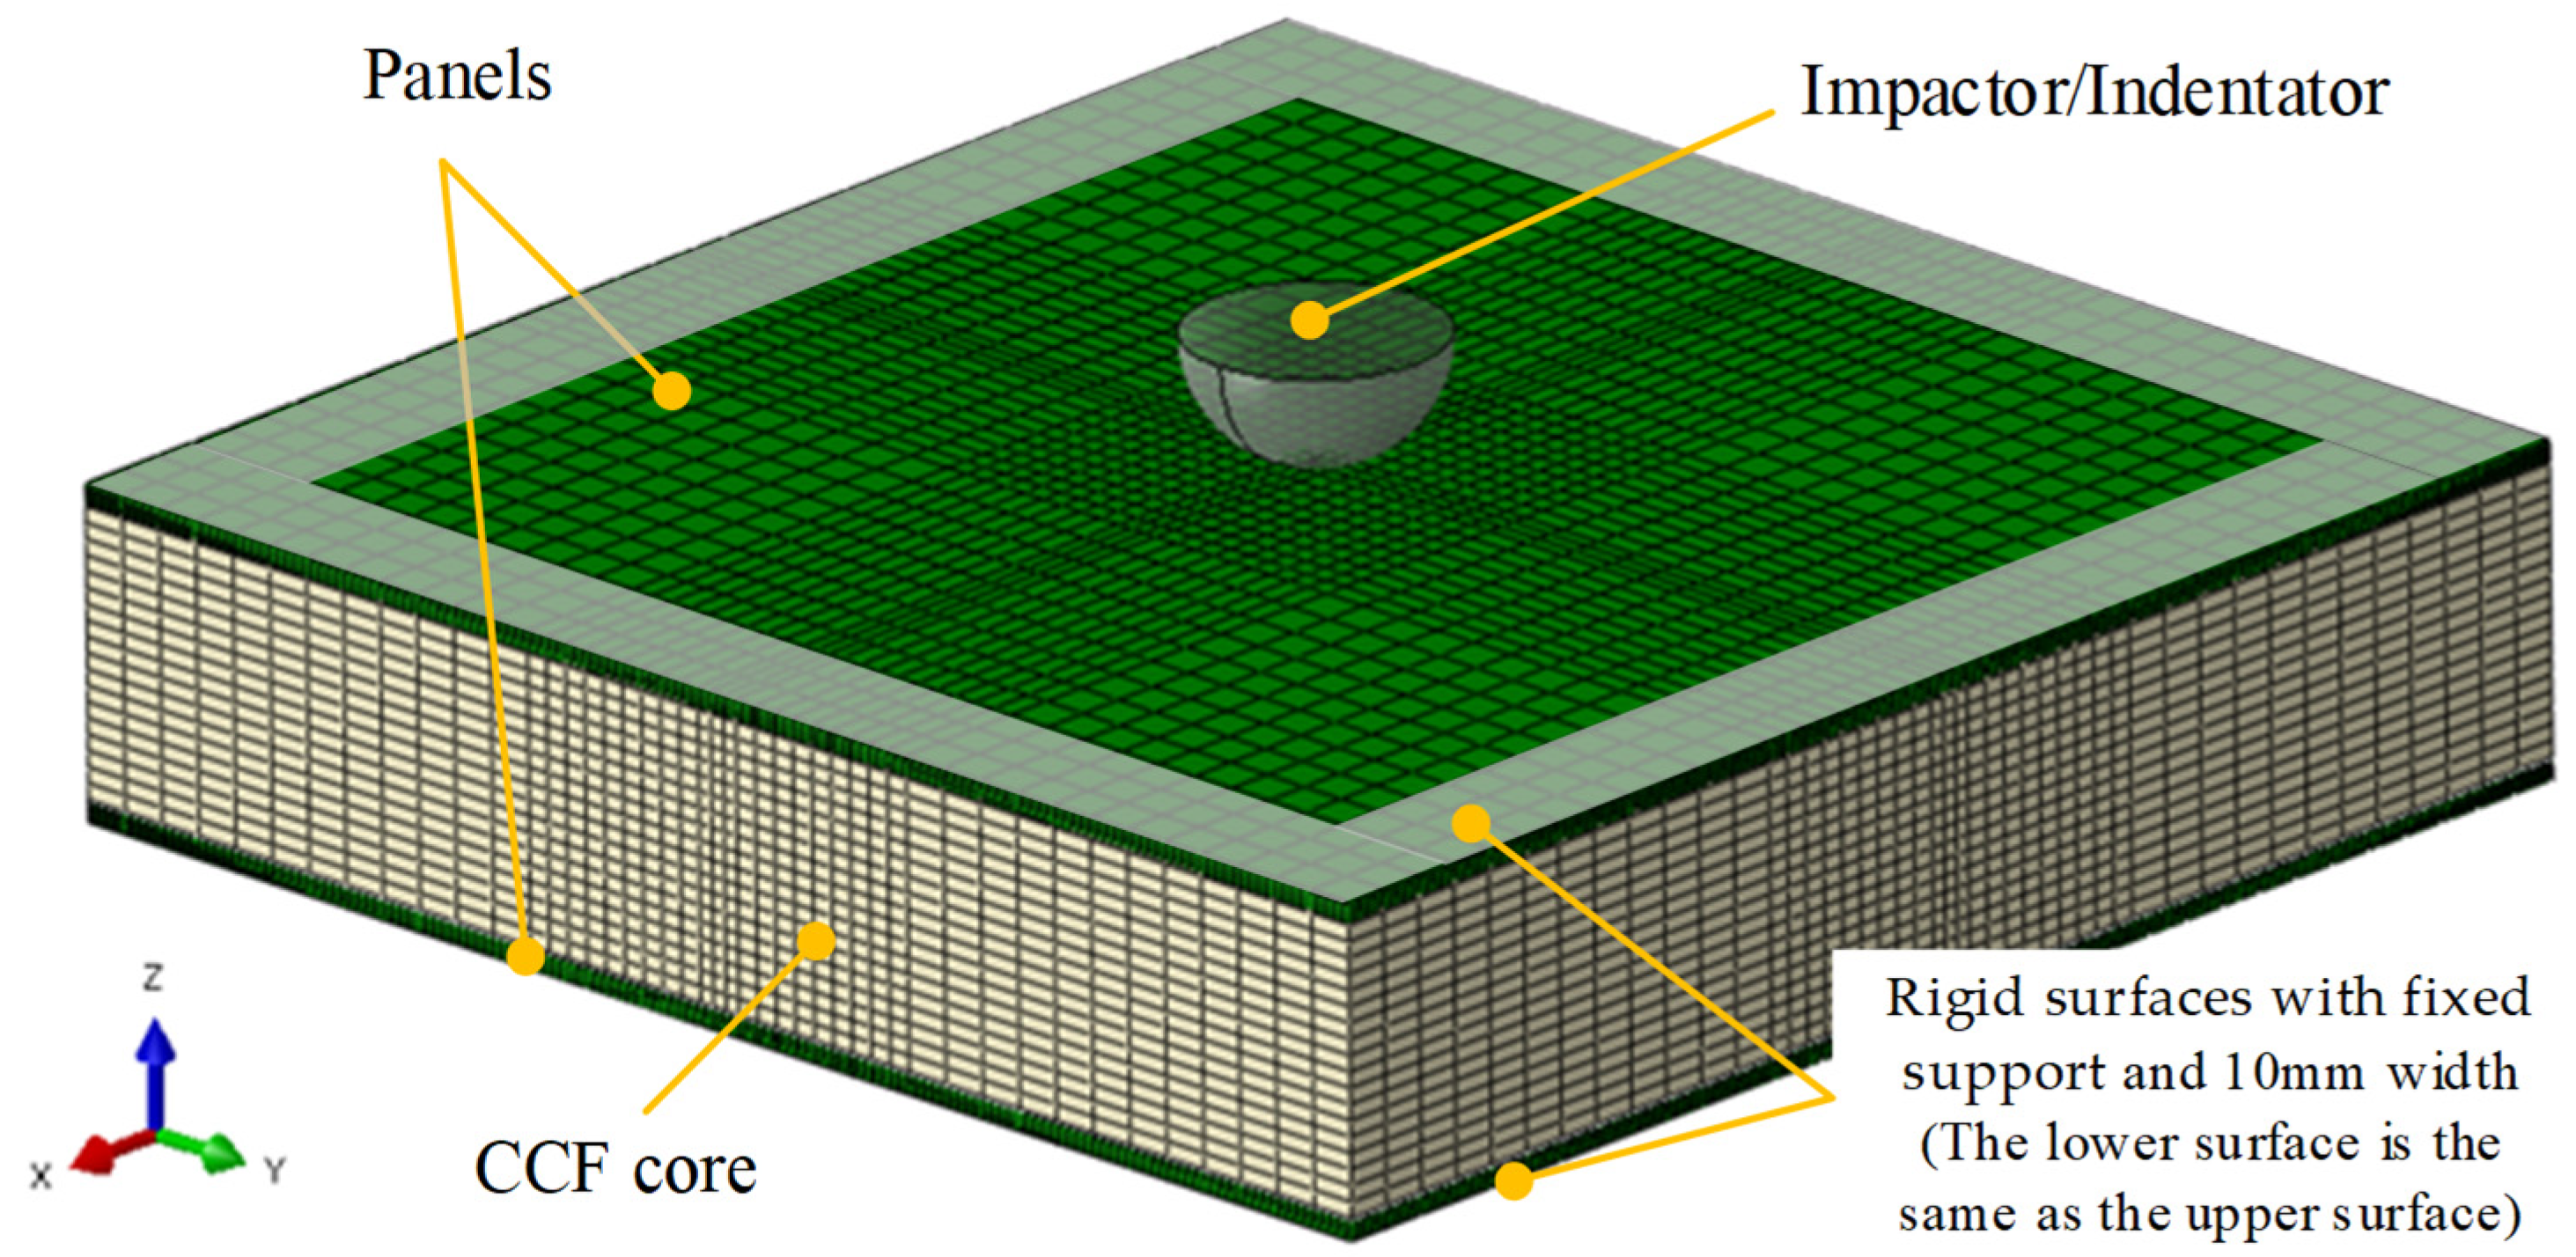
The low-velocity impact tests can only obtain the damage morphology and load curve of the specimens but cannot measure their damage process, which makes it difficult to analyze the damage mechanism, but the FEM with sufficient accuracy can simulate this process. We used the commercial finite element software Abaqus to simulate the low-velocity impact and quasi-static indentation tests. The FEM is shown in Figure 9. The models of the two tests differed only in how the load was applied. The other settings were the same.
We directly defined the material properties of the panel and core through the VUMAT subroutine. The panel was made of fiber-reinforced composite material, and its continuous damage model was fully studied so that we directly used the method that Zhang et al. [50] proposed to define the mechanical properties of the panel. The CCF constitutive model was obtained from the tests discussed later in this paper, and the VUMAT subroutine of CCF was compiled with reference to the Abaqus modeling method for isotropic foam [51].
Eight-node brick element (C3D8R) was used in the whole model, while the stiffness-based hourglass control was used in the CCF core to prevent an hourglass issue in large deformation. From the central region to the edge region, the mesh size was 0.77 mm × 0.77 mm, 1.54 mm × 1.54 mm, and 3.33 mm × 3.33 mm, respectively. In the test, the interface between the panels and the core was not damaged, so the elements at the junction of the panels and the core were set as common nodes. Due to the small pre-tightening force of the bolts, the extrusion effect of the metal plate on the specimens could be ignored. The two metal plates had enough rigidity to limit the z direction displacement of the specimens, so the metal plates could be simulated by the rigid surfaces with fixed support, and a contact pair was set between the metal plates and the panels.
In the FEM of low-velocity impact test, an initial velocity was applied to the impactor, which was calculated according to the impact energy. In the FEM of quasi-static indentation test, a displacement constraint was imposed on the indentator to move downward at a speed of 1 mm/min.

3. Results and Discussions

3.1. Results and Discussion of Tests for CCF

3.1.1. Basic Mechanical Properties

The mechanical test results are shown in Figure 10. It can be seen that the mechanical properties in the elastic section were linear elastic. Therefore, the strengths were equal to the value of the maximum stresses in the elastic section, and the modulus was equal to the slopes in the elastic section. The CCF had no yielding behavior before failure, indicating that CCF could be regarded as a fully brittle material. During the uniaxial compression test, the lateral deformation of the specimen was also measured so that the Poisson’s ratio of CCF could be obtained. The basic mechanical properties of CCF calculated from the curves are listed in Table 4 and Table 5.
The modulus in the x direction is 2.57% larger than that in the y direction and 35.3% smaller than that in the z direction. The tensile strength in the x direction is 7.8% smaller than that in the y direction and 32.2% smaller than that in the z direction. The compressive strength in the x direction is 2.22% larger than that in the y direction and 55.7% smaller than that in the z direction. In summary, the mechanical properties of CCF in the x and y directions have little difference and can be approximately equal. The mechanical properties in the z direction are much larger than those in other directions. The conclusions above show that it is reasonable to regard CCF as a transversely isotropic foam.

3.1.2. Multiaxial Loading Failure Criteria

Table 6 shows the stresses when CCF fails in PC tests. The stresses reacted by the steel groove were calculated by the following equations. When the z direction was under loading, the x and y directions deflections were 0. It followed
σ x = σ y = ν z x σ z / ( 1 ν x y ) ( E x / E z ) 2
where σ z was measured by the testing machine when the x direction was under loading, and the deflections in the z and y directions were 0. It followed
σ y = ( ν x y + E x ν z x 2 / E z ) σ x / ( 1 E x ν z x 2 / E z ) σ z = ( E x v z x ( 1 + ν x y ) / E z ) σ x / ( 1 E x ν z x 2 / E z )
where σ x was measured by the testing machine; since the mechanical properties in the x and y directions were similar, the test loaded in the y direction had similar equations to the test loaded in the x direction.
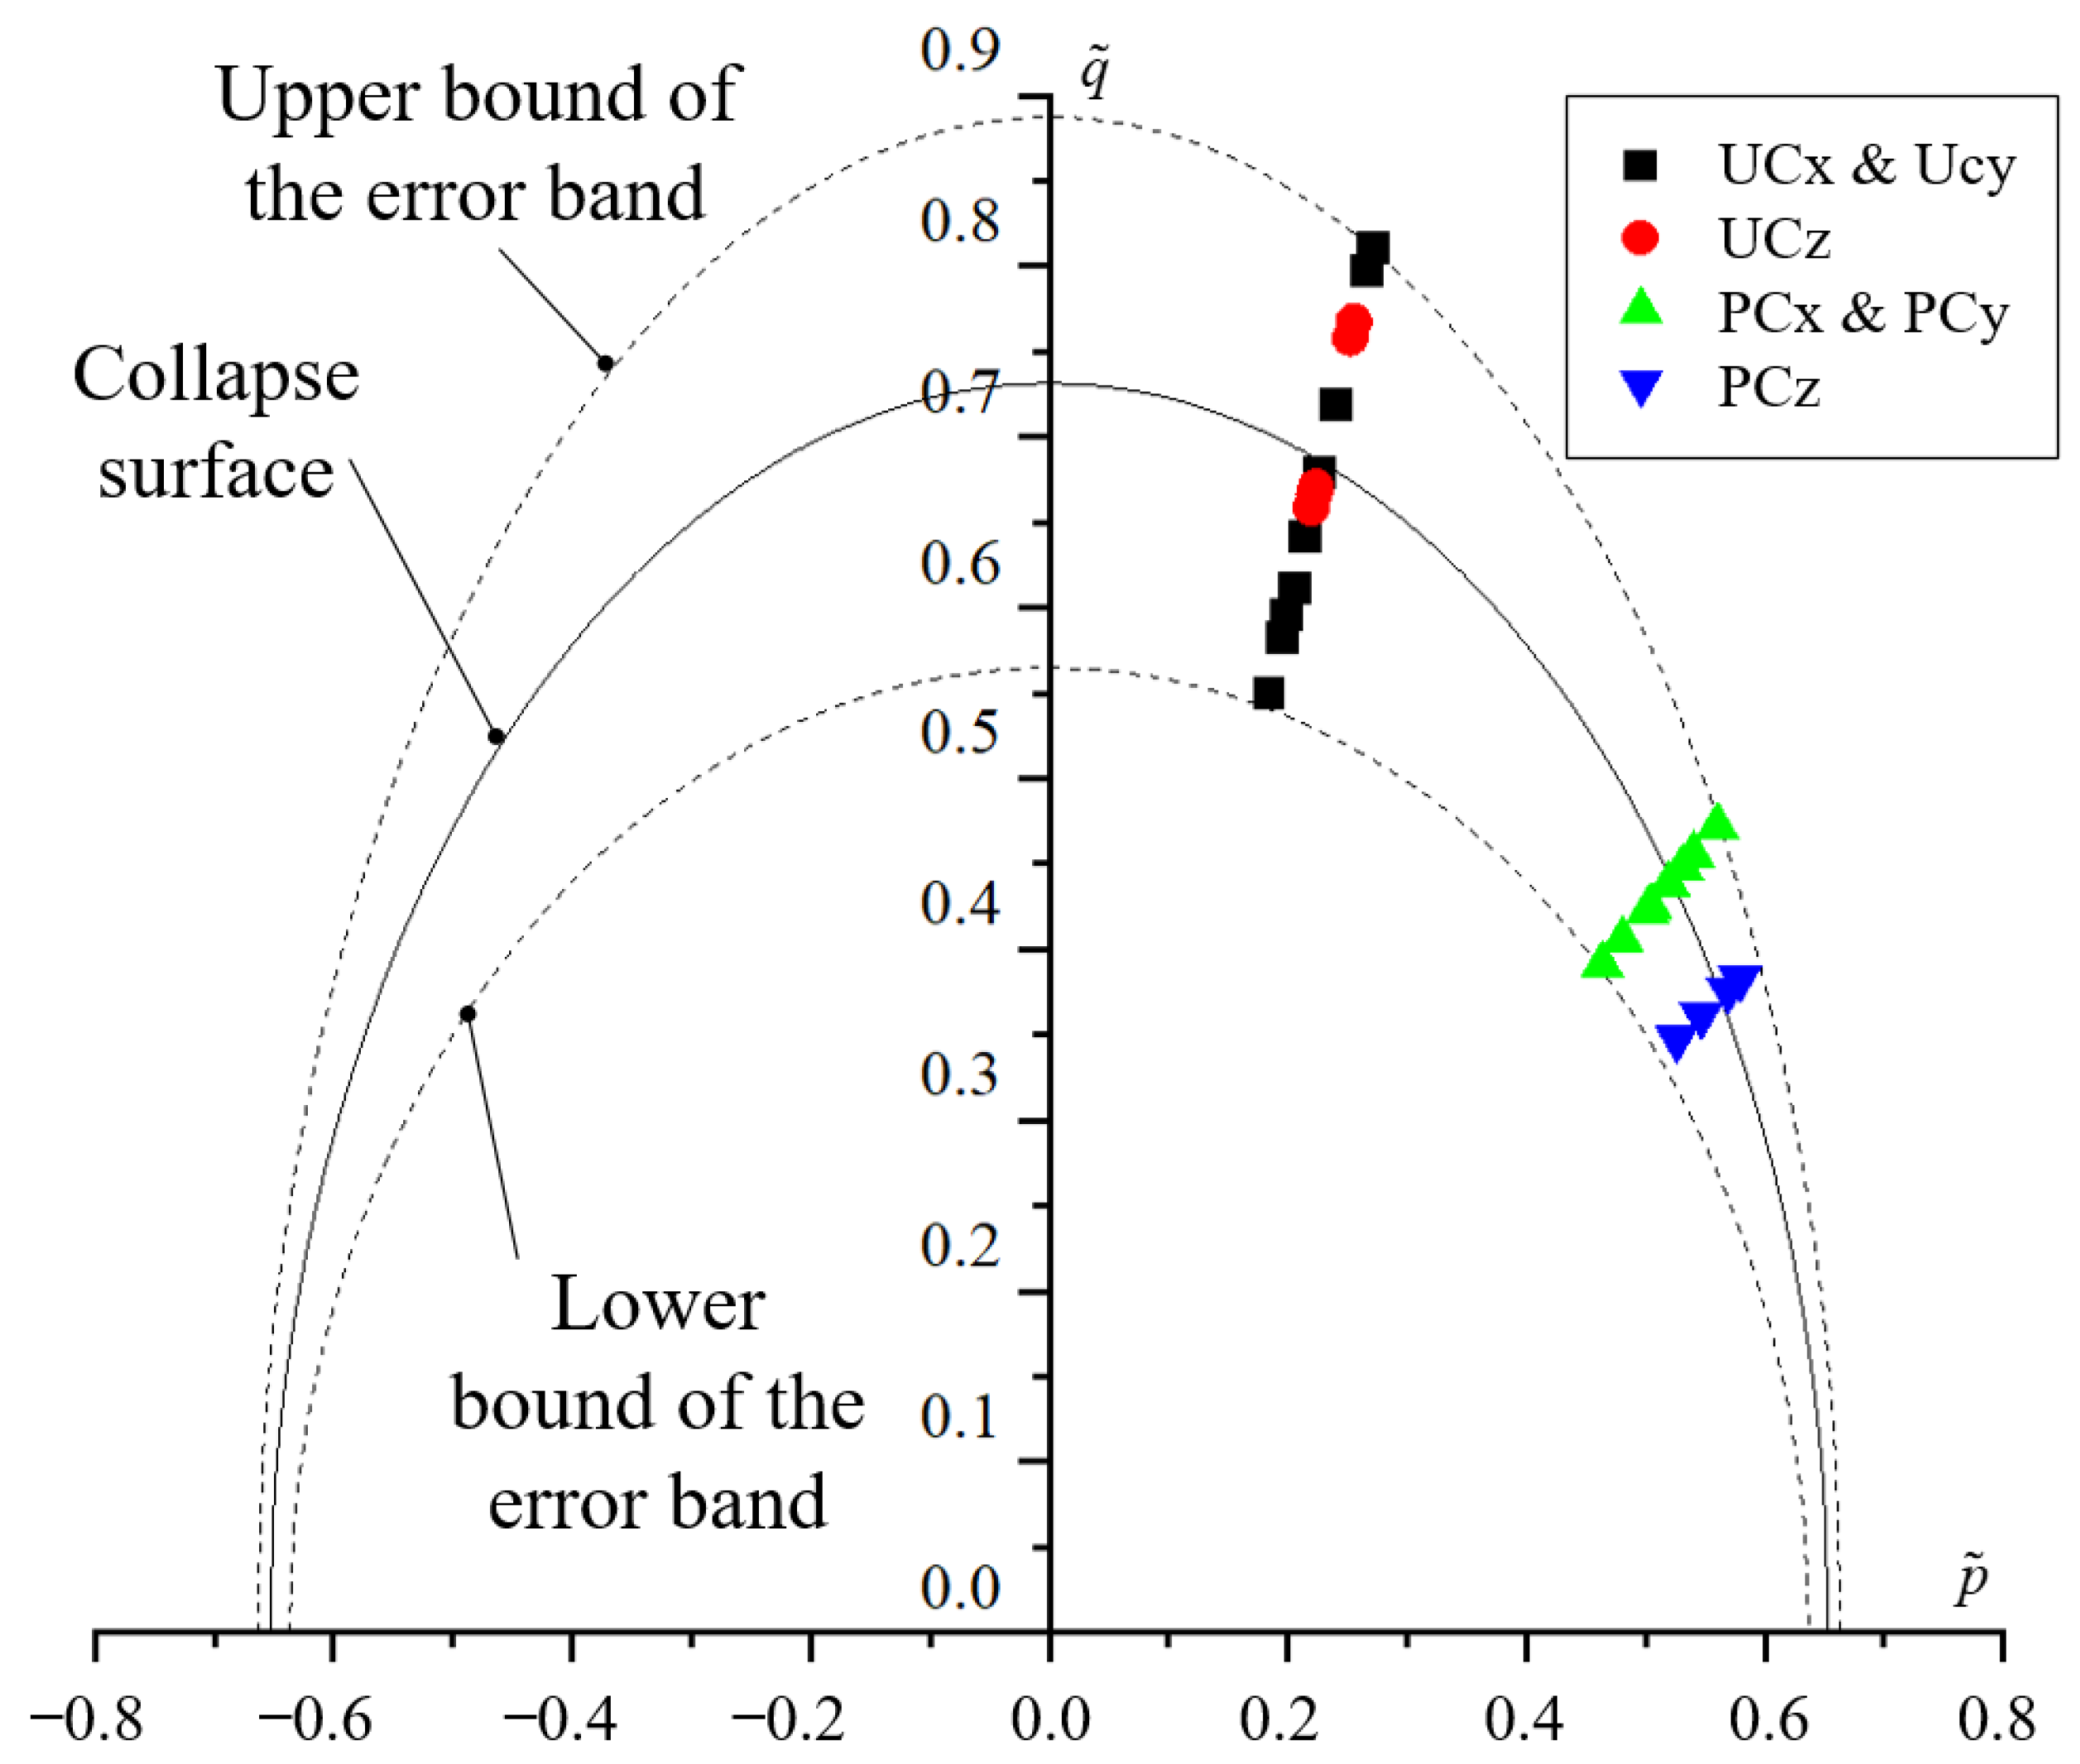
So far, all the parameters in Equations (4)–(7) had been obtained, except c s . Nevertheless, the shear stresses in UT, UC, and PC tests were all 0, which means that the c s value had no influence on the calculation of the failure points’ coordinates of the above tests in p ˜ q ˜ space, according to Equation (5). Therefore, the failure points’ coordinates we calculated are listed in Table 7 and were marked in the p ˜ q ˜ coordinate system as shown in Figure 11. We were able to obtain the functional equations of the failure surface of CCF and its error band by fitting these failure points. The failure surface of CCF is
q ˜ 2 = 1.472 p ˜ 2 + 1.164
The upper bound of the error band is
q ˜ 2 = 1.577 p ˜ 2 + 1.585
The lower bound of the error band is
q ˜ 2 = 1.297 p ˜ 2 + 0.813
It can be seen from Equation (12) that a = 1.472 . Further, we calculated c s = 2.328 according to Equation (8). So far, we obtained the complete Equation (5), which could calculate the CCF failure points where the shear stress was not 0. The failure points’ coordinates of the SS test are listed in Table 7 and displayed in Figure 11. These points are also within the error band, which shows that the failure criteria we obtained based on the normal stress tests can be used to predict the failure of CCF in the single shear loading.
Equations (12)–(14) have great significance in predicting the p ˜ q ˜ point of CCF when it is damaged under multiaxial loading. Equation (12) predicts the average value of these p ˜ q ˜ points, while Equations (13) and (14) predict the distribution of these points. The main reason for the dispersion of these p ˜ q ˜ points was the inhomogeneity of the internal pores of CCF. During the low-velocity impact, a large area of CCF was destroyed. Even though the mechanical properties of CCFs were not uniform, their influence on the impact curve was determined mainly by their average value. Therefore, Equation (12) should be used in low-velocity impact FEMs. In other applications, such as when CCF is used as a sandwich beam core material, in order to ensure structural safety, Equation (14) should be used to predict the initial damage of CCF.

3.1.3. Hardening Rules

In the UC and PC tests, CCF entered the platform section, and the platform stress could be obtained according to Equation (1). As for the PC test, the stresses reacted by the steel groove were also calculated by Equations (10) and (11). The platform stresses of the UC test are listed in Table 8. The platform stresses and non-loading direction stresses of the PC test are listed in Table 9. The collapse points’ coordinates of UC and PC tests are listed in Table 10 and displayed in Figure 12. By fitting these collapse points, we were able to obtain the functional equations of the collapse surface of CCF and its error band. The collapse surface of CCF is
q ˜ 2 = 1.25 p ˜ 2 + 0.535
The upper bound of the error band is
q ˜ 2 = 1.779 p ˜ 2 + 0.787
The lower bound of the error band is
q ˜ 2 = 0.785 p ˜ 2 + 0.319
It can be seen from Equation (15) that b = −1.250 and c = 0.535.
Equations (15)–(17) have great significance in predicting the p ˜ q ˜ point of CCF when it collapses. Equation (15) predicts the average value of these points, while Equations (16) and (17) predict the distribution of these points. Equation (15) has higher application value and was used for FEMs in this paper because the ability of CCF to absorb impact energy depends on its average mechanical properties.
We selected one specimen of the PC test from each direction for the unloading and reloading test. The stress-true strain curves are shown in Figure 13, and the slopes of the reloading curve are listed in Table 11. The difference among several slopes was minimal, so it can be considered that the modulus of CCF remained unchanged in the platform section.

3.2. Results and Discussion of Tests and Simulations of RPS and CPS

3.2.1. Low-Velocity Impact Tests and Simulations of RPS

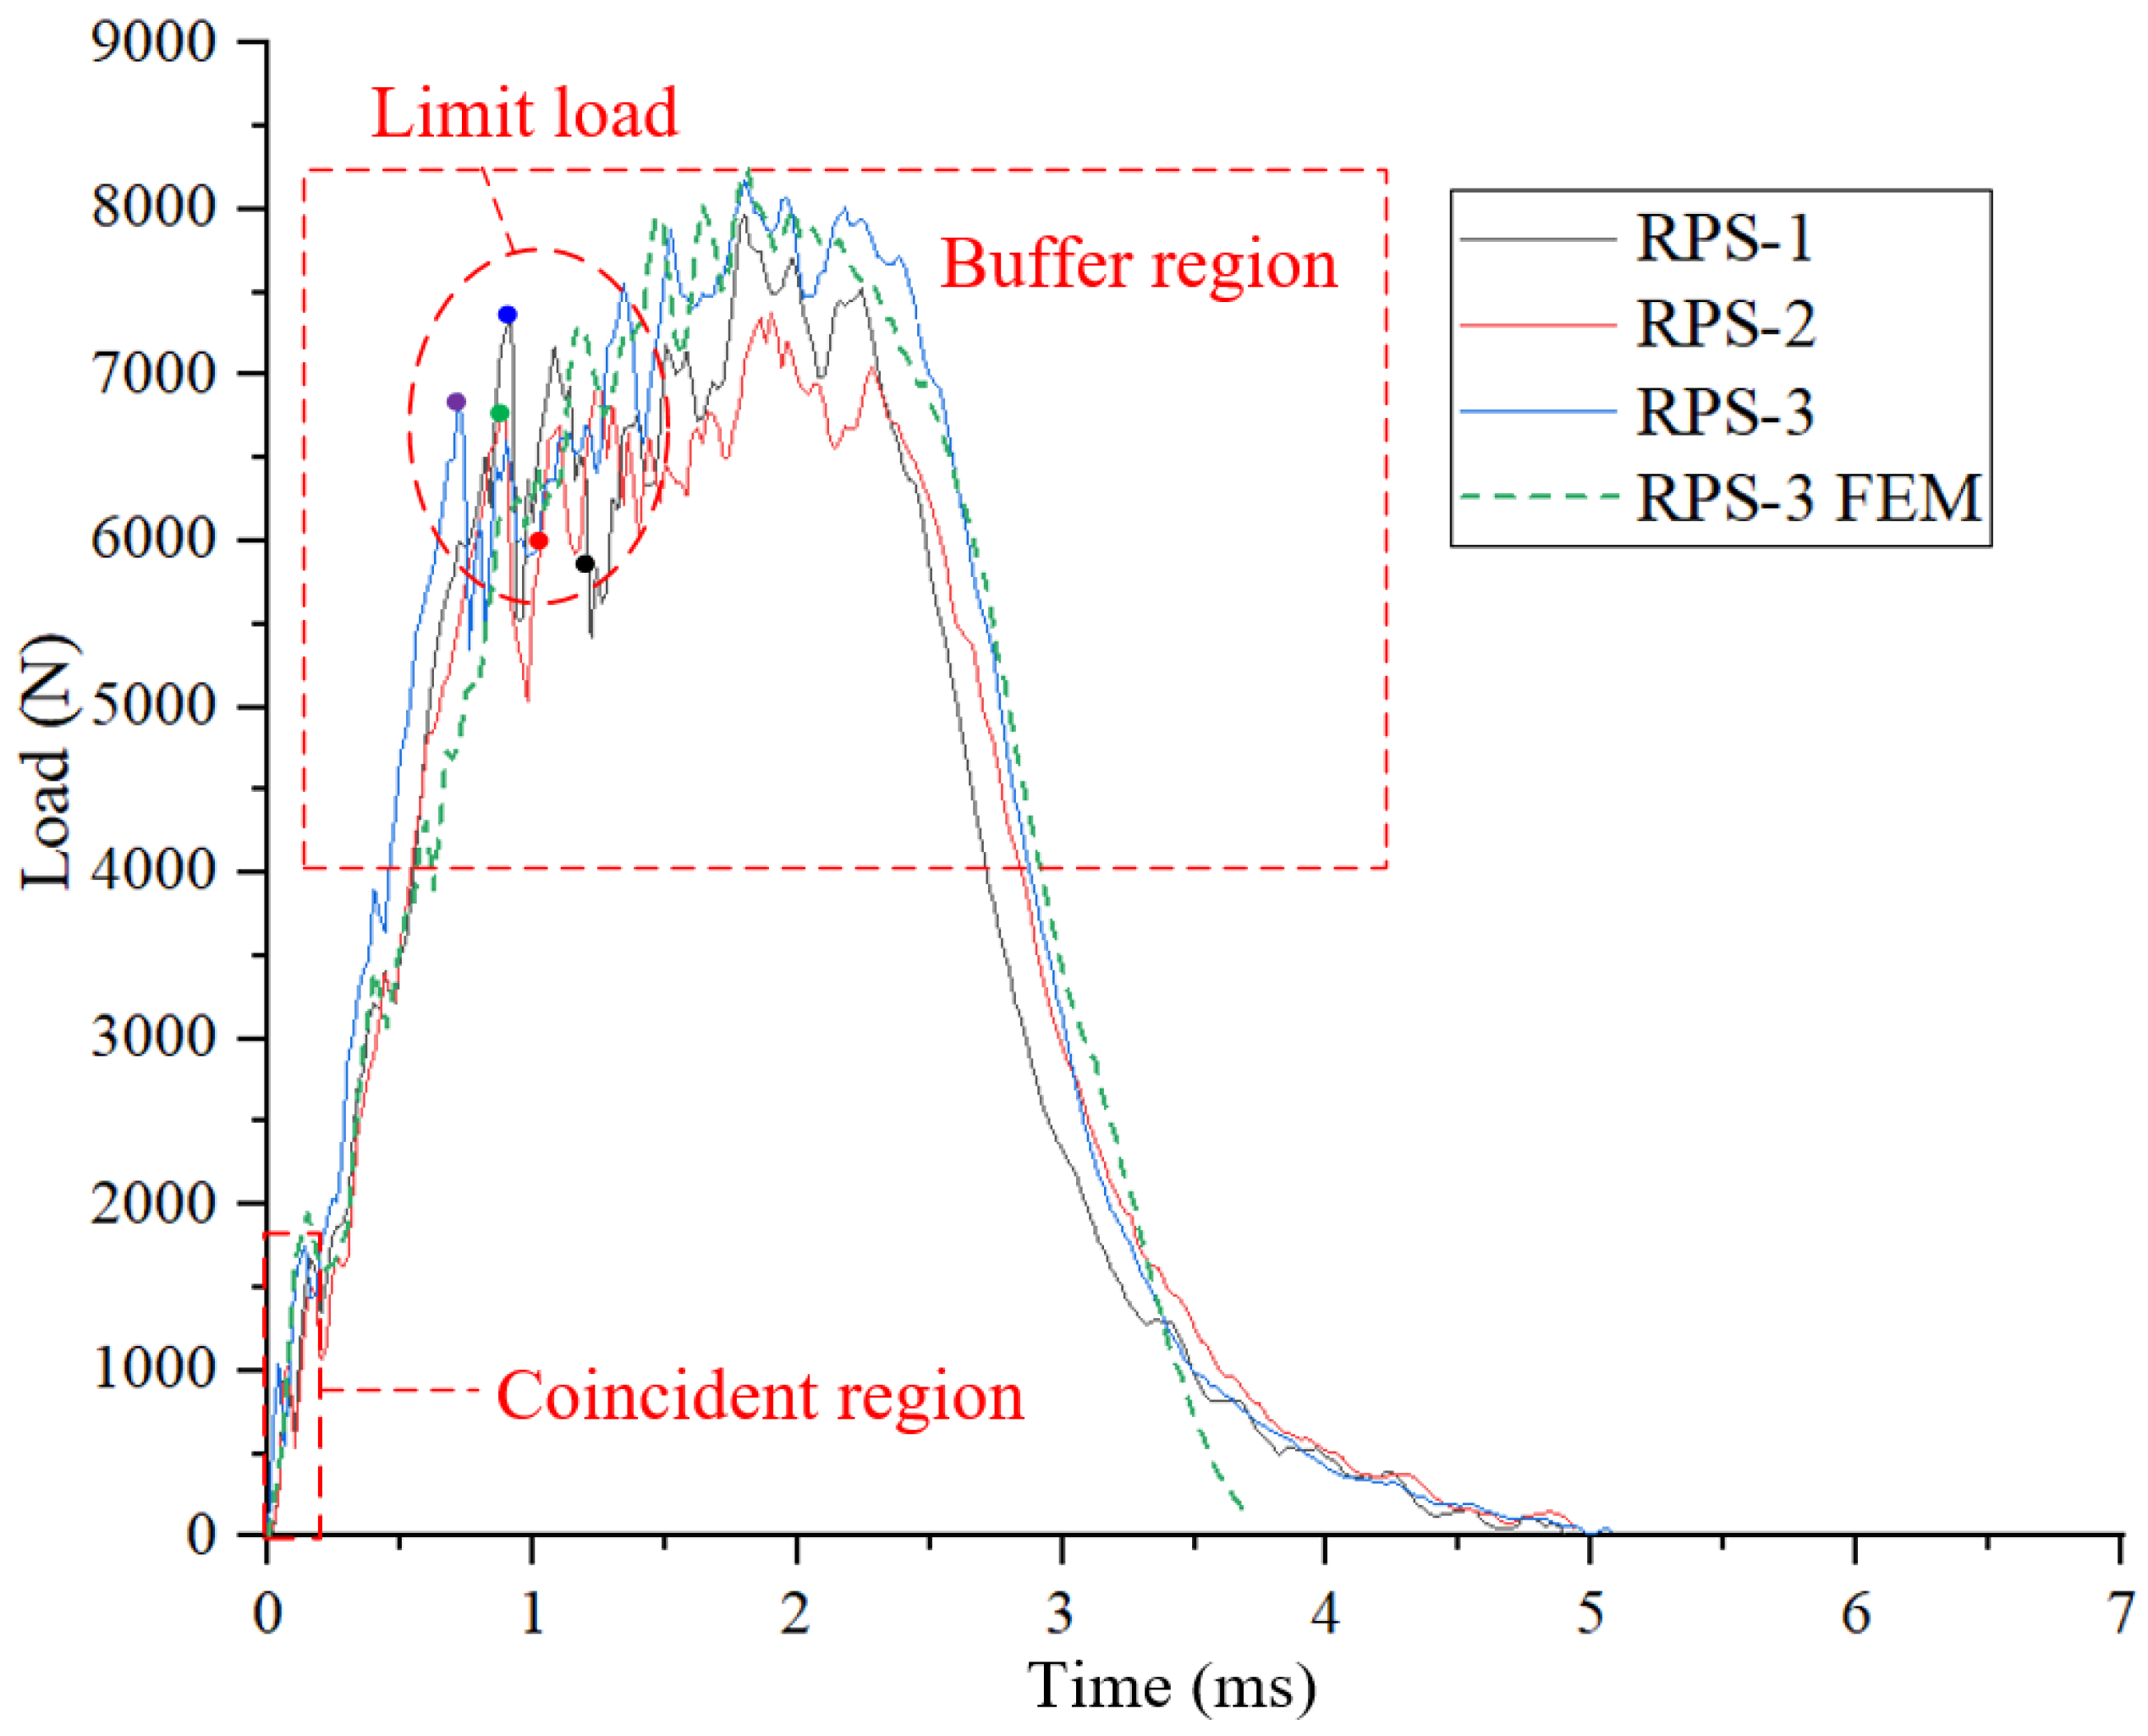
The load-time curves of the RPS low-velocity impact test are shown in Figure 14, from which it can be seen that the curves of RPS-1 and RPS-2 with the same impact energy almost coincided before reaching the limit load, indicating that the consistency of the tests was good. The curves have the following characteristics: (1) All the curves are approximately coincident at the beginning, and the panels and cores are not damaged in the coincident region. (2) After the coincident region, the specimen starts to become damaged, and higher impact energies lead to steeper curve slopes before limit loads are reached. (3) After reaching the limit load, the load enters the buffer zone, and the maximum load oscillates within a specific range. The sandwich structure at this stage absorbs impact energy through CCF crushing, while its modulus and platform stress remain almost unchanged. (4) The impactor rebounds, and the load decreases. The results of FEM are in good agreement with the test results of RPS-3 and can effectively simulate the limit load of RPS and the curve in the buffer region.
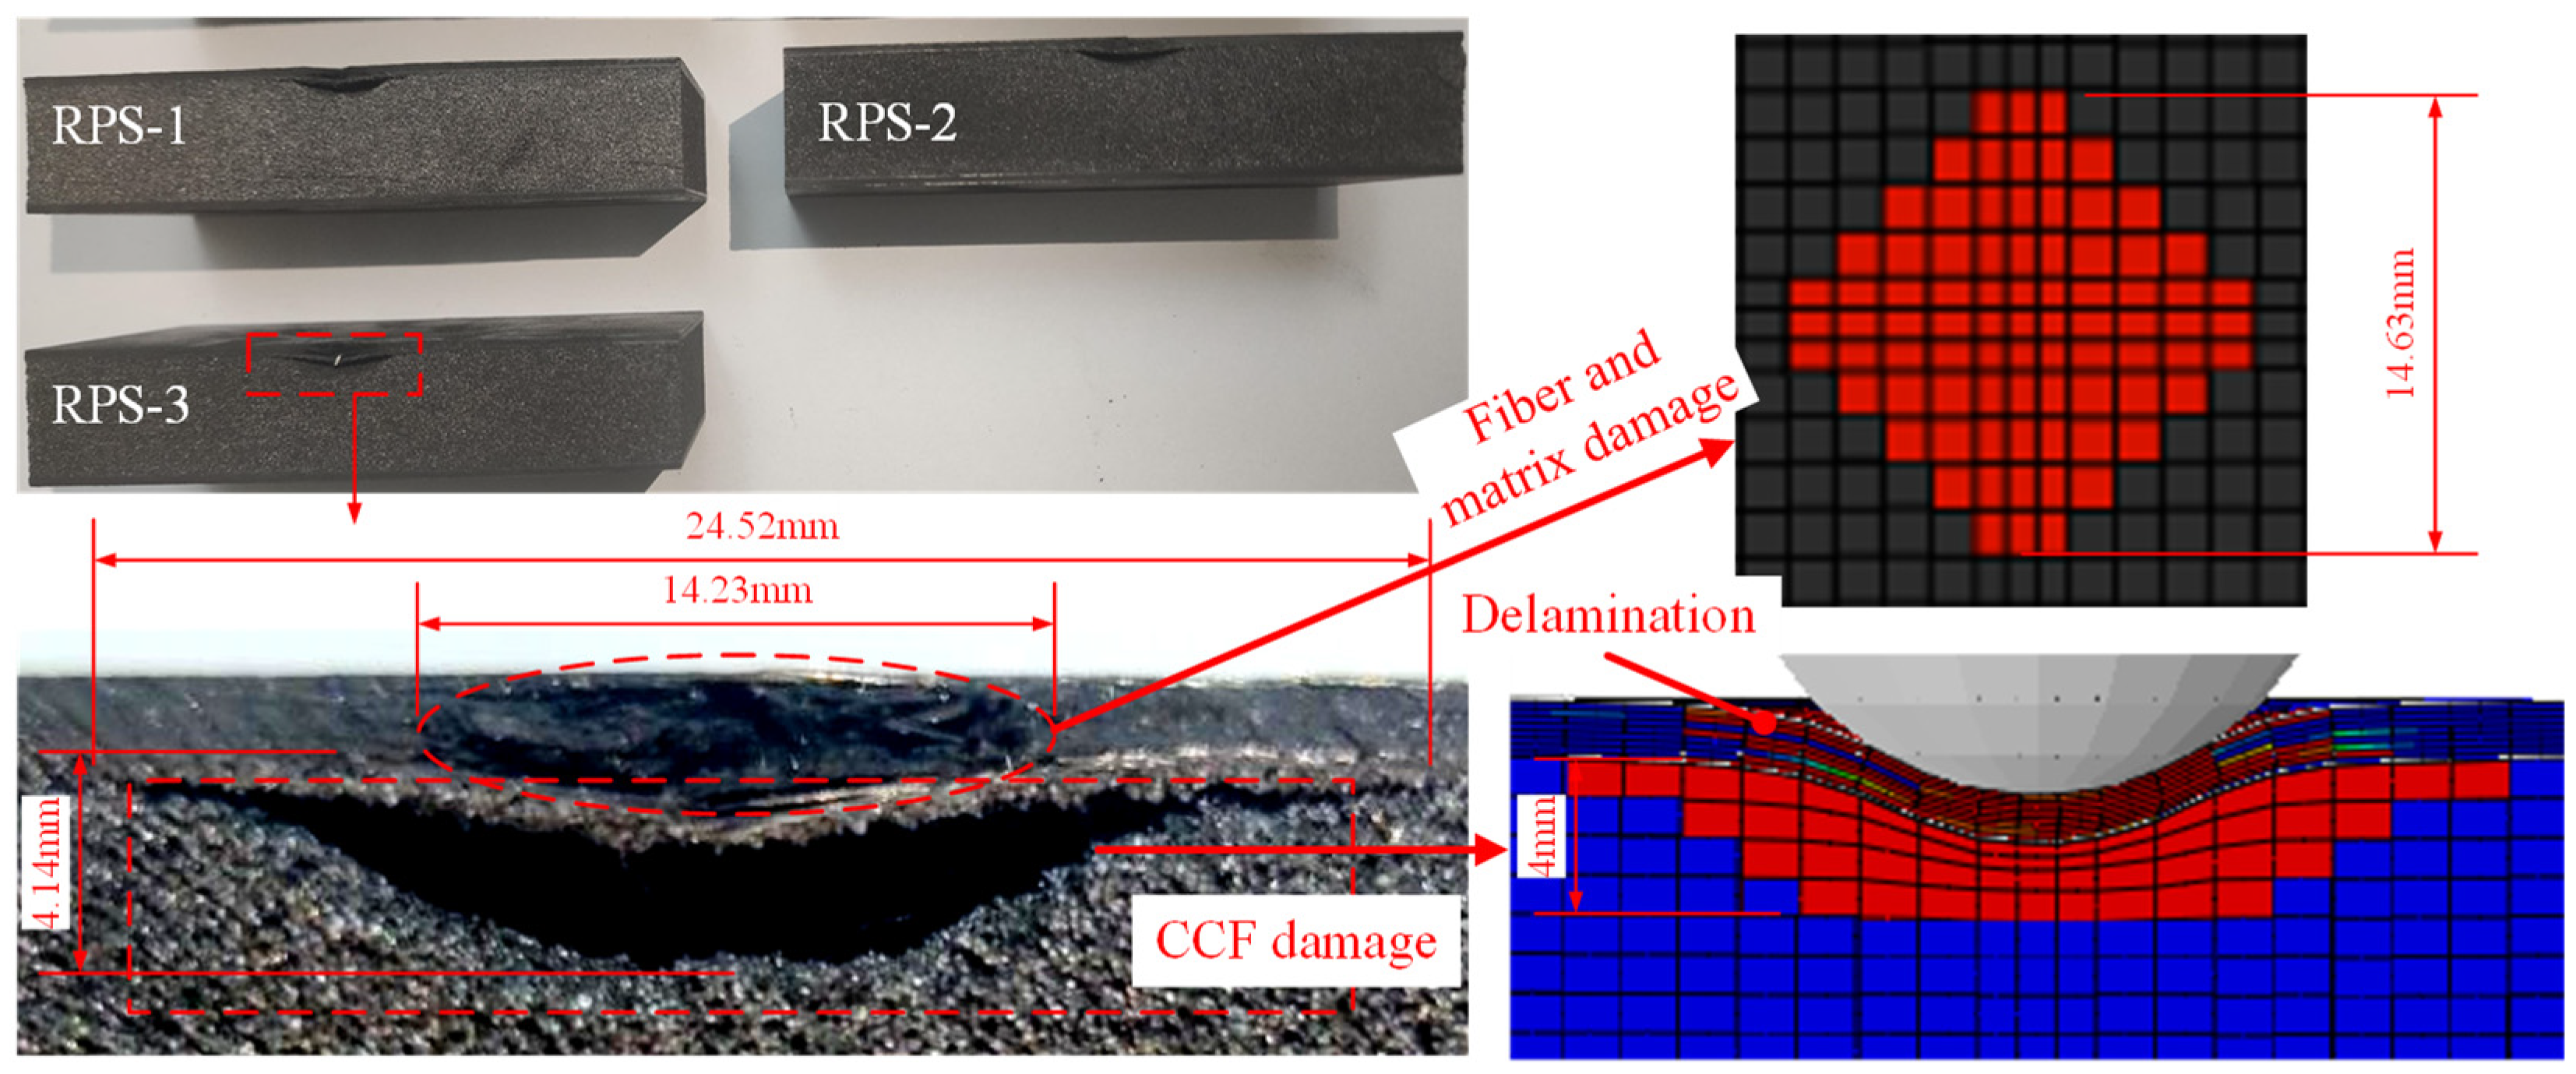
The sections of the RPS low-velocity specimens cut along the center line are shown in Figure 15. The perspective of cross-sectional damage morphology shows that the test results have a good consistency. Local matrix cracking and fiber breakage occurred at the position where the panel contacted the impactor. The damage on the foam was a “D”-shaped indentation. The crushing depth in the center of the indentation was relatively large and extremely small at the edge. The parameters of the curves and indentation of the RPS low-velocity impact test are shown in Table 12. Figure 15 shows the damage morphology simulation results of the maximum impact energy test (RPS-3). It can be seen that the panel damage under the impactor was mainly a fiber and matrix fracture. The panel damage near the impactor was difficult to obtain from the specimen section, but a large amount of delamination damage can be seen in the FEM results. The area of delamination damage was much larger than the area of the fiber and matrix fracture. The calculated indentation diameter was 15 mm, 5.13% larger than the experimentally measured 14.23 mm. The calculated indentation depth was 4 mm, 3.50% smaller than the experimentally measured 4.14 mm. The calculation errors of these two critical damage characteristic parameters were all within the acceptable range, which further verified the model’s accuracy.
The CCF in the specimen’s damage area was broken into powder. However, the elements of CCF in the FEM produced a large deformation, which made it look like the yield deformation of plastic materials. This is because it was difficult to simulate the process of brittle CCF breaking into powder in the FEM, and it was more convenient to model CCF as a plastic foam with the same stress-strain curve. Hence, the region where the CCF produced plastic strain in the FEM corresponds to the region where the actual collapse occurred.

3.2.2. Quasi-Static Indentation Tests and Simulations of RPS

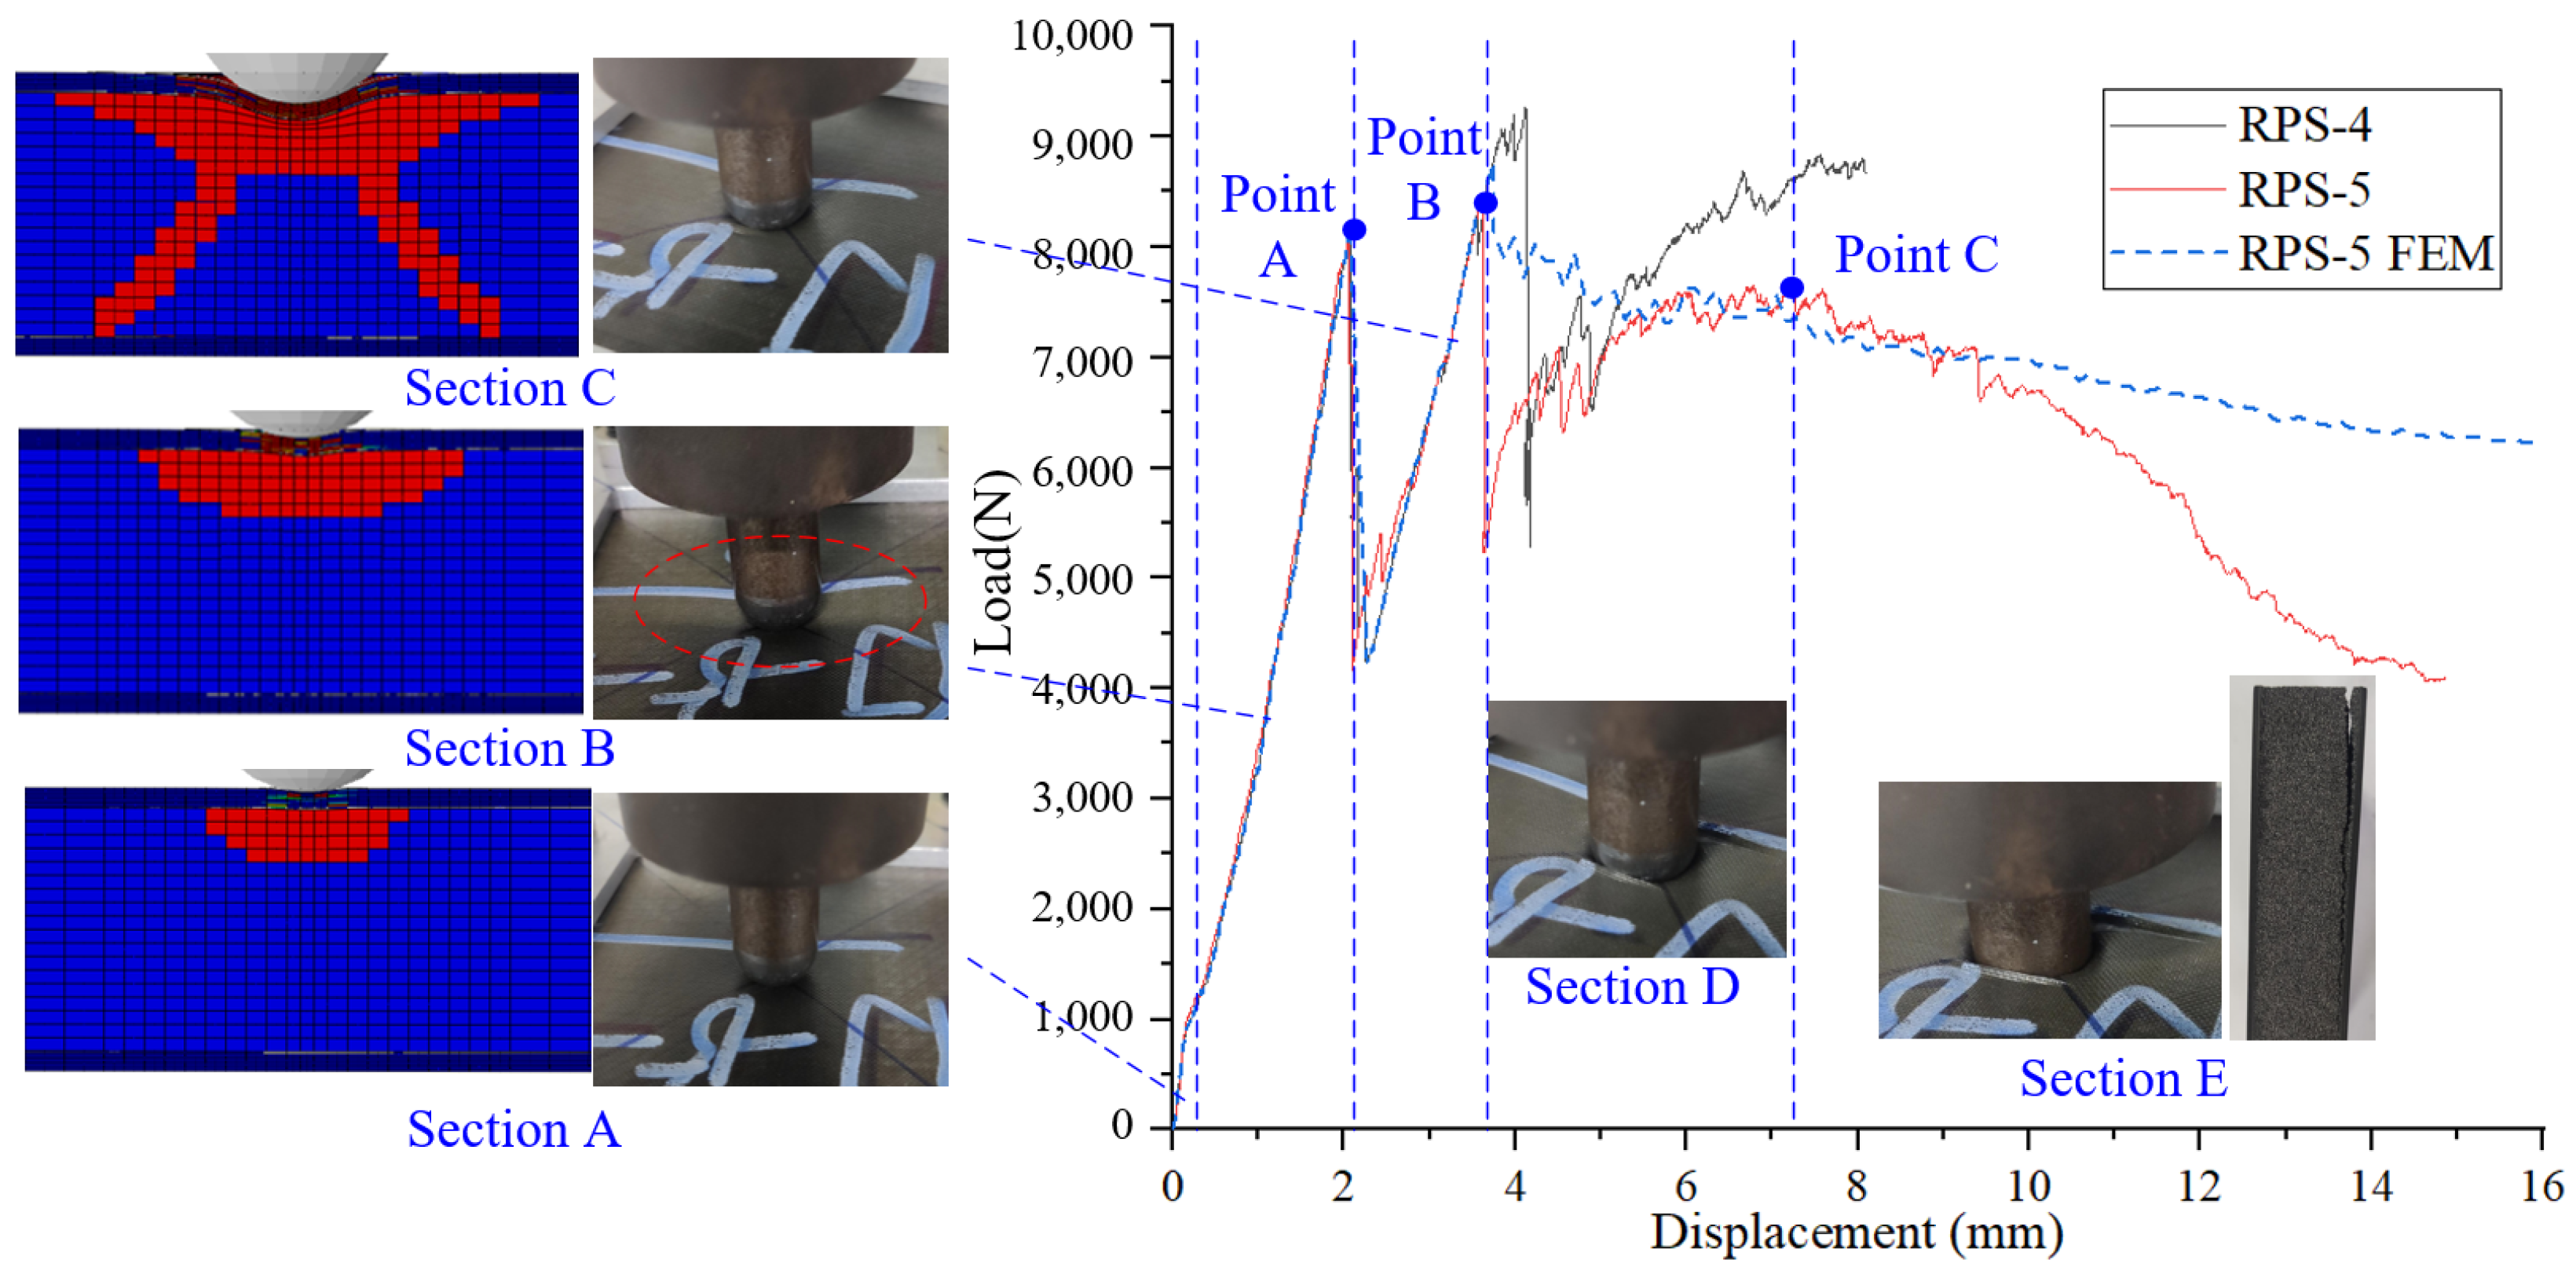
The load-displacement curves of the RPS quasi-static indentation tests are shown in Figure 16, from which it can be seen that the curves of RPS-4 and RPS-5 almost coincided before the indentation depth reached 3.81 mm, indicating that the consistency of the tests was good. The curves have the following characteristics: (1) In Section A, the curves have good linearity, and the specimens are not damaged. (2) In Section B, the panels directly under the indentation are partially damaged, and the area away from the indentation (marked by the red dotted line in Figure 16) is accompanied by the sinking of the indentation, causing the foam below to collapse. The curves at this stage also show apparent linearity because the modulus and platform stress do not change during the foam-hardening stage. After the curves reach Point A, the load drops sharply, and the specimens emit a clear sound for the first time. (3) In Section C, the slopes of the curves are smaller than those in Section B due to the more severe damage in the specimens. When loading to Point B, the fiber of the panel is completely broken, and the indentator penetrates the panel. At this time, specimens emit clear sounds for the second time. RPS-4 and RPS-5 almost completely overlap before Point B, which shows that the destruction before Point B is relatively regular. (4) In Section D, the curves rise with fluctuation, which is related to the fluctuation of CCF in the platform section. The indentation starts to contact the CCF directly, and as the spherical indentation deepens, the contact area between the indentator and the CCF increases continuously, increasing the load. When loading to Point C, the specimens emit a clear sound for the third time, and the back panel separates from the CCF. (5) In Section E, the specimens lose the ability to resist indentation.
The damage evolution of the CCF inside the specimen could not be obtained experimentally, but it could be obtained by the FEM. It can be seen from Figure 16 that before Point A, the CCF collapsed only under the indentator, forming a pit. The pit depth and area increased as the indentator went deeper. At Point A, a longitudinal crack suddenly formed inside the CCF, and the load dropped rapidly at the same time, indicating that the CCF sandwich structure quickly lost its bearing capacity. In addition, for the TPS, longitudinal cracks may have also increased the local heat flow. Therefore, in the design of the CCF TPS, the structure should be avoided to reach Point A under a given impact load.
The sections of the RPS quasi-static indentation specimens cut along the center line are shown in Figure 17. In addition to forming a “D”-shaped pit under the indentator similar to the low-velocity impact test, these longitudinal cracks extended to the back panel, also formed in the foam. The pit depth of RPS-4 was more profound than that of RPS-5 because the fragments under the pit fell off after the specimen was cut. The cut RPS-5 was further symmetrically divided to observe the morphology on another symmetrical plane. Since the panel was a quasi-isotropic laminate, the damage morphology on the two symmetrical sections of RPS-5 should have been the same. However, the strength of the composite panel and the carbon foam had dispersion, leading to the sections’ actual morphology being slightly different. According to the results of the FEM, it was found that Crack 1 occurred at Point A of the curve, which led to the first load drop. Crack 2 did not appear before Point B, indicating that Crack 2 was probably generated at Point C of the curve.
The results of the FEM were in good agreement with the test results of RPS-5 before Point B. However, we failed to simulate the curve and the damage morphology after Point B because the FEM model in this paper failed to accurately simulate the process of the indentator penetrating the panel and contacting the core, which needs further study. Nevertheless, the model in this paper had high accuracy in simulating the indentation before the panel penetration.

3.2.3. Low-Velocity Impact Tests and Simulations of CPS

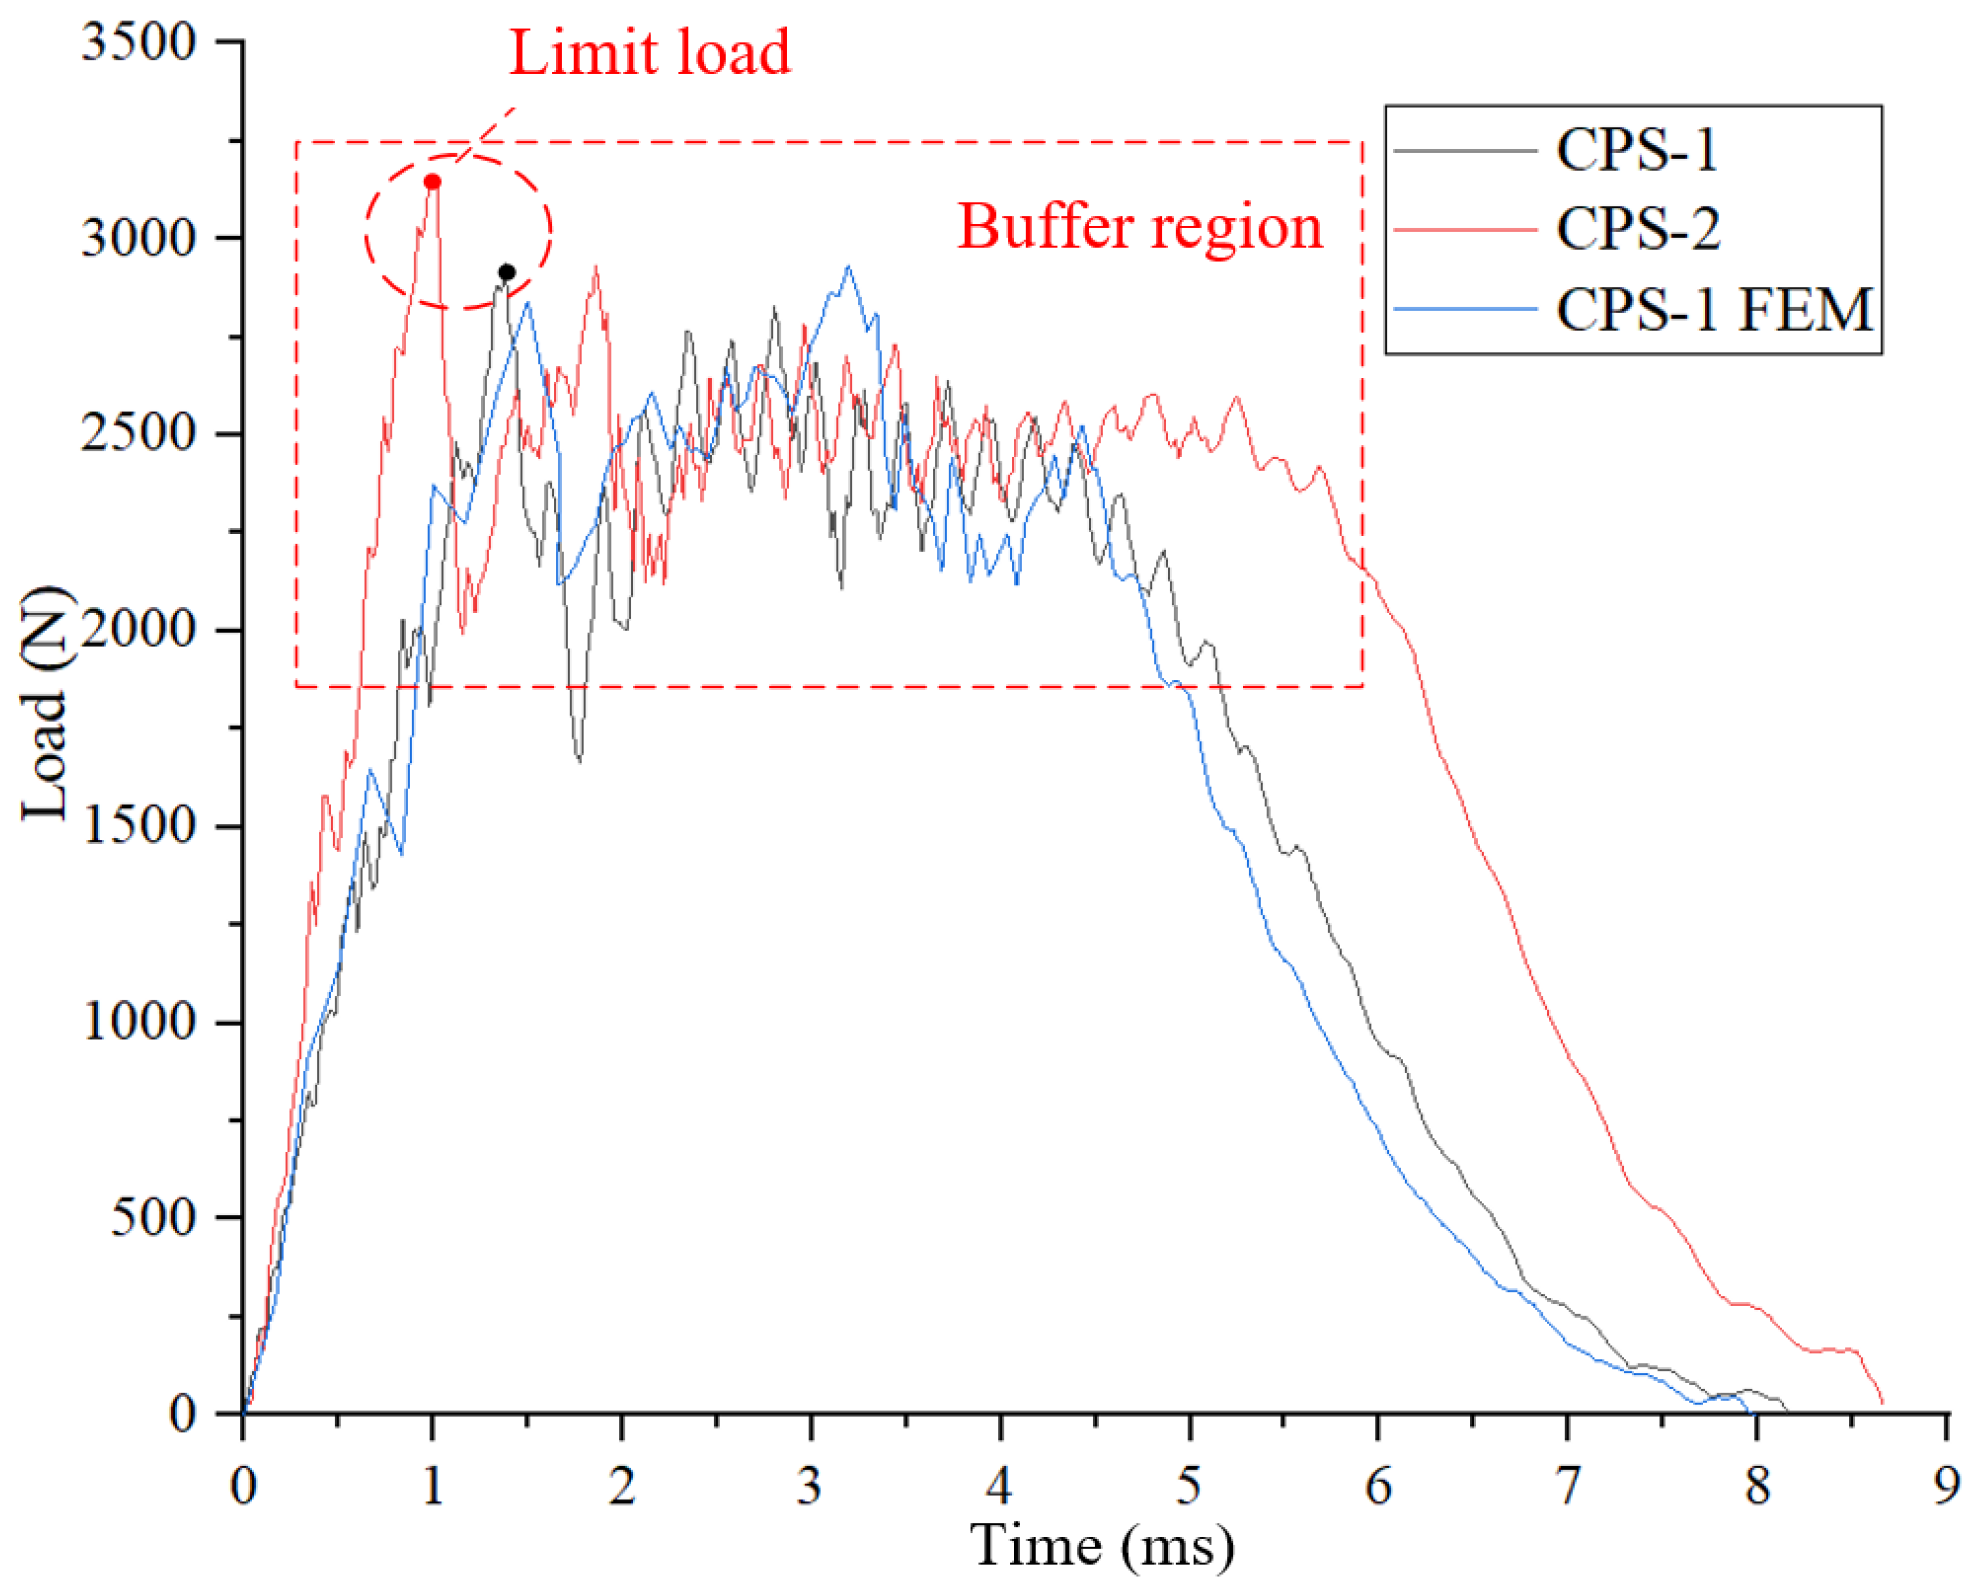
The load-time curves of the CPS low-velocity impact test are shown in Figure 18. The average loads in the buffer region of the two curves in Figure 18 are close. This result is consistent with the phenomenon observed in Figure 14, indicating that when the core material was the same, the impact energy had little effect on the average load of the buffer region. The limit loads of CPS and the average loads of the buffer region were significantly lower than that of RPS because the strength and modulus of CMC were significantly lower than that of CFRC.
The limit loads of the curves in Figure 18 equaled the maximum loads, while the maximum loads were more significant than the limit loads in Figure 19. The reason for the above differences was that CFRC had a high fracture toughness. Although the structural bearing capacity decreased when the limit load was reached, the damaged part of the panel still had a part of the bearing capacity. The load could continue to increase as the impactor went down. Meanwhile, the fracture toughness of CMC was low, and the bearing capacity of the damaged part of the panel decreased rapidly after reaching the limit load. Figure 18 shows the load-time curves of the test results and calculation results of CPS-1. It was found that the simulation of the model after the panel was penetrated was not accurate enough, so only the FEM results of CPS-1 are given. The simulation results were consistent with the test results, and the results were in good agreement.
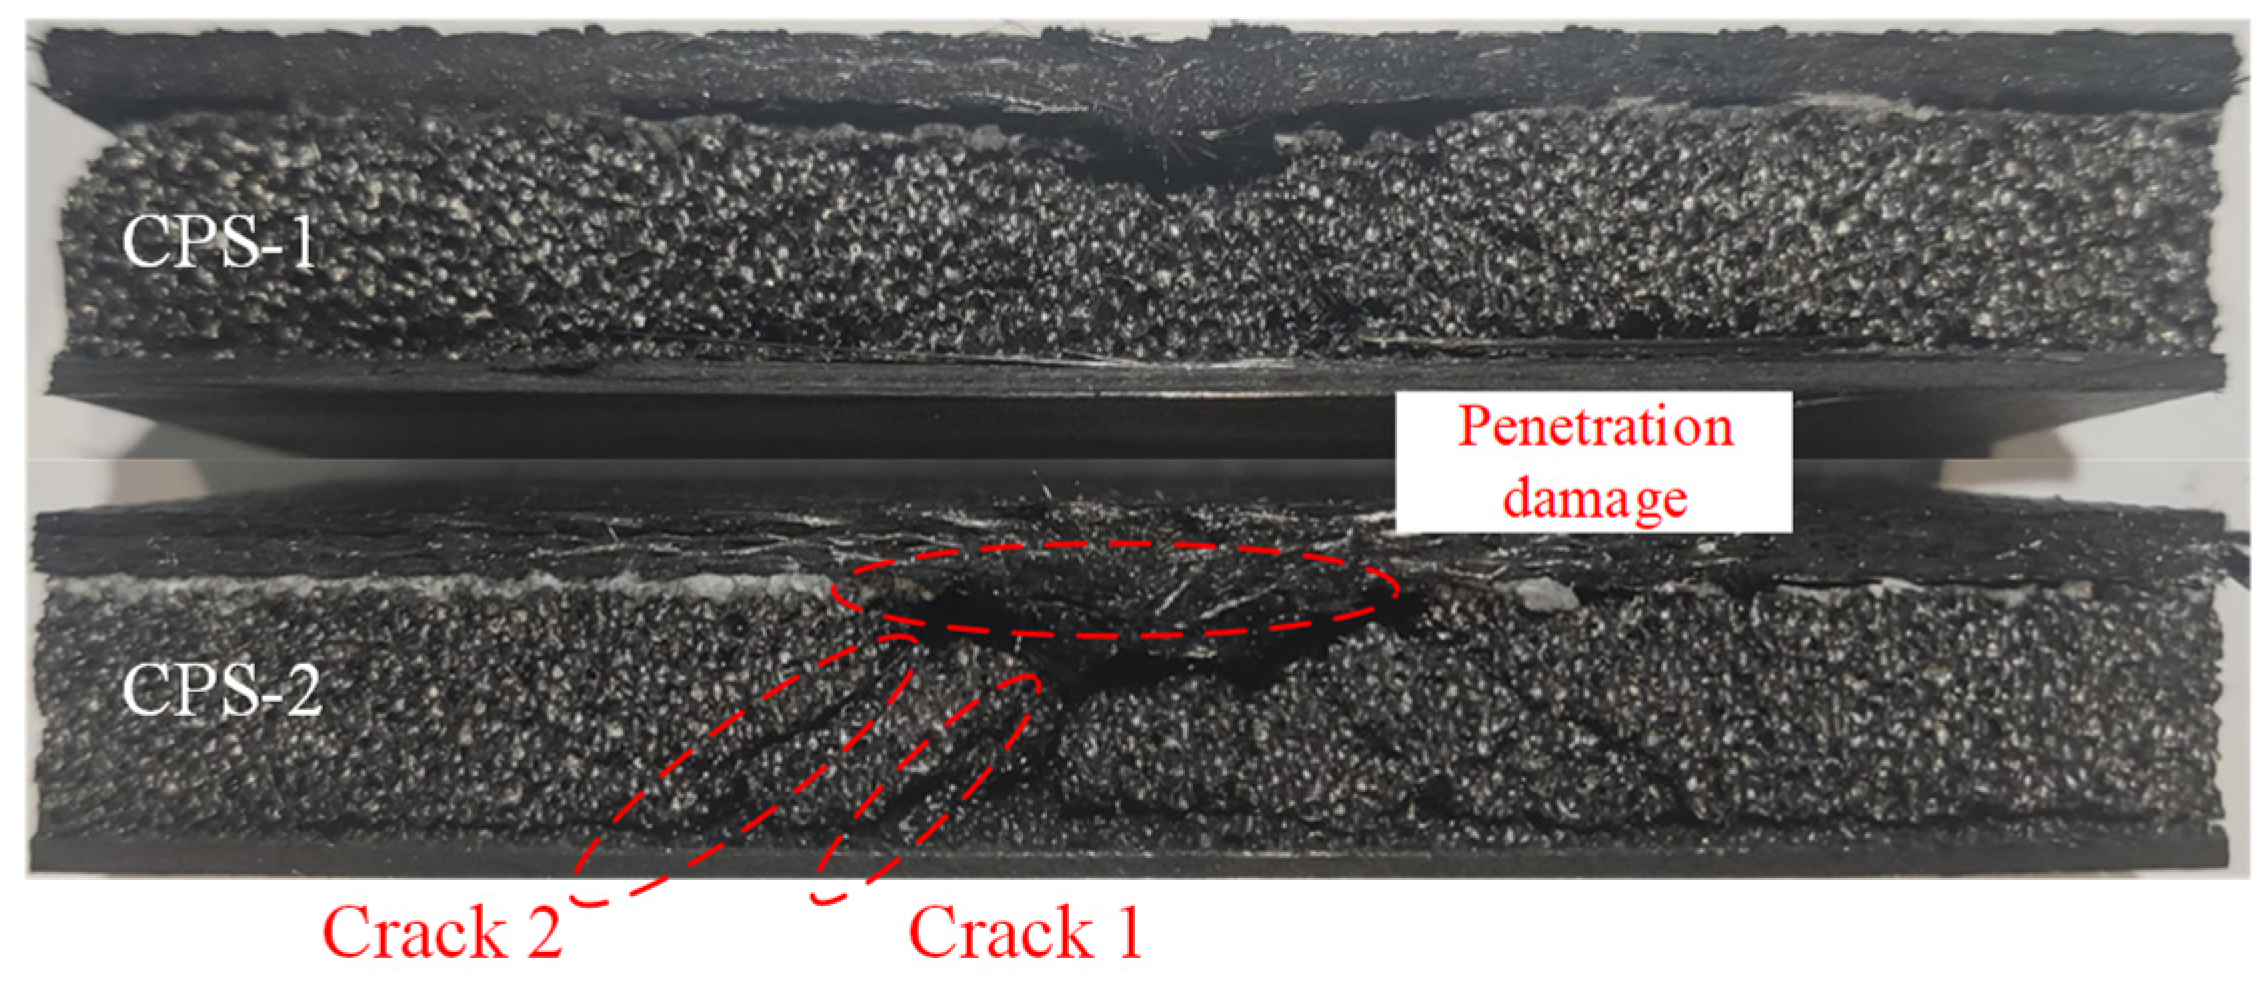
The sections of the CPS low-velocity specimens cut along the center line are shown in Figure 19, and the results of the CPS low-velocity impact test are shown in Table 13. It can be seen that the damage morphology of CPS was similar to that of the RPS quasi-static indentation test, which indicates that the damage processes of the two sandwich structures under low-velocity impact were similar, while the impact resistance of CPS was weaker.

4. Conclusions

This study investigated the MCM of CCF and the low-velocity impact properties of CCF TPS through many experiments and FEM simulations. The CCF MCM was obtained through a large number of comprehensive tests and verified in the FEM so that it can be used not only for the simulation of the impact process but also for the mechanical behavior analysis of other CCF structures under complex loads. The study on the low-velocity impact properties of CCF sandwich structures can provide an experimental basis for the TPS impact-resistant design of the HV for runway take-off. In addition, its verified method of FEM can also be used in the impact-resistant design of the CCF TPS, improving design efficiency and reducing R&D costs. The CCF MCM we proposed does not include the mechanical behavior of CCF after densification, which can be further studied to describe fully the mechanical behavior of CCF. The FEM presented in this paper cannot simulate the impact process after the panel is penetrated, a point which needs to be improved to analyze the impact process with higher energy. Further research on the effect of the strain rate and high temperature on the CCF MCM will allow us to simulate the response of CCF TPS under high-velocity impact to study the impact resistance of CCF TPSs for other HVs facing the threat of high-velocity impact of space particles.

Author Contributions

Conceptualization, Q.Z.; methodology, Q.Z., K.L. and X.C.; software, Q.Z. and P.Y.; validation, Q.Z., P.Y., K.L. and X.G.; data curation, Q.Z. and X.G.; writing—original draft preparation, Q.Z.; writing—review and editing, Q.Z. All authors have read and agreed to the published version of the manuscript.

Funding

This research received no external funding.

Data Availability Statement

Not applicable.

Conflicts of Interest

The authors declare no conflict of interest.

References

  1. Glass, D. Ceramic Matrix Composite (CMC) Thermal Protection Systems (TPS) and Hot Structures for Hypersonic Vehicles. In Proceedings of the 15th AIAA International Space Planes and Hypersonic Systems and Technologies Conference, Dayton, OH, USA, 28 April–1 May 2008. [Google Scholar]
  2. Pichon, T.; Barreteau, R.; Soyris, P.; Foucault, A.; Parenteau, J.; Prel, Y.; Guedron, S. CMC thermal protection system for future reusable launch vehicles: Generic shingle technological maturation and tests. Acta Astronaut. 2009, 65, 165–176. [Google Scholar] [CrossRef]
  3. Jayaseelan, D.D.; Xin, Y.; Vandeperre, L.; Brown, P.; Lee, W. Development of multi-layered thermal protection system (TPS) for aerospace applications. Compos. Part B Eng. 2015, 79, 392–405. [Google Scholar] [CrossRef]
  4. Uyanna, O.; Najafi, H. Thermal protection systems for space vehicles: A review on technology development, current challenges and future prospects. Acta Astronaut. 2020, 176, 341–356. [Google Scholar] [CrossRef]
  5. Le, V.T.; San, H.N.; Goo, N.S. Advanced sandwich structures for thermal protection systems in hypersonic vehicles: A review. Compos. Part B Eng. 2021, 226, 109301. [Google Scholar] [CrossRef]
  6. Melis, M.E.; Pereira, M.; Revilock, D.; Carney, K.S. A summary of the NASA glenn ballistic impact lab contributions to the Columbia accident investigation. In Proceedings of the Annual Reliability and Maintainability Symposium, Alexandria, VA, USA, 24–27 July 2005. [Google Scholar]
  7. Grosch, D.; Bertrand, F. Thermal Protection System (TPS) Impact Experiments. In Proceedings of the 47th AIAA/ASME/ASCE/AHS/ASC Structures, Structural Dynamics, and Materials Conference 14th AIAA/ASME/AHS Adaptive Structures Conference 7th, Newport, RL, USA, 1–4 May 2006. [Google Scholar]
  8. Singh, M. In-Space Repair and Refurbishment of Thermal Protection System Structures for Reusable Launch Vehicles. In Proceedings of the International Conference and Exposition of the European Ceramic Society, Berlin, Germany, 17–21 June 2007. E-16249. [Google Scholar]
  9. Melis, M.E.; Brand, J.H.; Pereira, J.M.; Revilock, D.M. Reinforced Carbon-Carbon Subcomponent Flat Plate Impact Testing for Space Shuttle Orbiter Return to Flight. In Proceedings of the 2006 National Space and Missile Materials Symposium (NSMMS), Orlando, FL, USA, 26–30 June 2006; NASA/TM-2007-214384. NASA: Washington, DC, USA, 2007. [Google Scholar]
  10. Melis, M.E.; Revilock, D.M.; Pereira, M.J.; Lyle, K.H. Impact Testing on Reinforced Carbon-Carbon Flat Panels with Ice Projectiles for the Space Shuttle Return to Flight Program; NASA: Washington, DC, USA, 2009. [Google Scholar]
  11. Snapp, C.; Rodriguez, A. Orbiter Thermal Protection System Lessons Learned. In Proceedings of the AIAA SPACE 2011 Conference & Exposition, Long Beach, CA, USA, 27–29 September 2011. [Google Scholar]
  12. Grujicic, M.; Pandurangan, B.; Zhao, C.; Biggers, S.; Morgan, D. Hypervelocity impact resistance of reinforced carbon-carbon/carbon-foam thermal protection systems. Appl. Surf. Sci. 2006, 252, 5035–5050. [Google Scholar] [CrossRef]
  13. Chen, C.; Kennel, E.B.; Stiller, A.H.; Stansberry, P.G.; Zondlo, J.W. Carbon foam derived from various precursors. Carbon 2006, 44, 1535–1543. [Google Scholar] [CrossRef]
  14. Yu, M.; Ao, X.; Chen, Q. Fabrication of ultralight reticulated carbon foams for thermal insulation from raffinate pitch of low-temperature coal tar. J. Anal. Appl. Pyrolysis 2022, 163, 105494. [Google Scholar] [CrossRef]
  15. Hu, L.; He, R.; Lei, H.; Fang, D. Carbon aerogel for insulation applications: A review. Int. J. Thermophys. 2019, 40, 39. [Google Scholar] [CrossRef]
  16. Su, R.; Wang, X.; Wang, D.; Li, L.; Liang, G.; Zheng, Z.; Li, K. Preparation of carbon foam-reinforced carbon aerogels and their copyrolysis mechanism. Microporous Mesoporous Mater. 2021, 319, 111059. [Google Scholar] [CrossRef]
  17. Wu, S.; Chen, D.; Zhao, G.; Cheng, Y.; Sun, B.; Yan, X.; Han, W.; Chen, G.; Zhang, X. Controllable synthesis of a robust sucrose-derived bio-carbon foam with 3D hierarchical porous structure for thermal insulation, flame retardancy and oil absorption. Chem. Eng. J. 2022, 434, 134514. [Google Scholar] [CrossRef]
  18. Xu, G.; Yang, T.; Fang, Z.; Wang, Q.; Yang, C.; Zhao, X. Preparation and characterization of coal-based carbon foams by microwave heating process under ambient pressure. Diam. Relat. Mater. 2018, 86, 63–70. [Google Scholar] [CrossRef]
  19. CFOAM® Carbon Foam Typical Properties (Metric). Available online: https://www.cfoam.com/spec-sheets/ (accessed on 1 July 2023).
  20. Wang, D.; Zhuang, Q.; Li, K.; Wang, Y. Study on Correlation of Mechanical and Thermal Properties of Coal-Based Carbon Foam with the Weight Loss Rate after Oxidation. Materials 2022, 15, 4887. [Google Scholar] [CrossRef]
  21. Calvo, M.; García, R.; Moinelo, S.R. Carbon Foams from Different Coals. Energy Fuels 2008, 22, 3376–3383. [Google Scholar] [CrossRef]
  22. Yang, N.; Gao, X.; Shen, Y.; Wang, M.; Chang, L.; Lv, Y. Effects of coal characteristics on the structure and performance of coal-based carbon foam prepared by self-foaming technique under atmospheric pressure. J. Anal. Appl. Pyrolysis 2022, 164, 105516. [Google Scholar] [CrossRef]
  23. Bruneton, E.; Tallaron, C.; Gras-Naulin, N.; Cosculluela, A. Evolution of the structure and mechanical behaviour of a carbon foam at very high temperatures. Carbon 2002, 40, 1919–1927. [Google Scholar] [CrossRef]
  24. Ravishankar, B.; Haftka, R.; Sankar, B. Uncertainty analysis of integrated thermal protection system with rigid insulation bars. In Proceedings of the 52nd AIAA/ASME/ASCE/AHS/ASC Structures, Structural Dynamics and Materials Conference 19th AIAA/ASME/AHS Adaptive Structures Conference 13th, Denver, CO, USA, 4–7 April 2011. [Google Scholar]
  25. Grujicic, M.; Zhao, C.; Biggers, S.; Kennedy, J.; Morgan, D. Suitability of a Coal-Derived Carbon-Based Foam for use in Thermal Protection Systems of Common Aero Vehicles. Multidiscip. Model. Mater. Struct. 2007, 3, 1–26. [Google Scholar] [CrossRef]
  26. Suzuki, T.; Aoki, T.; Ogasawara, T.; Fujita, K. Nonablative lightweight thermal protection system for Mars Aeroflyby Sample collection mission. Acta Astronaut. 2017, 136, 407–420. [Google Scholar] [CrossRef]
  27. Ogasawara, T.; Ayabe, S.; Ishida, Y.; Aoki, T.; Kubota, Y. Heat-resistant sandwich structure with carbon fiber-polyimide composite faces and a carbon foam core. Compos. Part A Appl. Sci. Manuf. 2018, 114, 352–359. [Google Scholar] [CrossRef]
  28. Kubota, Y.; Miyamoto, O.; Aoki, T.; Ishida, Y.; Ogasawara, T.; Umezu, S. New thermal protection system using high-temperature carbon fibre-reinforced plastic sandwich panel. Acta Astronaut. 2019, 160, 519–526. [Google Scholar] [CrossRef]
  29. Bale, S.D.; Goetz, K.; Harvey, P.R.; Turin, P.; Bonnell, J.W.; Dudok de Wit, T.; Ergun, R.E.; MacDowall, R.J.; Pulupa, M.; André, M.; et al. The FIELDS instrument suite for Solar Probe Plus: Measuring the coronal plasma and magnetic field, plasma waves and turbulence, and radio signatures of solar transients. Space Sci. Rev. 2016, 204, 49–82. [Google Scholar] [CrossRef]
  30. Congdon, E.; Mehoke, D.; Buchta, M.; Nagle, D.; Zhang, D. Development of high-temperature optical coating for thermal management on solar probe plus. In Proceedings of the 10th AIAA/ASME Joint Thermophysics and Heat Transfer Conference, Chicago, IL, USA, 28 June–1 July 2010. [Google Scholar]
  31. Heisler, E.; Abel, E.; Congdon, E.; Eby, D. Full-scale thermal simulator development for the solar probe plus thermal protection system. In Proceedings of the 2017 IEEE Aerospace Conference, Big Sky, MT, USA, 4–11 March 2017. [Google Scholar]
  32. Smith, R.; Bucior, S.; Hahn, J. Integration and Test Challenges of Parker Solar Probe. In Proceedings of the 2020 IEEE Aerospace Conference, Big Sky, MT, USA, 7–14 March 2020. [Google Scholar]
  33. Korreck, K.E.; Szabo, A.; Chinchilla, T.N.; Lavraud, B.; Luhmann, J.; Niembro, T.; Higginson, A.; Alzate, N.; Wallace, S.; Paulson, K.; et al. Source and Propagation of a Streamer Blowout Coronal Mass Ejection Observed by the Parker Solar Probe. Astrophys. J. Suppl. Ser. 2020, 246, 69. [Google Scholar] [CrossRef]
  34. Da Silva, L.F.M.; Adams, R.D. Effect of temperature on the mechanical and bonding properties of a carbon-reinforced bismaleimide. Proc. Inst. Mech. Eng. Part L J. Mater. Des. Appl. 2008, 222, 45–52. [Google Scholar] [CrossRef]
  35. Yang, B.; Yue, Z.; Geng, X.; Wang, P.; Gan, J.; Liao, B. Effects of space environment temperature on the mechanical properties of carbon fiber/bismaleimide composites laminates. Proc. Inst. Mech. Eng. Part G J. Aerosp. Eng. 2018, 232, 3–16. [Google Scholar] [CrossRef]
  36. Cai, Y.; Cheng, L.; Zhang, H.; Yin, X.; Yin, H.; Yan, G. Effects of graphite filler on the thermophysical properties of 3D C/SiC composites. J. Alloys Compd. 2019, 770, 989–994. [Google Scholar] [CrossRef]
  37. Patel, M.; Saurabh, K.; Prasad, V.V.B.; Subrahmanyam, J. High temperature C/C-SiC composite by liquid silicon infiltration: A literature review. Bull. Mater. Sci. 2012, 35, 63–73. [Google Scholar] [CrossRef]
  38. Li, K.; Gao, X.; Roy, A. Micromechanical modeling of three-dimensional open-cell foams using the matrix method for spatial frames. Compos. Part B Eng. 2005, 36, 249–262. [Google Scholar] [CrossRef]
  39. Sihn, S.; Roy, A.K. Modeling and prediction of bulk properties of open-cell carbon foam. J. Mech. Phys. Solids 2004, 52, 167–191. [Google Scholar] [CrossRef]
  40. Druma, C.; Alam, M.K.; Druma, A.M. Finite Element Model of Thermal Transport in Carbon Foams. J. Sandw. Struct. Mater. 2004, 6, 527–540. [Google Scholar] [CrossRef]
  41. Yu, Q.; Thompson, B.E.; Straatman, A.G. A Unit Cube-Based Model for Heat Transfer and Fluid Flow in Porous Carbon Foam. J. Heat Transf. 2006, 128, 352–360. [Google Scholar] [CrossRef]
  42. Triantafillou, T.C.; Gibson, L.J. Multiaxial failure criteria for brittle foams. Int. J. Mech. Sci. 1990, 32, 479–496. [Google Scholar] [CrossRef]
  43. Deshpande, V.S.; Fleck, N.A. Multi-axial yield behaviour of polymer foams. Acta Mater. 2001, 49, 1859–1866. [Google Scholar] [CrossRef]
  44. Sun, Y.; Amirrasouli, B.; Razavi, S.; Li, Q.; Lowe, T.; Withers, P. The variation in elastic modulus throughout the compression of foam materials. Acta Mater. 2016, 110, 161–174. [Google Scholar] [CrossRef]
  45. ASTM C297/C297M—16; Standard Test Method for Flatwise Tensile Strength of Sandwich Constructions. ASTM International: West Conshohocken, PA, USA, 2016.
  46. ASTM-C365/C365M—16; Standard Test Method for Flatwise Compressive Properties of Sandwich Cores. ASTM International: West Conshohocken, PA, USA, 2016.
  47. ASTM-E132/E132M—17; Standard Test Method for Poisson’s Ratio at Room Temperature. ASTM International: West Conshohocken, PA, USA, 2017.
  48. ASTM C273/C273M—11; Standard Test Method for Shear Properties of Sandwich Core Materials. ASTM International: West Conshohocken, PA, USA, 2011.
  49. ASTM D7766/D7766M—16; Standard Practice for Damage Resistance Testing of Sandwich Constructions. ASTM International: West Conshohocken, PA, USA, 2016.
  50. Cheng, X.; Zhang, J.; Bao, J.; Zeng, B.; Cheng, Y.; Hu, R. Low-velocity impact performance and effect factor analysis of scarf-repaired composite laminates. Int. J. Impact Eng. 2018, 111, 85–93. [Google Scholar] [CrossRef]
  51. Abaqus, G. Abaqus 6.11; Dassault Systemes Simulia Corporation: Providence, RI, USA, 2011. [Google Scholar]
Figure 1. The size and composition of CCF TPSL (a) RPS and (b) CPS.
Aerospace 10 00630 g001
Figure 2. The mesostructures of CCF: (a) The section in the in-plane direction; (b) The section in the out-of-plane direction.
Aerospace 10 00630 g002
Figure 3. The setup for PC test.
Aerospace 10 00630 g003
Figure 4. The stress-strain curves of brittle foam during uniaxial compression [44].
Aerospace 10 00630 g004
Figure 5. The specimens for mechanical properties of CCF: (a) UT test; (b) UC test; (c) SS test; and (d) PC test.
Aerospace 10 00630 g005
Figure 6. The specimens of low-velocity impact performance tests: (a) RPS and (b) CPS.
Aerospace 10 00630 g006
Figure 7. The experimental facility of low-velocity test and quasi-static indentation test.
Aerospace 10 00630 g007
Figure 8. The relationship among mechanical test results and failure surface and collapse surface.
Aerospace 10 00630 g008
Figure 9. The FEM of low-velocity impact tests and the quasi-static indentation tests.
Aerospace 10 00630 g009
Figure 10. The stress-strain curves of mechanical tests for CCF: (a) UT tests; (b) SS tests; (c) UC tests in x/y direction; (d) UC tests in x and y directions; (e) UC tests in z direction; and (f) PC tests.
Aerospace 10 00630 g010
Figure 11. Failure points, failure surface, and error band of CCF.
Aerospace 10 00630 g011
Figure 12. Collapse points, collapse surface, and error band of CCF.
Aerospace 10 00630 g012
Figure 13. The unloading-reloading stress-true strain curves of the PC test.
Aerospace 10 00630 g013
Figure 14. The load-time curve of RPS low-velocity impact test and FEM.
Aerospace 10 00630 g014
Figure 15. The sections of the RPS low-velocity specimens cut along the center line.
Aerospace 10 00630 g015
Figure 16. The load-displacement curves of the RPS quasi-static indentation test.
Aerospace 10 00630 g016
Figure 17. The sections of the RPS quasi-static indentation specimens cut along the center line.
Aerospace 10 00630 g017
Figure 18. The load-time curve of CPS low-velocity impact test and FEM.
Aerospace 10 00630 g018
Figure 19. The sections of the CPS low-velocity specimens cut along the center line.
Aerospace 10 00630 g019
Table 1. Mechanical properties of CFRC and C/SiC.
SymbolPropertyCFRCC/SiC
E 11 (GPa)Modulus along 1 direction16757.27
E 22 (GPa)Modulus along 2 direction9.1357.27
E 33 (GPa)Modulus along 3 direction9.134.56
ν 12 Poisson’s ratio in 12 plane0.350.36
ν 13 Poisson’s ratio in 13 plane0.350.32
ν 23 Poisson’s ratio in 23 plane0.300.32
G 12 (GPa)Shear modulus in 12 plane4.933.01
G 13 (GPa)Shear modulus in 13 plane4.933.01
G 23 (GPa)Shear modulus in 23 plane0.861.02
X T (MPa)Tensile strength along 1 direction2761204
Y T (MPa)Tensile strength along 2 direction38.4204
Z T (MPa)Tensile strength along 3 direction38.423.7
X C (MPa)Compressive strength along 1 direction1420360
Y C (MPa)Compressive strength along 2 direction179360
Z C (MPa)Compressive strength along 3 direction17987
S 12 (MPa)Shear strength in 12 plane75104
S 13 (MPa)Shear strength in 13 plane75104
S 23 (MPa)Shear strength in 23 plane3056
G C , ft (N·mm)Fiber tensile energy release rate18035
G C , fc (N·mm)Fiber compressive energy release rate10015
G C , mt (N·mm)Matix tensile energy release rate435
G C , mc (N·mm)Matrix compressive energy release rate1015
ρ (g·cm−3)Density1.652.03
K f (W·m−1·K−1)Thermal conductivity in fiber direction0.7228.8
K o u t (W·m−1·K−1)Thermal conductivity out of plane0.3411.0
C (J·g−1·K−1)Specific heat capacity1.080.69
Table 2. Test matrix of the mechanical properties of CCF.
TestReferenced ASTMNumber of SpecimensProperties
(i = x, y, z; j = xy, xz)
UT
test
C297 [45]UTx-1~3Tension strength S i t ;
Young‘s modulus E i
UTy-1~3
UTz-1~3
UC
test
C365 [46]
E132 [47]
UCx-1~5Compressive strength S i c ;
Young‘s modulus E i ;
Poisson’s ratio ν j
Platform stress σ i p
UCy-1~5
UCz-1~5
SS
test
C273 [48]SSxy-1~3Shear strength S j ;
Shear modulus G j
SSxz-1~3
PC
test
C365 [46]PCx-1~4Failure stresses and platform
stresses in all three directions
PCy-1~4
PCz-1~4
Table 3. Test matrix of RPS and CPS.
TestNumber of SpecimensLoad
Low-velocity
impact test of RPS
RPS-1Impact energy 20 J
RPS-2Impact energy 20 J
RPS-3Impact energy 25 J
Low-velocity
impact test of CPS
CPS-1Impact energy 10 J
CPS-2Impact energy 20 J
Quasi-static indentation
test of RPS
RPS-4Indentation depth 8 mm
RPS-5Indentation depth 15 mm
Table 4. The modulus and strength of CCF. (The data unit in the table is MPa).
Property E x E y E z G x y G x z S x t S y t S z t S x c S y c S z c S x y S x z
Results751943128395311203.513.484.019.728.5516.72.032.89
798856117089912013.033.424.178.1110.114.02.202.64
912742125692510983.073.464.5210.348.3112.82.212.29
9507461232 9.228.2213.1
7929131287 9.7410.916.8
8558871245
9778311260
9349101264
Average
value
871854125092611403.203.454.239.439.2214.72.152.61
Standard
deviation
79713522440.220.020.210.751.081.70.080.25
Table 5. The basic mechanical properties of CCF. (The data unit in the table is MPa).
Property ν x y ν z x
Results0.210.57
0.240.55
0.230.56
0.220.55
0.240.56
Average value0.230.56
Standard deviation0.0110.007
Table 6. Stresses when CCF failed in PC tests.
X Direction (MPa)Y Direction (MPa)Z Direction (MPa)
σ x −10.2−9.05−9.98−10.6−5.41−5.91−5.90−6.58−5.67−5.29−5.95−5.02
σ y −5.82−5.14−5.67−5.99−9.53−10.4−10.4−11.6−5.67−5.29−5.95−5.02
σ z −6.18−5.46−6.03−6.37−5.75−6.28−6.27−7.00−16.5−15.4−17.3−14.6
Table 7. The failure points’ coordinates of the UT, UC, and PC tests.
( p ˜ ,   q ˜ ) ( p ˜ ,   q ˜ ) ( p ˜ ,   q ˜ ) ( p ˜ ,   q ˜ )
UT
test
(MPa)
(−0.35, 1.05)UC
test
(MPa)
(0.35, 1.04)PC
test
(MPa)
(0.71, 0.60)SS
test
(MPa)
(0, 1.02)
(−0.30, 0.91)(0.29, 0.87)(0.63, 0.53)(0, 1.11)
(−0.31, 0.92)(0.37, 1.11)(0.70, 0.59)(0, 1.11)
(−0.35, 1.05)(0.33, 0.99)(0.74, 0.62)(0, 1.20)
(−0.34, 1.03)(0.35, 1.04)(0.67, 0.56)(0, 1.09)
(−0.35, 1.04)(0.31, 0.92)(0.73, 0.61)(0, 0.95)
(−0.32, 0.95)(0.36, 1.08)(0.72, 0.61)
(−0.33, 0.99)(0.30, 0.89)(0.81, 0.68)
(−0.36, 1.07)(0.29, 0.88)(0.78, 0.52)
(0.39, 1.17)(0.73, 0.48)
(0.38, 1.14)(0.82, 0.54)
(0.32, 0.95)(0.69, 0.46)
(0.29, 0.87)
(0.30, 0.89)
(0.38, 1.14)
Table 8. The platform stresses of the UC test.
Directions σ p (MPa)
X−6.33 −5.13 −7.44 −5.99 −5.43
Y−6.71 −7.56 −5.71 −5.51 −7.58
Z−11.12 −9.78 −9.66 −9.84 −11.26
Table 9. The platform stresses and non-loading direction stresses of the PC test.
X Direction (MPa)Y Direction (MPa)Z Direction (MPa)
σ x −10.2−9.05−9.98−10.6−5.41−5.91−5.90−6.58−5.67−5.29−5.95−5.02
σ y −5.82−5.14−5.67−5.99−9.53−10.4−10.4−11.6−5.67−5.29−5.95−5.02
σ z −6.18−5.46−6.03−6.37−5.75−6.28−6.27−7.00−16.5−15.4−17.3−14.6
Table 10. The collapse points’ coordinates of the UC and PC tests.
( p ˜ ,   q ˜ ) ( p ˜ ,   q ˜ )
UC
test
(MPa)
(0.23, 0.68)PC
test
(MPa)
(0.50, 0.42)
(0.18, 0.55)(0.48, 0.41)
(0.27, 0.80)(0.46, 0.39)
(0.21, 0.64)(0.54, 0.46)
(0.19, 0.58)(0.50, 0.43)
(0.24, 0.72)(0.52, 0.44)
(0.27, 0.81)(0.53, 0.45)
(0.20, 0.61)(0.56, 0.47)
(0.20, 0.60)(0.57, 0.38)
(0.27, 0.81)(0.55, 0.36)
(0.25, 0.76)(0.58, 0.38)
(0.22, 0.67)(0.53, 0.35)
(0.22, 0.66)
(0.22, 0.67)
(0.26, 0.77)
Table 11. The slope of the reloading stress-true strain curves.
Number of
Specimen
Slope (MPa)Fluctuation
Elastic Section1st2nd3rd4th5th
PCx-18838798758748678582.83%
PCy-18328248218248197984.09%
PCz-11355135113521346133813262.14%
Table 12. The results of RPS low-velocity impact test.
Number of
Specimen
Impact
Energy (J)
Limit
Load (N)
Maximum
Load (N)
Indentation
Diameter (mm)
Indentation
Diameter (mm)
RPS-1207409797822.413.14
RPS-2206815737223.182.59
RPS-3256895818524.524.14
Table 13. The results of the CPS low-velocity impact test.
Number of
Specimen
Impact
Energy (J)
Limit
Load (N)
Maximum
Load (N)
Indentation
Diameter (mm)
Indentation
Diameter (mm)
CPS-1102937293711.954.48
CPS-2203153315330.285.46
Disclaimer/Publisher’s Note: The statements, opinions and data contained in all publications are solely those of the individual author(s) and contributor(s) and not of MDPI and/or the editor(s). MDPI and/or the editor(s) disclaim responsibility for any injury to people or property resulting from any ideas, methods, instructions or products referred to in the content.