Article

A Quantitative Study of Aircraft Maintenance Accidents in Commercial Air Transport

School of Science, University of New South Wales Canberra at the Australian Defence Force Academy (UNSW ADFA), Canberra, ACT 2612, Australia
Aerospace 2023, 10(8), 689; https://doi.org/10.3390/aerospace10080689
Submission received: 18 May 2023 / Revised: 24 July 2023 / Accepted: 28 July 2023 / Published: 31 July 2023

Abstract

:
Aircraft maintenance is defined by the ICAO as the tasks that need to be carried out on an aircraft to ensure its continuing airworthiness. Accidents that result from aircraft maintenance activities are a direct measurable outcome that can be used to broadly assess the effectiveness of maintenance activities. This research seeks to understand the characteristics of aircraft-maintenance-related accidents and how these have changed over time. An exploratory design was utilized, which commenced with a content analysis of 358 accidents from the Aviation Safety Network, followed by a quantitative ex post facto study. The results showed that aircraft-maintenance-related accidents were 1.7 times less fatal compared to all aviation accidents in the database. Fatalities were reduced significantly from the 1990s following major accidents with many fatalities; this was countered by several industry-wide initiatives. However, the number of accidents have continued to grow by one each year. Relative to all accidents, it was found that maintenance contributes to (2.0 ± 0.4)% of all accidents, which increased to (3.8 ± 0.7)% from 1998 to 2019, up from (1.3 ± 0.2)% from 1941 to 1997. However, the rate of maintenance accidents per kilometer flown has decreased exponentially halving every 27.7 years. The results showed that the most common age of an aircraft involved in a maintenance accident was 5 to 15 years, corresponding to the first heavy maintenance period of an aircraft (6 to 12 years). Further results for age showed no correlation to the fatalness of accidents; however, older aircraft were more likely to be written off.

1. Introduction

The maintenance of an aircraft involves a range of activities aimed at ensuring that it remains in a safe and airworthy condition throughout its lifecycle [1,2,3]. These activities include repairing, inspecting, overhauling, troubleshooting, and modifying various components, subsystems, or systems of the aircraft [4,5,6]. While aircraft maintenance is critical for aviation safety [7,8,9], it is also considered a high-risk area with a significant impact on accidents and incidents [10,11,12,13]. To improve work quality and safety, it is important to understand maintenance errors and promote a culture of identifying them, reporting them, and learning from them [14,15]. As highlighted by Hobbs and Williamson [14] and Floyd [15], such a culture can go a long way to minimize aircraft-maintenance-related accidents and incidents.
According to various sources [16,17], maintenance costs typically constitute 10% to 20% of aircraft operational costs. The International Air Transport Association’s Maintenance Cost Technical Group publishes the Airline Maintenance Cost Executive Commentary, which includes annual data obtained from airlines worldwide based on their maintenance cost data. The data for 2018, collected from 54 airlines, indicate that they spent approximately USD 69 billion on aircraft maintenance, repair, and overhaul, accounting for about 9% of their total operational costs [18].
The primary aim of this work is to enhance safety in the aviation industry by understanding the distinctive aspects of aircraft-maintenance-related accidents when compared to other aviation accidents and how these have changed over time. By understanding the unique characteristics of aircraft-maintenance-related accidents, it is anticipated that such events can be prevented, saving lives and reducing costs (both direct and indirect) to the aviation industry. That is, while this research provides no suggestions and recommendations to improve aviation safety directly, it provides an understanding about the nature and characteristics of aircraft-maintenance-related accidents to inform future aircraft maintenance safety research. This work builds directly on previous work that presented a preliminary investigation of maintenance accidents, which was limited to ICAO (International Civil Aviation Organization) official accidents [19]. This work expands the sample size to all commercial air transport accidents captured by the Aviation Safety Network (ASN). The associated research questions are as follows:
  • How does the distribution of accidents that result from issues associated with aircraft maintenance differ from all accidents across the aviation industry?
  • How has the distribution of accidents that result from issues associated with aircraft maintenance changed from older (1940–1997) to modern (1998–2020) accidents?
  • How has the number of aircraft-maintenance-related accidents and associated fatalities changed over time?
  • How does the age of an aircraft in a maintenance-related accident influence the outcome (fatalness and aircraft damage) of the occurrence?
  • What is the proportion of accidents that result from aircraft maintenance issues?

2. Materials and Methods

2.1. Research Design

This research employed a mixed-methods approach, with an initial qualitative content analysis serving as the basis for a subsequent quantitative ex post facto study [20]. The qualitative analysis involved extracting categorical data from aircraft maintenance-related accidents and further coding the narrative to generate additional categorical variables. The coding was deductive in nature, applying the ICAO Aviation Occurrence Categories and the various other dimensions defined as part of the ICAO’s ADREP Taxonomy [21]. The resulting data were then subjected to an ex post facto study to analyze the distributions and determine whether any observed differences were statistically significant compared to all aviation accidents.

2.2. Data Collection, Coding, and Cleaning

Data were collected from the ASN, which is a service provided by the Flight Safety Foundation [22]. In the ASN accident database, maintenance is listed as one of the contributing/causal factors. Under maintenance, there were 99 accidents identified. In addition to this, a further 98 accidents were found with an advanced Google search, noting the ASN has no search function. Importantly, it was noted that Google was not providing all search results (some of the original 99 accidents identified by the ASN were not in the Google results). As such, Bing was used to conduct another search. This added a further 161 accidents (giving a total sample of 358 aircraft-maintenance-related accidents). Most of these occurrences found via searches had yet to be coded with additional occurrence categories and hence were not identified as specific maintenance occurrences. In these searches, the site was limited (using “site:”) to the ASN database, and the titles of the results were limited (using “intitle:”) as it was noted that all reports generated the same title (“ASN Aircraft accident”), with only the record number at the end changing. It was also noted that, as a multilingual database, the title also limited the results to English, preventing duplication. The additional search terms then used were “maintenance”, “mechanic”, “technician”, “electrician”, “AME” (aircraft maintenance engineer), “LAME” (licensed aircraft maintenance engineer), “incorrect installation”, “incorrectly installed”, “inadequate inspection”, “airworthiness directive”, “service bulletin”, and “inadequate maintenance”. The general term “maintenance” was used last as it returned the most results, and many of those cases were returned with previous, more specific search terms and, hence, if already selected, were identifiable due to the hyperlink’s color change (blue to purple).
All the accidents in the ASN database are pre-coded with the following:
  • Date;
  • Aircraft type and registration;
  • Number of fatalities (crew, passengers, and external);
  • Location and country (country given as a flag, which included an alt text field);
  • Operator and type of operation;
  • Phase of flight;
  • Date (year) of the aircraft’s first flight;
  • Accident category (A1, denoting a hull loss, or A2, denoting that the aircraft is repairable).
Other characteristics were also included but not of interest (registration, serial number, flight number, and departure and destination airports). Some cases also included total airframe hours and cycles; unfortunately, these were not commonly available, although they would have been useful variables to investigate.
Based on the aircraft type, further codes were produced: manufacturer, engine type, number of engines, and maximum takeoff mass, which are all commonly used in safety reports. The manufacturers were determined from a lookup table that coded every unique aircraft to a simplified list of manufacturers. That is, to reduce the number of categories and limit the usefulness of the testing procedure, manufacturers that have merged over the years were grouped together, including Boeing, McDonnell, and Douglas as one; Lockheed and Martin; Northrop and Grumman; Textron (Cessna and Beech); and the many British organizations that eventually merged via various paths to be British Aerospace (BAe).
The difference in the date (year) of the accident and the date (year) of the aircraft’s first flight was used to determine the aircraft’s age (in years) at the time of the accident. It should be noted that 27 of the entries were missing the aircraft’s first flight date and were subsequently sourced from the Bureau of Aircraft Accident Archives [23]. The country was converted into the corresponding world region (continent) with a simple lookup table. The entries also indicated if the accident was part of other ASN codes (for different contributing/causal factors) or categories, which were extracted. Modifications were made to the phase of flight, specifically where a system component failure occurred whilst the aircraft was clearly in a known phase of flight. That is, if an “event” resulted in a “crash” during approach or landing, ASN codes this as occurring during approach or landing. These cases were re-coded to the phase when the maintenance-related failure occurred. There were 44 of these cases with their phase of flight re-coded. Furthermore, one occurrence was listed with an unknown phase of flight, while the narrative clearly described it as enroute. One final coding issue was detected. This involved a test flight following maintenance that was incorrectly identified as a training flight. Finally, each of the narratives was then coded according to the ICAO occurrence categories [24].

2.3. Data Analysis

2.3.1. Goodness of Fit

As with previous work [19,20,25,26,27,28], the primary data analysis tool to compare categorical (nominal) data to a known or existing baseline is a Pearson’s Chi squared test for goodness of fit. In the goodness of fit tests conducted, the observed (O) data were the aircraft-maintenance-related accidents. The expected (E) data (distribution) utilized in each test depends on the exact case (ASN summary data or ICAO accident data), and each is detailed with the corresponding results. The statistical hypotheses to be tested are given as follows:
H0: PO,n = PE,n
HA: PO,n ≠ PE,n
where P is the proportion of the n’th category. That is, n-separate Pearson’s Chi squared tests were conducted. The test being conducted was to determine if the proportion of the aircraft-maintenance-related accidents is as expected (the null hypothesis) or not (the alternative hypothesis), for each of the n different coded variables.

2.3.2. Test for Independence

As with other work [25], a Pearson’s Chi squared test for independence was needed to analyze categorical (nominal) data between groups. In the test for independence, the observed dataset is the two halves of the aircraft-maintenance-related accidents (1940–1997 and 1998–2020). That is, of the 358 accidents, the median year was observed to be 1997; the sample from 1940–1997 contains 180 accidents, while the sample from 1998–2020 contains 178 accidents. The expected data are the “average” of these, such that no difference is assumed, and hence, the two halves are not independent. The statistical hypotheses to be tested are given as follows:
H0: P1940–1997,n = P1998–2020,n
HA: P1940–1997,n ≠ P1998–2020,n
The test is therefore being conducted to determine if the proportion of the aircraft-maintenance-related accidents from 1940–1997 is the same as the proportion of aircraft-maintenance-related accidents from 1998–2020 (the null hypothesis) or if they are independent (the alternative hypothesis), for each of the n different coded variables.

2.3.3. Longitudinal Analysis

Correlation was chosen to analyze if any statistically significant trend existed over the eight decades of the study. Pearson’s correlation coefficient (r) is a measure of association between two interval or ratio variables: in this case, the number of accidents and the decade. The statistical hypotheses to be tested are given as follows:
H0: r = 0
HA: r ≠ 0
This test assesses if there is an association between the number of accidents in each decade and the decade. This method was also utilized to assess the total number of fatalities in each decade. To ensure the tests were valid, one-sample Kolmogorov–Smirnov (KS) tests were performed to ensure the dependent variables were normally distributed.
To determine if the outcomes of aircraft-maintenance-related accidents (fatalness or fate of the airframe) were a function of the aircraft age, logistic regression was utilized. This is because both fatalness and the fate of the airframe (accident category) are both dichotomous variables (fatal or not; hull lost or not), while the aircraft age is a continuous variable. Logistic regression is the ideal tool to measure the association between a dichotomous dependent variable and a continuous independent variable, given the dichotomous variable is not normally distributed. The statistical hypotheses to be tested are given as follows:
H0: β = 0
HA: β ≠ 0
where β is variable in the fitted logit function, which relates the continuous variable to the dichotomous output. The logit has the following form:
π x = e α + β x 1 + e α + β x ,
where π is the estimated probability of the dichotomous outcome at the given predictor level, which, in this case, is the age of the aircraft. As such, the statistical test determines if there is no change in probability as a function of age (null hypothesis) or if there is (alternative hypothesis).
There is one final question to answer: has the percentage of accidents that are maintenance-related changed from the first half of the dataset (1940–1997) to the second half of the dataset (1998–2020)? Answering this question requires a simple two-sample t-test. The statistical hypotheses to be tested are given as follows:
H0: μ1940–1997 = μ1998–2020
HA: μ1940–1997 ≠ μ1998–2020
where μ is the relevant sample mean. The test is therefore being conducted to determine if the mean annual percentage of accidents from 1940 to 1997 is the same as the mean annual percentage of accidents from 1998 to 2020 (null hypothesis) or not (alternative hypothesis). Again, KS tests were used to ensure the parametric test was valid, and the count data were used to produce the rate data.

3. Results

3.1. Summary

Table 1 shows the results for the goodness of fit tests comparing aircraft-maintenance-related accidents to all aviation accidents in general. The key thing to note is that all characteristics are statistically significantly different. That is, the characteristics of aircraft-maintenance-related accidents are not the same as those of all aviation accidents. Each of these will be discussed in detail below.

3.2. Comparative Data
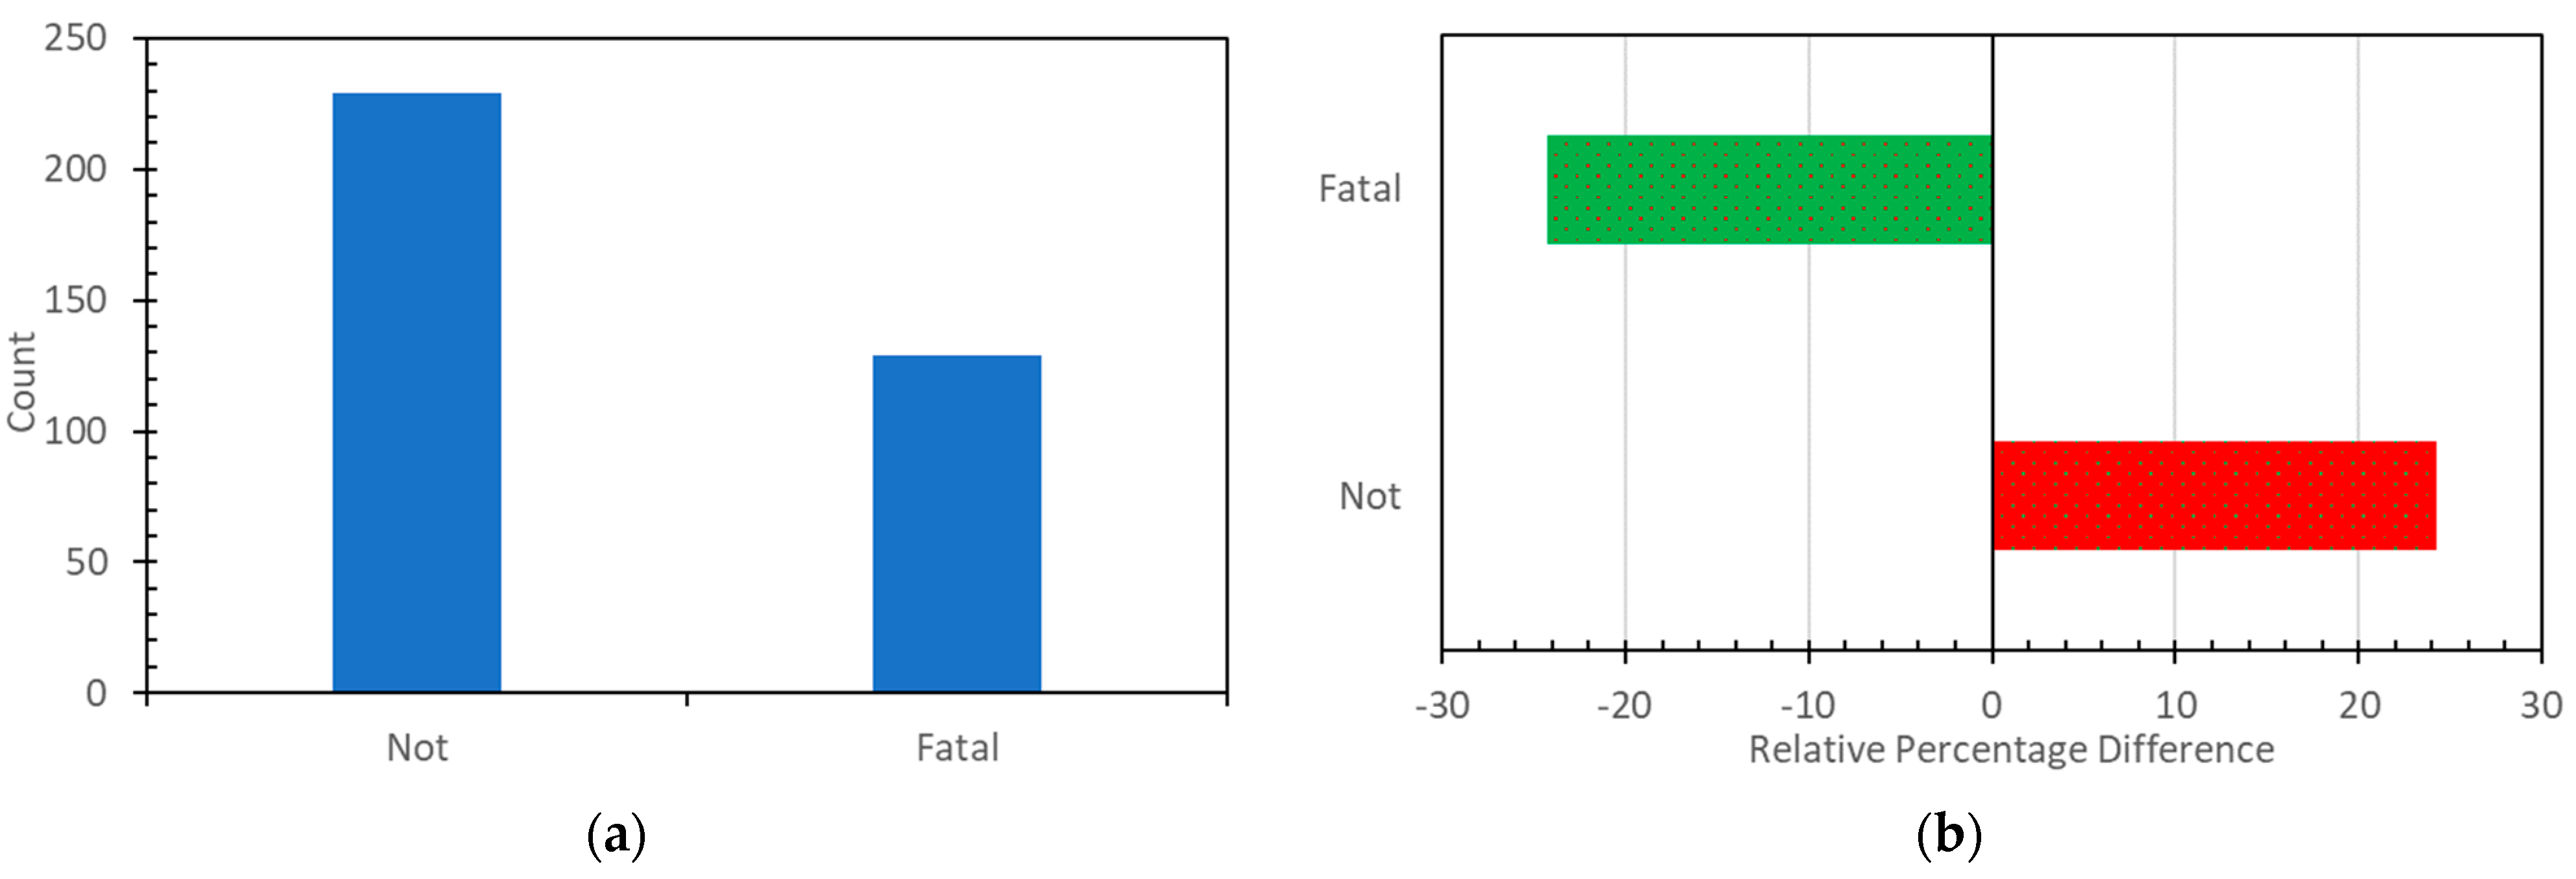
3.2.1. Fatalness

Figure 1a shows the distribution of fatal to non-fatal aircraft-maintenance-related accidents. While the mode is non-fatal, this should be considered relative to the split of fatal to non-fatal accidents across all the ASN accident statistics (40% non-fatal to 60% fatal). In comparing the maintenance accidents to this, we see significantly less than expected (as shown in Figure 1b). Therefore, relative to all accidents captured by the ASN, accidents that result from maintenance issues are statistically significantly less fatal than expected. That is, the average aircraft-maintenance-related accident is less fatal than the average accident. Importantly, in previous work [19], the sample size for official ICAO accidents with maintenance contribution was too small (n = 35, m = 1277) to conclude if maintenance accidents were more or less fatal than average accidents. Here, with a larger sample size (n = 358; m = 22,315), the observed difference has become statistically significant.
An interesting statistic to know at this point is “how much less fatal are aircraft-maintenance-related accidents, on average?” Looking at the ASN accident statistics, we see that 60% of accidents are fatal. Since we have found that 129 of the 358 accidents are fatal, this percentage is 36%. Hence, we can say that aircraft-maintenance-related accidents are 1.67 ± 0.16 times less fatal than all ASN accidents.

3.2.2. World Region

In looking at the world region (the continent in which the occurrence happened), the baseline expected distribution was taken from all ASN accidents. This then allows for any potential bias in the collection of data or the reporting of data to be accounted for. Such that, if the observed mode for North America (NA) is because more accidents are reported in NA, the proportions can still be directly compared. So, more accidents reported would result in more maintenance-related accidents also being reported.
Figure 2 shows that the spike in aircraft-maintenance-related accidents in NA is well above the expected number, even though NA has the most accidents in the ASN database. It should be noted that the data do not consider the volume of aircraft movements in each region. However, in general, if there is an association between accidents and traffic, an increase in traffic would not only cause an increase in aircraft-maintenance-related accidents but also increase the number of all accidents. Hence, by comparing the total number of accidents in each region, the observed difference is, in theory, independent of traffic. As such, we can say with confidence that, relative to the total number of accidents in each region, NA shows the only statistically significant excess of aircraft-maintenance-related accidents. The increase in cases in NA is about 49% of the sample size or 86.5 cases on top of the expected 86.5 cases. There is no obvious reason for the greater proportion of aircraft-maintenance-related accidents in NA. Previous work looking at human factor (HF)-related accidents showed no greater prevalence of these in NA; in fact, the number was slightly below expected, with Africa being identified as having more HF-related accidents than expected [26]. A previous study of fatal accidents worldwide (1990 to 2006) showed that the US had only 16% of these fatal accidents [29]. A potential reason for this could be the larger scale of the MRO (maintenance, repair, and overhaul) industry in NA. There is a great variety of market analyses available online, and none agree in terms of a breakdown by region. The data from Maximize Market Research put NA at 55%, suggesting that more MRO occurs in NA than in any other region, and hence, it would be expected that there are more maintenance-related accidents in NA.

3.2.3. Phase of Flight

Figure 3a shows the distribution of the aircraft-maintenance-related accidents in the different phases of flight. The mode is observed to be enroute (ENR) or cruise. Similarly, for the ASN summary data for phase of flight, ENR is the most common phase of occurrence, which is not surprising given that most time is spent in this phase. However, looking at Figure 3b, we see significantly more accidents than expected in the earlier phases of flight (TOF = takeoff; ICL = initial climb), as we do for landing (LDG). For a general system component failure, several factors will be important to consider, such as loading, usage rates, etc. However, since maintenance is an activity that occurs prior to a flight, the average failure will be a function of time, with more failures expected to occur in the initial phases of flight. Interestingly, if a failure was to occur before the aircraft was at the gate with an operation in progress (pre-flight), for example, taxiing from a maintenance facility to a gate, this is not considered an accident by the ICAO and is just a maintenance occurrence. This logical reasoning is supported by the data, which show that aircraft-maintenance-related accidents are more likely to occur earlier in a flight (Figure 3b), especially during takeoff, when loads and power levels can be significant. It is common for gear, control surface, and engine-related faults to manifest themselves at takeoff and during climb-out. Similarly, if a gear fault is not noted when retracting or during takeoff, it is likely to be an issue again at landing. That is, if the gear issue was not likely to cause an issue in a taxi from a maintenance facility to the operating line, then there is an increased chance that it will not cause a failure during the takeoff run. This is clearly not a zero chance as, when a takeoff run commences, there is a complex set of forces acting on the gear, with weight reducing quadratically as speed increases. However, during significant loads at touch down, the chance of failure increases dramatically, hence the observed tertiary spike for landing.
A recent study of aircraft accidents during takeoff showed that technical (aircraft) issues had the highest aggregate percentage in terms of contributions to accidents [30]. The same study showed that “issues with control” was the most significant factor during takeoff accidents, which is mirrored here in aircraft-maintenance-related accidents, where system component failures, particularly those associated with control systems, occur frequently (relatively speaking). Previous studies into flight safety during takeoff yield similar results [31], although the interdependence between the technical issues and the decision made is not clear. For example, the authors of [31] identified the most significant factor during takeoff as rejecting the takeoff after V1, which could be the result of a lack of direction control (#2), degraded engine performance (#6), tire failure (#7), or sudden engine power loss (#10). The result is still that a significant proportion of cases during takeoff are the result of technical issues.

3.2.4. Occurrence Category

The results showing the associated occurrence categories in Figure 4a are not surprising: system component failure—non-powerplant (SCF-NP) is the most common, followed by system component failure—powerplant (SCF-PP). While in the ICAO official accident statistics, SCFs are common, the rate at which they occur in aircraft-maintenance-related accidents is much higher (illustrated in Figure 4b). These are balanced by less than expected abnormal runway contact (ARC), runway excursions (RE), and turbulence (TURB) occurrences, in addition to the others. The lack of ARC and REs is interesting as, like with the phase of flight, it was noted that there is a tertiary spike of aircraft-maintenance-related occurrences at landing. However, the lack of ARC and REs means that, for the “average” aviation accident, these must be more common. This is supported by previous studies in the literature concerning runway related accidents, specifically runway excursions, with between 20 and 25 percent of total accidents being runway excursions [32,33].
It is difficult to directly compare results for different subsets of accidents in terms of occurrence categories as these can vary greatly. For example, in a study comparing Korean accidents to the worldwide commercial jet statistics and EASA statistics [34], all three gave a different OC that was most frequent (SCF-PP, LOC-I, and ARC, respectively, for Korea, worldwide, and EASA). However, by looking at the OC associated with different subsets of accidents, it enables regulators and operators within those specific subsets to understand the nature of occurrences and respond to them accordingly. So, while the statistically significant result in this work for aircraft-maintenance-related accidents yields no revolutionary insight, repair and overhaul of the control system and undercarriage are responsible for a disproportionately large number of accidents. Therefore, efforts should be focused on improving practices with the maintenance of these systems first and foremost. Additionally, research efforts into aviation maintenance should focus on why these issues are so common.

3.2.5. Type of Operation

For the type of operation, the mode of the aircraft-maintenance-related accident count is associated with the scheduled domestic passenger service (Dom). This is not surprising as most global air traffic is in fact associated with domestic services. Some of the busiest air routes in the world include Tokyo to Sapporo, Seoul to Jeju, and Sydney to Melbourne; in fact, the top 25 of the top 50 busiest routes in 2018 were all domestic (grouping China, Taiwan, and Hong Kong) [35]. When we compare aircraft-maintenance-related accidents to ASN accident summary statistics based on operation (Figure 5), we note that domestic is below expected, and the most statistically significant difference is for ferry flights. Ferry flights are repositioning flights and are commonly associated with moving aircraft to and from maintenance bases, as well as between airports for operational reasons (airlines prefer not to ferry empty aircraft as there is no potential for revenue). Sadly, the ASN summary statistics do not include test flights; this likely would have also been significantly higher, given that test flights occur immediately following significant maintenance activities. As such, it is not surprising to note that test and ferry flights experience significantly more maintenance-related accidents as these are times when no passengers or cargo are being carried. It is also worth noting that there appears to be no specific studies in the literature directly comparing domestic and international accidents. Various studies have looked at flight purpose or the type of operation as an independent variable [26]. Also, NASA has a report that covers accident characteristics divided by purpose of flight [36], However, international and domestic flights are not separated.

3.2.6. Manufacturer

The distribution of aircraft-maintenance-related accidents by manufacturer is shown in Figure 6a. Here, the mode is clearly Boeing (n = 106), which is not surprising given the long history of the associated brands, with the DC 3 being the most common aircraft in this dataset, followed by the DC and MD jet aircraft and the family of ubiquitous Boeing jet aircraft. When compared to the number of accidents in the ASN database for each of these manufacturers (Figure 6b), we note that the proportion of accidents that are aircraft-maintenance-related for Boeing is below expected, while, for Textron (Cessna and Beech) and Airbus (along with others), there are more accidents than expected.
As with other characteristics previously discussed, there is a lack of research that directly investigates the relationship between aircraft manufacturers and accidents. There are industry-based statistics in terms of accident rates [37], but these tend to be limited to airlines and large transport category aircraft and, hence, cannot be utilized here for a direct comparison. When looking at the previous HF study [26], which also used aircraft manufacturers as an independent variable, Antonov and UAC (Tupolev and Ilyushin) were associated with significantly more accidents. A recent study compared narrow-body aircraft from Boeing and Airbus [38]; in general, the trends suggested that Airbus aircraft were safer than Boeing aircraft, while, here, when looking at only maintenance, Airbus accidents appear to occur more than expected, while Boeing accidents occurs less than expected.

3.2.7. Mass Category

The ICAO Accident/Incident Data Reporting (ADREP) taxonomies code aircraft size as the mass category. These include maximum takeoff masses of (1) less than 2251 kg, (2) 2251 kg to 5700 kg, (3) 5701 kg to 27,000 kg, (4) 27,001 kg to 272,000 kg, and (5) above 272,000 kg. The distribution of aircraft-maintenance-related accidents by mass category is shown in Figure 7a. The mode is 3 (medium aircraft), and this mass category includes the common DC3, Beech 1900, Embraer 110 and 120, Metroliner, ATR-72, and Antonov An-2, in addition to the majority of Curtiss and Convair cases. In comparison to the official ICAO accident statistics, there are also more accidents in mass category 3 than expected. There are also significantly less in mass category 4 (large aircraft) than expected, which corresponds to almost all single isle (narrow-body) large transport category aircraft and some smaller twin isle (wide-body) aircraft.

3.2.8. Type of Engine

The ICAO’s ADREP taxonomy uses multiple categories to differentiate the most common engine types used on all aircraft. However, the ICAO safety occurrence statistics group engines as reciprocating (piston), turboprop, and jet (which includes turbofan and turbojet engines). From Figure 8a, the most common engine in aircraft-maintenance-related accidents is the turbojet; however, the distribution is almost uniform. When compared to the ICAO safety occurrence statistics, which show statistically significantly fewer jet accidents than expected, both piston and turboprop engines are associated with aircraft-maintenance-related accidents more than expected.
Given that system component failure—powerplant was a common occurrence category, it is worthwhile investigating whether the distribution of aircraft-maintenance-related accidents in the SCF-PP category varies by engine type. Here, the number of cases for each engine type with SCF-PP was the observed data, and the original distribution of all aircraft-maintenance-related accidents by engine type was the expected. The result was statistically significant (χ2 = 117, p < 0.01) and showed that piston-engine aircraft were more likely to be involved in SCF-PP aircraft-maintenance-related accidents, occurring almost twice as often as expected (1.7 times the expected count). Jet engine aircraft were the least likely, and turboprop aircraft also had less SCF-PP cases than expected.

3.2.9. Number of Engines

In addition to the type of engines, the number of engines can also be considered. The distribution based on the number of engines for aircraft-maintenance-related accidents is shown in Figure 9a. The mode is overwhelmingly two or a twin-engine aircraft. However, when compared to the ICAO official accident statistics, the greatest difference is negative for a four-engine aircraft and positive for a twin-engine aircraft. That is, relative to the observed distribution in the ICAO official accident statistics, maintenance-related accidents involving twin-engine aircraft occur less than expected, while for a four-engine aircraft, they occur more than expected.
The prevalence of maintenance-related accidents involving four-engine aircraft, combined with fewer than expected maintenance-related accidents in heavy and very heavy aircraft, suggested that further investigation must be conducted on engine number relative to engine type. This is because there appears to be a lack of a relationship between aircraft size and engine number. As such, the distribution of maintenance-related accidents involving four-engine aircraft by engine type was compared to the expected distribution based on the ICAO accident data. The result was statistically significant (χ2 = 56, p < 0.01) and showed that aircraft with four piston engines were more often involved in aircraft-maintenance-related accidents (3.9 times the expected count), while aircraft with four jet engines were less often involved.

3.2.10. Age

Age is an interesting factor to explore, especially for maintenance-related accidents. It would be reasonable to hypothesize that older aircraft would be more likely to suffer from maintenance-related accidents. Looking at Figure 10a, the mode is when an aircraft is 5 to 10 years old. This corresponds to the time of an aircraft’s first D check, which typically occurs between 6 and 10 years. After this, the count of aircraft-maintenance-related accidents then reduces as age increases. Figure 10b compares the age of maintenance accidents to all ages from the ASN database. Here, the only category significantly below expected was 0 to 5 years old. Importantly, if the 0 to 5 years old category is excluded, the differences are no longer statistically significant. Although, accidents involving 5-to-20-year-old aircraft are less than expected, while all others are at or above expected.
The lack of more cases in the older age groups is interesting. The aging airframe problem as it is known is discussed by operators, regulators, and researchers [39]. A famous example of this, that of Aloha Airlines Flight 243, is even included in the dataset [40]. However, this appears to be an exception and not the norm. While the infamous Chalk’s Ocean Airways Flight 101 is also included [41], which is much more significant given an airframe age of 58 years, there appears to be an encouraging lack of occurrences that would warrant immediate response and recommendation.

4. The Change in Maintenance Accidents

4.1. Summary of Results

While Section 3 compared aircraft-maintenance-related accidents to “all aviation accidents” to highlight the statistically significant characteristics, the purpose of this section is to understand if aircraft-maintenance-related accidents have changed. Table 2 shows the results of the tests for independence comparing the first half of the aircraft-maintenance-related accidents (1941–1997, “older”) to the second half (1998–2019, “modern”). Of the 10 different characteristics, 9 of them are statistically significant. The type of operation is not statistically significant. Each of the statistically significant results will be discussed in the following sections.

4.2. Comparative Data

4.2.1. Fatalness

As shown in Figure 11, the fatalness of aircraft-maintenance-related accidents is lower for modern accidents compared to older accidents. When testing just the modern accidents against the expected count from all the ASN accident statistics (repeating Section 3.2.1), modern aircraft-maintenance-related accidents are even more statistically significantly less fatal than expected (χ2 = 91, p < 0.01). In Section 3.2.1., it was stated that aircraft-maintenance-related accidents were less fatal by (1.67 ± 0.16) times the expected count from the ASN accident statistics. Now, for modern accidents, the revised number is 2.39 ± 0.38. So, while all aircraft-maintenance-related accidents were less fatal one and a half times as often, modern aircraft-maintenance-related accidents are now less fatal almost two and a half times as often.

4.2.2. World Region

The comparison by world region for aircraft-maintenance-related accidents is given in Figure 12. The most significant change is for Europe, which has increased from 24 to 44. Next, Africa increased from 3 to 11. Finally, North America has reduced from 101 to 72. So, while North America has a significant number of accidents, it has reduced over time.

4.2.3. Phase of Flight

Figure 13 highlights the difference between the older and modern aircraft-maintenance-related accidents as a function of phase of flight. There has been a significant reduction in accidents during cruise, and an increase in accidents during approach, landing, and taxiing. Since there has been a change in the distribution of aircraft-maintenance-related accidents based on phase of flight, it is again worth comparing only the modern accidents to the expected distribution of all aviation accidents, which is still statistically significantly different from all aviation accidents (χ2 = 151, p < 0.01).

4.2.4. Occurrence Category

Looking at the occurrence categories (Figure 14), the modern data show a reduction in SCF-PP accidents and an increase in SCF-NP. The distribution of accidents is now closer in shape to that of the ICAO accident statistics, with more REs and ARC and less fire-related accidents (F-NI and F-POST). Modern aircraft-maintenance-related accidents, however, are still statistically significantly different from what is seen in the ICAO accident statistics (χ2 = 126, p < 0.01). This is because of the fact that system component failures still dominate aircraft-maintenance-related accidents. In contrast, according to the ICAO, the most significant OC is ARC, while the second most common is turbulence.

4.2.5. Manufacturer

The largest single difference in terms of aircraft manufacturer in modern aircraft-maintenance-related accidents is the reduction in Boeing accidents. It should be clearly stated that the primary reason for this is the collection of Douglas, McDonnell, and Boeing aircraft into one term. The older dataset includes a large number of accidents involving the DC 3. In contrast, modern Boeing transport category aircraft have a much lower proportion of aircraft-maintenance-related accidents. The next largest single difference is the increase in accidents involving Textron aircraft, both Cessna and Beech. This again is confounded by the fact that these “Textron” aircraft have become more common. So, while the absolute aircraft-maintenance-related accident count has increased, it is likely that the accident rate has not increased. These results are shown in Figure 15.

4.2.6. Mass Category

Figure 16 illustrates that there has been an increase in aircraft-maintenance-related accidents for modern small aircraft (2250 kg < ToM < 5700 kg). There is a corresponding reduction in aircraft-maintenance-related accidents for medium (5700 kg < ToM < 27,000 kg) and large (27,000 kg < ToM < 272,000 kg) aircraft. This corresponds to the decrease in Boeing-related accidents and the increase in Textron-related accidents and, hence, is not surprising. Again, traffic utilizing both these sizes of aircraft has increased, which in turn increases absolute counts while likely reducing accident rates.

4.2.7. Type of Engine

The change in aircraft powerplants over time has directly resulted in the distribution shown in Figure 17. That is, modern commercial aircraft utilize more turbine engines (turbofans and turboprops, specifically) and are less likely to utilize piston or reciprocating engines. It should be noted that piston engines are still commonly associated with general aviation activities; however, if we consider the case of Australia, the amount of scheduled commercial air transport in 2018 was just over 1.4 million hours, while flight training and aerial work were both approximately 400 thousand hours [42].

4.2.8. Number of Engine

The result for the number of engines in modern aircraft-maintenance-related accidents (Figure 18) agrees with the manufacturer (Figure 15) and mass category (Figure 16) results. That is, there is an increase in single-engine accidents, which “correlates” to small aircraft, such as those from Textron. There is also a significant reduction in aircraft-maintenance-related accidents involving four-engine aircraft. This is because of a reduction in four-engine piston accidents, with most modern four-engine accidents involving jet-powered aircraft. Similarly, single-engine turboprop aircraft have become more common.

4.2.9. Age

The results for the change in aircraft-maintenance-related accidents as a function for aircraft age shows a statistically significant change (Figure 19). The reduction in the size of the peak for each distribution could be related to the increased familiarity with type designs over time, meaning that, when a type first goes into heavy maintenance, it could be more difficult to maintain without incident. The other interesting feature is that there are more modern aircraft-maintenance-related accidents that involve old (25+ years) airframes. So, while there is a flattening of the distribution, there are also still cases that correspond to factors concerning heavy maintenance.

5. Longitudinal Study

5.1. Linear Regression

Section 4 presented a categorical change in the characteristics of aircraft-maintenance-related accidents, comparing those accidents from 1941–1997 to those from 1998–2019. The goal of this longitudinal study was to investigate how the number of accidents (and fatalities that result from them) have changed as a function of time. It is important to note that the assumption of a longitudinal study is not to suggest that results change purely as a function of time; it is just to show if there has been a statistically significant change over time. That is, there is a correlation, not a causation.
Figure 20a shows the accident count (thick line) and the accident rate (per 1000 km). It should be noted that it is more traditional to present the accident rate relative to the number of departures (movements). Unfortunately, the Airline.org dataset does not provide departure data prior to 1960 [43]. As such, distance was selected as that dataset covered 1940 to the present. The trend in the number of aircraft-maintenance-related accidents as a function of the decade is statistically significant (t = 7.8, p < 0.01), with an average decade increase of 10.1 accidents, or 1 accident per year, over the span of the study. As suggested in the previous analysis, the rate of aircraft-maintenance-related accidents has reduced, and the reduction is a statistically significant exponential trend (t = 10.1, p < 0.01), with a half-life of 27.7 years; that is, the rate of aircraft-maintenance-related accidents halves every 27.7 years. The associated 95% confidence interval is 22.3 years to 36.5 years for the half-life. As noticed, in general, we see similar trends for aircraft-maintenance-related accidents: there is no reduction in the absolute count, but, when taken relative to traffic, there is a significant reduction in the accident rate.
Interestingly, as seen in Figure 20b, fatalities do not follow the same upward trend as the accident count. Fatalities peaked in the 1990s and have since reduced. This is a great achievement in terms of safety from aircraft maintenance. While there were more total accidents, there have been less fatalities. Efforts to reduce fatalities were instigated when accident counts increase in the 1970s and 1980s. To highlight the effect of the assumed intervention, a multiple linear regression model was tested against the number of fatalities, using a traditional moderating effect. The first independent variable (X1) was the decade, and the second was a binary variable for the intervention (X2), which is 0 for 1940 to 1980 and then 1 for 1990 to 2010. Moderation also requires the product of the two variables (X3 = X1 × X2). As expected, the model fits the observed fatalities well and is statistically significant (F = 7.13, p = 0.044). The question to ask is then, what is this intervention? The incorporation of HF research from the “flight deck” into the “maintenance hangar” is a significant part of this [44]. It is noted that there was an increase in severity of maintenance-related accidents in the late 1980s and early 1990s. There are several key aspects that come into play here. The first is aircraft maintenance resource management (MRM) [45,46]. Work in this area has evolved since the 1980s and is in essence HFs in maintenance, managing multiple resources around the maintenance personnel, considering social science aspects, amongst others [46]. Also of note is the transition from MSG-1 to MSG-3 (Maintenance Steering Group) [47,48]. The fact that the more modern MSG-3 decision process was used in the design of the B757 and B767 [47], both of which only occur once in the dataset, while the B747 has eight entries. It is also at this time when technological reliability increased dramatically [49], with the evolution of engines to facilitate ETOPS.

5.2. Logistic Regression

While age was investigated in Section 3.2.10 and Section 4.2.9, there are some further objective questions that can be asked: Is the outcome of an aircraft-maintenance-related accident more likely to be fatal if the associated aircraft is older? Is the aircraft more likely to be written off (be considered damaged beyond repair) following an aircraft-maintenance-related accident if it is older? As with prior hypotheses, it would be tempting to think that both these statements would be true, again given the way in which the aging airframe problem is considered across the industry. These two questions can be answered with logistic regression. Figure 21a shows the resultant logit fitted to the fatalness data (0 = non-fatal; 1 = fatal), and interestingly, the logit predicts that an older aircraft will be less likely to be associated with a fatality, although the fit is not statistically significant (McFadden’s pseudo R2 = 0.0007; χ2 = 0.35; p = 0.55). Looking at the outcome of the aircraft-maintenance-related accident for the aircraft (Figure 21b), we see now that the logit increases with age as hypothesized, but the increase is little, suggesting almost no relationship. The corresponding hypothesis test shows that the relationship between the aircraft age, and whether the hull is lost, is statistically significant (McFadden’s pseudo R2 = 0.021, χ2 = 9.23, p = 0.002). So, we can conclude that the outcome of an aircraft-maintenance-related accident in terms of fatalness for the occupants is independent of age, while the severity of damage for the aircraft is dependent on age. That is, an older airframe is not more likely to result in a fatality; however, it is more likely to result in a hull loss. This is likely due to increased costs of maintaining and repairing older aircraft [50].

5.3. Aircraft Maintenance Fraction

As discussed in previous work [19], the Australian Transport Safety Bureau report on HFs in aircraft maintenance [51] indicated that, when looking at the proportion of aviation accidents and incidents that are the result of improper maintenance, “precise statistics are unavailable”. In previous work, it was found that the percentage of aircraft-maintenance-related accidents according to the ICAO is (2.8 ± 0.9)% [19]. The larger sample size in this current study represents a quasi-population; this provides further insight into addressing this lack of precise statistics. However, this is only for aircraft accidents. In terms of determining the proportion of incidents that are the result of improper maintenance, the ASN database is exclusively a collection of accident data, and all the data presented thus far are only concerned with accidents. As previously considered, given the database contains n accidents each year, and m aircraft-maintenance-related accidents, the proportion of m to n is the measure of interest; specifically, how this proportion as a percentage has changed over time.
When analyzing the annual values, the average aircraft-maintenance-related accident percentage is given as (2.0 ± 0.4)%. However, there is a clear difference in the data observed up to 1997 and after 1997. This coincidently corresponds to the midpoint of the dataset. It is then worth undertaking a two-sample t-test assuming unequal variance to test if these two halves of the data have the same average percentage or if they are statistically significantly different. The result of this test is that they are statistically significantly different (t = 6.8, p < 0.01). The corresponding average percentages are then (1.3 ± 0.2)% and (3.8 ± 0.7)%, respectively, for the 1941–1997 and 1998–2019 subsets of data (showed in Figure 22). That is, the percentage of all accidents, which are the result of maintenance issues in modern accidents, is nearly 3 times that of older accidents. To validate this number, and to have confidence in it, the subset of accidents that makes up the ICAO official accident statistics was analyzed. The cases both in this aircraft-maintenance-related accident dataset and the ICAO official accident statistics were extracted. The result was that 14 of the maintenance cases were included as part of the official ICAO accident statistics, which has a size of 1277; as such, the percentage of aircraft-maintenance-related accidents according to ICAO is (2.8 ± 0.9)% [19]. This agrees with the initial full-sample estimate for the ASN, within the observed statistical uncertainty. As such, we have greater confidence in concluding that, in general, approximately 1.3 percent of accidents are the result of aircraft maintenance, and this has increased since 1998 to 3.8 percent.

6. Discussion

6.1. Findings

The first significant finding to report concerns the fatalness. For all aircraft-maintenance-related accidents, they were found to be 1.67 ± 0.16 times less fatal compared to the fatalness in all ASN accidents. When looking at only modern aircraft-maintenance-related accidents (from 1998 to 2019), the fatalness reduced to (2.4 ± 0.6) times that of the ICAO official accidents. When looking at how fatalities have changed over the decades of the study, there was found to be an initial increase in fatalities from 1940 to the 1990s, followed by a significant decrease. This change in fatalness was attributed to a number of industry-wide changes and reforms, following the several decades of increasing fatalities in aircraft-maintenance-related accidents, with the Aloha Airlines Flight 243 seen as a tipping point [40].
Several interesting characteristics appeared relative to the aircraft properties, specifically mass, engine type, number of engines, and manufacturer. The aircraft maximum takeoff mass highlighted that aircraft-maintenance-related accidents are more significant for medium-sized aircraft (between 5.7 and 27 tons), in which they occurred twice as often as expected. In terms of aircraft engines, accidents involving piston and four-engine aircraft were found to occur much more often than expected. The ideal case study aircraft for these is the French Sud SE.161 Languedoc, a four-engine piston aircraft, with a MTOM = 22,940 kg, which occurs twice in the dataset, although this is a very old aircraft.
The investigation into aircraft age resulted in unexpected findings. Specifically, the intuitive hypothesis that age would result in an increase in aircraft-maintenance-related accidents was proven incorrect. The logistic regression showed there was no statistically significant relationship between age and the likelihood of an accident ending with a fatality in aircraft-maintenance-related accidents. However, older aircraft involved in aircraft-maintenance-related accidents were more likely to be written off. Similarly, when looking at the number of aircraft maintenance accidents in each age category, it was found that the 5-to-10-year age bracket had the most accidents, corresponding to the heavy maintenance timeframes of most aircraft.
The final significant finding of this study is the reporting of the proportion of all aircraft accidents that are the result of maintenance issues. Working on the assumption that the ASN is approximately representative of the total population of all aircraft accidents, and that the dataset used in this study has captured almost all aircraft-maintenance-related accidents, then the observed proportion of ASN-reported accidents that result from maintenance issues from 1941 to 2019 is (2.0 ± 0.4)%. When split into the two distinct halves, the proportion of accidents from 1941 to 1997 that are the result of maintenance-related issues is (1.3 ± 0.2)%, and for accidents from 1998 to 2019, it is (3.8 ± 0.7)%. These all compare well to the proportion of accidents in the ICAO official statistics that are the result of maintenance issues, which was found to be (2.8 ± 0.9)% [19].
Finally, it is worth considering what could be referred to as the “average” aircraft-maintenance-related accident. This is the combination of characteristics that occur most frequently. This would be a nonfatal system component failure—non-powerplant. The accident would involve a medium-sized “Boeing” twin turbojet aircraft that is 5 to 10 years old. The flight would be a domestic passenger service in North America, and the accident would occur during cruise. It should be made clear that this “average” does not exist; however, combinations using less than all 10 characteristics can be found. The more important case to consider is the statistically significant case, that is, the combination of all of the most statistically significant values that would represent the “worst case scenario”. This case would be a nonfatal system component failure—non-powerplant. The accident would involve a medium-sized “Bombardier” four-engine turboprop aircraft that is 20 to 25 years old. The flight would be an international service in North America, and the accident would occur during landing.

6.2. Assumptions and Limitations

The key limitation of this work is that it only addresses aircraft-maintenance-related accidents, and no conclusion can be made about aircraft-maintenance-related incidents. This could be considered significant because there are potentially far more incidents than accidents, and the resultant percentage of all incidents that are due to aircraft maintenance issues could be much greater than the 2 percent observed for accidents.
A great amount is being assumed about the completeness of the ASN database. It is known that there are potentially other accidents that have not been included in the ASN database. Specifically, the ASN includes 23,088 accidents, while the BAAA database contains 26,923 accidents and advertises itself as the largest database. This difference of 3835 is beyond the uncertainty associated with counting but only represents a 14% difference. This then potentially adds a further 14% uncertainty on top of the uncertainties quoted. This does not greatly affect the findings of this study. It should be noted that the ASN is much easier to work with in terms of exporting and coding data, hence the reason it was chosen; furthermore, there are dedicated codes for aircraft maintenance issues in the ASN. It is also, therefore, assumed that the missing 14% of accidents is a random sample, such that there is no potential bias resulting in significantly more aircraft-maintenance-related occurrences being omitted from what is assumed to be the “population” of aircraft-maintenance-related accidents.
In previous investigations of aviation safety occurrences [28], the potential issues with the use of MS Excel datasets has been discussed; specifically, it has been observed by the European Spreadsheet Risks Interest Group that over 90% of spreadsheets contain an error [52]. Regular error checking and data validation were undertaken to ensure no errors were introduced by the data collection, coding, cleaning, and analysis processes. For example, the initial analysis of the older and modern cases assumed that data were presented in chronological order, and as such, the older accidents were between row 2 and 100, while the modern accidents were in rows 101 to 198. This represented a limitation in the spreadsheet, and hence, all “countif” statements that assumed this fixed ordering were replaced with “countifs” statements with an additional criteria based on the year of the accident. This then meant that, if data were reordered to look at groups, all equations still produced the same results.

6.3. Further and Future Work

The most immediate direct extension to this work would be looking at specific maintenance aspects that have contributed to or caused these accidents. For example, did the accident involve the failure to comply with an airworthiness directive or service bulletin? Also, for SCFs, which specific systems and subsystems were involved. These two aspects would help target future maintenance safety research.
The deficiency in the literature previously identified included an investigation of accidents based on the type of operation, facilitating a comparison between domestic and international scheduled services. The other study not in the literature is an investigation of accidents based on the aircraft manufacturer. Both would provide insightful baselines and benchmarks to compare other post-accident analyses too.
Further work following this study will investigate covariances between characteristics. That is, the 11 different characteristics of this study will be used to see how they vary as a function of each other. For example, how fatalness varies as a function of occurrence type, how occurrence category varies as a function of phase of flight, etc. With 11 characteristics, there are 55 (11 choose 2) different permutations. All 55 will be investigated to look for covariances. The goal of this future work is to identify any latent classes in the data, that is, combinations of specific values of the different characteristics that correlate to certain types of outcomes.

7. Conclusions

This research sought to understand the characteristics of aircraft-maintenance-related accidents and how these have changed over time. In terms of how the distribution of accidents that resulted from issues associated with aircraft maintenance differ from all accidents across the aviation industry, it can be concluded that all ten characteristics considered showed statistically significant differences. Specifically, the most statistically significant differences resulted from accidents with the following characteristics:
i.
Nonfatal;
ii.
In North America;
iii.
Occurred during landing;
iv.
Involved a system component failure—non-powerplant;
v.
Flew for an international operation;
vi.
Bombardier aircraft;
vii.
Medium-sized;
viii.
Turboprop engines;
ix.
Four engines;
x.
20 to 25 years old.
Considering the distribution of accidents that result from issues associated with aircraft maintenance, nine of the ten characteristics showed a difference relative to all accidents across the aviation industry. As a result, modern aircraft-maintenance-related accidents showed more accidents with the following characteristics:
i.
Nonfatal;
ii.
In Africa;
iii.
Occurred during landing;
iv.
Involved runway excursions;
v.
In a Textron aircraft;
vi.
Small-sized;
vii.
Turboprop engines;
viii.
Had a single engine;
ix.
Old.
Looking at the number of aircraft-maintenance-related accidents and associated fatalities that reduced over time, it can be concluded that there have been statistically significant changes. Specifically, there has been an increase in accidents over the decades of the study, giving an increase of 1 accident per year. The rate of accidents per kilometer travelled showed a statistically significant decrease with a half-life of 2.77 decades. That is, the aircraft-maintenance-related accident rate halves every 27.7 years. In terms of the number of associated fatalities, a multivariate model was fitted to explain the increase in fatalities up to the 1990s, which then reduced thereafter. The model attempts to show how industry-wide reforms for the 1980s and 1990s resulted in a dramatic reduction in the number of fatalities.
With regard to the age of an aircraft in a maintenance-related accident, and how this influences the outcome (fatalness and aircraft damage) of the occurrence, there was no correlation between aircraft age and fatalness. That is, in contrast to the initial research hypothesis, an older aircraft was found to not be more likely to result in fatalities in an aircraft-maintenance-related accident. However, an older aircraft was more likely to be written off if involved in an aircraft-maintenance-related accident.
Importantly, this work was able to quantify the proportion of accidents that are associated with aircraft maintenance activities. While previous work suggest significant percentages, even as high as 12% [53], this research and the proceeding study show a much more realistic value of 2 to 3 percent. In the proceeding study, the proportion of accidents in the ICAO official accident statistics that was found to be due to maintenance issues was (2.8 ± 0.9)% [19]. This compares to the proportion for the entire ASN database presented herein, with a proportion of (2.0 ± 0.4)% of accidents being due to maintenance issues.
The limitations of the exploratory methodology meant that no direct tangible benefits to aircraft maintenance safety are presented in this research. However, the understanding gained about the nature and characteristics of aircraft-maintenance-related accidents should help inform future aircraft maintenance safety research. That is, clear aspects of aircraft maintenance that have not exhibited as much improvement can be targeted with the aid of the research findings presented herein.

Funding

This research received no external funding.

Data Availability Statement

This research utilized secondary data. All data was sourced from the Aviation Safety Network where it can be freely accessed.

Conflicts of Interest

The author declares no conflict of interest.

References

  1. Gunes, T.; Turhan, U.; Yörük Açıkel, B. Improvement of aircraft maintenance manual (AMM) for Cessna 172. Aircr. Eng. Aerosp. Technol. 2022, 94, 1078–1086. [Google Scholar] [CrossRef]
  2. Knotts, R.M.H. Civil aircraft maintenance and support fault diagnosis from a business perspective. J. Qual. Maint. Eng. 1999, 5, 335–348. [Google Scholar] [CrossRef]
  3. Goranson, U.G. Fatigue issues in aircraft maintenance and repairs. Int. J. Fatigue 1998, 20, 413–431. [Google Scholar] [CrossRef]
  4. EASA. Official Journal of the European Union: Commission Regulation (EU) No 1321/2014; European Aviation Safety Agency: Cologne, Germany, 2014.
  5. FAA. Maintenance Programs for US-Registered Aircraft Operated under 14 CFR Part 129 FAA; Federal Aviation Administration: Washington, DC, USA, 2009.
  6. CASA. Maintenance of Aircraft—General Requirements CAAP 100.5-01 v1.2; Civil Aviation Safety Authority: Canberra, Australia, 2022.
  7. Wang, L.; Sun, R.; Yang, Z. Analysis and evaluation of human factors in aviation maintenance based on fuzzy and AHP method. In Proceedings of the 2009 IEEE International Conference on Industrial Engineering and Engineering Management, Hong Kong, China, 8–11 December 2009; pp. 876–880. [Google Scholar]
  8. Rajee Olaganathan, D.; Miller, M.; Mrusek, B.M. Managing safety risks in airline maintenance outsourcing. Int. J. Aviat. Aeronaut. Aerosp. 2020, 7, 7. [Google Scholar] [CrossRef]
  9. Bağan, H.; Gerede, E. Use of a nominal group technique in the exploration of safety hazards arising from the outsourcing of aircraft maintenance. Saf. Sci. 2019, 118, 795–804. [Google Scholar] [CrossRef]
  10. Insley, J.; Turkoglu, C. A contemporary analysis of aircraft maintenance-related accidents and serious incidents. Aerospace 2020, 7, 81. [Google Scholar] [CrossRef]
  11. Illankoon, P.; Tretten, P.; Kumar, U. A prospective study of maintenance deviations using hfacs-me. Int. J. Ind. Ergon. 2019, 74, 102852. [Google Scholar] [CrossRef]
  12. Lestiani, M.E.; Yudoko, G.; Purboyo, H. Developing a conceptual model of organizational safety risk: Case studies of aircraft maintenance organizations in indonesia. Transp. Res. Procedia 2017, 25, 136–148. [Google Scholar] [CrossRef]
  13. Dalkilic, S. Improving aircraft safety and reliability by aircraft maintenance technician training. Eng. Fail. Anal. 2017, 82, 687–694. [Google Scholar] [CrossRef]
  14. Hobbs, A.; Williamson, A. Skills, rules and knowledge in aircraft maintenance: Errors in context. Ergonomics 2002, 45, 290–308. [Google Scholar] [CrossRef]
  15. Floyd, H.L. Maintenance errors as cause for electrical injuries-what we can learn from aviation safety. In Proceedings of the 2019 IEEE IAS Electrical Safety Workshop (ESW), Jacksonville, FL, USA, 4–8 March 2019; pp. 1–6. [Google Scholar]
  16. PeriyarSelvam, U.; Tamilselvan, T.; Thilakan, S.; Shanmugaraja, M. Analysis on costs for aircraft maintenance. Adv. Aerosp. Sci. Appl. 2013, 3, 177–182. [Google Scholar]
  17. Papakostas, N.; Papachatzakis, P.; Xanthakis, V.; Mourtzis, D.; Chryssolouris, G. An approach to operational aircraft maintenance planning. Decis. Support Syst. 2010, 48, 604–612. [Google Scholar] [CrossRef]
  18. IATA MCTG. Airline Maintenance Cost Executive Commentary; International Air Transport Association: Montreal, QC, Canada, 2019. [Google Scholar]
  19. Khan, F.N.; Ayiei, A.; Murray, J.; Baxter, G.; Wild, G. A preliminary investigation of maintenance contributions to commercial air transport accidents. Aerospace 2020, 7, 129. [Google Scholar] [CrossRef]
  20. Wild, G.; Murray, J.; Baxter, G. Exploring civil drone accidents and incidents to help prevent potential air disasters. Aerospace 2016, 3, 22. [Google Scholar] [CrossRef] [Green Version]
  21. ICAO. Manual of Aircraft Accident and Incident Investigation: Reporting; International Civil Aviation Organization: Montreal, QC, Canada, 2013; Volume 9756. [Google Scholar]
  22. Ranter, H. Aviation Safety Network Database. Available online: https://aviation-safety.net/database/ (accessed on 13 August 2020).
  23. Hubert, R. Bureau of Aircraft Accident Archives. Available online: https://www.baaa-acro.com/ (accessed on 13 August 2020).
  24. ICAO. Aviation Occurrence Categories–Definition and Usage Notes; International Civil Aviation Organization: Montreal, QC, Canada, 2011. [Google Scholar]
  25. Wild, G.; Gavin, K.; Murray, J.; Silva, J.; Baxter, G. A post-accident analysis of civil remotely-piloted aircraft system accidents and incidents. J. Aerosp. Technol. Manag. 2017, 9, 157–168. [Google Scholar] [CrossRef]
  26. Kharoufah, H.; Murray, J.; Baxter, G.; Wild, G. A review of human factors causations in commercial air transport accidents and incidents: From to 2000–2016. Prog. Aerosp. Sci. 2018, 99, 1–13. [Google Scholar] [CrossRef]
  27. Wild, G.; Pollock, L.; Abdelwahab, A.K.; Murray, J. The need for aerospace structural health monitoring: A review of aircraft fatigue accidents. Int. J. Progn. Health Manag. 2021, 12, 1–16. [Google Scholar] [CrossRef]
  28. Ayiei, A.; Murray, J.; Wild, G. Visual flight into instrument meteorological condition: A post accident analysis. Safety 2020, 6, 19. [Google Scholar] [CrossRef] [Green Version]
  29. Oster, C.V.; Strong, J.S.; Zorn, K. Why Airplanes Crash: Causes of Accidents Worldwide. In Proceedings of the 51st Annual Transportation Research Forum, Arlington, VA, USA, 11–13 March 2010. [Google Scholar]
  30. Huang, C. Further improving general aviation flight safety: Analysis of aircraft accidents during takeoff. Coll. Aviat. Rev. Int. 2020, 38, 1. [Google Scholar] [CrossRef]
  31. Balachandran, S.; Atkins, E.M. Flight safety assessment and management during takeoff. In Proceedings of the AIAA Infotech@ Aerospace (I@ A) Conference, Boston, MA, USA, 19–22 August 2013; p. 4805. [Google Scholar]
  32. Wagner, D.C.S.; Barker, K. Statistical methods for modeling the risk of runway excursions. J. Risk Res. 2014, 17, 885–901. [Google Scholar] [CrossRef]
  33. Chang, Y.-H.; Yang, H.-H.; Hsiao, Y.-J. Human risk factors associated with pilots in runway excursions. Accid. Anal. Prev. 2016, 94, 227–237. [Google Scholar] [CrossRef] [PubMed]
  34. Choi, Y.-J.; Ahn, J.-H.; Yoo, K.I.; Park, J.-G. A case study on the occurrence category of aircraft accidents and serious incidents in korea in the 2000’s. J. Korean Soc. Aviat. Aeronaut. 2013, 21, 119–125. [Google Scholar] [CrossRef]
  35. Casey, D. Busiest Routes in the World—The Top 100. 2019. Volume 22. Available online: https://aviationweek.com/air-transport/airports-networks/busiest-routes-world-top-100 (accessed on 17 May 2023).
  36. Evans, J.K. Differences in Characteristics of Aviation Accidents during 1993–2012 Based on Flight Purpose; NTRS-NASA Technical Reports Server: Washington, DC, USA, 2016.
  37. Boeing. Statistical Summary of Commercial Jet Airplane Accidents; Boeing Commercial Airplanes: Seattle, WA, USA, 2019. [Google Scholar]
  38. Wild, G. Airbus a32x vs boeing 737 safety occurrences. IEEE Aerosp. Electron. Syst. Mag. 2023; Early Access. [Google Scholar]
  39. Brannen, E. The problem of aging aircraft: Is mandatory retirement the answer comment. J. Air L. Com. 1991, 57, 425. [Google Scholar]
  40. Hendricks, W.R. The Aloha Airlines Accident-A New Era for Aging Aircraft; Springer: Berlin/Heidelberg, Germany, 1991; pp. 153–165. [Google Scholar]
  41. Kaye, K. Seaplane’s Left Wing had Fatigue Cracks, NTSB Report Says; Knight Ridder Tribune News Service: Chicago, IL, USA, 2006; p. 1. [Google Scholar]
  42. BITRE. Australian Aircraft Activity 2018. Department of Infrastructure Transport Cities and Regional Development; Bureau of Infrastructure Transport and Regional Economics: Canberra, Australia, 2019.
  43. Airlines for America. Impact. Available online: https://www.airlines.org/impact/ (accessed on 13 August 2020).
  44. Gramopadhye, A.K.; Drury, C.G. Human factors in aviation maintenance: How we got to where we are. Int. J. Ind. Ergon. 2000, 26, 125–131. [Google Scholar] [CrossRef]
  45. Ettkin, L.P.; Jahnig, D.G. Adapting MRP-II for maintenance resource-management can provide a strategic advantage. Ind. Eng. 1986, 18, 50. [Google Scholar]
  46. Taylor, J.C. The evolution and effectiveness of maintenance resource management (MRM). Int. J. Ind. Ergon. 2000, 26, 201–215. [Google Scholar] [CrossRef]
  47. Bradbury, S.J. MSG-3 as Viewed by the Manufacturer (Was it Effective?). In Proceedings of the SAE Aerospace Congress & Exposition, Long Beach, CA, USA, 15–18 October 1984. [Google Scholar]
  48. Anderson, R.W. Safety Enhancements Available by Converting MSG-2 Aircraft Maintenance Programs to MSG-3. In Proceedings of the 1999 Advances in Aviation Safety Conference, Daytona Beach, FL, USA, 13–15 April 1999. [Google Scholar]
  49. Taylor, R.W. Extended range operation of twin-engine commercial airplanes. SAE Trans. 1985, 94, 959–970. [Google Scholar]
  50. Mofokeng, T.; Mativenga, P.T.; Marnewick, A. Analysis of aircraft maintenance processes and cost. Procedia CIRP 2020, 90, 467–472. [Google Scholar] [CrossRef]
  51. ATSB. An Overview of Human Factors in Aviation Maintenance AR-2008-055; Australian Transport Safety Bureau: Canberra, Australia, 2018.
  52. Parker, M. Humble Pi: A Comedy of Maths Errors; Penguin Books Limited: London, UK, 2019. [Google Scholar]
  53. McDonald, N.; Corrigan, S.; Daly, C.; Cromie, S. Safety management systems and safety culture in aircraft maintenance organisations. Saf. Sci. 2000, 34, 151–176. [Google Scholar] [CrossRef]
Figure 1. Results for the fatalness of aircraft-maintenance-related accidents: (a) the absolute count observed; (b) the relative percentage difference between the observed count and expected count (ICAO official accident statistics).
Aerospace 10 00689 g001
Figure 2. Results for the region of occurrence for aircraft-maintenance-related accidents: (a) the absolute count observed; (b) the relative percentage difference between the observed count and the expected count (ASN accident statistics).
Aerospace 10 00689 g002
Figure 3. Results for the phase of flight in which aircraft-maintenance-related accidents occur: (a) the absolute count observed; (b) the relative percentage difference between the observed count and the expected count (ASN accident statistics).
Aerospace 10 00689 g003
Figure 4. Results for the occurrence category of aircraft-maintenance-related accidents: (a) the absolute count observed; (b) the relative percentage difference between the observed count and the expected count (ICAO accident statistics).
Aerospace 10 00689 g004
Figure 5. Results for the type of operation for aircraft-maintenance-related accidents: (a) the absolute count observed; (b) the relative percentage difference between the observed count and the expected count (ASN accident statistics).
Aerospace 10 00689 g005
Figure 6. Results for the manufacturers of aircraft types involved in aircraft-maintenance-related accidents: (a) the absolute count observed; (b) the relative percentage difference between the observed count and the expected count (ASN accident statistics).
Aerospace 10 00689 g006
Figure 7. Results for the mass category of aircraft involved in aircraft-maintenance-related accidents: (a) the absolute count observed; (b) the relative percentage difference between the observed count and the expected count (ICAO accident statistics).
Aerospace 10 00689 g007
Figure 8. Results for the type of engine associated with aircraft-maintenance-related accidents: (a) the absolute count observed; (b) the relative percentage difference between the observed count and the expected count (ICAO accident statistics).
Aerospace 10 00689 g008
Figure 9. Results for the number of engines on an aircraft involved in aircraft-maintenance-related accidents: (a) the absolute count observed; (b) the relative percentage difference between the observed count and the expected count (ICAO accident statistics).
Aerospace 10 00689 g009
Figure 10. Results for the age of aircraft involved in aircraft-maintenance-related accidents: (a) the absolute count observed; (b) the relative percentage difference between the observed count and the expected count (ICAO accident statistics).
Aerospace 10 00689 g010
Figure 11. Results for the fatalness of aircraft-maintenance-related accidents, comparing older (1941–1997) accidents to modern (1998–2019) accidents.
Aerospace 10 00689 g011
Figure 12. Results for the world region of aircraft-maintenance-related accidents, comparing older (1941–1997) accidents to modern (1998–2019) accidents.
Aerospace 10 00689 g012
Figure 13. Results for the phase of flight in which aircraft-maintenance-related accidents occur, comparing older (1941–1997) accidents to modern (1998–2019) accidents.
Aerospace 10 00689 g013
Figure 14. Results for the occurrence category of aircraft-maintenance-related accidents, comparing older (1941–1997) accidents to modern (1998–2019) accidents.
Aerospace 10 00689 g014
Figure 15. Results for the manufacturers of aircraft types involved in aircraft-maintenance-related accidents, comparing older (1941–1997) accidents to modern (1998–2019) accidents.
Aerospace 10 00689 g015
Figure 16. Results for the mass category associated with aircraft-maintenance-related accidents, comparing older (1941–1997) accidents to modern (1998–2019) accidents.
Aerospace 10 00689 g016
Figure 17. Results for the type of engine associated with aircraft-maintenance-related accidents, comparing older (1941–1997) accidents to modern (1998–2019) accidents.
Aerospace 10 00689 g017
Figure 18. Results for the number of engines of aircraft involved in aircraft-maintenance-related accidents, comparing older (1941–1997) accidents to modern (1998–2019) accidents.
Aerospace 10 00689 g018
Figure 19. Results for the age of aircraft involved in aircraft-maintenance-related accidents, comparing older (1941–1996) accidents to modern (1997–2019) accidents.
Aerospace 10 00689 g019
Figure 20. Results for the trends over time for (a) accidents and accident rate (per aircraft kilometer flow); (b) fatalities per decade, actual and predicted by the two-parameter model.
Aerospace 10 00689 g020
Figure 21. Results for the logistic regression investigating the effect of aircraft age on (a) fatalness of the accident (0 = no fatalities; 1 = fatalities); (b) category of the accident based on aircraft fate (0 = aircraft repaired; 1 = aircraft damaged beyond repair).
Aerospace 10 00689 g021
Figure 22. The percentage of all accidents in the ASN database that have been identified as being aircraft-maintenance-related accidents each year from 1941 to 2019.
Aerospace 10 00689 g022
Table 1. Pearson’s Chi squared test for goodness of fit results comparing aircraft-maintenance-related accidents to all accidents.
FatalnessRegionPoF 1OC 2OperationManufactureMassET 3#E 4Age
χ29511720563932.892.614634.7108118
ν1451151442414
p<0.01<0.01<0.01<0.01<0.01<0.01<0.01<0.01<0.01<0.01
Reject?YesYesYesYesYesYesYesYesYesYes
ExpectedASNASNASNICAOASNASNICAOICAOICAOASN
1 Phase of flight. 2 ICAO occurrence category. 3 Engine type. 4 Number of engines.
Table 2. Pearson’s Chi squared test for independence results, comparing older (1941–1997) aircraft-maintenance-related accidents to modern (1998–2019) aircraft-maintenance-related accidents.
FatalnessRegionPoF 1OC 2OperationManufactureMassET 3#E 4Age
χ217.816.519.921.84.8176.110.174.621.033.0
ν145861432314
p<0.01<0.01<0.01<0.010.57<0.010.02<0.01<0.01<0.01
Reject?YesYesYesYesNoYesYesYesYesYes
1 Phase of flight. 2 ICAO occurrence category. 3 Engine type. 4 Number of engines.
Disclaimer/Publisher’s Note: The statements, opinions and data contained in all publications are solely those of the individual author(s) and contributor(s) and not of MDPI and/or the editor(s). MDPI and/or the editor(s) disclaim responsibility for any injury to people or property resulting from any ideas, methods, instructions or products referred to in the content.

