Article

Decision Science-Driven Assessment of Ti Alloys for Aircraft Landing Gear Beams

by
Ramachandra Canumalla
1,*,† and
Tanjore V. Jayaraman
2,*,†
1
Weldaloy Specialty Forgings, Warren, MI 48089, USA
2
Department of Mechanical Engineering, United States Air Force Academy, CO 80840, USA
*
Authors to whom correspondence should be addressed.
These authors contributed equally to this work.
Aerospace 2024, 11(1), 51; https://doi.org/10.3390/aerospace11010051
Submission received: 30 November 2023 / Revised: 1 January 2024 / Accepted: 2 January 2024 / Published: 4 January 2024
(This article belongs to the Section Aeronautics)

Abstract

:
Titanium alloys, with their low density, exceptional mechanical properties, and outstanding corrosion resistance, play a vital role in various aerospace applications. Our decision science-driven assessment focused on metastable β, near-β, α + β, and near-α Ti alloys for landing gear applications, integrating multiple-attribute decision-making (MADM) methods, principal component analysis (PCA), and hierarchical clustering (HC) is based on current literature. The ranks of the alloys evaluated by diverse MADM methods were consistent. The methodology identifies five top-ranked Ti alloys assists and verifies the guidelines for alloy design. The top-ranked alloy, Ti1300-BM-nano-α (alloy chemistry: Ti-5Al-4V-4Mo-3Zr-4Cr, solution treatment: 800 °C for 1 h followed by air cooling—solution treated below β transus, and aging: 500 °C for 4 h followed by air cooling), stands out with a percentage elongation (%EL) ~3.3 times greater than the benchmark or goal (density, d = ~4.6 g/cm3; yield strength YS = ~1250 MPa; %El = ~5), while maintaining similar density and yield strength. The analyses underline that metastable β Ti alloys comprising globular primary α + trans β matrix coupled with α precipitates in trans β are the base optimal microstructure to fine-tune using thermomechanical processing for aircraft landing gear applications.

1. Introduction and Background

Air passenger growth is forecast to be from 4 billion to 8 billion in the coming 20 years [1]. About 40,000 deliveries of new aircraft are needed to meet the projected growth [2,3]. This would cost 16 trillion USD for the new aircraft together with maintenance, repair, and overhaul (MRO) by 2039 [2,3]. Thus, this huge growth is sustainable only when there is a declining cost of travel and reduced emissions, which means a reduction in fuel consumption [4]. Reduction in fuel consumption is possible by reducing the weight of several aircraft parts. The aircraft landing gear, a crucial component, presents considerable opportunities to save on weight. The weight of the landing gear is about 3% to 5% of the aircraft’s takeoff weight (ranging from 150,000 to 600,000 lb approximately) [5]. Thus, the landing gear weight could be in the range of 4500 lb to 30,000 lb approximately, depending on the weight of the aircraft, and this is a dead weight during the entire flight, which is actively used only during the taxiing, takeoff, and landing. Over the years, significant work has been in progress towards landing gear beam structural optimization coupled with a reduction in weight by replacing the current relatively heavy ultrahigh-strength steels AeroMet 100, 300M, and 4340M that have been serving the aviation industry historically for several decades with lighter, stronger, tougher, and fatigue- and corrosion-resistant materials [6,7,8,9]. It would also reduce the costs due to the environmentally undesirable corrosion-protective coatings needed for the existing 300M and 4340M landing gear materials [9]. The landing gear business is part of the aircraft industry growth discussed above. The commercial aircraft landing gear market was valued at 19 billion USD in 2021 and is likely to grow at a compound annual growth rate (CAGR) of 4.28% [10]. At this CAGR, it will be about 40 billion USD or more by 2039. Thus, with this motivation, efforts have been made to zoom down to lighter materials with a superior combination of mechanical properties to replace the heavier current ones.
The selection of materials for landing gear, a critical component of an aircraft, must meet the stringent criteria for performance and reliability, including but not limited to high strength and load-carrying capacity, high fatigue resistance, high shock absorption, good oxidation, and corrosion resistance, and so forth, is challenging. Material selection, a comprehensive process aiming to identify the most suitable material from a list of materials that are best suited for a given design and application, typically involves balancing compromises between mechanical, physical, chemical, etc. properties along with considerations like cost, availability, environmental impact, and so on [11]. Ashby’s material-selection approach, commonly known as the material’s property chart approach, is widely employed [11,12,13].
Using Ashby’s approach and the Cambridge Engineering Selector (CES) software, one could arrive very broadly at titanium alloys for specific applications [13]. However, once zoomed down to Ti alloys, it is imperative to focus on choosing the appropriate class of Ti alloys from various classes of these alloys. Typically, Ti alloys are classified as α, near-α, α + β, and β (near-β, metastable β, and stable β), respectively, depending upon the type and amount of alloying elements added to stabilize either the α or β phase(s) or both [14]. Each class of these alloys has distinctive characteristics [14,15,16,17]: (i) α alloys have good strength at elevated temperatures, good weldability, and fair fabricability, but they do not respond to heat treatment; (ii) α + β alloys, on the other hand, have good thermomechanical and heat-treatment response to obtain the desired volume/weight fractions, size and morphology of α and β phases, good thermal stability, fair-to-good fabricability, and generally poor weldability; and (iii) near-β and metastable β alloys are amenable to heat treatment and have excellent fabricability and good weldability in annealed conditions, but poor creep strength. Further, it is essential to mention that many research articles, including reviews [18,19,20,21,22,23,24,25,26,27] have shown excellent correlations of processing, microstructure, and properties of different classes of titanium alloys and applications in many aircraft parts. For example, most of the aircraft landing gear parts have long been produced from Ti alloys, viz., Ti5Al5V5Mo1Cr1Fe (VT-22 or BT-22), a basis for Ti-5553, is widely used in landing gear, load-bearing fuselage components, and high-lift devices of Russian wide-body aircraft; and Ti55531 with the addition of 1 wt.%Zr is used in Airbus A380 landing gear parts [27]. However, not much has been published on titanium alloy selection for some targeted applications. Applying Ashby techniques, the selection was narrowed down to metastable β, a few near-β, some α + β, and near-α Ti alloys as possible alloys [28]. After narrowing down a set of alloys, it is prudent to rank these alloys or variants (including the research alloys) based on some simple but important properties or attributes, select the top-ranked alloys or variants, and then generate all the data required extensively in a quicker and more cost-effective and sensible way on those limited top ranked alloys/variants than evaluating every alloy for all the requirements for a targeted application in that class, as described elsewhere [29,30,31,32,33]. The typical benchmark (or goal requirements) for landing gear applications includes yield strength ≥ ~1250 MPa, ultimate tensile strength ≥ ~1300 MPa, elongation ≥ ~5%, fatigue limit ≥ ~620 MPa, fracture toughness ≥ ~45 MPam1/2, and so forth [7,8,9,27].
In this paper, we assess the metastable β, near-β, α + β, and near-α Ti alloys apt for aircraft landing gear in the current literature by integrating multiple-attribute decision-making (MADM) methods with principal component analysis (PCA) and hierarchical clustering (HC). MADM finds applications in various industries, including but not limited to construction, logistics, management, manufacturing, transportation, and so forth [34,35]. It refers to making preference decisions over the available alternatives (list of materials) characterized by multiple, usually conflicting attributes or properties [36,37]. PCA is a powerful tool for transforming a multidimensional data set into two dimensions [38,39]. HC groups the alloys based on the degree of similarities or differences and visually presents a dendrogram. A combination of 10 MADM methods sorts and ranks a list of 32 alloy variants (or data points) from the alloy classes, namely, metastable β, near-β, α + β, and near-α alloys. The ranks from various MADM methods are interpreted and correlated by PCA and HC. The decision science-driven methodology, seamlessly combining MADM, PCA, and HC, provides valuable insights for assessing and selecting Ti-based alloys for aircraft landing gear beams and other parts depending on the design requirements and is the novelty of this investigation.

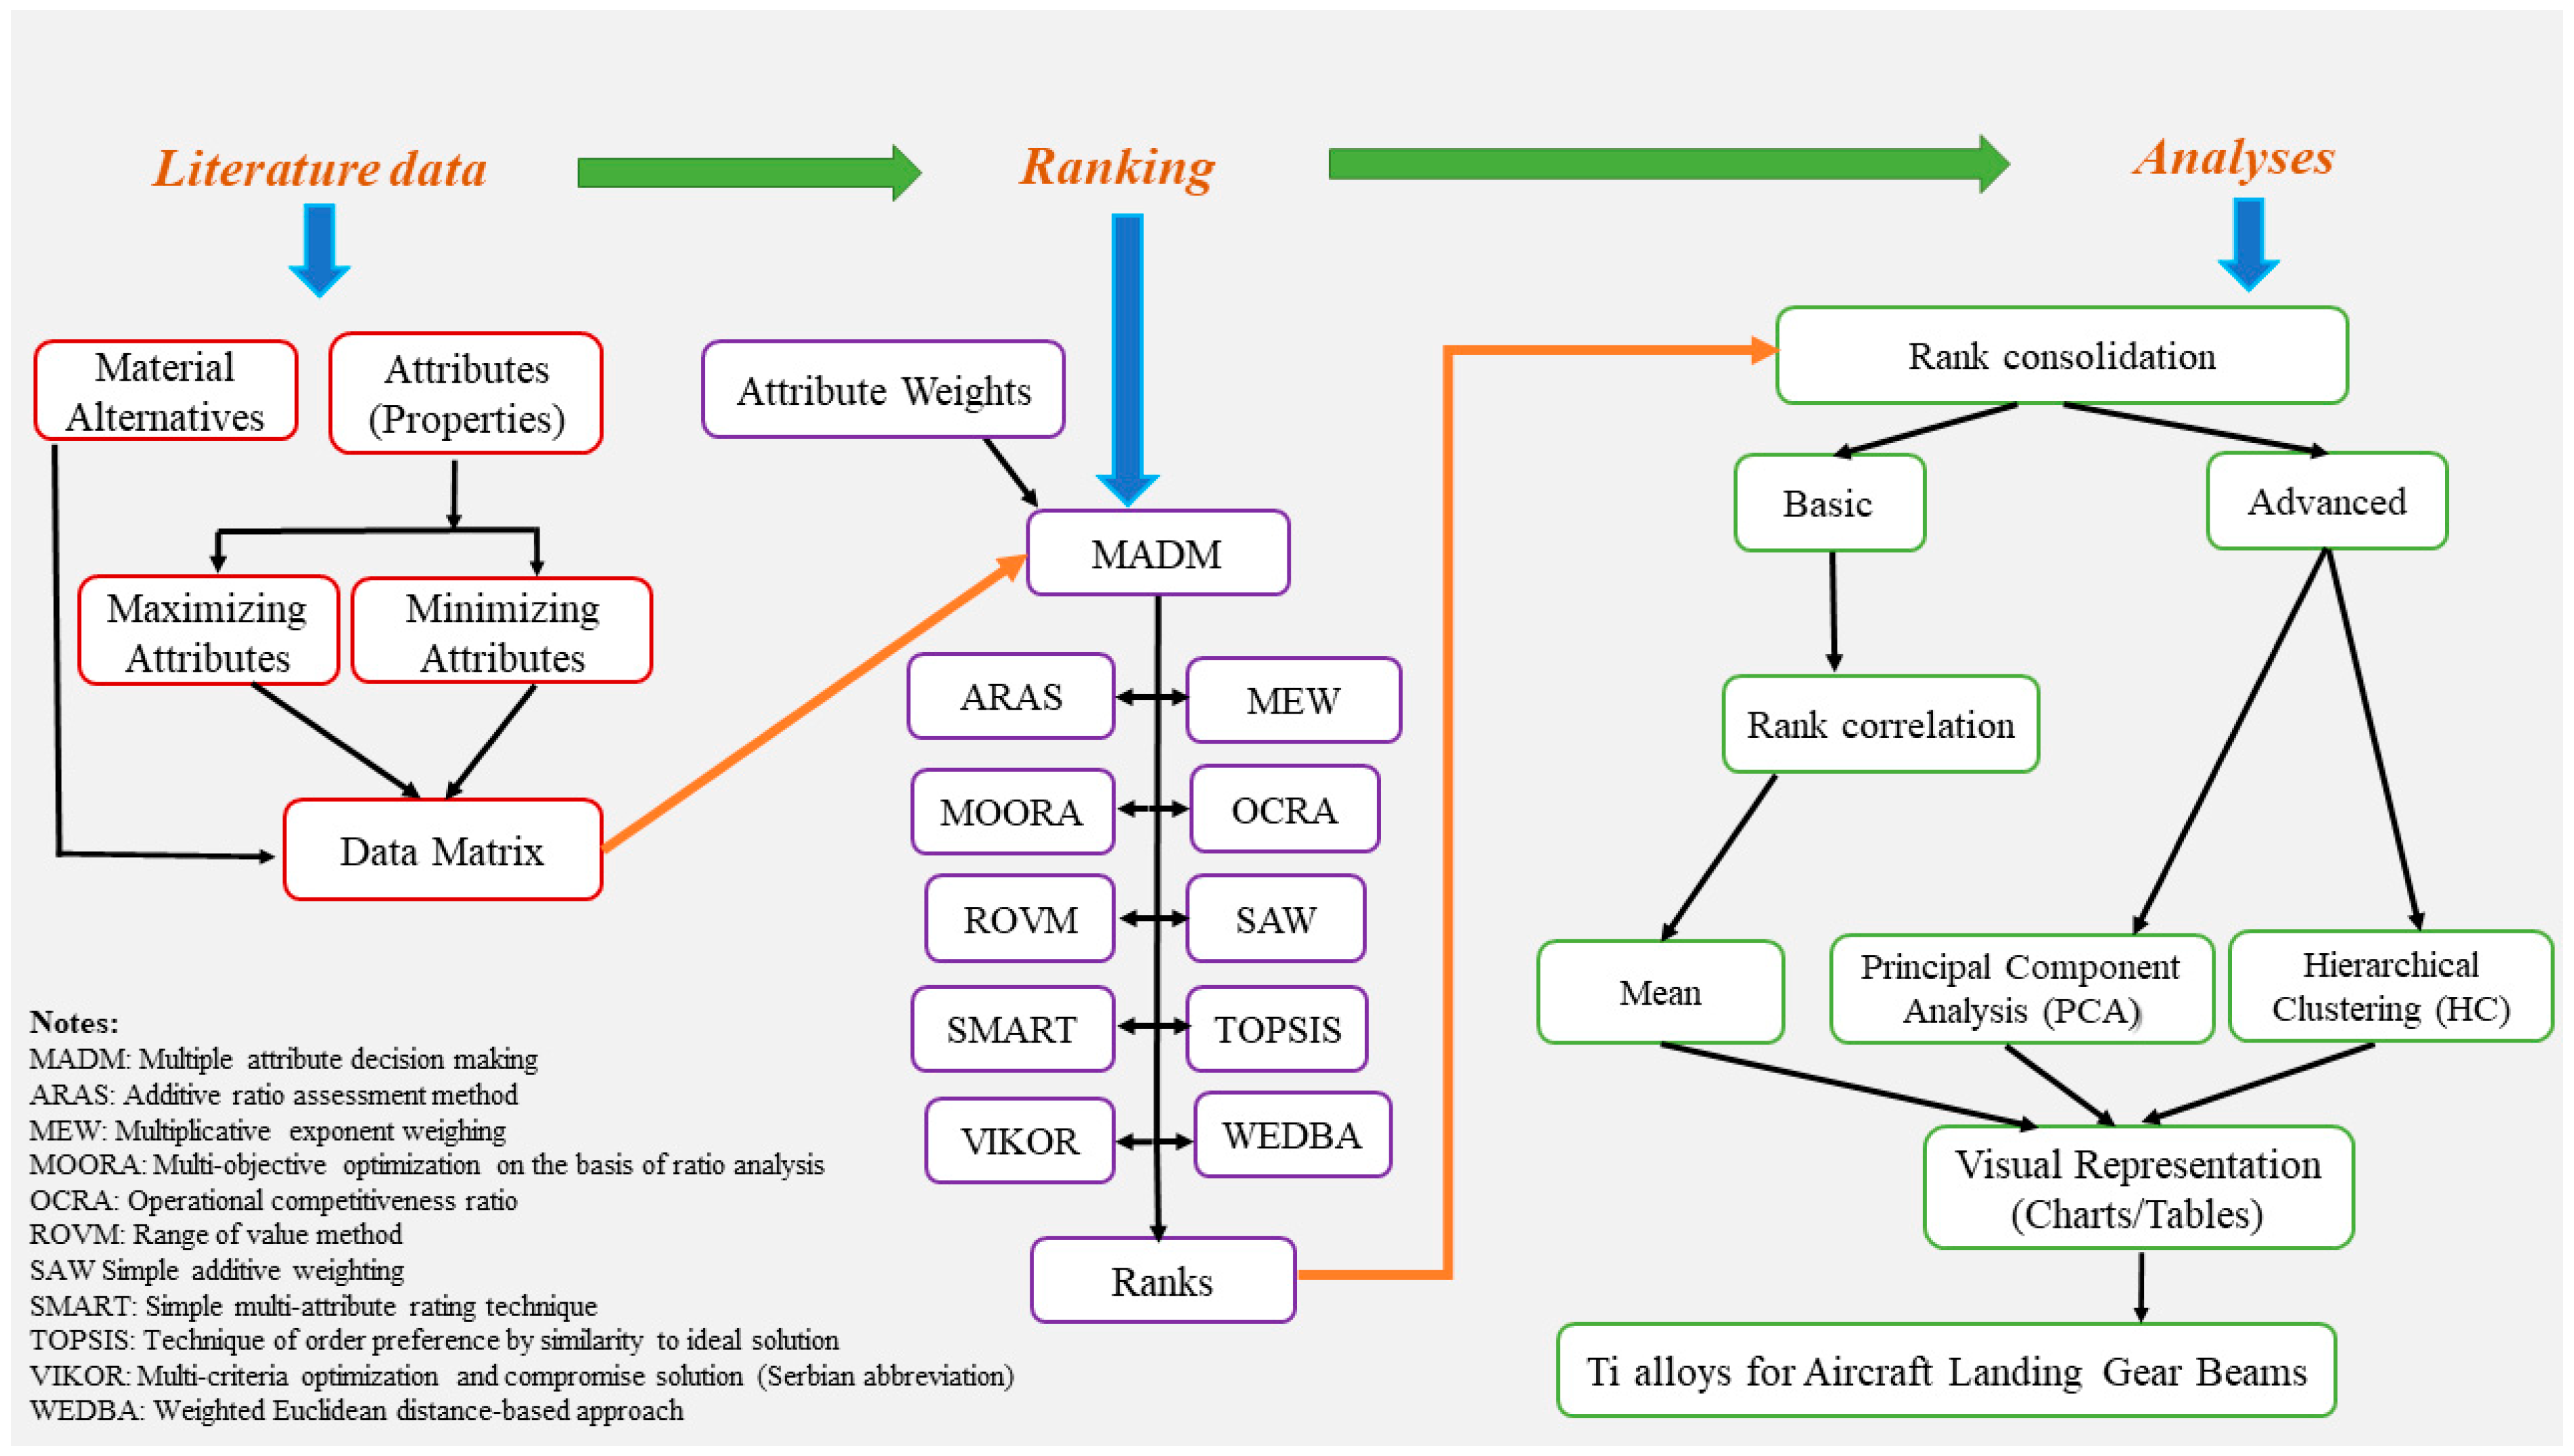
2. Assessment Methodology

Figure 1 presents a flowchart of the novel methodology for decision science-driven assessment of the metastable β, near-β, α + β, and near-α Ti alloys available in the literature for applications in aircraft landing gear beams. The method consisted of three distinct stages: (i) literature data (compilation of the literature data), (ii) ranking (application of MADM methods to rank the alloys), and (iii) analyses (consolidation of the ranks by basic and advanced statistical techniques). Lastly, we identify/recommend potential Ti alloys with a superior combination of properties for aircraft landing gear beams.
We compiled a list of Ti alloys (32 alloys/variants) and their properties from the literature [8,16,40,41,42,43,44,45,46,47,48,49,50,51,52,53,54,55,56,57,58,59]. Table 1 presents alloy chemistry in weight % (the nominal chemical composition of the alloy); alloy type―metastable β, α + β, near-β, or near-α alloys; molybdenum equivalent; solution treatment, which includes forging and solution treatment temperatures followed by cooling conditions; aging, which includes aging temperature, dwell time, and cooling conditions; matrix, other phases, and alloy designation (a unique identifier assigned for the current study). To easily identify the alloy type, the background of table rows is highlighted (i.e., color-coded). Table 2 presents their properties or attributes, namely, density (d) in g/cm3, yield strength (YS) in MPa, ultimate tensile strength (UTS) in MPa, elongation (%EL), and reduction in area (%RA). The list of 32 alloys (alternatives) and the properties d, YS, and %El (attributes) formed the data matrix (columns highlighted in the green background in Table 2).
We evaluated the ranks of the data matrix by several MADM methods. Making preference decisions over the available alternatives that are often characterized by multiple and usually conflicting attributes is MADM [34,36,37]. MADM constitutes not only the data matrix (alternatives and attributes) but also the attribute weights, which quantify the relative importance of the attributes [36]. We evaluated two types of attribute weights: (a) objective—a mathematical model quantifies the relative weights of the attributes; and (b) subjective—experts and designers quantify the relative weights of the attributes. The ten MADM methods identified for the investigation are as follows: additive ratio assessment method (ARAS) [60,61], multiplicative exponent weighting (MEW) [36,62], multi-objective optimization based on ratio analysis (MOORA) [63,64], operational competitiveness ratio (OCRA) [65,66], range-of-value method (ROVM) [67,68], simple additive weighting (SAW) [36,37], simple multi-attribute rating technique (SMART) [36,69], technique of order preference by similarity to ideal solutions (TOPSIS) [36,70], multi-criteria optimization and compromise solution (VIKOR, a Siberian abbreviation) [71,72], and weighted Euclidean distance-based approach (WEDBA) [37,73]. The modus operandi of the MADM methods was soft-coded in Microsoft Excel (version 2311).
Each MADM method applies a unique mathematical aggregation procedure to rank the alternatives; consequently, the ranks evaluated by the various techniques are likely to deviate. We evaluated Spearman’s correlation coefficients to quantify the differences (or similarities) among the ranks from the ten MADM methods [74,75]. The ranks obtained by various MADM methods were consolidated by taking the mean (average) and by principal component analysis (PCA) as well [38,76,77]. PCA, a multivariate technique, reduces the dimensionality of the data set consisting of several variables to a new set of variables by orthogonal transformation. The new set of variables, commonly termed principal components (PCs), are ordered such that the first few PCs (usually one or two) retain most variations in the original data. Hierarchical clustering (HC) groups the alternatives (metastable β, α + β, and near-α Ti alloys) based on the degree of similarities and visually presents a dendrogram. A dendrogram clusters alternatives that are similar to each other [78], geared by analyses of their application as aircraft landing gears. The statistical analyses were conducted using the commercial software Minitab® 21.

3. Results and Discussion

Table 3 presents the literature data’s descriptive statistics of the alloy properties, along with the benchmark or goal properties for landing gear applications. The basic statistics of the literature data reveal the following. Firstly, the d, YS, %El, and UTS are reported for almost all the alloys. Secondly, the mean value of YS and %El is somewhat close to the benchmark, which indicates the possibility of a certain number of alloys having a combination of properties better than the benchmark. Lastly, since all 32 alloys have their d, YS, and %El reported, we performed the decision science-driven assessment only on these three properties.
The list of 32 alloys (alternatives) and the properties d, YS, and %El (attributes) formed the data matrix (columns highlighted in the green background in Table 2). For the targeted applications in aircraft landing gear beams, a combination of low d, high YS, and high %EL at ambient temperature is desirable [8,9]. Hence, in the parlance of MADM, d is a minimizing attribute (lower values are better), while YS and %EL are maximizing attributes (higher values are better). The objective attribute weights, evaluated by Shannon’s entropy method [79], are ~0.1% for d, ~3.6% for YS, and ~96.3% for %EL. The attribute weights evaluated by Shannon’s entropy method are data-driven and strongly depend on the relative range of the individual attributes [79], which is evident upon comparing the range (i.e., maximum–minimum from Table 3) for d (~0.6), YS (~754), and %EL (~18). Thus, the objective attribute weights are skewed for the intended application. Since the importance of d cannot be ignored in aerospace, the data-driven objective weights are not applicable. On the contrary, the subjective attribute weights—~10% for d, ~60% for YS, and ~30% for %EL—appear apt, a decision made with a deep understanding of these materials for the intended application. Consequently, only subjective attribute weights were applied in MADM rank analysis. These attribute weights could be different for distinct parts depending upon the inputs from the designer for a specific part to run the analysis for ranking.
Figure 2 shows the ranks of the alloys evaluated by the ten MADM methods. The alloys ranked 1, 2, and so on are considered top-ranked or best alloys. Since each MADM method applies a unique mathematical aggregation procedure to sort the alternatives, the ranks evaluated by various methods are likely to deviate, as evident from the figure. For example, the MADM methods assign similar ranks (31 or 32) to Ti-1023-483Eβ-nano-α. Similarly, the MADM methods rank Ti1300-BM-nano-α 1 or 2 or 5 (green-shaded regions in the graph). On the contrary, the ranks of most of the alloys, e.g., VT8-L-100-α-Col and Ti64, evaluated by the various MADM methods differ considerably (orange-shaded regions in the graph). Table 4 presents Spearman’s correlation coefficients (Sρ) that quantify the differences (or similarities) among the ranks evaluated by the ten MADM methods. To substantiate, the correlation between SMART and SAW is 0.857, which indicates a strong correlation. Of the 45 combinations, approximately 62%—specifically, 28 combinations—demonstrate Sρ values ranging from 0.55 to 1.00. This range spans from moderately positive to very high positive correlation [80,81]. This observation suggests the merit of consolidating ranks obtained from different MADM methods.
Figure 3a elucidates the mean-based consolidation of the ranks of the Ti alloys from the ten MADM methods. The five top-ranked alloys are Ti-5Al-4V-4Mo-3Zr-4Cr (Ti1300-BM-nano-α), Ti-5Al-5V-5Mo-3Cr-0.5Fe (Ti-LG-0.5Fe-BM-60αs), Ti-3.5Al-5Mo–6V-3Cr-2Sn-0.5Fe (Ti-35632-0.5Fe-BM-28αs), Ti-5.5Al-5V-5Mo-2.3Cr-0.8Fe-0.15O (Ti18-BM-nano-α), and Ti-3.5Al-9V-2.5Mo-5Sn-3Zr-0.2O (Altan Titan 23-BM-nano-α), in that order. Figure 3b shows the PCA-based consolidation (score plot) of the ranks of Ti alloys from the ten MADM methods. The score plot presents the first two components (PC1 and PC2), post-reduction of the data dimension (10, i.e., ranks from ten MADM methods) into a two-dimensional space. Table 5 presents the eigenvalues (and their proportion) that capture the variation in the distribution of each principal component. The new axes capture ~98% of the variation in the original data. The first principal component (PC1) captures ~71% of the variation or scatter in the original data, while the second principal component (PC2) captures ~27%. Since PC1 captures > 70% of the variation in the initial ten dimensions (i.e., sets of ranks), it somewhat approximates the consolidated ranks of Ti alloys. An imaginary reference line (perpendicular to PC1) traversing from left to right (−5 to 5) indicates the overall ranks of the alloys. The alloys Ti1300-BM-nano-α, Ti-LG-0.5Fe-BM-60αs, Ti-35632-0.5Fe-BM-28αs, Ti18-BM-nano-α, and Altan Titan 23-BM-nano-α, are the top five alloys in that order. The five top-ranked alloys by PCA-based consolidation are identical to the top-ranked alloys by mean-based rank consolidation. Significantly, the top five alloys identified in this study outshine the rankings of two notable commercial alloys: Ti5551-1Fe-BW (known as VT-22 with the chemistry in weight percentage as Ti5Al5V5Mo1Cr1Fe) and Ti-LG-1Zr-BM-125αs (Ti5Al5V5Mo3Cr-1Zr). Ti-5551-1Fe-BW, which is extensively used in landing gear, load-bearing fuselage components, and high-lift devices [27], secures the ninth position in the rankings. On the other hand, Ti-LG-1 Zr-BM-125αs used in Airbus A380 landing gear beams [27] is ranked 10. The d of the five top-ranked alloys, ranging from 4.58 to 4.85 g/cm3, is comparable to the d (~4.61 g/cm3) of Ti-LG-1 Zr-BM-125αs. In fact, the top-ranked alloy, Ti1300-BM-nano-α, and Ti-LG-1 Zr-BM-125αs have identical d. On the other hand, the alloys Ti1300-BM-nano-α (rank 1), Ti-LG-0.5Fe-BM-60αs (rank 2), Ti18-BM-nano-α (rank 4), and Altan Titan 23-BM-nano-α (rank 5) have YS between ~1245 MPa and ~1322 MPa, which is akin to or better than the YS (~1248 MPa) of Ti-LG-1 Zr-BM-125αs, while their %EL is significantly higher (ranging from 10% to 18%) compared to Ti-LG-1 Zr-BM-125αs (~8.5%), and hence Ti1300-BM-nano-α, Ti-LG-0.5Fe-BM-60αs, Ti18-BM-nano-α, and Altan Titan 23-BM-nano-α have better ratings than Ti-LG-1 Zr-BM-125αs. The ratings of Ti-35632-0.5Fe-BM-28αs (rank 3) is better than Ti-LG-1 Zr-BM-125αs (rank 10) predominantly due to significantly high YS (~1624 MPa vs. ~1248 MPa) despite the marginally higher (~2%) d (4.7 vs. 4.61 g/cm3) and lower %EL (6% vs. 8.5%). These differences in the data of the essential attributes have been considered and optimized in ranking and outranking by the algorithms in the MADM methods appropriately. It is important to mention that the thermomechanical processing could change the scenario by changing the microstructural parameters (like prior β, grain boundary α, primary αp, acicular secondary αs for their size, morphology, volume fraction, etc.) and alloy design (including strengthening mechanisms) and the ranks could differ. Lu et al. [53] attribute the excellent plasticity in Ti1300-BM-nano-α to the relatively small prior α/β grains (around 10–20 µm). However, the discussion on the effect of microstructural features in a finer detail is out of the scope of the present investigation, as this is focused on the assessment of the reported literature data and ranking of the alloys [8,16,40,41,42,43,44,45,46,47,48,49,50,51,52,53,54,55,56,57,58,59].
Figure 4 compares the percentage difference in properties of the five top-ranked alloys (from Figure 3) with respect to the benchmark properties. All five top-ranked alloys have significantly high %EL, ranging from ~1.2 to ~3.6 times increase (~20 to 260% increase) compared to the benchmark. On the contrary, a significant increase in YS (~30%) is observed only for Ti-35632-0.5Fe-BM-28αs, while the other four have insignificant increases―~6% maximum―compared to the benchmark. Moreover, the change in density ranges from 0% to ~6%. Specifically, the top-ranked alloy Ti1300-BM-nano-α (alloy chemistry: Ti-5Al-4V-4Mo-3Zr-4Cr, solution treatment: 800 °C for 1 h followed by air cooling—solution treated below β transus, and aging: 500 °C for 4 h followed by air cooling) has a superior %EL (~3.3 times greater) compared to the benchmark, while d and YS are similar to the corresponding properties of the benchmark (or goal). On the other hand, the alloy ranked 3, i.e., Ti-35632-0.5Fe-BM-28αs (alloy chemistry: Ti-3.5Al-5Mo-6V-3Cr-2Sn-0.5Fe, solution treatment: 775 °C for 1 h followed by air cooling—solution treated below β transus, and aging: 440 °C for 8 h followed by air cooling) has a superior combination of YS and %EL―30% and 20% increase, respectively―compared to the benchmark, while d is comparable to that of the benchmark (or goal).
Figure 5 presents the rank chart through the lens of various categories of alloys, viz., alloy type, matrix, and other phases (refer to Table 1). All the five top-ranked alloys are metastable β Ti alloys (Figure 5a). From a microstructure point of view (Figure 5b,c), all the five top-ranked alloys have a bimodal matrix, i.e., globular primary α + trans β (Figure 5b), and they are expected to have fine α and αs precipitates. The observations on alloy type, matrix, and other phases and ranking make metallurgical sense. It appears metastable β Ti alloys comprising globular primary α + trans β matrix coupled with α precipitates in trans β appears to be the optimal microstructure for these alloys for aircraft landing gear applications.
Figure 6 presents the dendrogram by HC of the ranks from the 10 MADM methods. Among the top-ranked alloys, the three top-ranked alloys Ti1300-BM-nano-α (rank 1), Ti-LG-0.5Fe-BM-60αs (rank 2), and Ti18-BM-nano-α (rank 4) are ~88% similar to each other, while they are only ~73% similar to Ti-35632-0.5Fe-BM-28αs (rank 3). The alloy Altan Titan 23-BM-nano-α (rank 5), though, is only ~58% similar to the four top-ranked alloys and ~86% similar to two commercial alloys Ti-5551-1Fe-BW (VT-22) and Ti-LG-1 Zr-BM-125αs (i.e., Ti55531 with the addition of 1 wt.% Zr). These two commercial alloys are widely used in landing gear, load-bearing fuselage components, and high-lift devices of Russian wide-body and Airbus A380 aircraft, respectively [27]. This suggests we could probably have three strands of alloy development towards an optimum combination of YS and %EL. The initial choice involves selecting any one of the alloys among Ti1300-BM-nano-α, Ti-LG-0.5Fe-BM-60αs, and Ti18-BM-nano-α, ranked 1, 2 and 4, respectively (ranks marked in red in Figure 6). Notably all three alloys exhibit substantially higher %EL (approximately 2 to 3.6 times) compared to the benchmark, while their YS and d values are comparable to the benchmark. The focus then shifts to enhancing the YS by optimizing processing conditions, especially through solution treatment and aging. Opting for the second approach involves selecting Ti-35632-0.5Fe-BM-28αs (rank 3, marked in red in Figure 6). This alloy exhibits a good combination of YS and %EL, surpassing the benchmark by 30% and 20%, respectively. The focus then shifts to refining its %EL through meticulous optimization of processing conditions. Opting for the third alternative involves selecting Altan Titan 23-BM-nano-α (rank 5, in red in Figure 6). This alloy has YS closely comparable to the benchmark (~10 MPa less) while exhibiting a significantly higher %EL, approximately 2.5 times greater than the benchmark. The focus then turns towards enhancing its YS through careful optimization of processing conditions.
The ranking, and especially identifying the similarities using hierarchical clustering, in a way also closely mirrors the concept found in the well-established materials science tetrahedron approach. This approach emphasizes similarities in chemistry and processing encompassing aspects like melting, casting, thermomechanical processing, etc., which collectively influence structure and subsequently impact properties, ultimately determining performance. The current analysis offers guidance, making it feasible to generate exhaustive data tailored to specific application requirements on a limited number of alternatives, thereby optimizing cost, time and effort as described earlier. The above analysis draws support from the fact that the fracture toughness of the alloys Ti1300-BM-nano-α (rank 1) and Altan Titan 23-BM-nano-α (rank 5) are >50 MPa(m)0.5 [52,82] and 60 MPa(m)0.5 [53], respectively and would meet the general expectations of the requirement for around 45 MPa(m)0.5 [8]. The fatigue limit of the Altan 23-BM-nano-α has been reported as 1033 MPa for 107 cycles at R = 0.1, Kt = 1, and 30 Hz test conditions [53]. This is considered good for the intended application. In a recent study of a new low-cost, high-strength, metastable Ti alloy, the basic parameters of YS, UTS, and %EL were very promising, and this could also be included for further study for all the other attributes, as stated in the subsequent lines [83]. Thus, it appears that the top-ranked alloys arrived at using the MADM approach with the easily available attributes of d, YS, and %EL seem to show that the other attributes like fracture toughness and fatigue would likely meet the requirements for the intended application for these alloys having some basic similarities concerning chemistries, thermomechanical processes, and microstructures, as suggested above. Further testing of the top-ranked alloys for fracture toughness, fatigue, corrosion resistance, etc., is recommended to complete the comprehensive assessment as indicated in some of the research work [18,19,20,21,22,23,24,25,26,27,30,52,53,82,84,85,86]. The corrosion resistance of these alloys is also expected to meet the requirements.
Lastly, by assigning apt relative weighting to the properties (in the ranking step) in corroboration with the intended application and the corresponding new benchmark requirements, other alloys could emerge as top-ranked alloys. The potency of the decision science-driven methodology could further be tapped by effectively and appropriately choosing the weights of the properties for specific landing gear components based on their respective requirements that could be flown down by the designer for the intended application. It is also possible to consider and examine refractory high-entropy alloys for selection for application as landing gear parts. A similar analysis could include data from newer exotic experimental materials, including composites, high-entropy alloys, etc., for aircraft landing gear applications.

4. Summary and Conclusions

We applied a novel decision science-driven methodology to assess and select metastable β, α + β, near-β, and near-α Ti alloys from the literature for applications in aircraft landing gear by integrating multiple-attribute decision-making (MADM) methods, principal component analysis (PCA), and hierarchical clustering (HC).
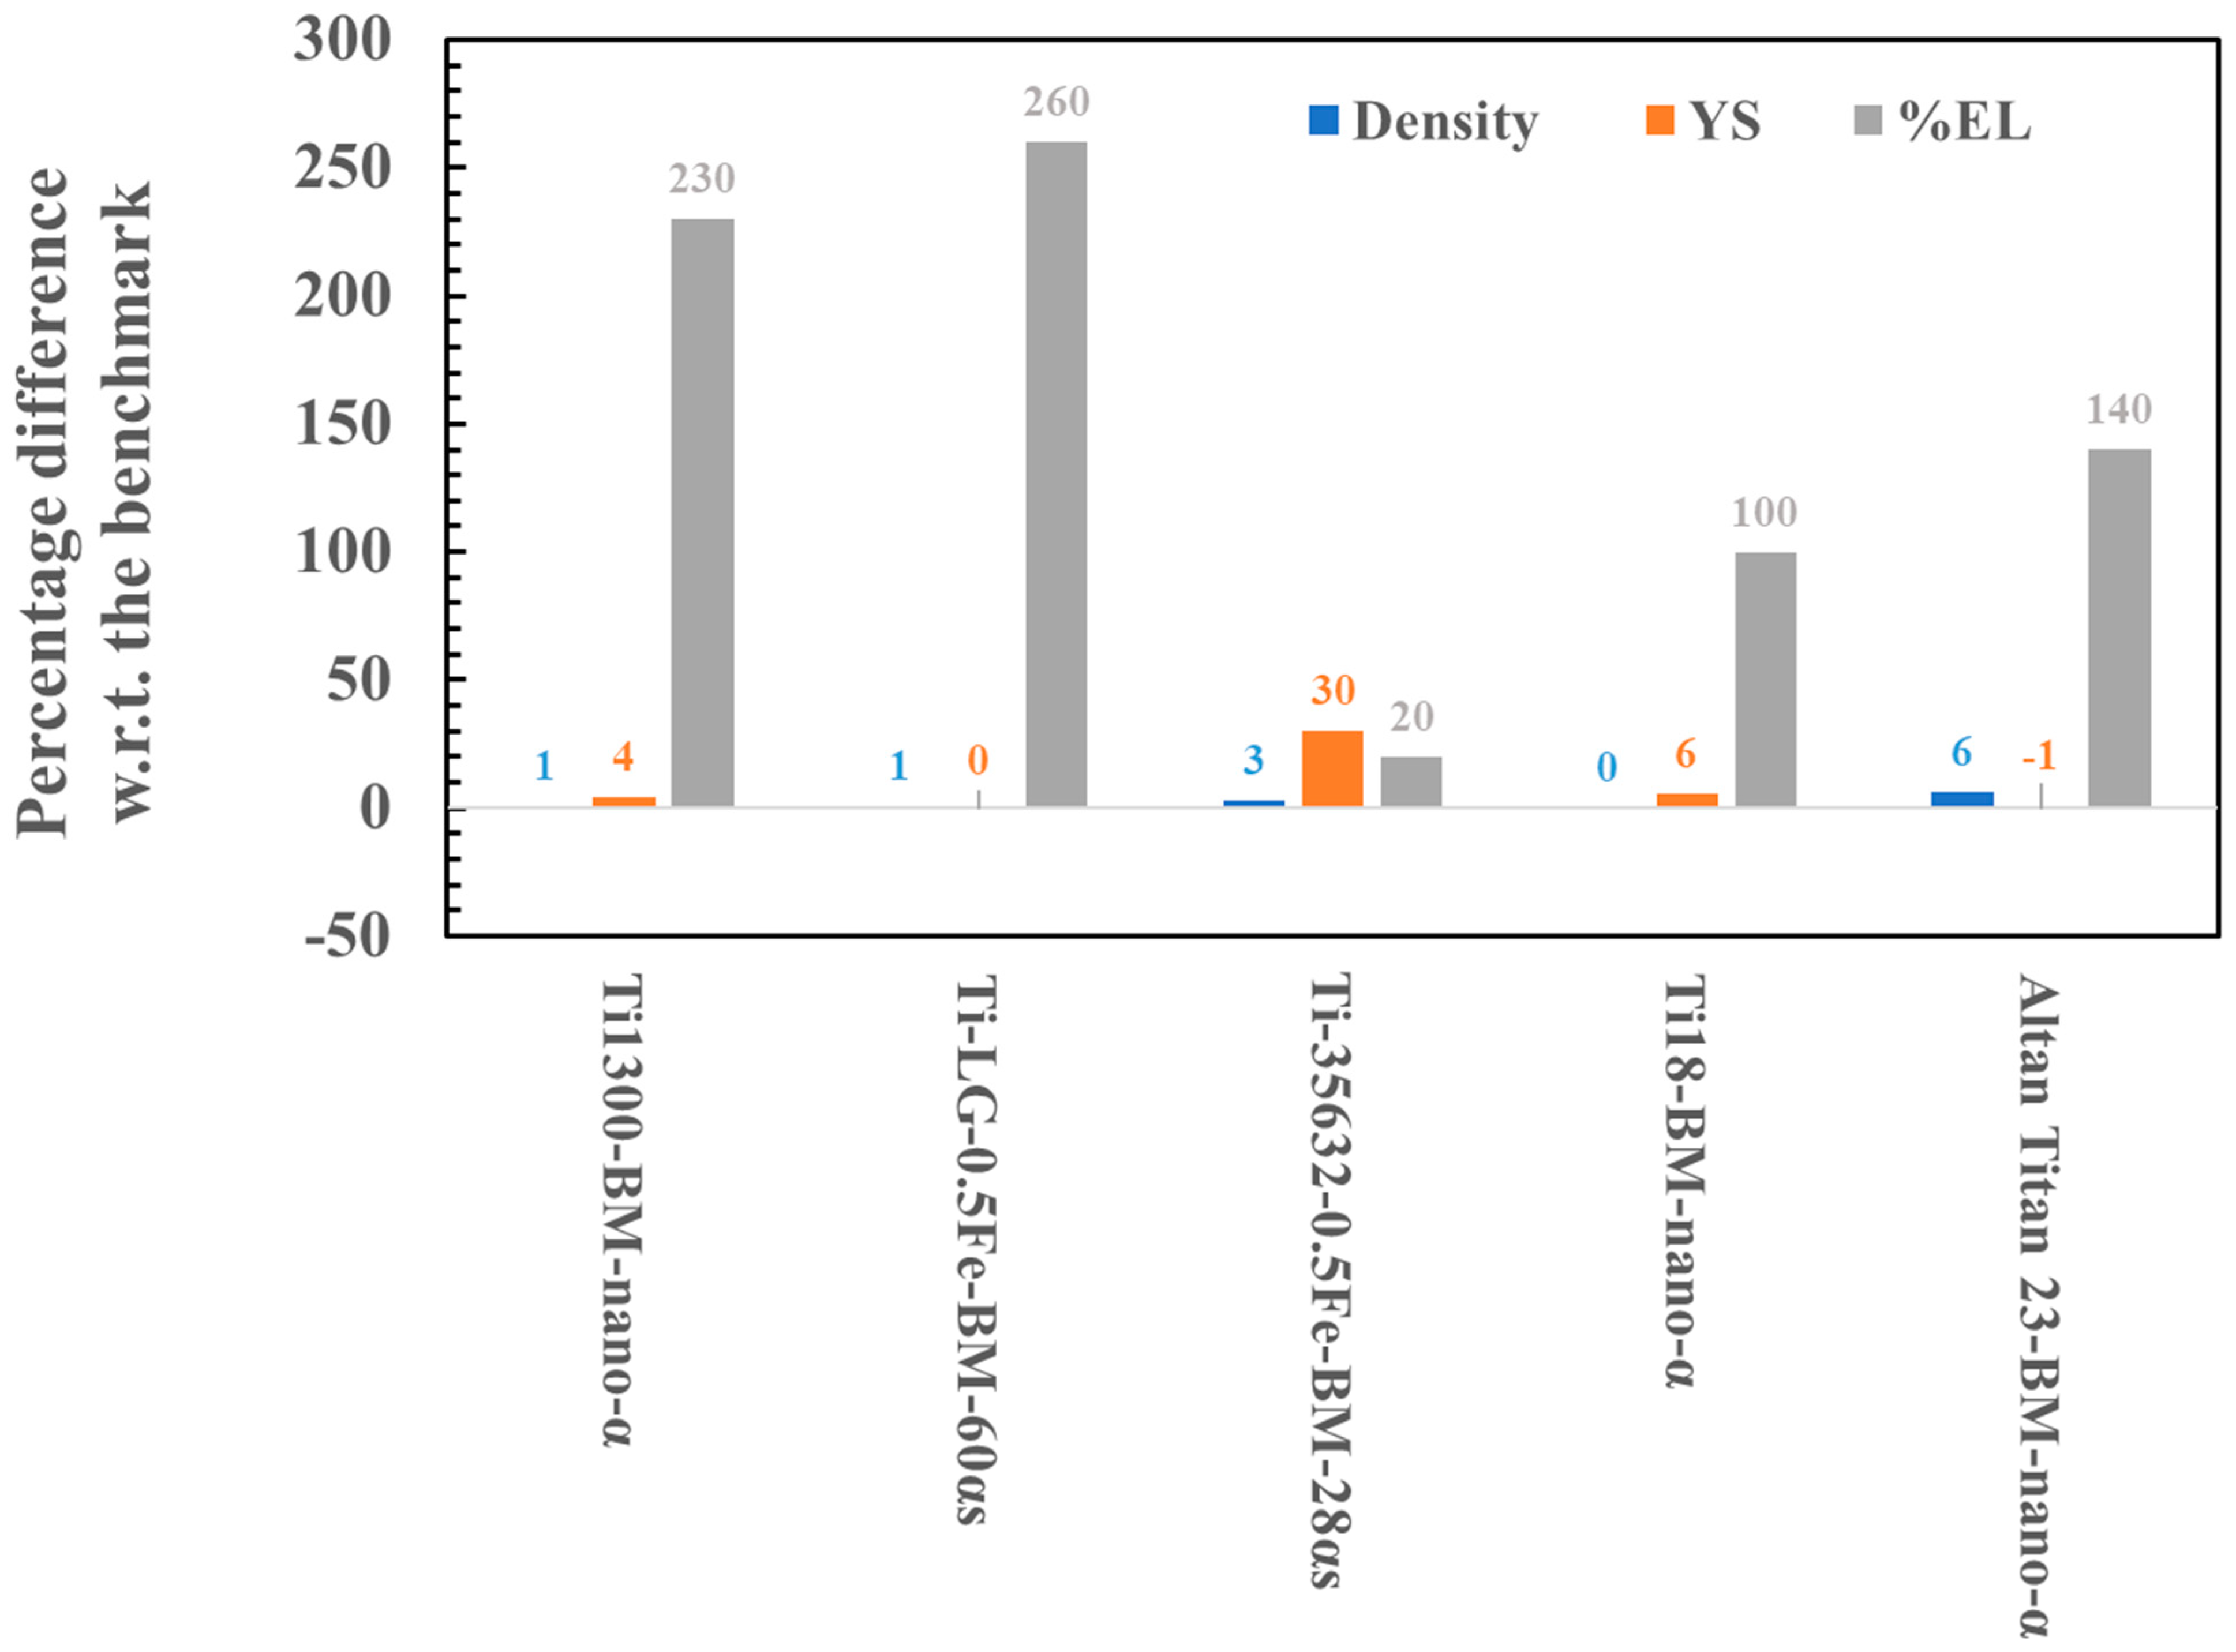
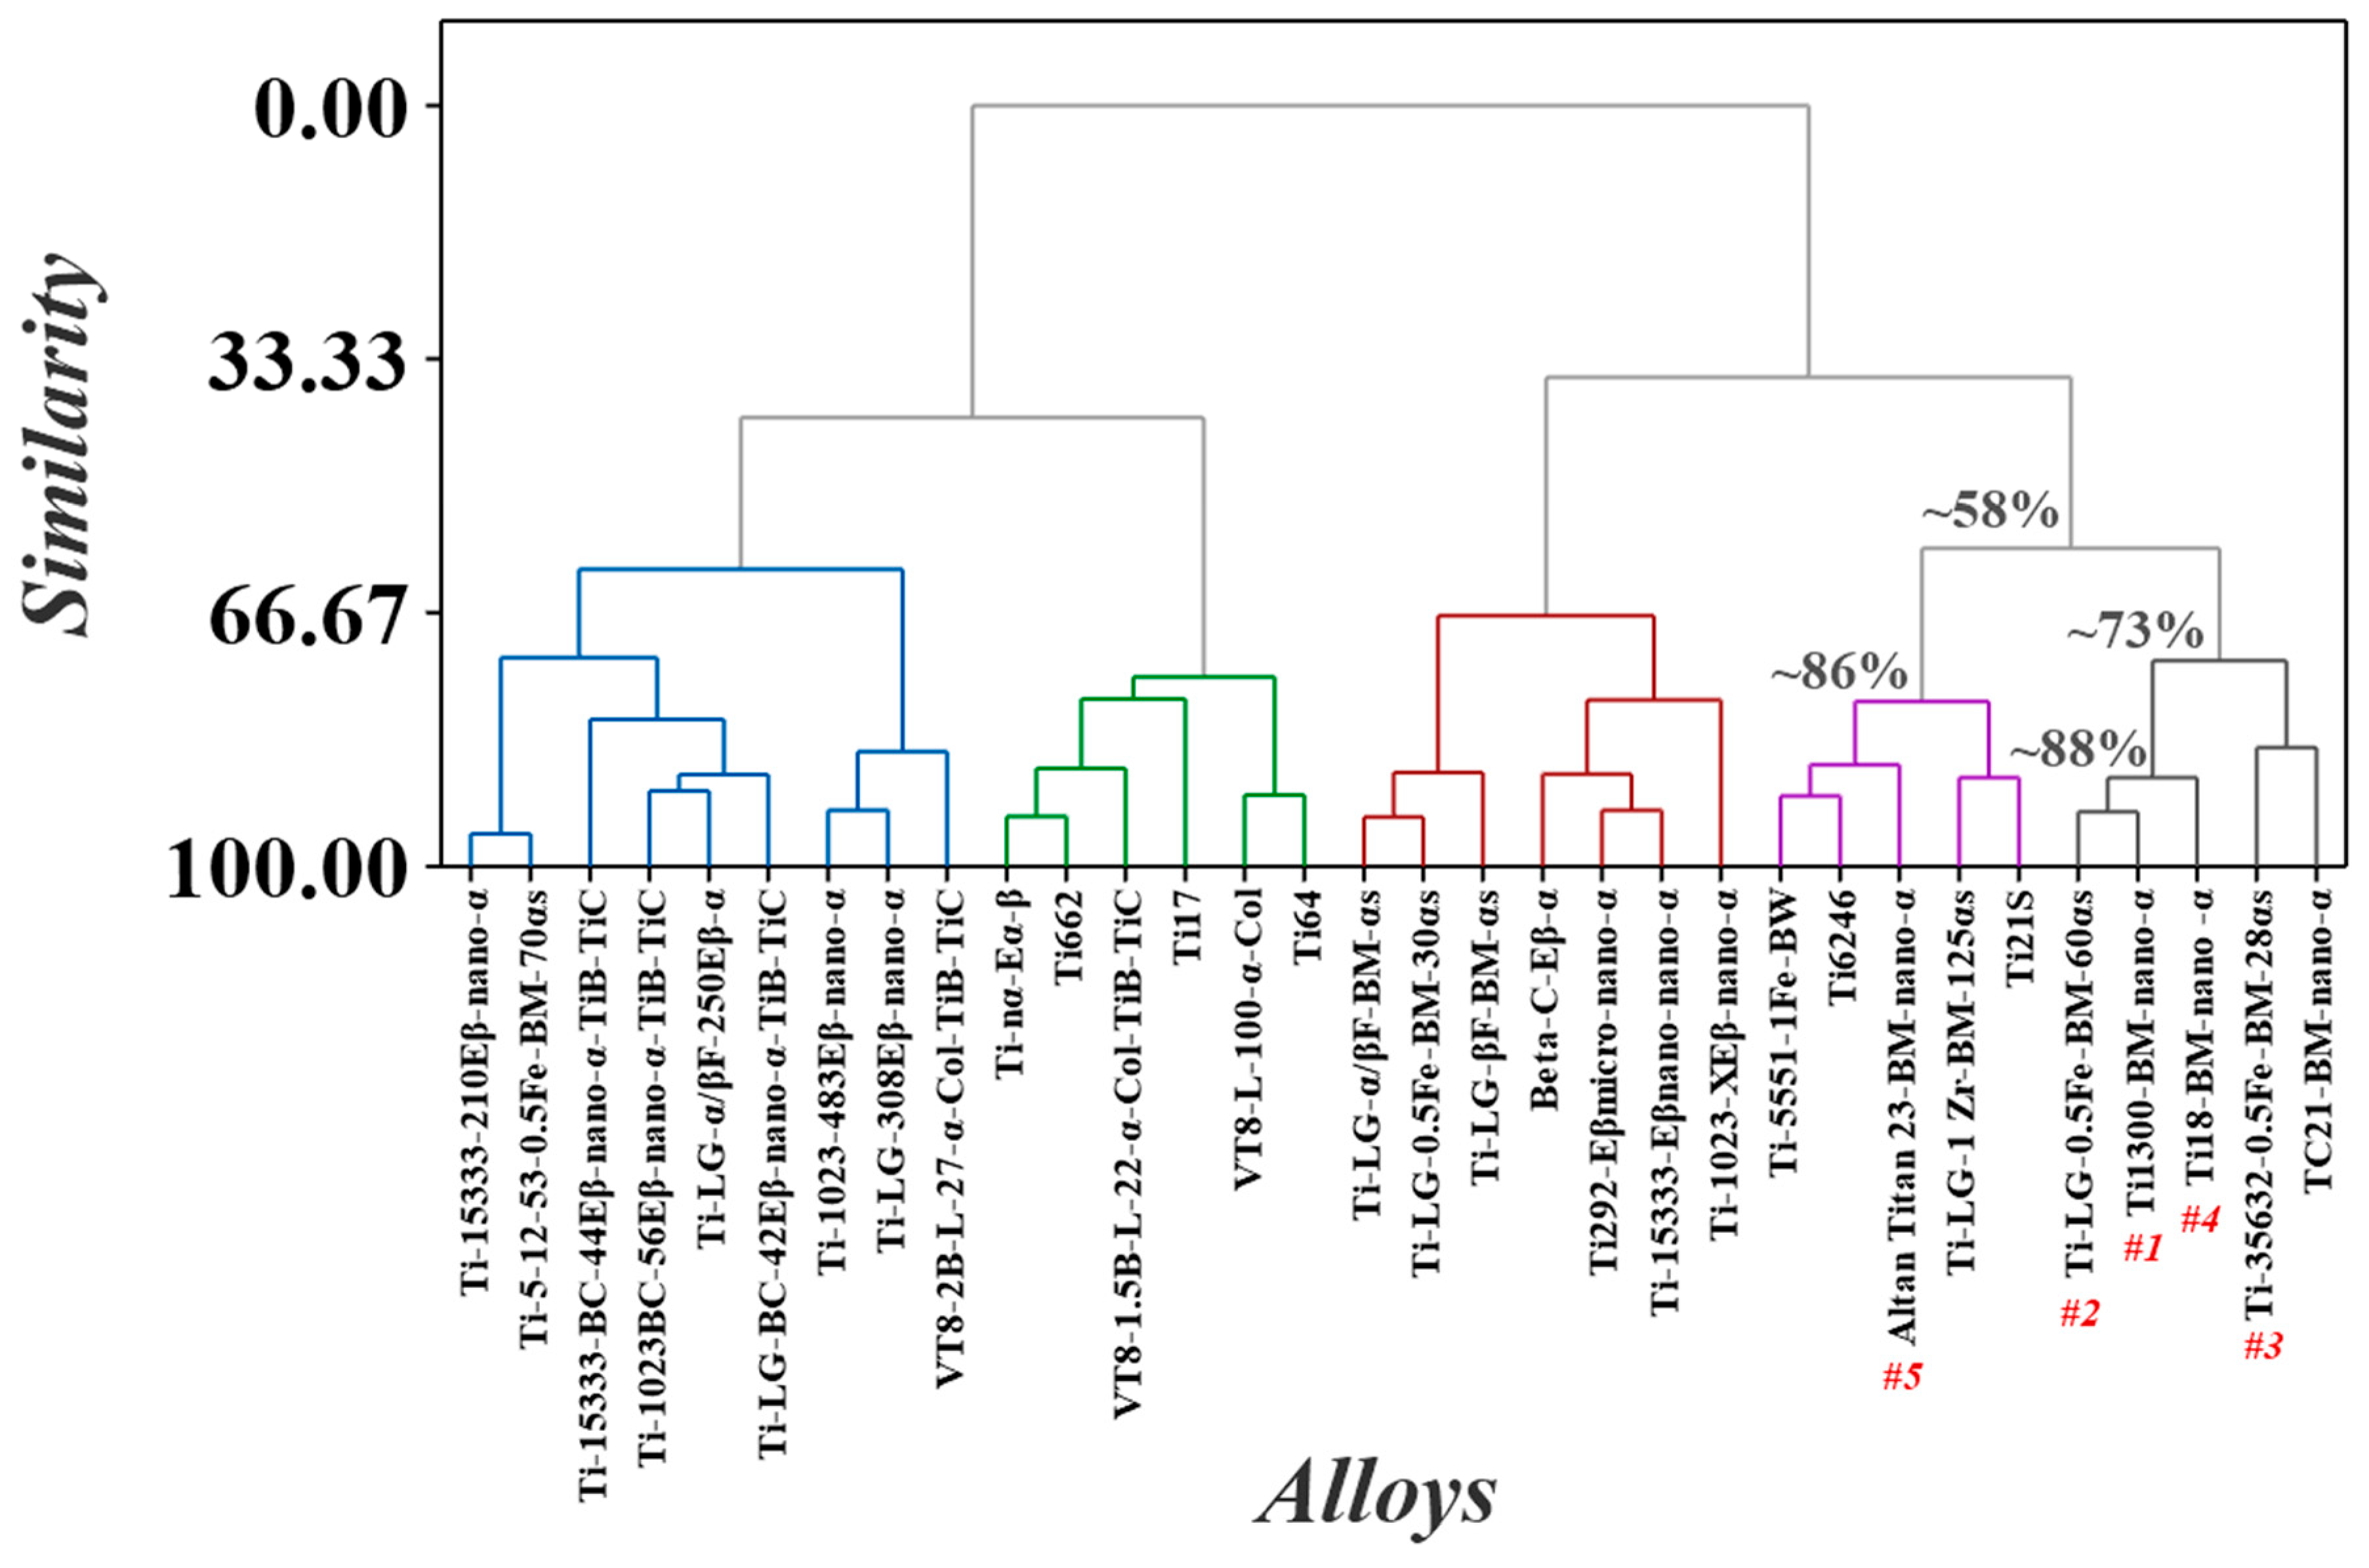
  • The methodology identifies the five top-ranked Ti alloys—Ti-5Al-4V-4Mo-3Zr-4Cr (Ti1300-BM-nano-α), Ti-5Al-5V-5Mo-3Cr-0.5Fe (Ti-LG-0.5Fe-BM-60αs), Ti-3.5Al-5Mo–6V-3Cr-2Sn-0.5Fe (Ti-35632-0.5Fe-BM-28αs), Ti-5.5Al-5V-5Mo-2.3Cr-0.8Fe-0.15O (Ti18-BM-nano-α), and Ti-3.5Al-9V-2.5Mo-5Sn-3Zr-0.2O (Altan Titan 23-BM-nano-α)—in that order.
  • The data and analyses suggest that the top-ranked alloys could be refined further to adjust the properties by appropriate thermomechanical processing.
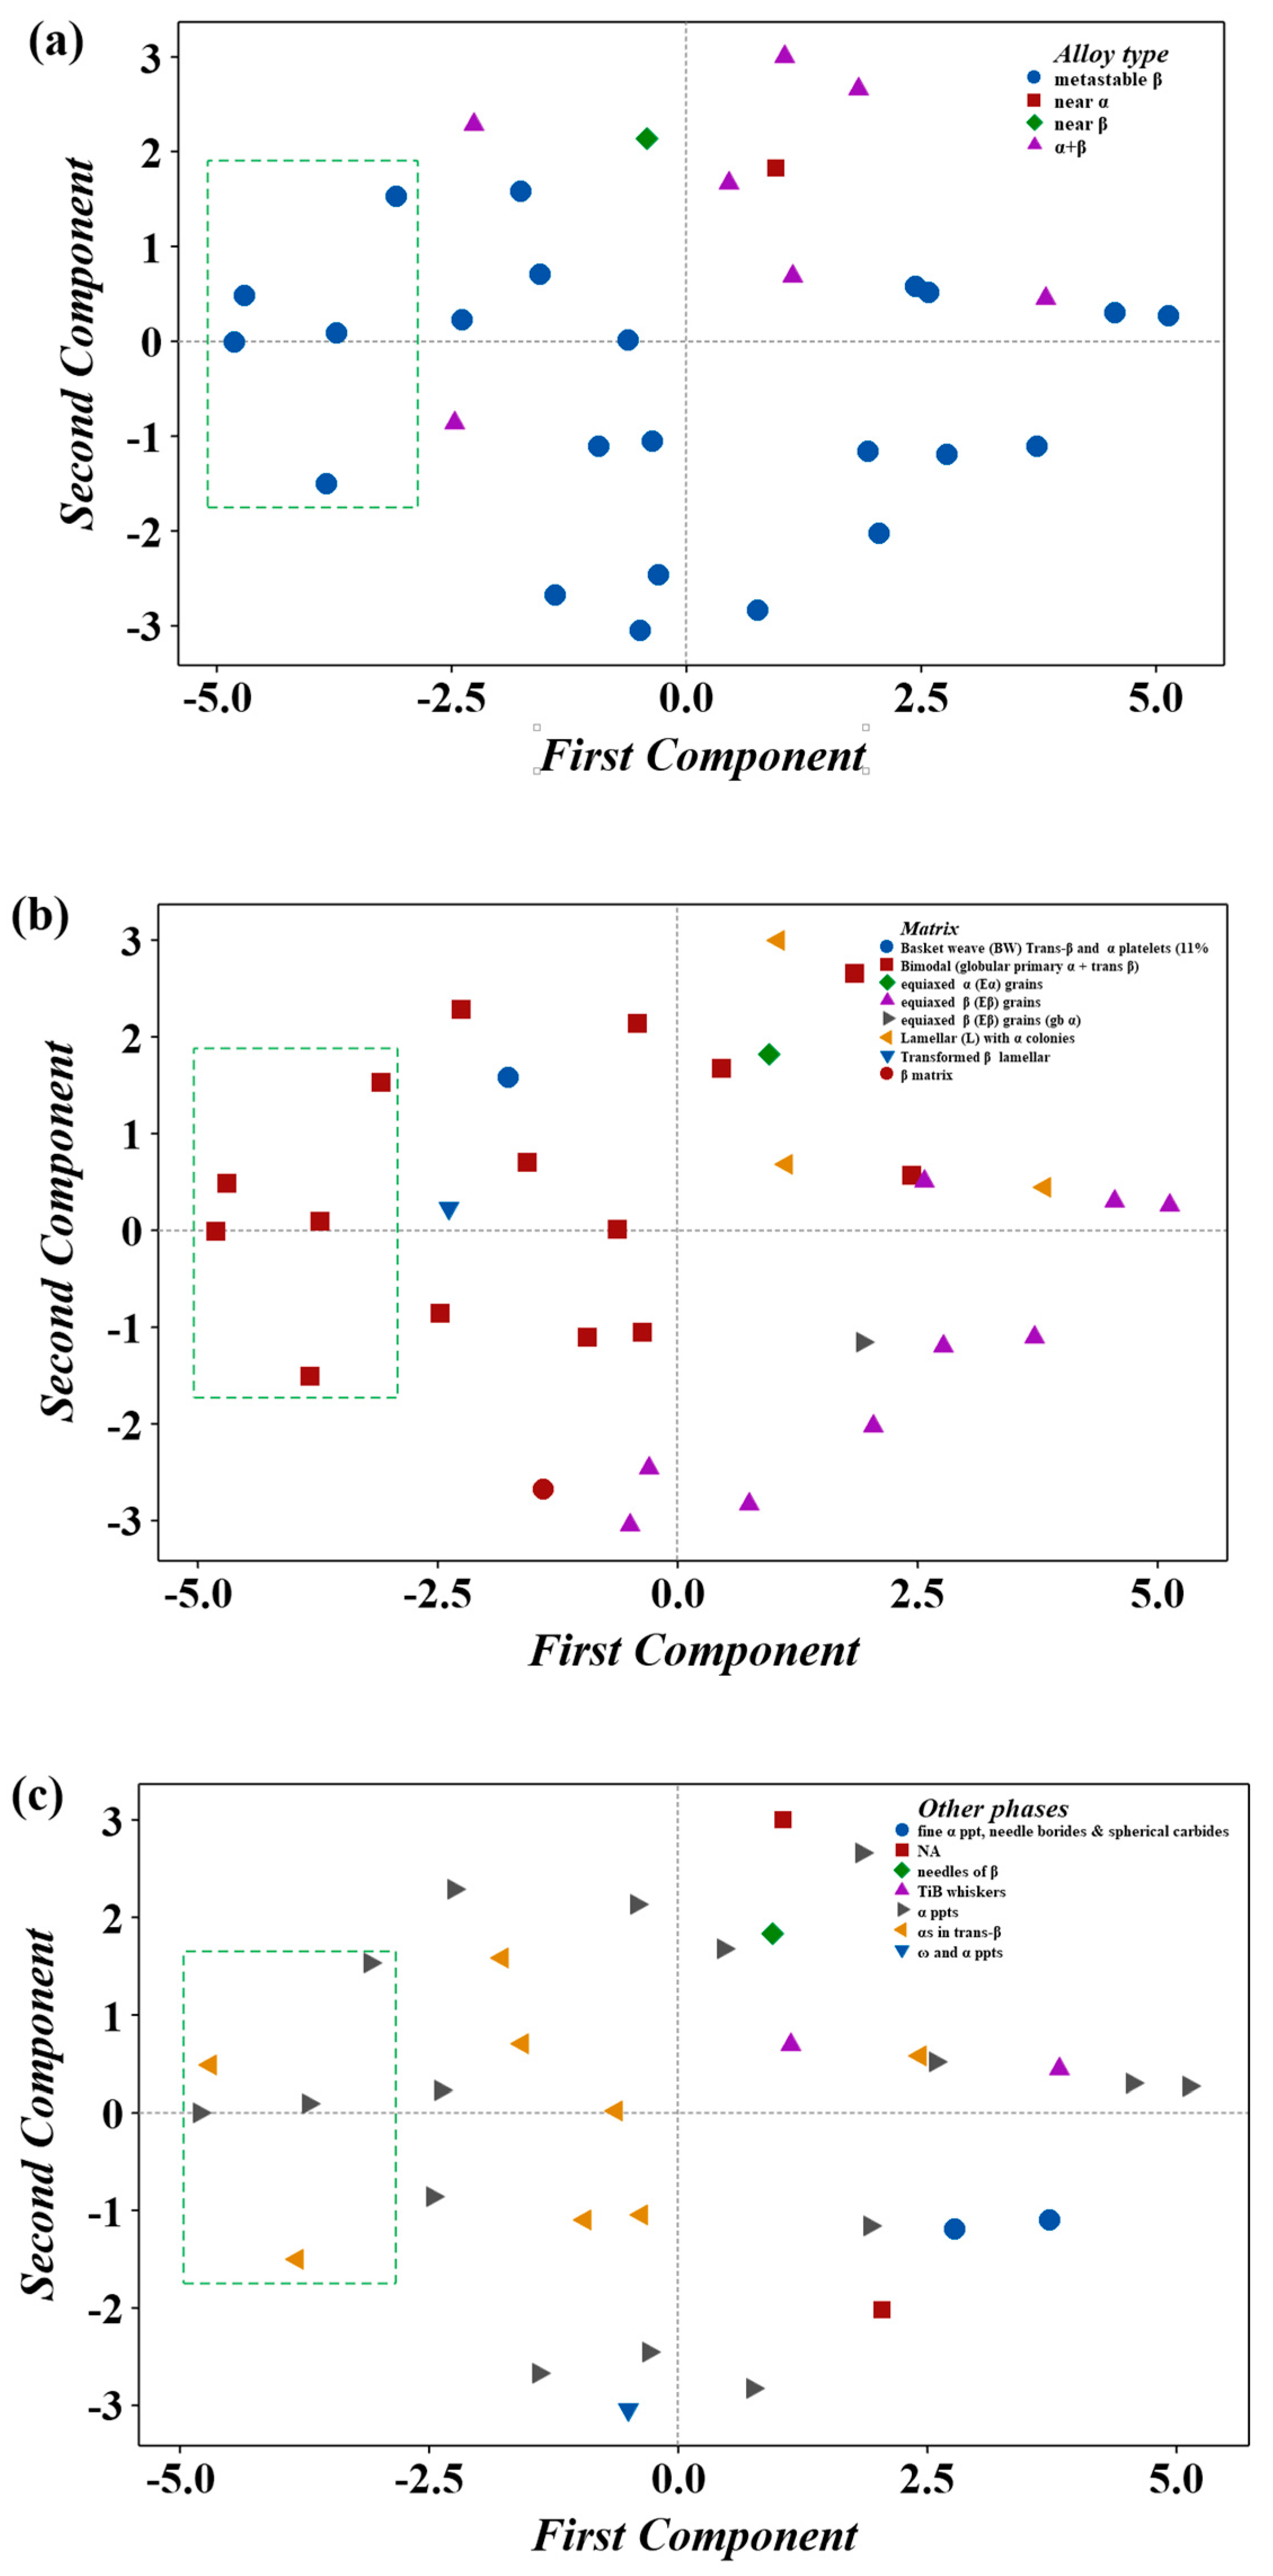
  • The novel decision science-driven methodology verifies the guidelines for alloy design and makes metallurgical sense: metastable β Ti alloys comprising a globular primary α + trans β matrix coupled with α precipitates in trans β seem to be the optimum microstructure for these Ti alloys for aircraft landing gear applications.
  • Ranking helps focus on the top-ranked alloys to generate all the needed data for the intended application expeditiously and cost-effectively and also helps in further improvements to optimize the microstructural features to balance the desired attributes are possible through variations in thermomechanical processing (TMP).
  • Hierarchical clustering analysis seems to bring out similarities between alloy grades that follow the materials science tetrahedron approach.

Author Contributions

Conceptualization R.C. and T.V.J.; methodology, T.V.J.; software, T.V.J.; validation, R.C. and T.V.J.; formal analysis, T.V.J. and R.C.; investigation, R.C. and T.V.J.; data curation, R.C.; writing—original draft preparation, T.V.J. and R.C.; writing—review and editing, T.V.J. and R.C.; visualization, T.V.J.; supervision, R.C. and T.V.J.; project administration, R.C. and T.V.J. All authors have read and agreed to the published version of the manuscript.

Funding

This work received no external funding. Weldaloy Specialty Forgings R&D#8860.00.

Institutional Review Board Statement

Not applicable.

Informed Consent Statement

Not applicable.

Data Availability Statement

Data are contained within the article.

Acknowledgments

The authors, R. Canumalla and T.V. Jayaraman thank Weldaloy Specialty Forgings and the United States Air Force Academy, respectively, for the support.

Conflicts of Interest

The authors Ramachandra Canumalla and Tanjore V. Jayaraman of the respective organizations, namely Weldaloy, Specialty Forgings and the United States Air Force Academy, declare that the research was conducted in the absence of any commercial or financial relationships or any other that could be construed as a potential conflict of interest.

Distribution Statement

Approved for public release: distribution unlimited (PA# USAFA-DF-2023-800).

Disclaimer/Authors’ Note

The views expressed in this article are those of the authors and do not necessarily reflect the official policy or position of Weldaloy Specialty Forgings, Warren, MI. The views expressed in this article are those of the authors and do not necessarily reflect the official policy or position of the United States Air Force Academy, the Air Force, the Department of Defense, or the U.S. Government.

References

  1. IATA/Global Outlook for Air Transport- Highly Resilient, Less Robust. Semi Annual Report, June 2023. Available online: https://www.iata.org/en/iata-repository/publications/economic-reports/global-outlook-for-air-transport----june-2023/ (accessed on 26 December 2023).
  2. Airbus. Global Market Forecast. 2023. Available online: https://www.airbus.com/sites/g/files/jlcbta136/files/2023-06/GMF%202023-2042%20Presentation_0.pdf (accessed on 26 December 2023).
  3. Bickers, C.; Bergman, P. Boeing Forecasts $8.7 Trillion Aerospace and Defense Market through 2028. Boeing 2019. Available online: https://boeing.mediaroom.com/2019-06-17-Boeing-Forecasts-8-7-Trillion-Aerospace-and-Defense-Market-through-2028 (accessed on 26 December 2023).
  4. Ulhmann, E.; Kersting, R.; Klein, T.B.; Cruz, M.F. Additive manufacturing of titanium alloy for aircraft components. Procedia CIRP 2015, 35, 55–60. [Google Scholar] [CrossRef]
  5. Chatterjee, B.; Bhowmick, S. Evolution of material selection in commercial aviation industry. In Sustainable Engineering Products and Manufacturing Technologies; Academic Press: Cambridge, MA, USA, 2019; pp. 199–219. [Google Scholar]
  6. Wang, M.; Li, H.; Chen, H.; Fang, X.; Zhu, E.; Huang, P.; Wei, X.; Nie, H. Structural optimization of AeroMet100 Steel Torsion Spring Based on Strain Fatigue. Aerospace 2023, 10, 828. [Google Scholar] [CrossRef]
  7. Philip, T.V.; McCaffrey, T.J. Ultrahigh-Strength Steels, in ASM Handook, Volume 1: Properties and Selection: Irons, Steels, and High-Performance Alloys; ASM International: Almere, The Netherlands, 1990; Volume 1, pp. 431–448. [Google Scholar]
  8. Buscher, M.; Terlinde, G.; Wegmann, G.; Thoben, C.; Millet, Y.; Lutjering, G.; Albrecht, J. Forgings from Ti5Al-5V-5Mo-3Cr with Optimized Fracture Toughness; Ninomi, M., Akiyama, S., Ikeda, M., Hagiwara, M., Maruyama, K., Eds.; The Japan Institute of Metals: Kyoto, Japan, 2007; pp. 885–888. [Google Scholar]
  9. Serey, J.P. Trends in landing gear material. Aerosp. Eng. 2005, 25, 46, (SAE International, Warrendale, PA, USA). Available online: https://www.42volt.sae.org/aeromag/features/futurelook/09-2005/2-25-8-46.pdf (accessed on 2 April 2021).
  10. Commercial Aircraft Landing Gear Market: Study, Opportunities, and Forecast (2023–2031). Available online: https://straitsresearch.com/report/commercial-aircraft-landing-gear-market (accessed on 26 December 2023).
  11. Ashby, M.F. Materials and the Environment Eco-Informed Material Choice, 1st ed.; Butterworth Heinemann: Oxford, UK; Elsevier: Amsterdam, The Netherlands, 2009. [Google Scholar]
  12. Jahan, A.; Ismail, M.Y.; Sapuan, S.M.; Mustapha, F. Materials screening and choosing methods—A review. Mater. Des. 2010, 31, 696–705. [Google Scholar] [CrossRef]
  13. Ashby, M.F. Materials Selection in Mechanical Design, 5th ed.; Butterworth Heinemann: Oxford, UK; Elsevier: Amsterdam, The Netherlands, 2017. [Google Scholar]
  14. Polmear, I.J. Light Alloys—Metallurgy of Light Alloys, 3rd ed.; Butterworth Heinemann: Oxford, UK, 1995. [Google Scholar]
  15. Ji, Z.; Yang, H. Microstrucural design of two-phase tianium alloys by microscale strain determination. Mater. Lett. 2016, 184, 157–161. [Google Scholar] [CrossRef]
  16. Wang, H.B.; Wang, S.S.; Gao, P.Y.; Jiang, T.; Lu, X.G.; Li, C.H. Microstructure, and mechanical properties of a novel near-α titanium alloy Ti6.0Al4.5Cr1.5Mn. Mater. Sci. Eng. A 2016, 672, 170–174. [Google Scholar] [CrossRef]
  17. Correa, D.R.; Kuroda, P.A.; Grandini, C.R.; Rocha, L.A.; Olieira, F.G.; Alves, A.C. Tribocorrosion behavior of β-type Ti-15Zr-based alloys. Mater. Lett. 2016, 179, 118–121. [Google Scholar] [CrossRef]
  18. Williams, J.C.; Boyer, R.R. Opportunities, and issues in the application of titanium alloys for aerospace components. Metals 2020, 10, 705. [Google Scholar] [CrossRef]
  19. Canumalla, R. On the low tensile ductility at room temperature in high temperature titanium alloys. SCIREA J. Metall. Eng. 2020, 4, 16–51. [Google Scholar]
  20. Kolli, R.P.; Devaraj, A. A review of metastable beta titanium alloys. Metals 2018, 8, 506. [Google Scholar] [CrossRef]
  21. Kang, L.M.; Yang, C. A review on high-strength titanium alloys: Microstructure, Strengthening, and Properties. Adv. Eng. Mater. 2019, 21, 1801357. [Google Scholar] [CrossRef]
  22. Huda, Z.; Edi, P. Materials selection in design of structures and engines of supersonic aircrafts: A review. Mater. Des. 2013, 46, 552–560. [Google Scholar] [CrossRef]
  23. Inagaki, I.; Shirai, Y.; Takechi, T.; Ariyasu, N. Application and Features of Titanium for the Aerospace Industry. Nippon Steel & Sumitomo Metal Technical Report No. 106 July 2014, Osaka City, Japan. pp. 22–27. Available online: https://www.nipponsteel.com/en/tech/report/nssmc/pdf/106-05.pdf (accessed on 2 April 2021).
  24. Santos, C.V.; Leiva, D.R.; Costa, F.R.; Gregolin, J.A. Materials Selection for Sustainable Executive Aircraft Interior. Mater. Res. 2016, 19, 339–352. [Google Scholar] [CrossRef]
  25. Boyer, R.R. An overview on the use of titanium in aerospace industry. Mater. Sci. Eng. 1996, 213, 103–114. [Google Scholar] [CrossRef]
  26. Peters, M.; Kumpfert, J.; Ward, C.H.; Leyens, C. Titanium Alloys for Aerospace Applications. Adv. Eng. Mater. 2003, 5, 419–427. [Google Scholar] [CrossRef]
  27. Cotton, J.D.; Briggs, R.D.; Boyer, R.R.; Tamirisakandala, S.; Russo, P.; Shchetnikov, N.; Fanning, J.C. State of the art beta titanium alloys for airframe applications. JOM 2015, 67, 1281–1303. [Google Scholar] [CrossRef]
  28. Renato, A.A.; Salvador, C.A.; de Oliviera, M.C. Materials selection of optimized alloys for Aircraft Applications. Mater. Res. 2018, 21, e20170979. [Google Scholar]
  29. Jayaraman, T.V.; Canumalla, R. Competitor Ti-Comprising Refractory High Entropy Alloys to Superalloy 718 for Aeroengine Applications. In Proceedings of the 10th International Symposium on Superalloy 718 and Derivatives, Pittsburgh, PA, USA, 14–17 May 2023. [Google Scholar]
  30. Canumalla, R.; Jayaraman, T.V. Decision Science Driven Selection of High-Temperature Conventional Ti Alloys for Aeroengines. Aerospace 2023, 10, 211. [Google Scholar] [CrossRef]
  31. Jayaraman, T.V.; Canumalla, R. Data-driven Search and Selection of Ti-containing Multi-principal Element Alloys for Aeroengine Parts. In Proceedings of the TMS 2023 152nd Annual Meeting & Exhibition Supplemental Proceedings, San Diego, CA, USA, 19–23 March 2023. [Google Scholar]
  32. Canumalla, R.; Jayaraman, T.V. Ti-containing High-Entropy Alloys for Aeroengine Turbine Applications. Mater. Res. 2023, 26, e20220213. [Google Scholar] [CrossRef]
  33. Jayaraman, T.V.; Canumalla, R. Strategic selection of refractory high-entropy alloy coatings for hot-forging dies by applying decision science. Coatings 2024, 14, 19. [Google Scholar] [CrossRef]
  34. Zavadskas, E.K.; Turskis, Z.; Kildiene, S. State of art surveys of overviews on MCDM/MADM methods. Technol. Econo. Dev. Econ. 2014, 20, 165–179. [Google Scholar] [CrossRef]
  35. Zakeri, S.; Chatterjee, P.; Konstantas, D.; Ecer, F. A decision analysis model for material selection using simple ranking process. Sci. Rep. 2023, 13, 8631. [Google Scholar] [CrossRef] [PubMed]
  36. Tzeng, G.H.; Huang, J.J. Multiple Attribute Decision Making Methods, and Applications; CRC Press: Boca Raton, FL, USA, 2011. [Google Scholar]
  37. Rao, R.V. Decision Making in the Manufacturing Environment, Using Graph Theory and Fuzzy Multiple Attribute Decision Making Methods; Springer: Berlin/Heidelberg, Germany, 2007. [Google Scholar]
  38. Cadima, J.; Jolliffle, I.T. Principal Component Analysis: A review and recent developments. Phil. Trans. R. Soc. A 2016, 374, 20150202. [Google Scholar]
  39. Rajan, K.; Sun, C.; Mendez, P.F. Principal component analysis and dimensional analysis as materials informatics tools to reduce dimensionality in materials science and engineering. Stat. Anal. Data Min. 2009, 1, 361–371. [Google Scholar] [CrossRef]
  40. Banoth, R.; Sarkar, R.; Bhattacharjee, A.; Nandy, T.K.; Rao, G.V. Effect of boron and carbon addition on microstructure and mechanical properties of metastable beta titanium alloys. Mater. Des. 2015, 67, 50–63. [Google Scholar] [CrossRef]
  41. Shi, X.; Zeng, W.; Xue, S.; Jia, Z. The crack initiation behavior and the fatigue limit of Ti-5Al-5Mo-5V-1Cr-1Fe titanium alloy with basket-weave microstructure. J. Alloys Compd. 2015, 631, 340–349. [Google Scholar] [CrossRef]
  42. Imayev, V.M.; Gaisin, R.A.; Imayev, R.M. Effect of boron additions and processing on microstructure and mechanical properties of a titanium alloy Ti-6.5Al-3.3Mo-0.3Si. Mater. Sci. Eng. A 2015, 641, 71–83. [Google Scholar] [CrossRef]
  43. Huang, J.; Wang, Z.; Xue, K. Cyclic deformation response and micromechanisms of Ti alloy Ti-5Al-5V-5Mo-3Cr-0.5Fe. Mater. Sci. Eng. A 2011, 528, 8723–8732. [Google Scholar] [CrossRef]
  44. Opini, V.C.; Salvador, C.A.; Campo, K.N.; Lopes, E.S.; Chaves, R.R.; Caram, R. α phase precipitation and mechanical properties of Nb-modified Ti-5553 alloy. Mater. Sci. Eng. A 2016, 670, 112–121. [Google Scholar] [CrossRef]
  45. Berg, A.; Kiese, J.; Wagner, L. Microstructural gradients in Ti-3Al-8V-6Cr-4Zr-4Mo for excellent HCF strength and toughness. Mater. Sci. Eng. A 1998, 243, 146–149. [Google Scholar] [CrossRef]
  46. Du, Z.; Xiao, S.; Xu, L.; Tian, J.; Kong, F.; Chan, Y. Effect of heat treatment on microstructure and mechanical properties of a new β high strength titanium alloy. Mater. Des. 2014, 55, 183–190. [Google Scholar]
  47. Huang, C.; Zhao, Y.; Xin, S.; Tan, C.; Zhou, W.; Li, Q. Effect of microstructure on high cycle fatigue behavior of Ti-5Al-5Mo-5V-3Cr-1Zr titanium alloy. Int. J. Fatigue 2017, 94, 30–40. [Google Scholar] [CrossRef]
  48. Li, C.L.; Mi, X.J.; Ye, W.J.; Hui, S.X.; Lee, D.G.; Lee, Y.T. Microstructural evolution, and age hardening behavior of a new metastable beta Ti-2Al-9.2Mo-2Fe alloy. Mater. Sci. Eng. A 2015, 645, 225–231. [Google Scholar] [CrossRef]
  49. Guo, Q.; Wang, Q.; Sun, D.L.; Han, X.L.; Wu, G.H. Formation of nanostructure and mechanical properties of cold-rolled Ti-15V-3Sn-3Al-3Cr alloy. Mater. Sci. Eng. A 2010, 527, 4229–4232. [Google Scholar]
  50. Srinivasu, G.; Natraj, Y.; Bhattacharjee, A.; Nandy, T.K.; Nageswara Rao, G.V. Tensile and fracture toughness of high strength Beta Ti Tanium alloy, Ti-10V-2Fe-3Al, as a function of rolling and solution treatment temperatures. Mater. Des. 2013, 47, 323–330. [Google Scholar] [CrossRef]
  51. Fanning, J. Recent developments in High Strength Near Beta Ti alloy. In Proceedings of the Titanium 2011 Conference, San Diego, CA, USA, October 2011; Available online: https://cdn.ymaws.com/titanium.org/resource/resmgr/2010_2014_papers/FanningJohn_2011.pdf (accessed on 26 December 2023).
  52. Wilwert, L.P. A New High Strength Titanium Alloy with Improved Fatigue Life. in ATI Titan 23. 2019. Available online: https://srehsv.com/wp-content/uploads/2019/11/D6a-Wilwert-ATI-Titan-23%E2%84%A2.pdf (accessed on 26 December 2023).
  53. Lu, L.; Ge, P.; Li, Q.; Zhang, W.; Huo, W.; Hu, J.; Zhang, Y.; Zhao, Y. Effect of microstructure characteristic on mechanical properties and corrosion behavious of new high strength Ti1300 beta titanium alloy. J. Alloys Compd. 2017, 727, 1126–1135. [Google Scholar] [CrossRef]
  54. Ibrahim, K.M.; Barakat, A.F.; Elshaer, R.N.; Abbas, R.R. Effect of Cooling rate and aging on microstructure and tensile properties of TC21 Ti Alloy. TIMS Bull. 2018, 107, 1–11. [Google Scholar]
  55. TIMETAL 21S; High Strength, Oxidation Resistant Strip Alloy. Titanium Metals Corporation: Dallas, TX, USA, 2000.
  56. TIMETAL 17; High Strength Forging Alloy. Titanium Metals Corporation: Dallas, TX, USA, 2000.
  57. TIMETAL 6-2-4-6; High-Strength Intermediate Temperature Alloy. Titanium Metals Corporation: Dallas, TX, USA, 2000.
  58. Titanium Alloys; Titanium Metals Corporation: Dallas, TX, USA, 1997.
  59. Properties and Processing of TIMETAL 6-4 (TMC-0131); Titanium Metals Corporation: Dallas, TX, USA, 1998.
  60. Zavadskas, E.K.; Turskis, Z. A new additive ratio assessment (ARAS) method in multicriterial decision making. Technol. Econ. Dev. Econ. 2010, 16, 159–172. [Google Scholar] [CrossRef]
  61. Stanujic, S.; Jovanovic, R. Measuring a quality of faculty website using ARAS method. Contemp. Issues Bus. Manag. Educ. 2012, 2012, 545–554. [Google Scholar]
  62. Jahan, A.; Edwards, K.L.; Bahraminasab, M. Multi-Criteria Decision Analysis—For Supporting the Selection of Engineering Materials in Product Design, 2nd ed.; Butterworth-Heinemann; Elsevier: Amsterdam, The Netherlands, 2016. [Google Scholar]
  63. Chakraborty, S. Applications of the MOORA method for decision making in manufacturing environment. Int. J. Adv. Manuf. Technol. 2011, 4, 1155–1166. [Google Scholar] [CrossRef]
  64. Dominguez, L.P.; Mojica, K.Y.S.; Pabon, L.C.O.; Diaz, M.C.C. Application of the MOORA method for the evaluation of the industrial maintenance system. J. Phys. Conf. Ser. 2018, 1126, 012018. [Google Scholar] [CrossRef]
  65. Erdogan, S.; Aydin, S.; Balki, M.K.; Sayin, C. Operational evaluation of thermal barrier coated diesel engine fueled with biodiesel/diesel blend by using MCDM method base on engine performance, emission, and combustion characteristics. Renew. Energy 2020, 151, 698–706. [Google Scholar] [CrossRef]
  66. Darji, V.P.; Rao, R.V. Intelligent multi-criteria decision making methods for material selection in sugar industry. Procedia Mater. Sci. 2014, 5, 2585–2594. [Google Scholar] [CrossRef]
  67. Madic, M.; Radovanovic, M.; Manic, M. Application of the ROV method of selection of cutting fluids. Decis. Sci. Lett. 2016, 5, 245–254. [Google Scholar] [CrossRef]
  68. Jha, G.K.; Chatterjee, P.; Chatterjee, R.; Chakraborty, S. Suppliers selection in a manufacturing environment using a range of value method. J. Mech. Eng. 2013, 3, 1–15. [Google Scholar] [CrossRef]
  69. Siregar, D.; Arisandi, D.; Usman, A.; Irwan, D.; Rahim, R. Research of simple multi-attribute rating technique for decision support. J. Phys. Conf. Ser. 2017, 930, 012015. [Google Scholar] [CrossRef]
  70. Deng, H.; Yeh, C.H.; Willis, R.J. Inter-company comparison using modified TOPSIS with objective weights. Comput. Oper. Res. 2000, 27, 963–973. [Google Scholar] [CrossRef]
  71. Gul, M.; Celik, E.; Aydin, N.; Gumus, A.T.; Guneri, A.F. A state-of-the-art literature review of VIKOR and its fuzzy extensions on applications. App. Soft Comput. 2016, 46, 60–89. [Google Scholar] [CrossRef]
  72. Sayadi, M.M.; Heydari, M.; Shahanaghi, K. Extension of VIKOR method for decision making problem with interval numbers. App. Math. Model. 2009, 33, 2257–2262. [Google Scholar] [CrossRef]
  73. Rao, R.V.; Singh, D. Evaluating flexible manufacturing systems using Euclidean distance-based integrated approach. Int. J. Risk. Manag. 2012, 3, 32–53. [Google Scholar] [CrossRef]
  74. Levine, D.M.; Ramsey, P.P.; Smidt, R.K. Applied Statistics for Engineers and Scientists; Prentice-Hall: Upper Saddle, NJ, USA, 2001. [Google Scholar]
  75. Navidi, W. Statistics for Engineers and Scientists, 3rd ed.; McGraw-Hill Science/Engineering: New York, NY, USA, 2010. [Google Scholar]
  76. Rajan, K. Materials Informatics. Mater. Today 2015, 8, 38–45. [Google Scholar] [CrossRef]
  77. George, L.; Hrubiak, R.; Rajan, K.; Saxena, S.K. Principal component analysis on properties of binary and ternary hydrides and a comparison of metal versus metal hydride properties. J. Alloys Compd. 2009, 478, 731–735. [Google Scholar] [CrossRef]
  78. Arabie, P.; Hubert, L.J.; De Soete, G. Clustering and Classification; World Scientific: River Edge, NJ, USA, 1999. [Google Scholar]
  79. Shannon, M.E. A mathematical theory of communication. Bell Syst. Tech. J. 1948, 27, 379–423. [Google Scholar] [CrossRef]
  80. Mukaka, M.M. Statistics Corner: A guide to appropriate use of correlation coefficient in medical research. Malawi Med. J. 2012, 24, 69–71. [Google Scholar] [PubMed]
  81. Hinkle, D.E.; Wiersma, W.; Jurs, S.G. Applied Statistics for the Behavioral Sciences; Houghton Mifflin: Boston, MA, USA, 2003. [Google Scholar]
  82. Zhang, Z.Y.; Liu, D.R.; Pu, Z.P. Effect of microstructure on high-speed tensile mechanical properties of Ti-1300 alloy. Materials 2023, 16, 4725. [Google Scholar] [CrossRef] [PubMed]
  83. Li, C.C.; Xin, C.; Wang, Q.; Ren, J.Q.; Zhao, B.; Wu, J.P.; Pan, X.L.; Lu, X.F. A novel low-cost high-strength β titanium alloy: Microstructure evolution and mechanical behavior. J. Alloys Compd. 2023, 959, 170497. [Google Scholar] [CrossRef]
  84. Bai, C.; Lan, L.; Xin, R.; Gao, S.; He, B. Microstructure evolution and cyclic deformation behavior of Ti-6Al-4V alloy wia electron beam melting during low cycle fatigue. Int. J. Fatigue 2022, 159, 106784. [Google Scholar] [CrossRef]
  85. Canumalla, R.; Jayaraman, T.V. Tensile ductility at room temperature in high temperature titanium alloys used for aeroengine applications. In Proceedings of the 15th World Conference on Titanium (Ti-2023), Edinburgh, UK, 12–16 June 2023. [Google Scholar]
  86. Pilchak, A.; Gram, M. Cold dwell fatigue of titanium alloys. JOM 2022, 74, 3691–3692. [Google Scholar] [CrossRef]
Figure 1. The flowchart of decision science-driven assessment of Ti alloys for aircraft landing gear beams.
Aerospace 11 00051 g001
Figure 2. The ranks of Ti alloys evaluated by the ten multiple-attribute decision-making (MADM) methods. For example, all the MADM methods assign similar rank (green-shaded) to some alloys, e.g., Ti-1023-483Eβ-nano-α and Ti-1300-BM-nano-α. On the other hand, MADM methods assign a diverse rank (orange-shaded) to most other alloys, e.g., VT8-L-100-α-Col and Ti64.
Aerospace 11 00051 g002
Figure 3. The rank consolidation—(a) mean-based, and (b) principal component analysis (PCA)-based—of Ti alloys evaluated by the ten multiple-attribute decision-making (MADM) methods. The ranks of the top five alloys (Ti1300-BM-nano-α, Ti-LG-0.5Fe-BM-60αs, Ti-35632-0.5Fe-BM-28αs, Ti18-BM-nano-α, and Altan Titan 23-BM-nano-α, in that order) by both methods are identical.
Aerospace 11 00051 g003
Figure 4. The percentage differences in properties of the five top-ranked alloys—Ti1300-BM-nano-α, Ti-LG-0.5Fe-BM-60αs, Ti-35632-0.5Fe-BM-28αs, Ti18-BM-nano-α, and Altan Titan 23-BM-nano-α—with respect to the benchmark properties.
Aerospace 11 00051 g004
Figure 5. The rank charts of Ti alloys through the lens of (a) alloy type, (b) matrix, and (c) other phases.
Aerospace 11 00051 g005
Figure 6. Dendrogram of hierarchical clustering (HC) of the ranks of Ti alloys evaluated by the ten multiple-attribute decision-making (MADM) methods. For clarity, we have included the consolidated ranks of the five top-ranked alloys (marked in red).
Aerospace 11 00051 g006
Table 1. Ti alloys (metastable β, near-β, α + β, and near-α) from the literature. Includes alloy chemistry, alloy type, molybdenum equivalent, solution treatment, aging, matrix, other phases, and alloy designation, a unique identifier assigned for the current investigation. The rows are color-coded with blue, green, purple, and orange for metastable β, near-β, α + β, and near-α, respectively, for easy identification.
Sl#Alloy Chemistry (wt.%)
(Alloy Type)
Mo-EqSolution
Treatment
AgingMatrixOther
Phases
Alloy
Designation
Ref.
1Ti-15V-3Cr-3Al-3Sn
(metastable β)
11.85900 °C forged- ST810 °C-1 h-WQ (i.e., ST above βtr) 500 °C–8 h–ACEquiaxed β (Eβ) grainsα pptsTi-15333-210Eβ-nano-α[40]
2Ti-15V-3Cr-3Al-3Sn-C-B
(metastable β)
11.85900 °C forged–ST810 °C-1 h-WQ (i.e., ST above βtr) 500 °C–8 h–ACEquiaxed β (Eβ) grainsfine α ppt, needle borides and spherical carbidesTi-15333-BC-44Eβ-nano-α-TiB-TiC[40]
3Ti-10V-2Fe-3Al
(metastable β)
9.5950 °C forged–ST850 °C-1 h–WQ (i.e., ST above βtr) 500 °C–8 h–ACEquiaxed β (Eβ) grainsα pptsTi-1023-483Eβ-nano-α[40]
4Ti-10V-2Fe-3Al-C-B
(metastable β)
9.5950 °C forged–ST850 °C-1 h–WQ (i.e., ST above βtr) 500 °C–8 h–ACEquiaxed β (Eβ) grainsfine α ppt, needle borides and spherical carbidesTi-1023BC-56Eβ-nano-α-TiB-TiC[40]
5Ti-5Al-5V-5Mo-3Cr
(metastable β)
8.21000 °C forged-ST900 °C-1 h-WQ (i.e., ST above βtr)500 °C–8 h–ACEquiaxed β (Eβ) grainsα pptsTi-LG-308Eβ-nano-α[40]
6Ti-5Al-5V-5Mo-3Cr-C-B
(metastable β)
8.21000 °C forged-ST900 °C-1 h-WQ (i.e., ST above βtr) 500 °C–8 h–ACEquiaxed β (Eβ) grainsNATi-LG-BC-42Eβ-nano-α-TiB-TiC[40]
7Ti-5Al-5V-5Mo-3Cr
(metastable β)
8.2(α/β) hand forged-(α/β)ST-aging (α/β route) (i.e., ST below βtr) “done aging”-parameters NABimodal (globular primary α + trans β)α in trans-βTi-LG-α/βF-BM-αs[8]
8Ti-5Al-5V-5Mo-3Cr
(metastable β)
8.2(α/β) hand forged-(β)ST-Aging (β-annealed route) (i.e., ST above βtr) “done aging”-parameters NAEquiaxed β (Eβ) grains (gb α)α pptsTi-LG-α/βF-250Eβ-α[8]
9Ti-5Al-5V-5Mo-3Cr
(metastable β)
8.2(β) hand forged-(α/β) ST-aging (β-forged route) (i.e., ST above βtr) “done aging”-parameters NA.Bimodal (globular primary α + trans β)α in trans-βTi-LG-βF-BM-αs[8]
10Ti-6Al-4.5Cr-1.5Mn
(near-α)
3.75Rolling at 770 °C (in the α + β phase field; α/α + β transition is 720 °C)/ST750 °C-1.5 h-AC (Vac)NoneEquiaxed α (Eα) grainsneedles of βTi-nα-Eα-β[16]
11Ti-5Al-5V-5Mo-1Cr-1Fe (VT-22)
(metastable β)
7.85850 °C-2 h-FC, 750 °C-2 h-AC500 °C-4 h-AC Basket weave (BW) trans-β and α platelets (11% Vf)α in trans-βTi-5551-1Fe-BW[41]
12Ti-6.5Al-3.3Mo-0.3Si
(α + β)
-3.2Hot 2D forging at 950 °C; ST1030 °C-0.5 h-FC (i.e., ST above βtr) NALamellar (L) with α coloniesNAVT8-L-100-α-Col[42]
13Ti-6.5Al-3.3Mo-0.3Si-1.5B
(α + β)
-3.2Hot 2D forging at 950 °C; ST1030 °C–0.5 h-FC (i.e., ST above βtr) NALamellar (L) with α coloniesTiB whiskersVT8-1.5B-L-22-α-Col-TiB-TiC[42]
14Ti-6.5Al-3.3Mo-0.3Si-2B
(α + β)
-3.2Hot 2D forging at 950 °C; ST1030 °C–0.5 h-FC (i.e., ST above βtr) NALamellar (L) with α coloniesTiB whiskersVT8-2B-L-27-α-Col-TiB-TiC[42]
15Ti-5Al-5V-5Mo-3Cr-0.5Fe
(metastable β)
9.6ST821 °C-3 h-fan cooling (i.e., ST below βtr) 621 °C-6 h-ACBimodal (globular primary α + trans β)α in trans-βTi-LG-0.5Fe-BM-60αs[43]
16Ti-5Al-5V-5Mo-3Cr-0.5Fe
(metastable β)
9.6ST830 °C-AC (i.e., ST below βtr)600 °C-10 h-FCBimodal (globular primary α + trans β)α in trans-βTi-LG-0.5Fe-BM-30αs[44]
17Ti-5Al-12Nb-5Mo-3Cr-0.5Fe
(metastable β)
9.6ST830 °C-AC (i.e., ST below βtr)600 °C-10 h-FCBimodal (globular primary α + trans β))α in trans-βTi-5-12-53-0.5Fe-BM-70αs[44]
18Ti-3Al-8V-6Cr-4Zr-4Mo (Beta C)
(metastable β)
16ST927 °C-AC–40% deep rolling followed by aging (i.e., ST above βtr) 400 °C–4 hβ matrixα pptsBeta-C-Eβ-α[45]
19Ti-3.5Al-5Mo-6V-3Cr-2Sn-0.5Fe
(metastable β)
11.8ST775 °C-1 h-AC (i.e., ST below βtr)440 °C–8 h–ACBimodal (globular primary α + trans β)α in trans-βTi-35632-0.5Fe-BM-28αs[46]
20Ti-5Al-5V-5Mo-3Cr-1Zr
(metastable β)
8.2ST 790 °C (2 h)-(i.e., below βtr); AC600 °C–6 h-ACBimodal (globular primary α + trans β)α in trans-βTi-LG-1 Zr-BM-125αs[47]
21Ti-2Al-9.2Mo-2Fe
(metastable β)
13.0ST850 °C-1 h-WQ (i.e., ST above βtr)500 °C–2 h–WQ.Equiaxed β (Eβ) grainsω and α pptsTi292-Eβmicro-nano-α[48]
22Ti-15V-3Sn-3Al-3Cr
(metastable β)
11.9ST800 °C-20 min.-WQ to RT (200 to 300 µm grain size)/cold rolling (80% thickness reduction; three passes)—above β transus produces nanosize β450 °C–4 hEquiaxed β (Eβ) grainsα ppts Ti-15333-Eβnano-nano-α[49]
23Ti-10V-2Fe-3Al
(metastable β)
9.5860 °C rolling-ST830 °C-1 h–WQ (i.e., ST above βtr)500 °C–4 h–ACEquiaxed β (Eβ) grainsα ppts Ti-1023-Xeβ-nano-α[50]
24Ti-5.5Al-5V-5Mo-2.3Cr-0.8Fe-0.15O
(metastable β)
8.9ST820 °C–2 h–AC

(i.e., ST below βtr)
593 °C–8 h-ACBimodal (globular primary α + trans β)α ppts Ti18-BM-nano–α[51]
25Ti-3.5Al-9V-2.5Mo-5Sn-3Zr-0.2O
(metastable β)
8.5ST760 °C–2 h–AC
(i.e., ST below βtr)
538 °C–8 h-ACBimodal (globular primary α + trans β)α pptsAltan Titan 23-BM-nano-α[52]
26Ti-5Al-4V-4Mo-3Zr-4Cr
(metastable β)
8.1ST800 °C–1 h–AC
(i.e., ST below βtr)
500 °C–4 h-ACBimodal (globular primary α + trans β)α pptsTi1300-BM-nano-α[53]
27Ti–6Al–2Sn–2Zr–3Mo–1Cr–2Nb
(α + β)
-0.8β forging followed by Water quenching and the α/β ST at 900 °C–1 h-WQ575 °C–4 h-ACBimodal (globular primary α + trans β)α pptsTC21-BM-nano-α[54]
28Ti-15Mo-3Nb-3Al-0.2Si
(metastable β)
12.8β ST-AC (i.e., ST above βtr)538 °C–8 h-ACTransformed β lamellarα pptsTi21S[55]
29Ti-5Al-2Sn-4Mo-2Zr-4Cr
(near-β)
5.4α/β 800 °C ST-AC
(i.e., ST below βtr)
635 °C–8 h-ACBimodal (globular primary α + trans β)α pptsTi17[56]
30Ti-6Al-2Sn-4Zr-6Mo
(α + β)
0α/β 885 °C ST-AC
(i.e., ST below βtr)
595 °C–8 h-ACBimodal (globular primary α + trans β)α pptsTi6246[57]
31Ti-6Al-6V-2Sn-0.5Fe-0.5Cu
(α + β)
-0.5α/β 871 °C ST-WQ
(i.e., ST below βtr)
538 °C–4 h-ACBimodal (globular primary α + trans β)α pptsTi662[58]
32Ti-6Al-4V
(α + β)
-3.32α/β 955 °C–ST-WQ
(i.e., ST below βtr)
538 °C–4 h-ACBimodal (globular primary α + trans β)α pptsTi64[59]
Table 2. The properties—density (d), yield strength (YS), ultimate tensile strength (UTS), elongation (%EL), and reduction in area (%RA)—of the Ti alloys (metastable β, α + β, near-β, and near-α alloys) from the literature. The properties d, YS, and %EL forming the data matrix are highlighted in green background.
Alloy Designationd (g/cm3)YS
(MPa)
UTS
(MPa)
%El.%RARef.
Ti-15333-210Eβ-nano-α4.67117912404.3NA[40]
Ti-15333-BC-44Eβ-nano-α-TiB-TiC4.68127812770.3NA[40]
Ti-1023-483Eβ-nano-α4.5793213060.73NA[40]
Ti-1023BC-56Eβ-nano-α-TiB-TiC4.55130513850.98NA[40]
Ti-LG-308Eβ-nano-α4.57110712671.2NA[40]
Ti-LG-BC-42Eβ-nano-α-TiB-TiC4.58140014630.5NA[40]
Ti-LG-α/βF-BM-αs4.57135014124.6NA[8]
Ti-LG-α/βF-250Eβ-α4.57133213732.1NA[8]
Ti-LG-βF-BM-αs4.57128813656.1NA[8]
Ti-nα-Eα-β4.43105210918.3NA[16]
Ti-5551-1Fe-BW4.64119612861021.8[41]
VT8-L-100-α-Col4.408709251122[42]
VT8-1.5B-L-22-α-Col-TiB-TiC4.35112512406.516[42]
VT8-2B-L-27-α-Col-TiB-TiC4.33102511753.36[42]
Ti-LG-0.5Fe-BM-60αs4.611245131618NA[43]
Ti-LG-0.5Fe-BM-30αs4.64136914404.7NA[44]
Ti-5-12-53-0.5Fe-BM-70αs4.84122012934NA[44]
Beta-C-Eβ-α4.781580NA2NA[45]
Ti-35632-0.5Fe-BM-28αs4.7016241720611[46]
Ti-LG-1 Zr-BM-125αs4.61124812938.515[47]
Ti292-Eβmicro-nano-α4.721543NA1NA[48]
Ti-15333-Eβnano-nano-α4.70148315622NA[49]
Ti-1023-Xeβ-nano-α4.571461NA0.5NA[50]
Ti18-BM-nano-α4.58132214351019[51]
Altan Titan 23-BM-nano-α4.85124012881249[52]
Ti1300-BM-nano-α4.611300140016.521[53]
TC21-BM-nano-α4.6513751480720.5[54]
Ti21S4.94135014508NA[55]
Ti174.65110011801025[56]
Ti62464.64111812141337[57]
Ti6624.53110512058NA[58]
Ti644.438959651020[59]
Table 3. Descriptive statistics of the properties of the Ti alloys from the literature: the last column presents the corresponding values of the benchmark or goal requirements compiled [7,8,9,27] for aircraft landing gear beams.
AttributeNMinimumMaximumMean ± st.dev.Benchmark
d (g/cm3) 324.34.94.6 ± 0.14.57
YS (MPa)32870.01624.01250.5 ± 187.81250
UTS (MPa)29925.01720.01311.9 ± 163.91300
%El.320.318.06.3 ± 4.85
%RA136.049.021.8 ± 11.0NA
Table 4. The Spearman rank (Sρ) correlation among the ten multiple-attribute decision-making (MADM) methods. Sρ ≥ 0.55 are highlighted in green background.
SAWSMARTMEWTOPSISWEDBAMOOAOCRAVIKORARAS
SMART0.857
MEW0.8200.465
TOPSIS0.8080.4640.926
WEDBA0.7060.9440.2370.233
MOORA0.8880.5710.9680.9700.351
OCRA0.6230.2080.9100.9330.0480.889
VIKOR0.8571.0000.4650.4640.9440.5710.208
ARAS0.8410.4990.9680.9840.2680.9880.9270.499
ROVM0.8571.0000.4650.4640.9440.5710.2081.0000.499
Table 5. The eigenvalues (and their proportion) by principal component analysis (PCA) of the ranks of the Ti alloys evaluated by the ten multiple-attribute decision-making (MADM) methods.
PC1PC2PC3PC4PC5PC6PC7PC8PC9PC10
Eigenvalue7.12782.68280.08150.04800.03030.01860.00670.00420.00000.0000
Proportion0.7130.2680.0080.0050.0030.0020.0010.0000.0000.000
Cumulative0.7130.9810.9890.9940.9970.9991.0001.0001.0001.000
Disclaimer/Publisher’s Note: The statements, opinions and data contained in all publications are solely those of the individual author(s) and contributor(s) and not of MDPI and/or the editor(s). MDPI and/or the editor(s) disclaim responsibility for any injury to people or property resulting from any ideas, methods, instructions or products referred to in the content.

