
Testing Structural Elements under Multiaxial Loading: A Numerical Model of the Bench to Understand and Predict Complex Boundary Conditions


Abstract
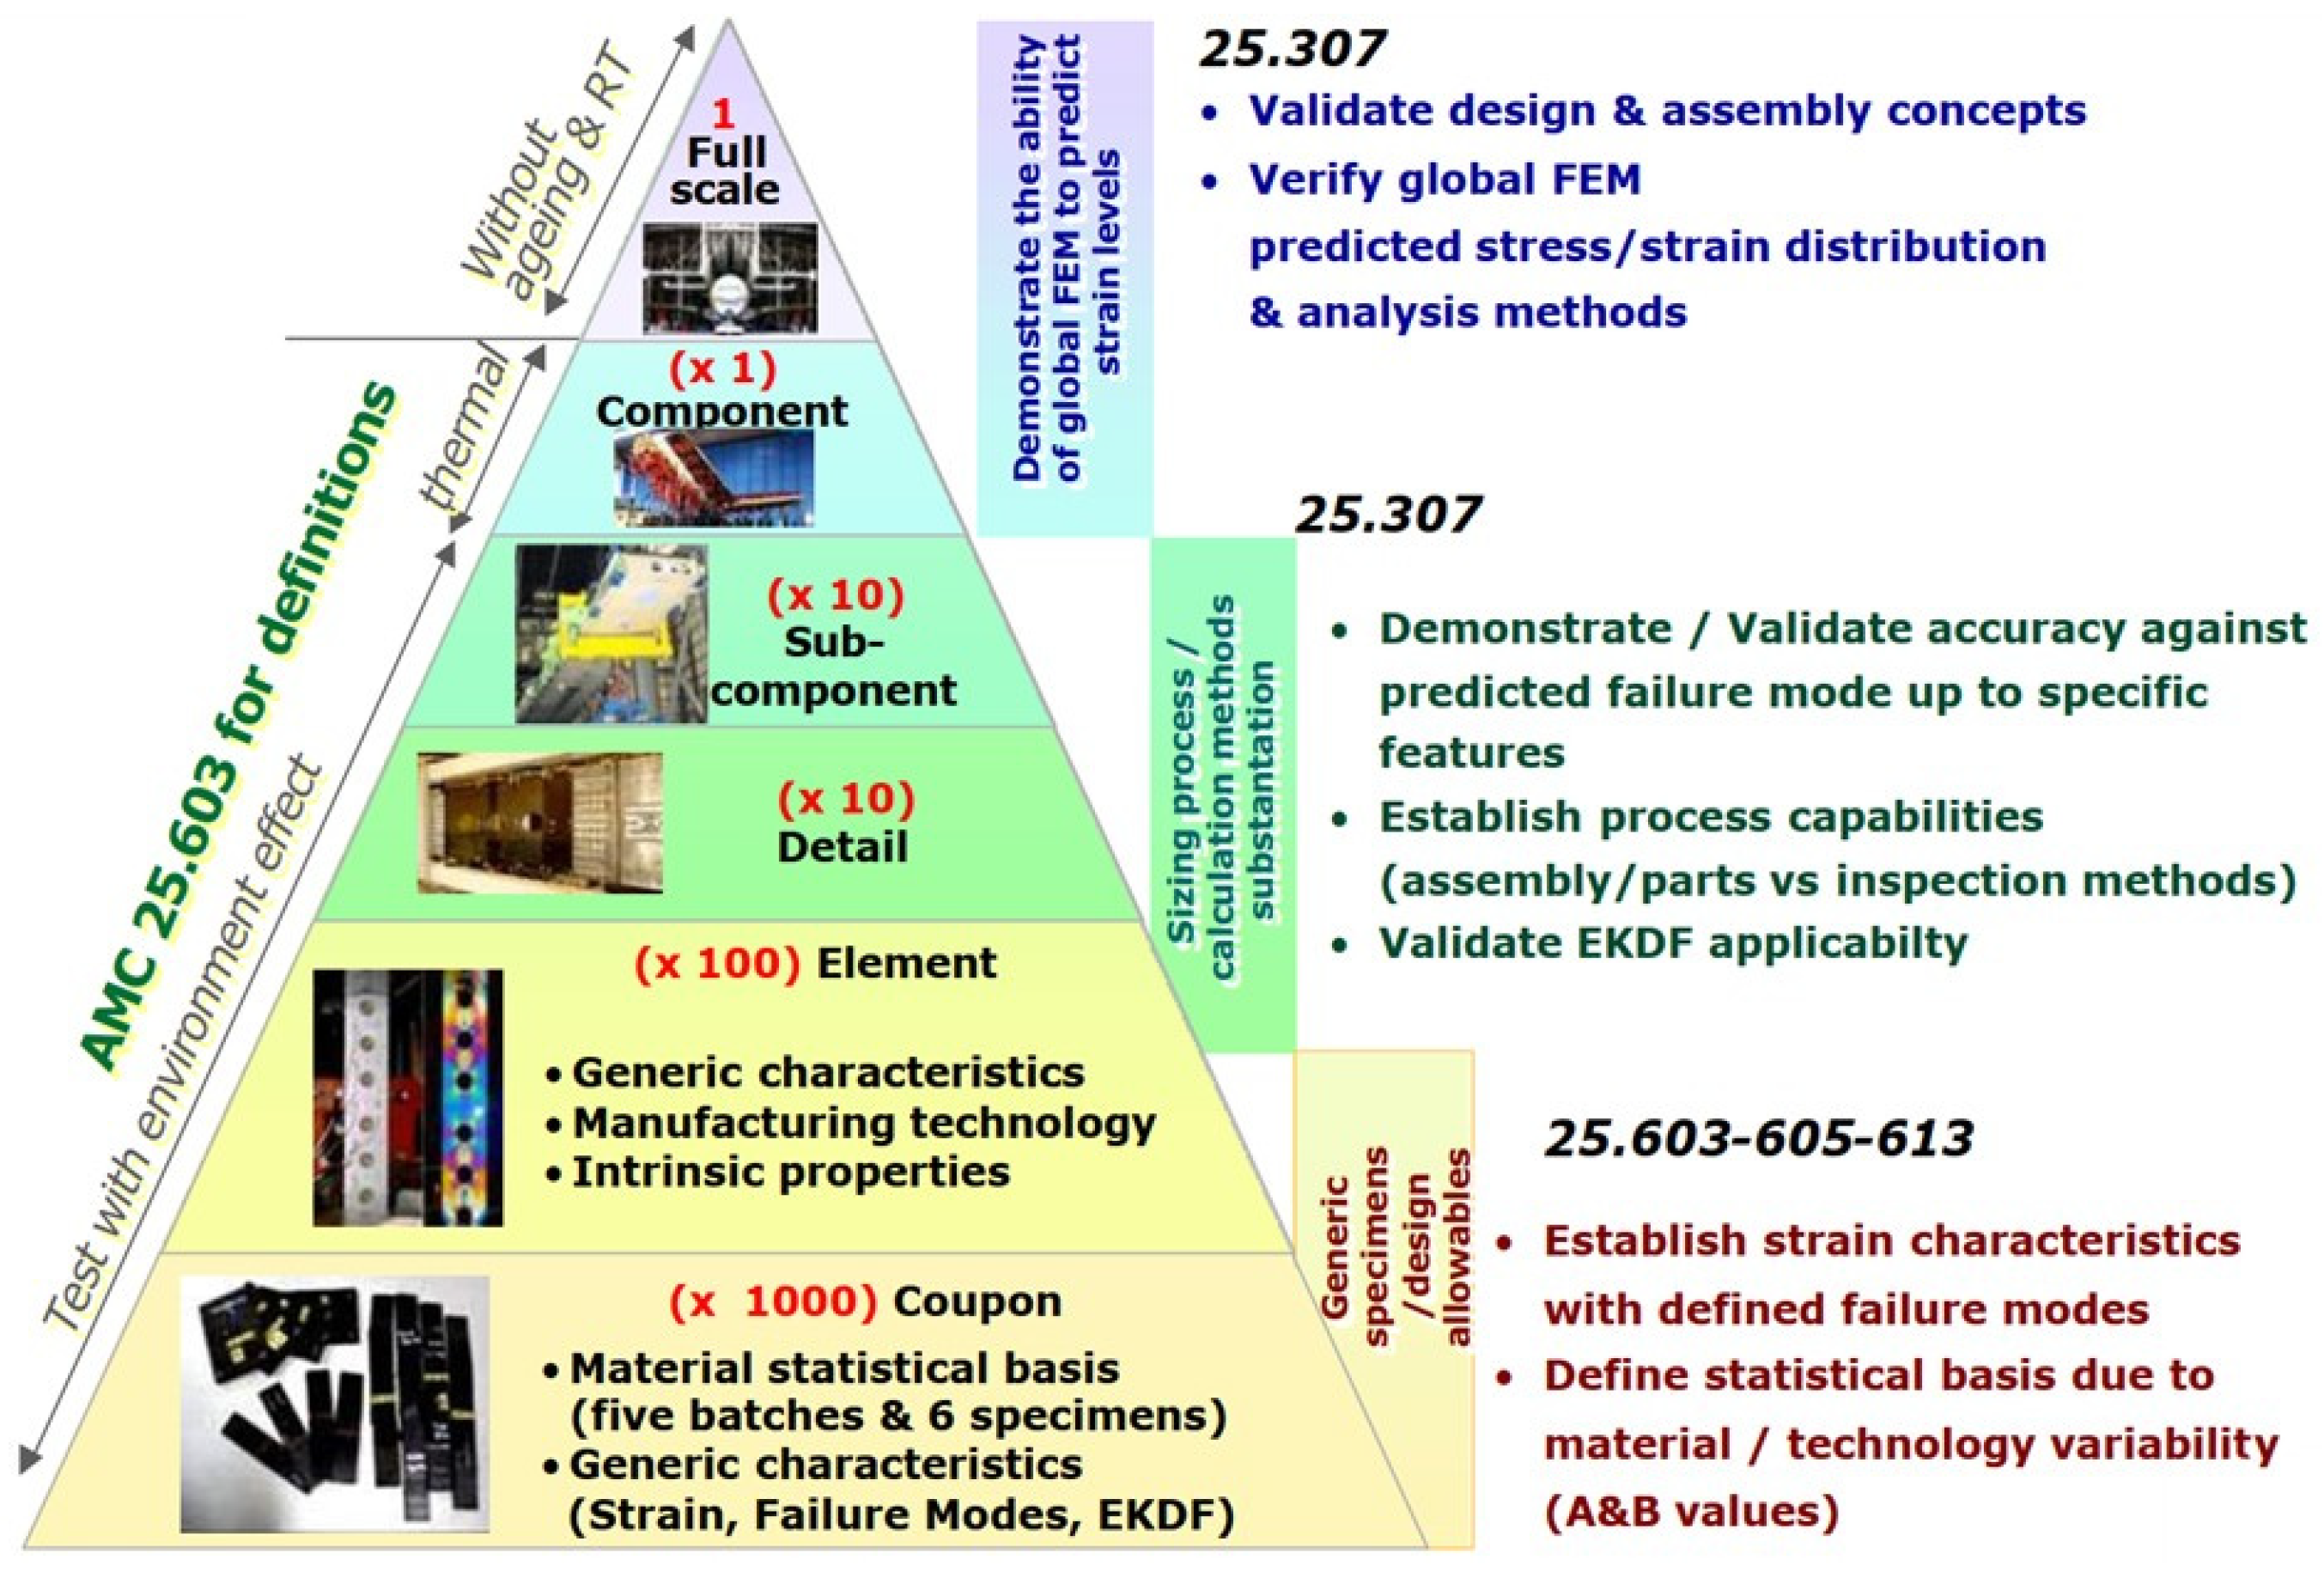
1. Introduction
2. Materials and Test Rig
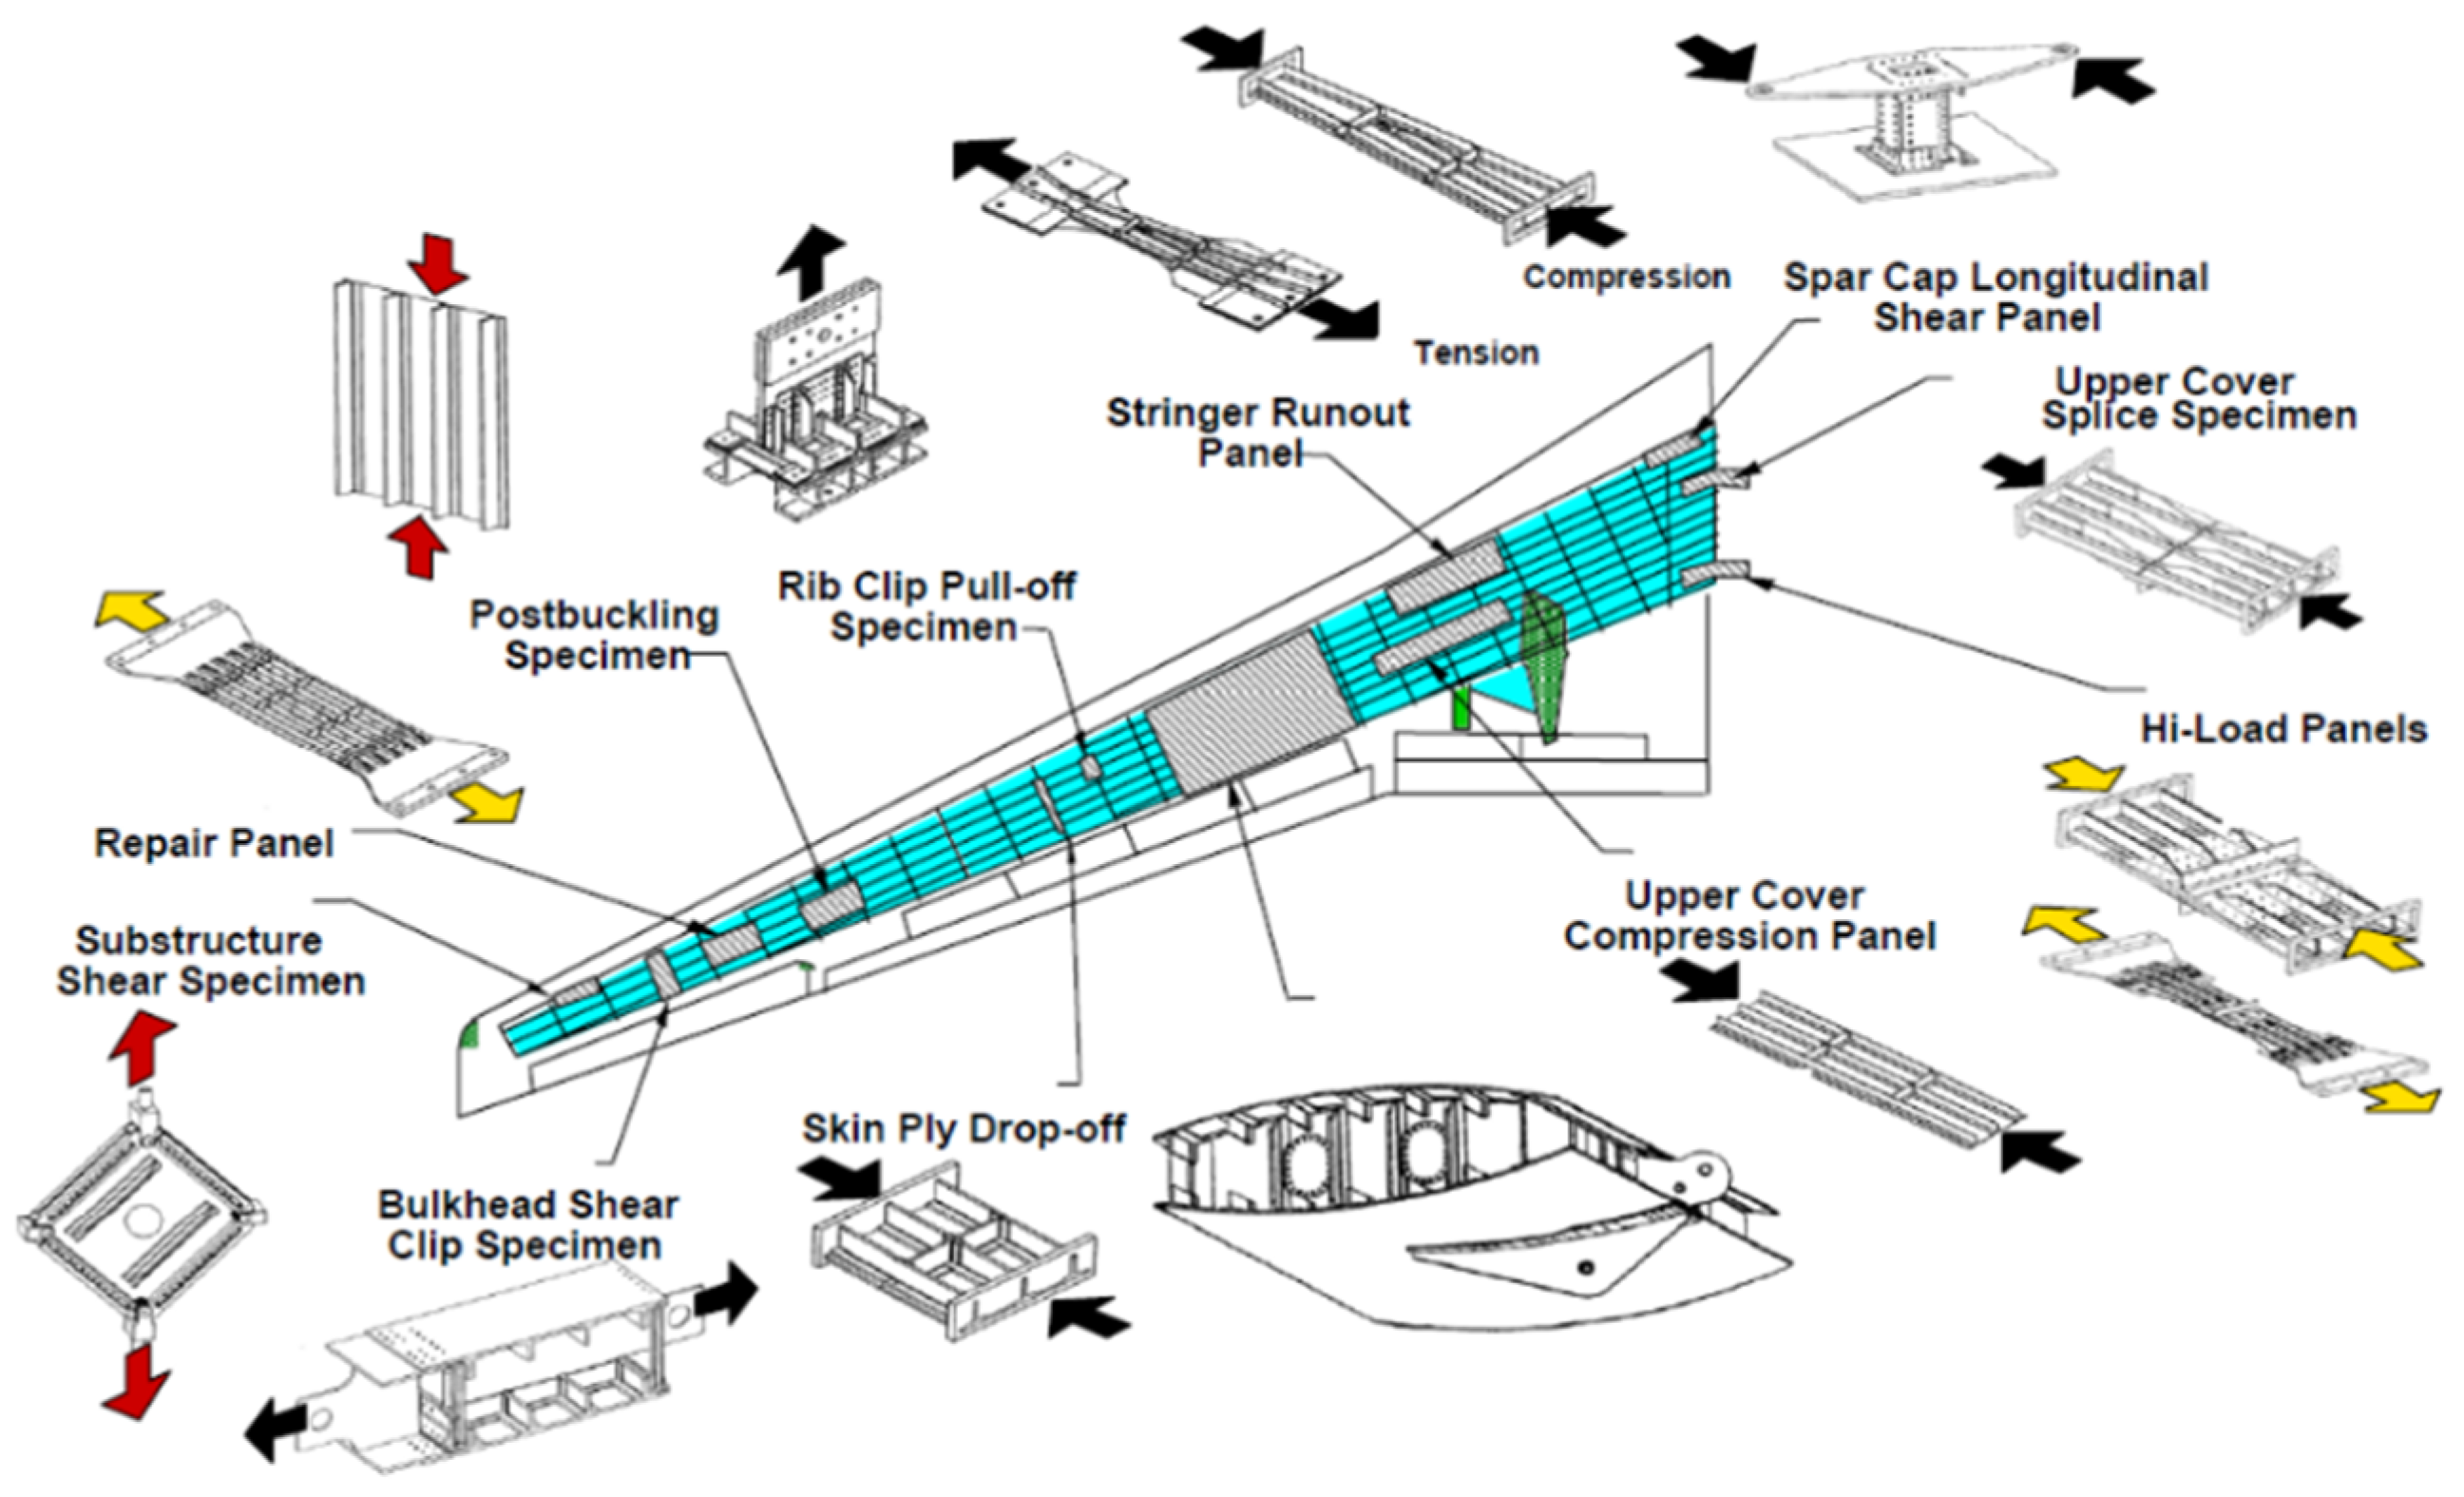
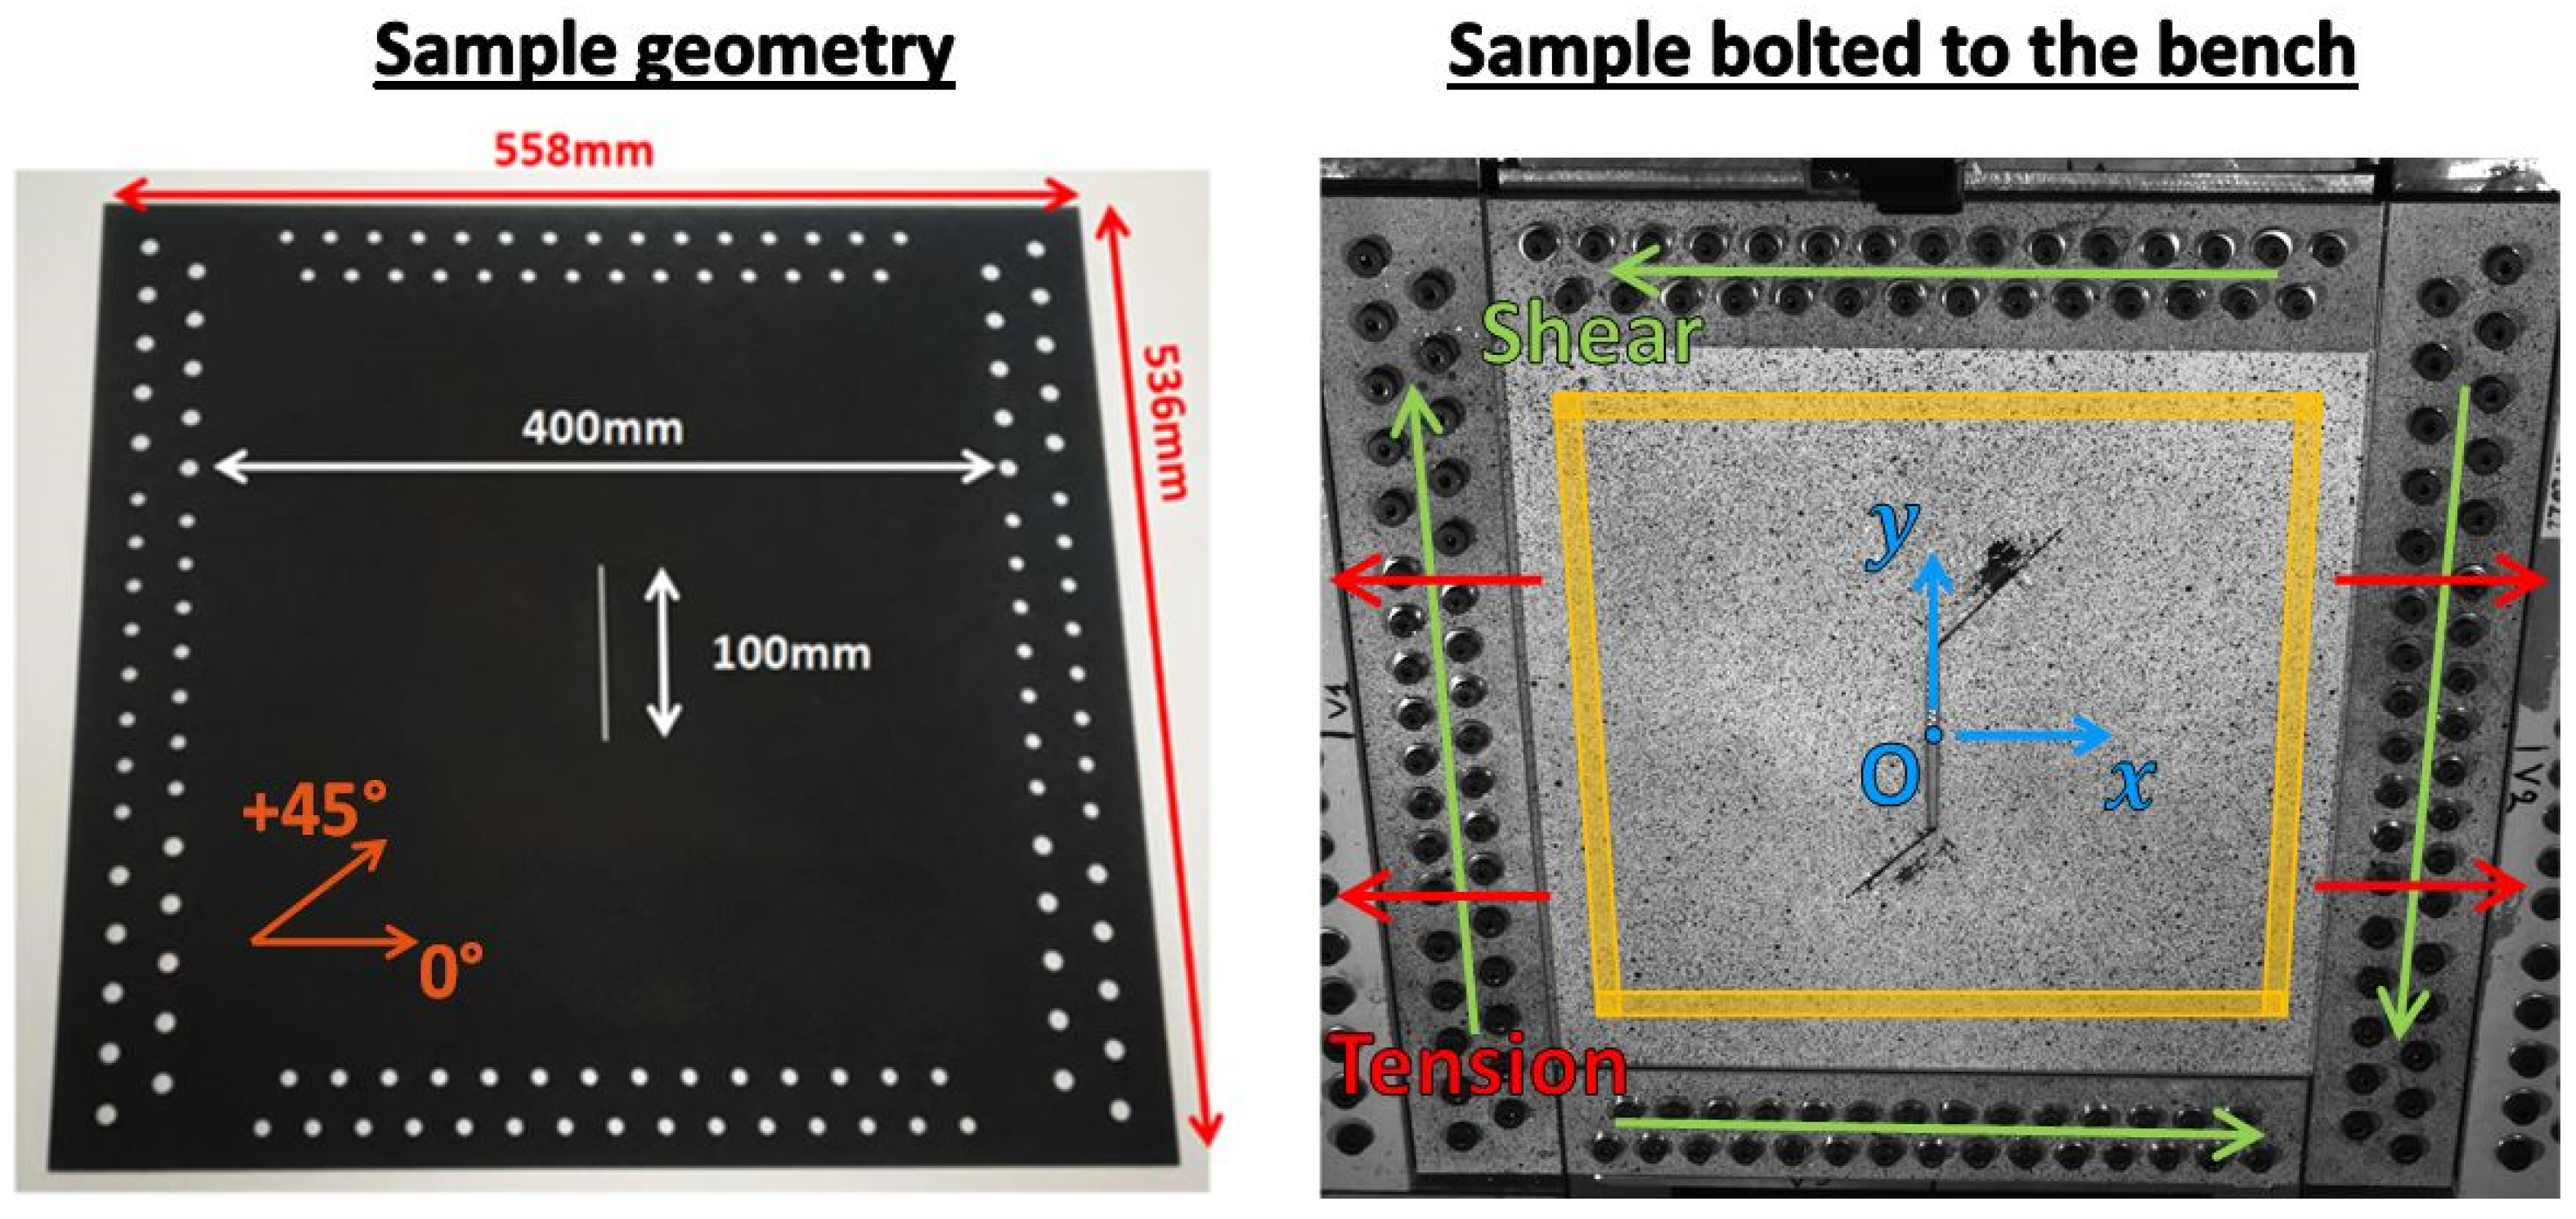
2.1. Specimens and Test Matrix
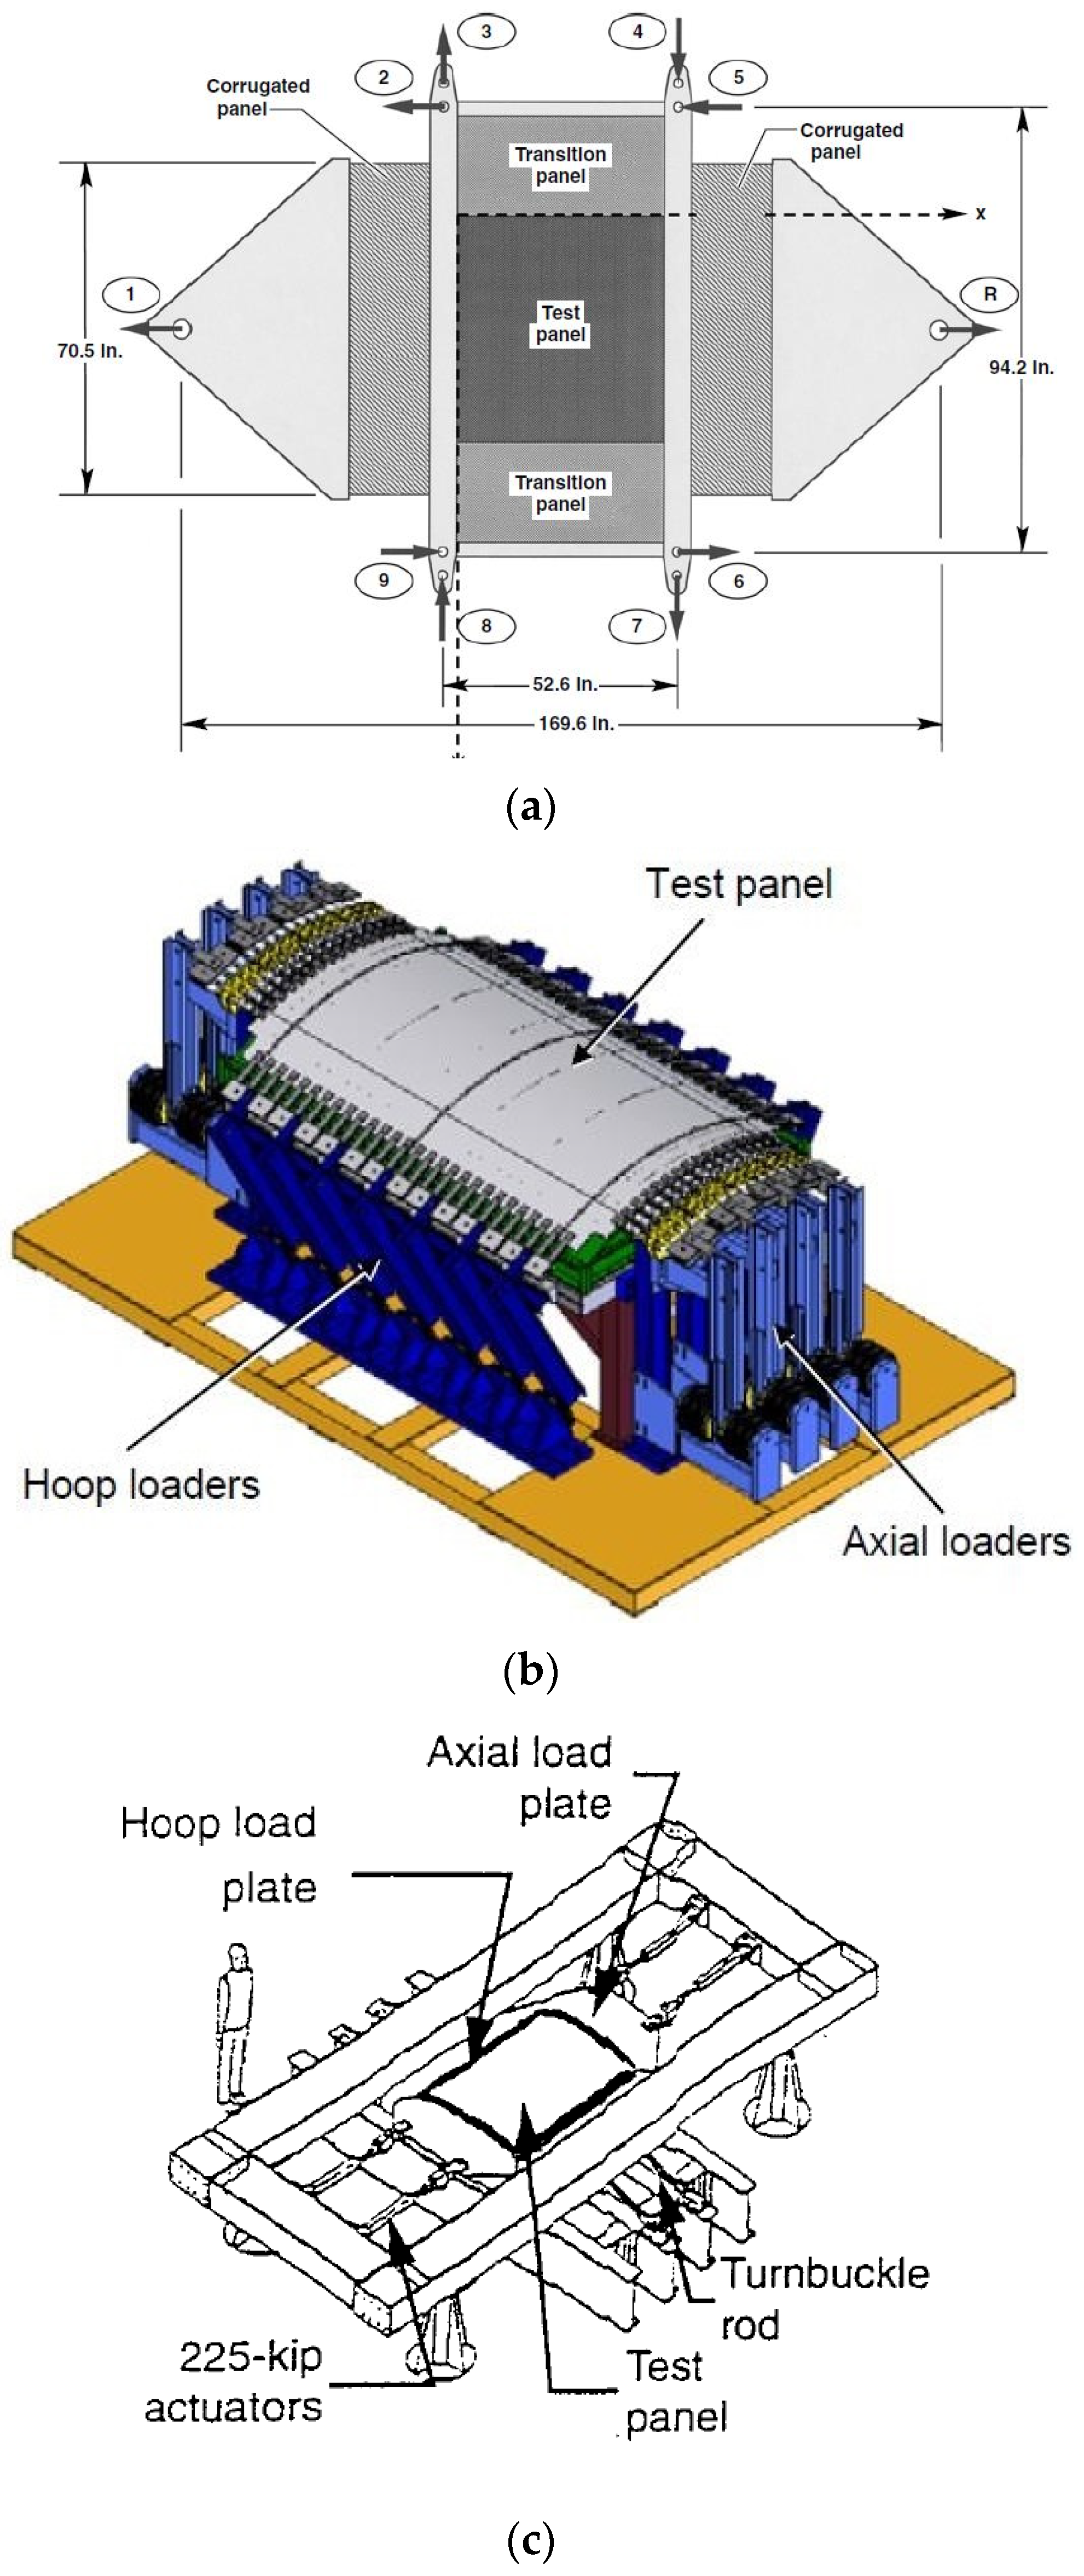
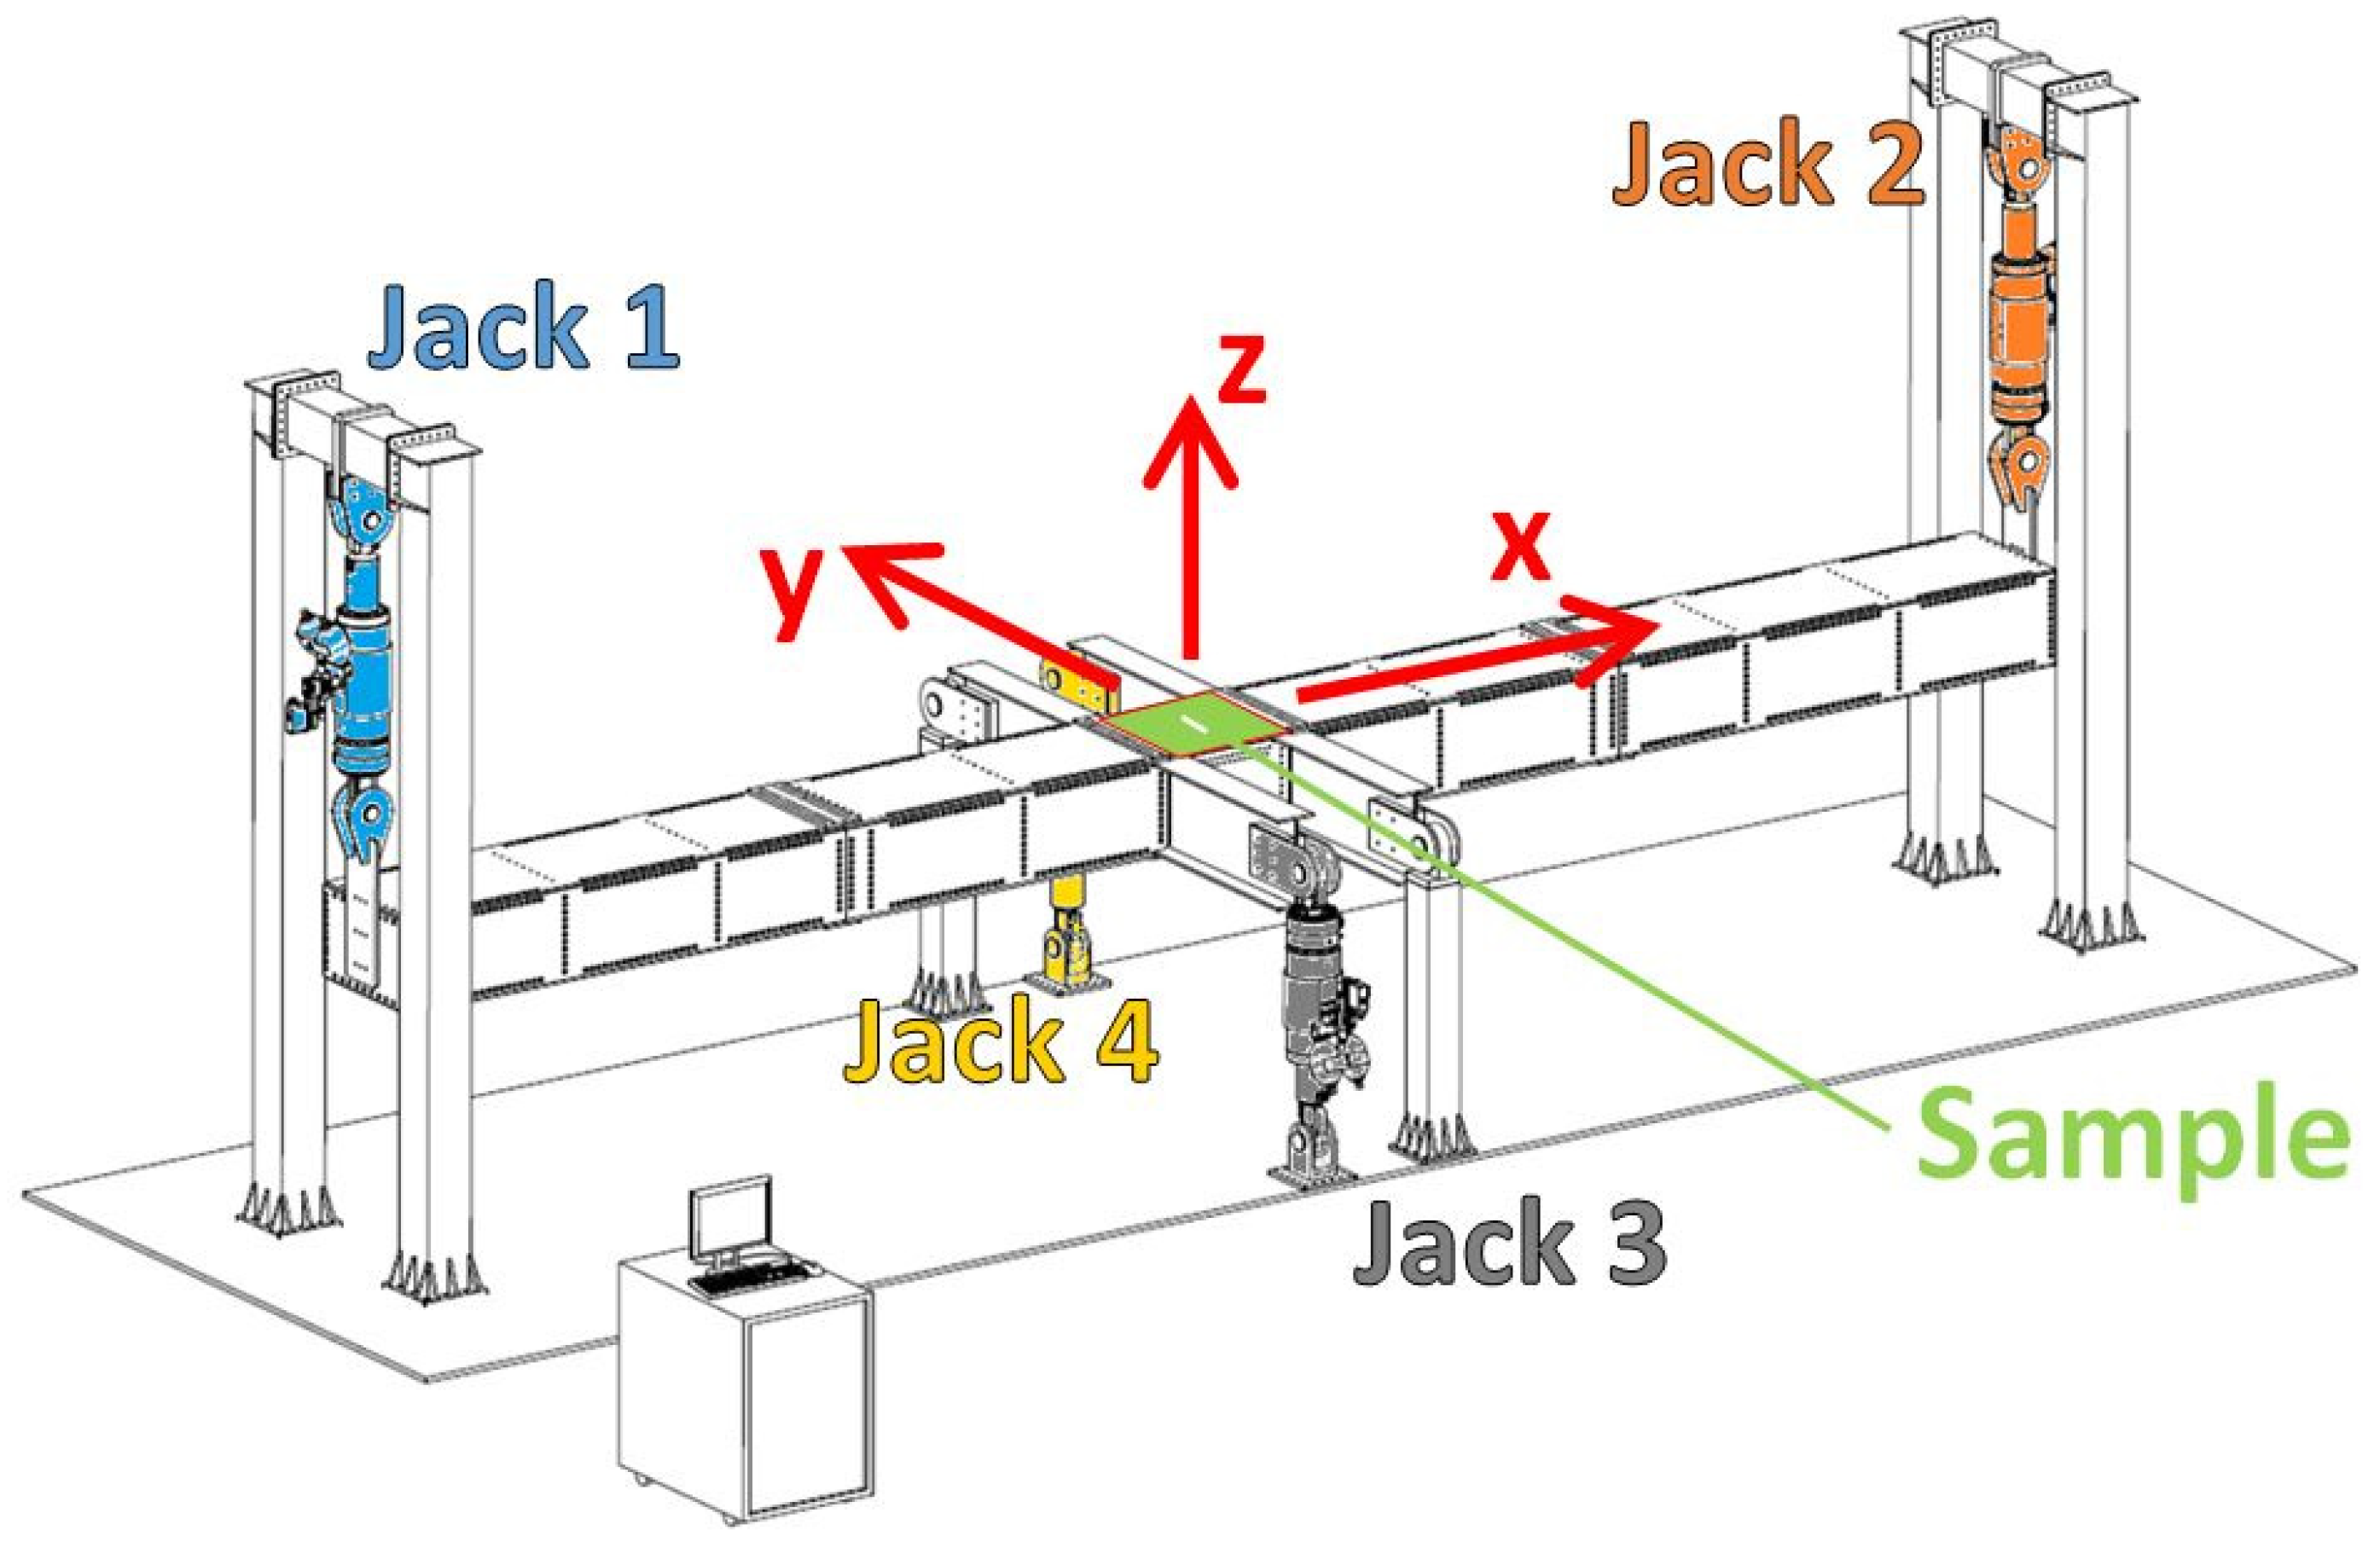
2.2. Presentation of the VERTEX Test Rig
2.3. Test Data Processing


3. Modelling of the VERTEX Test Rig
3.1. Modelling Strategies for the VERTEX Bench
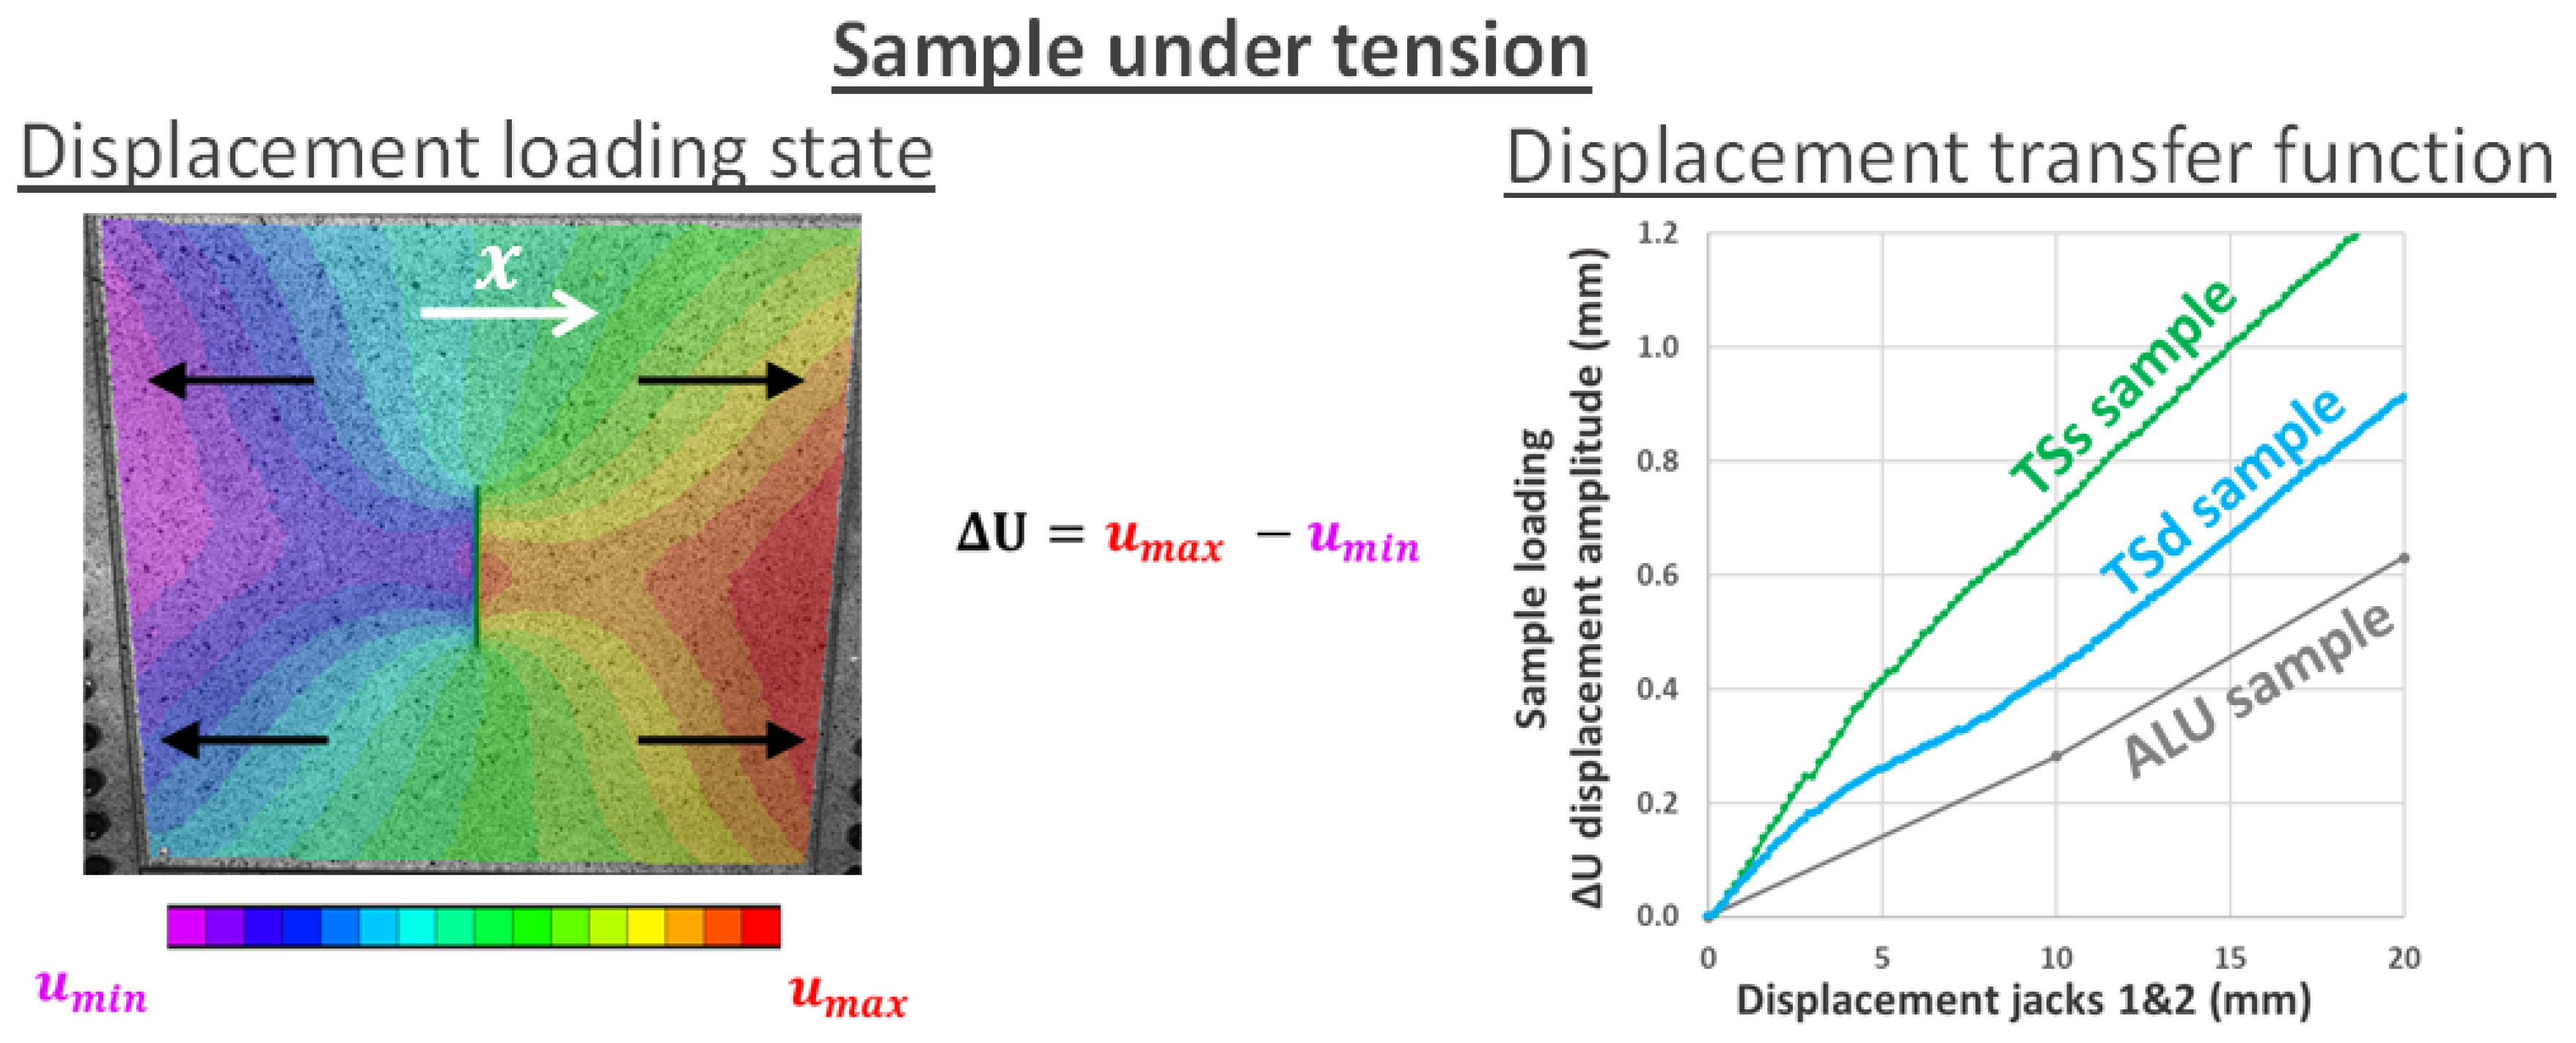
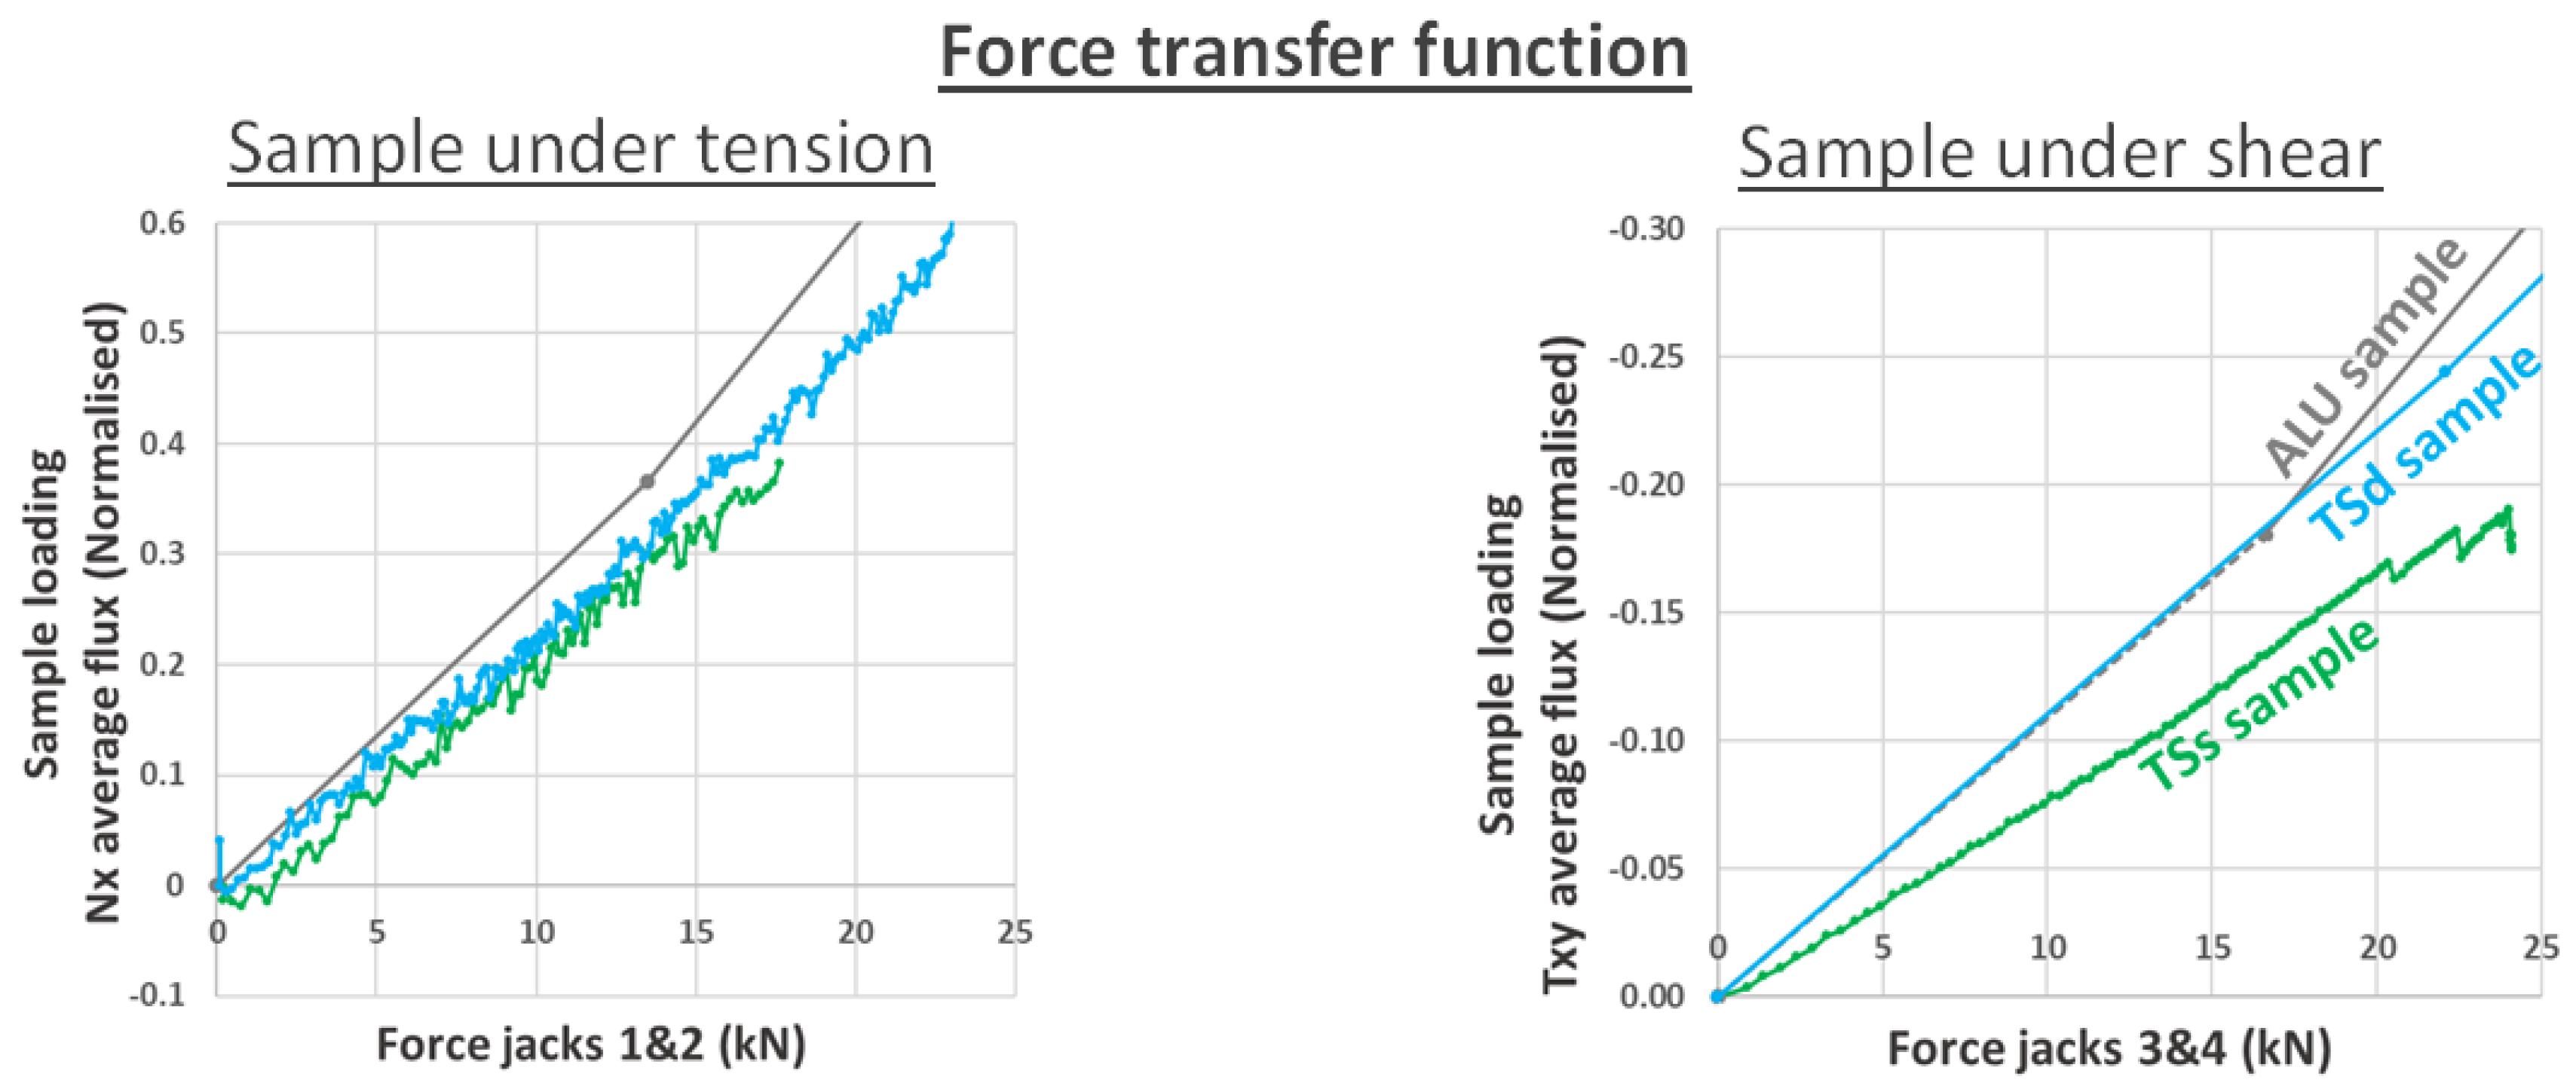
3.1.1. Transfer Function
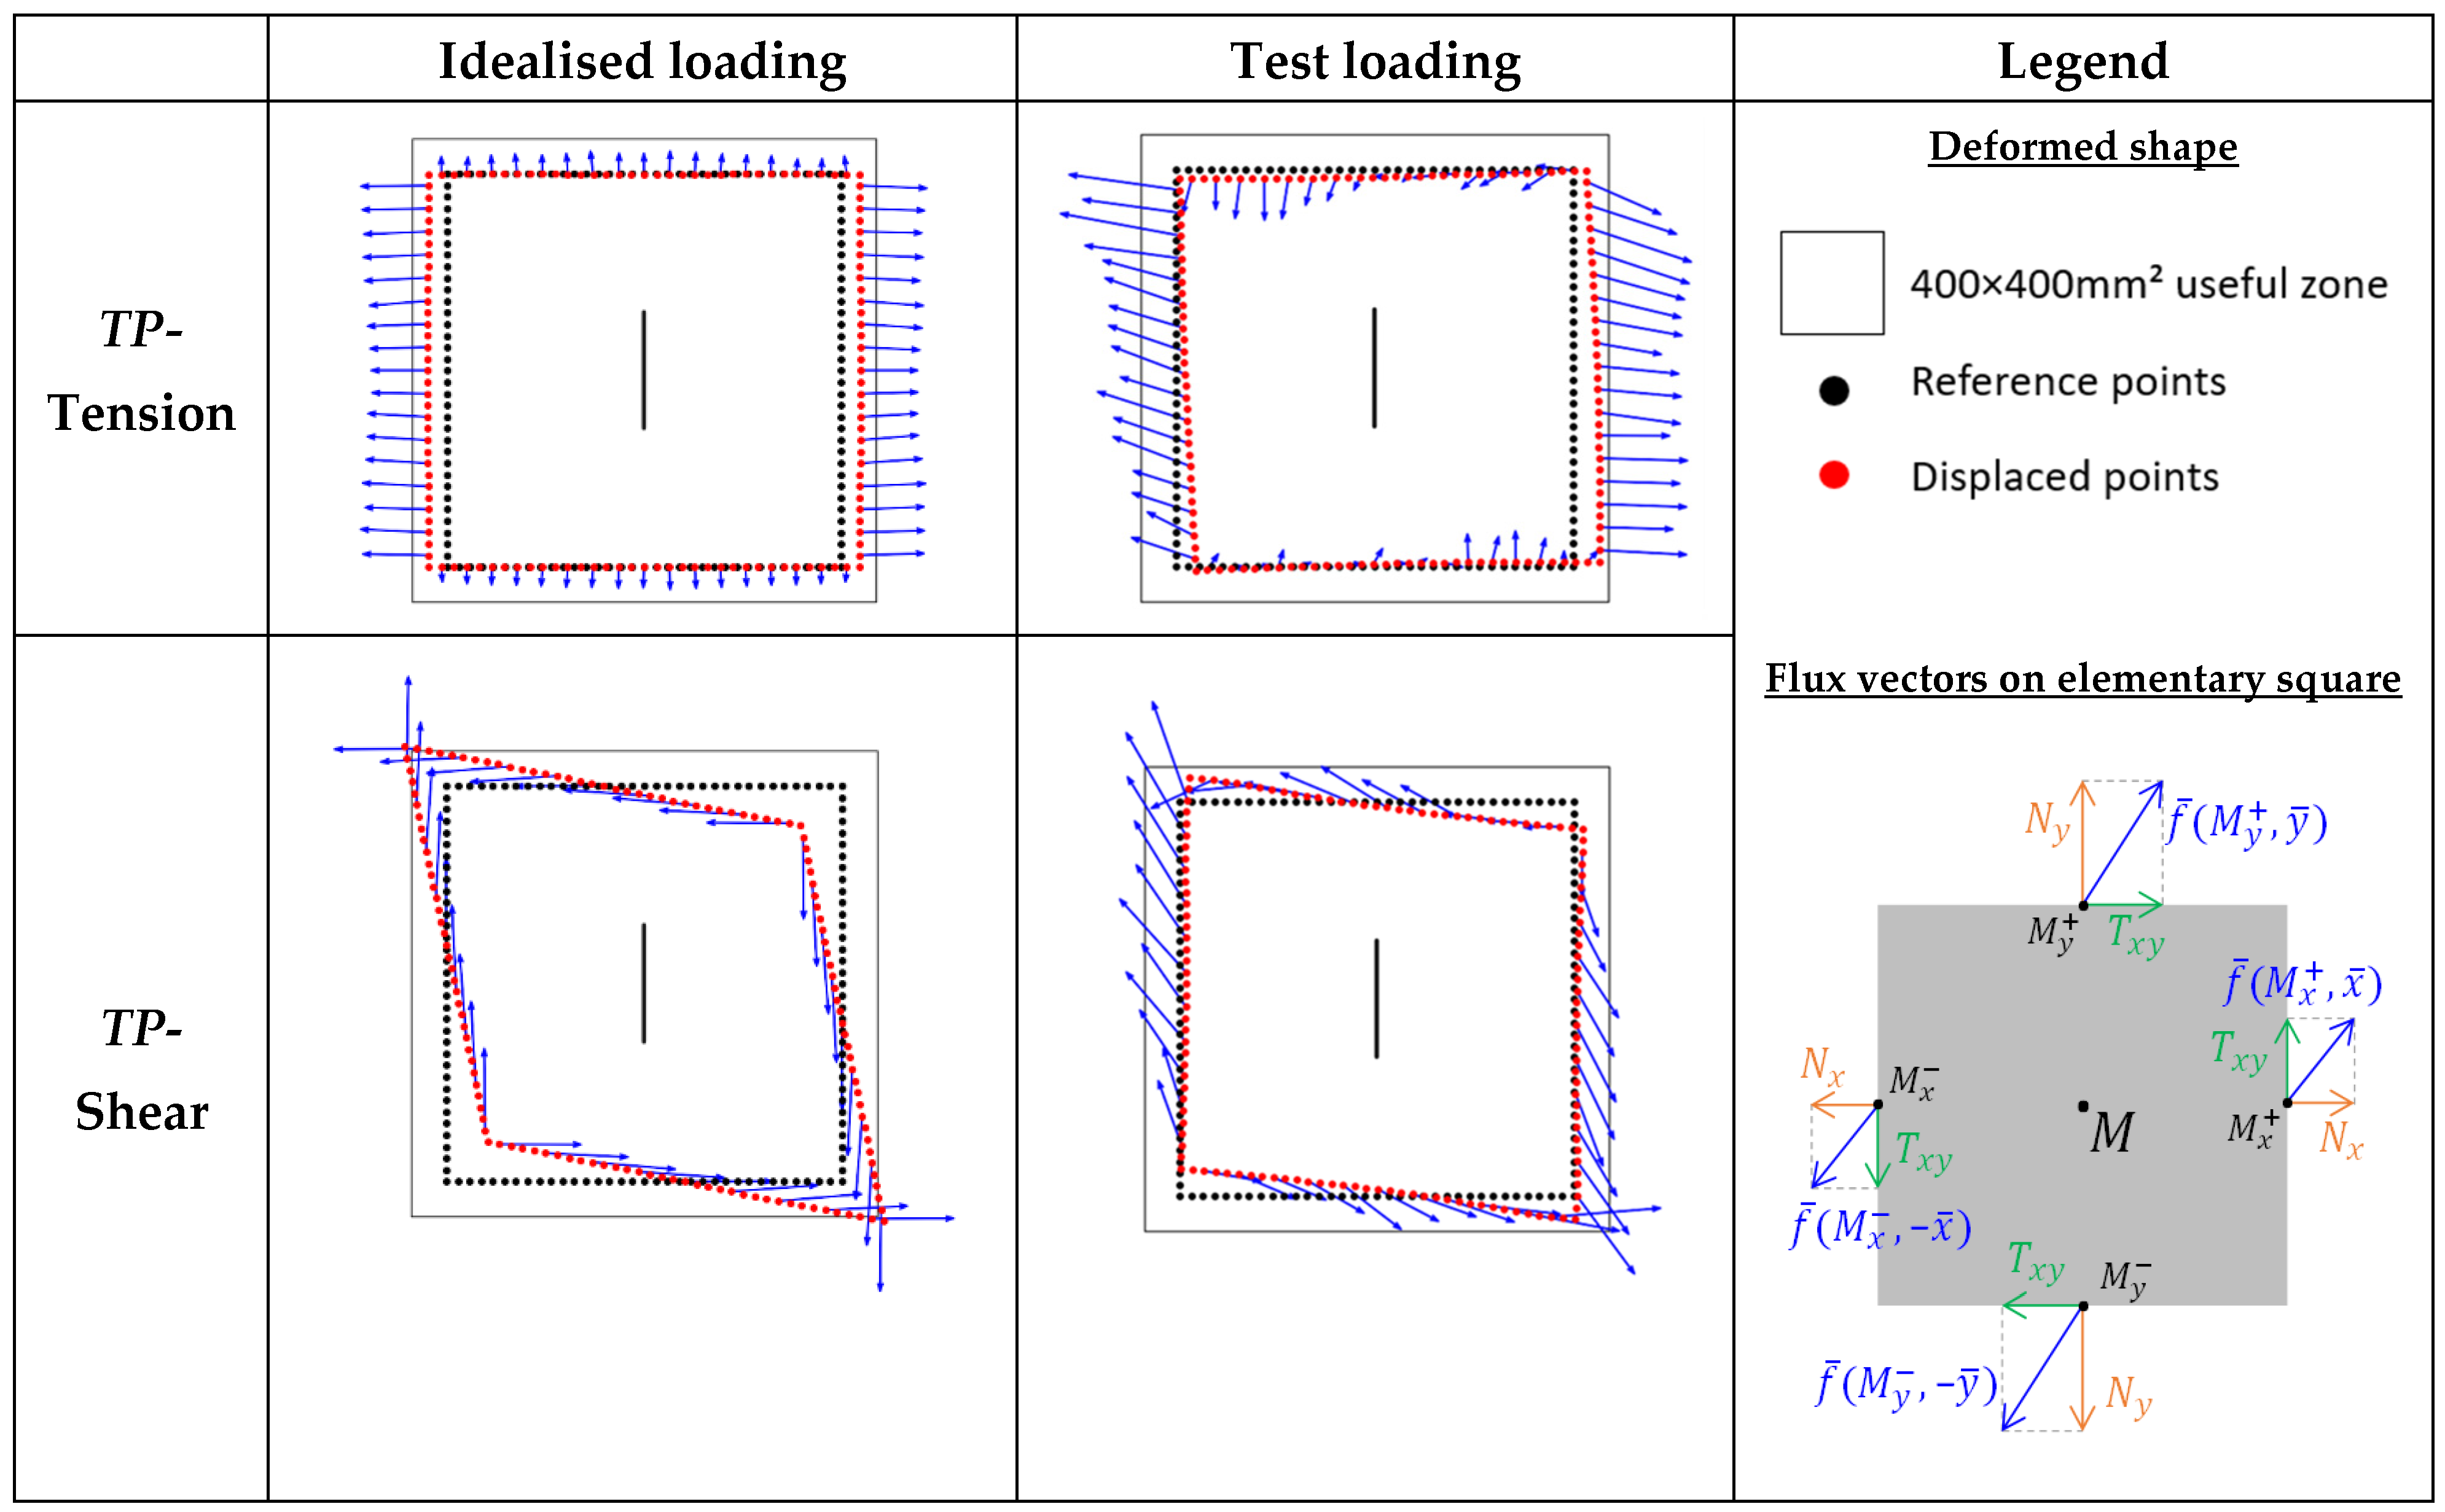
3.1.2. Ideal Boundary Conditions: Reference Model
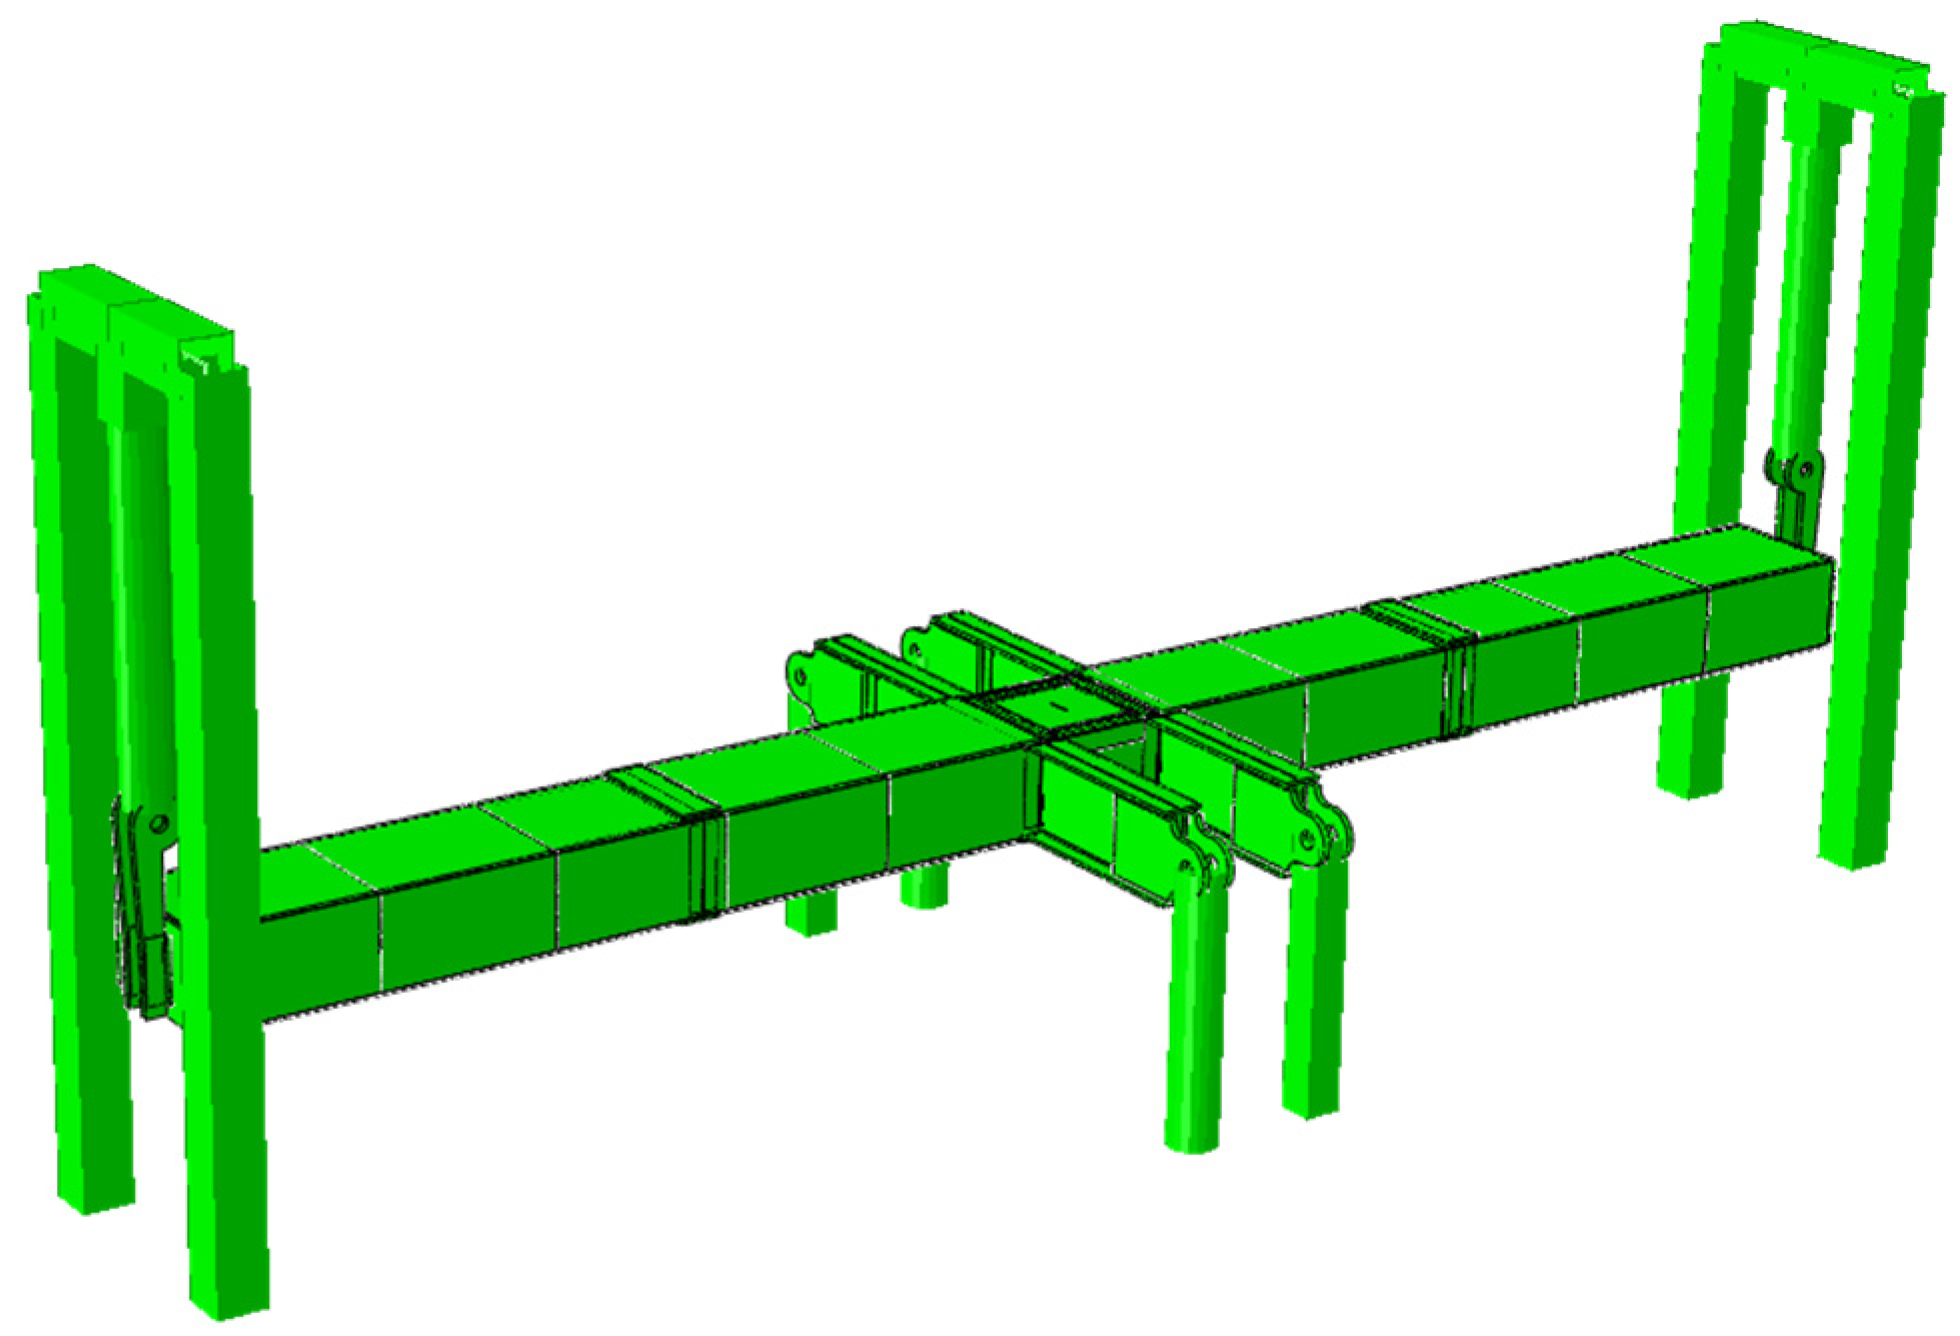
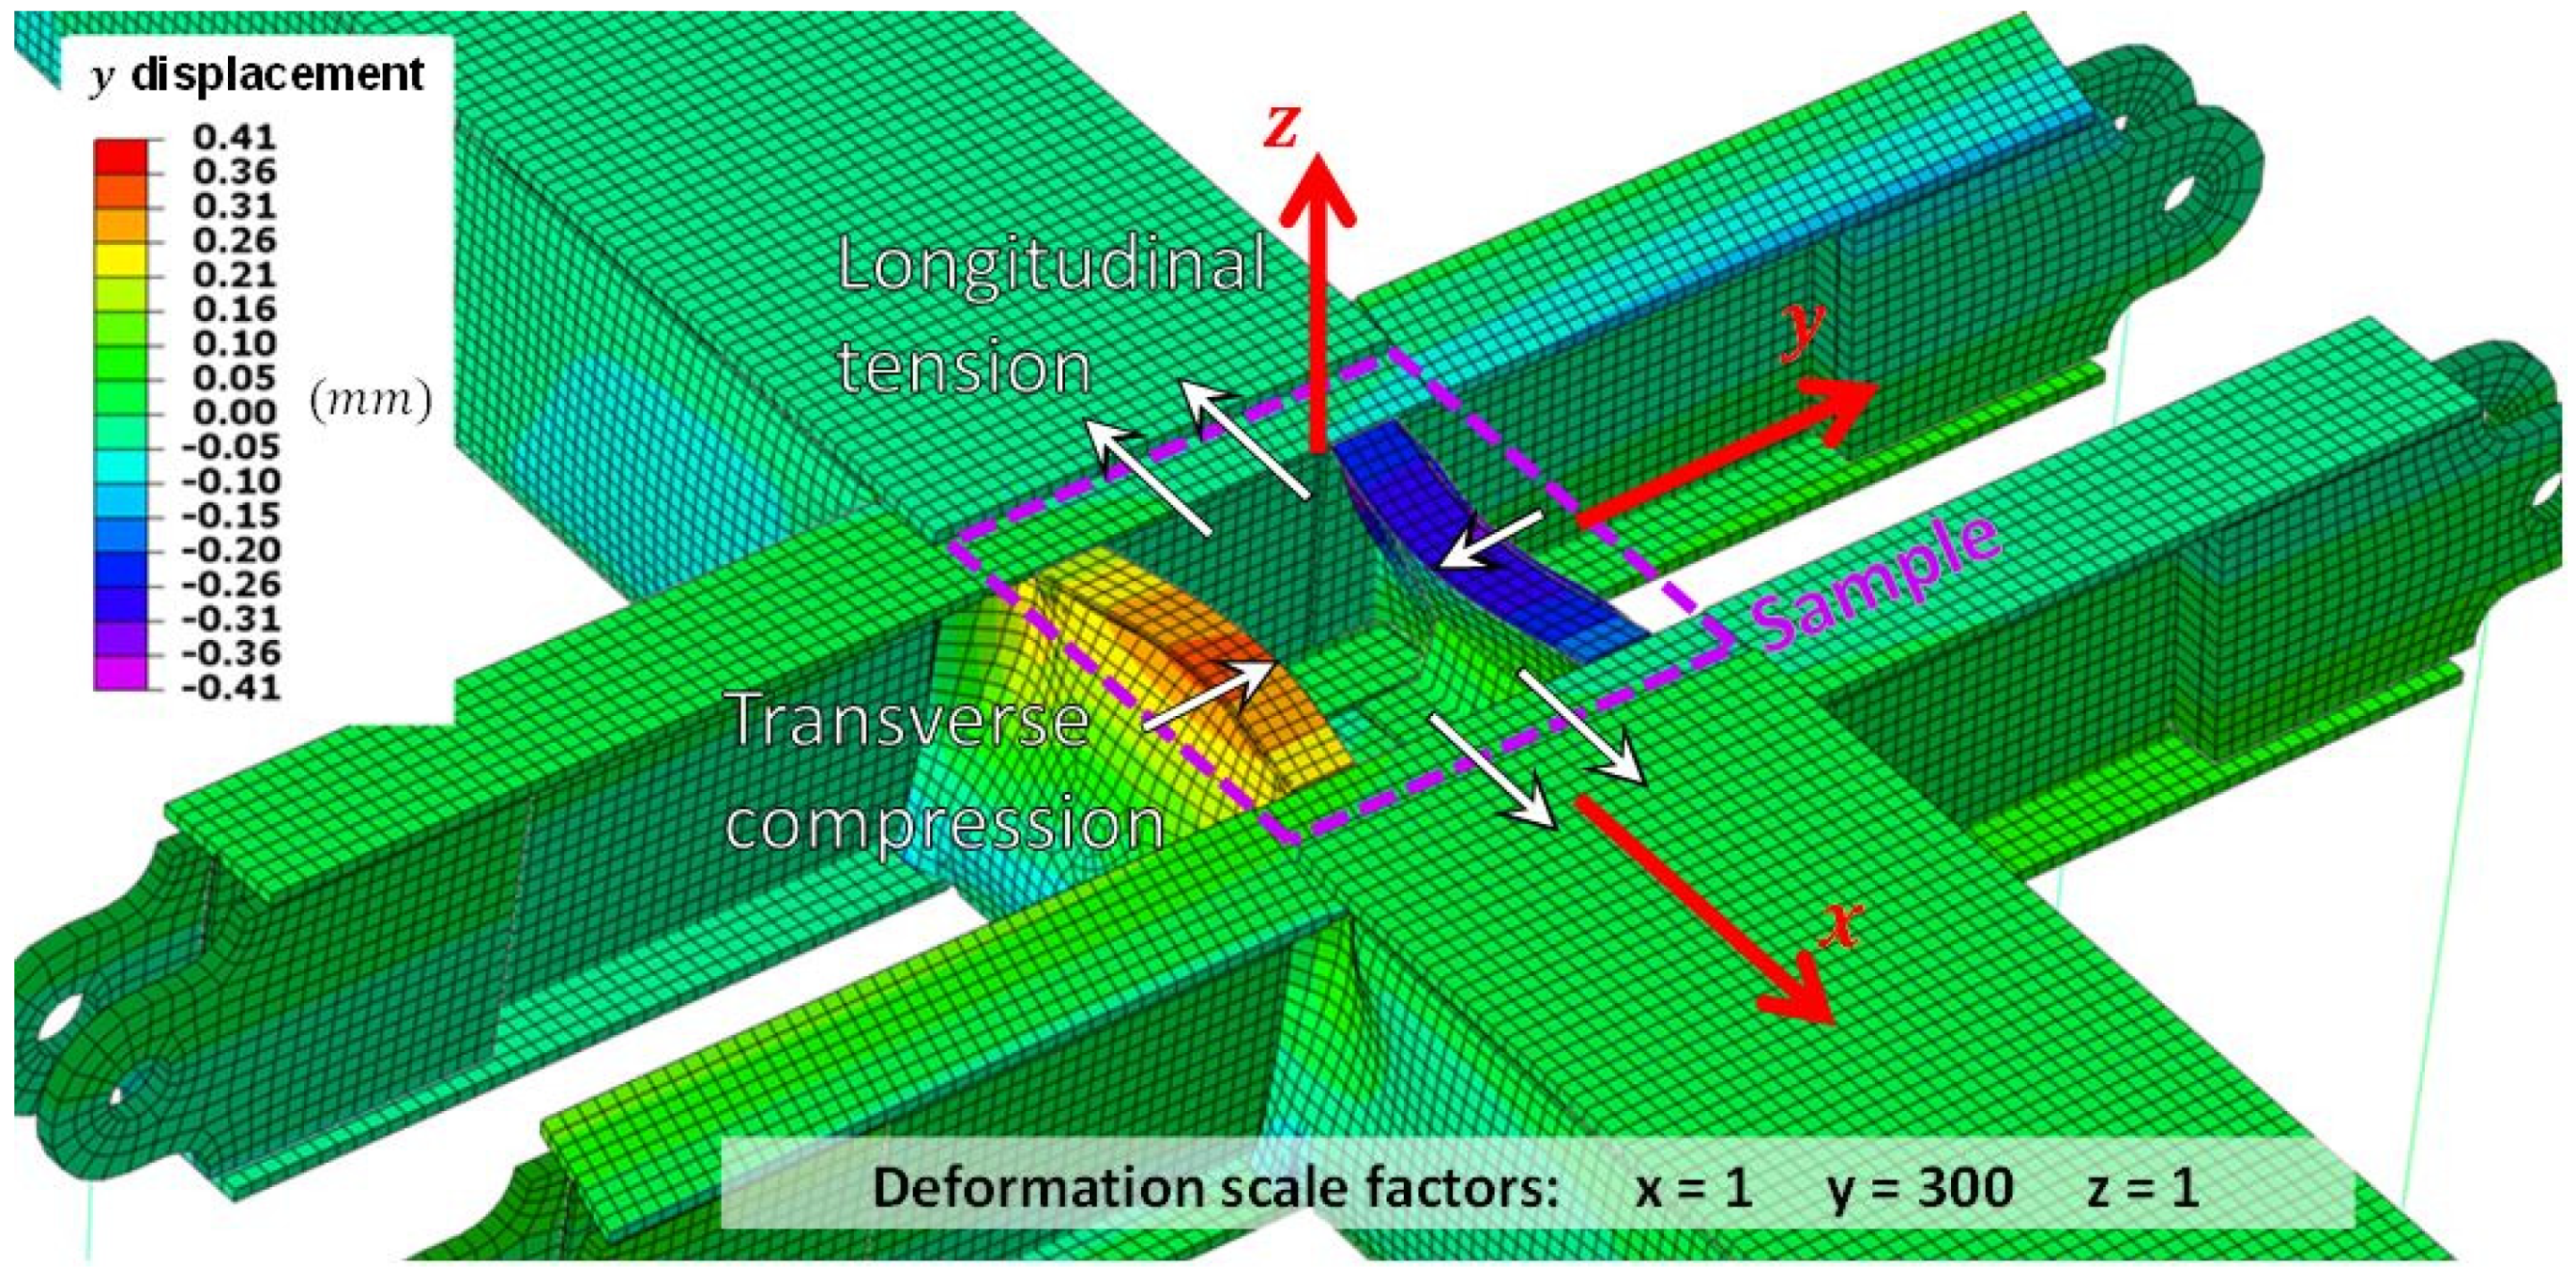
3.1.3. Bench FEM Modelling
3.2. Development of the VERTEX Finite Element Model
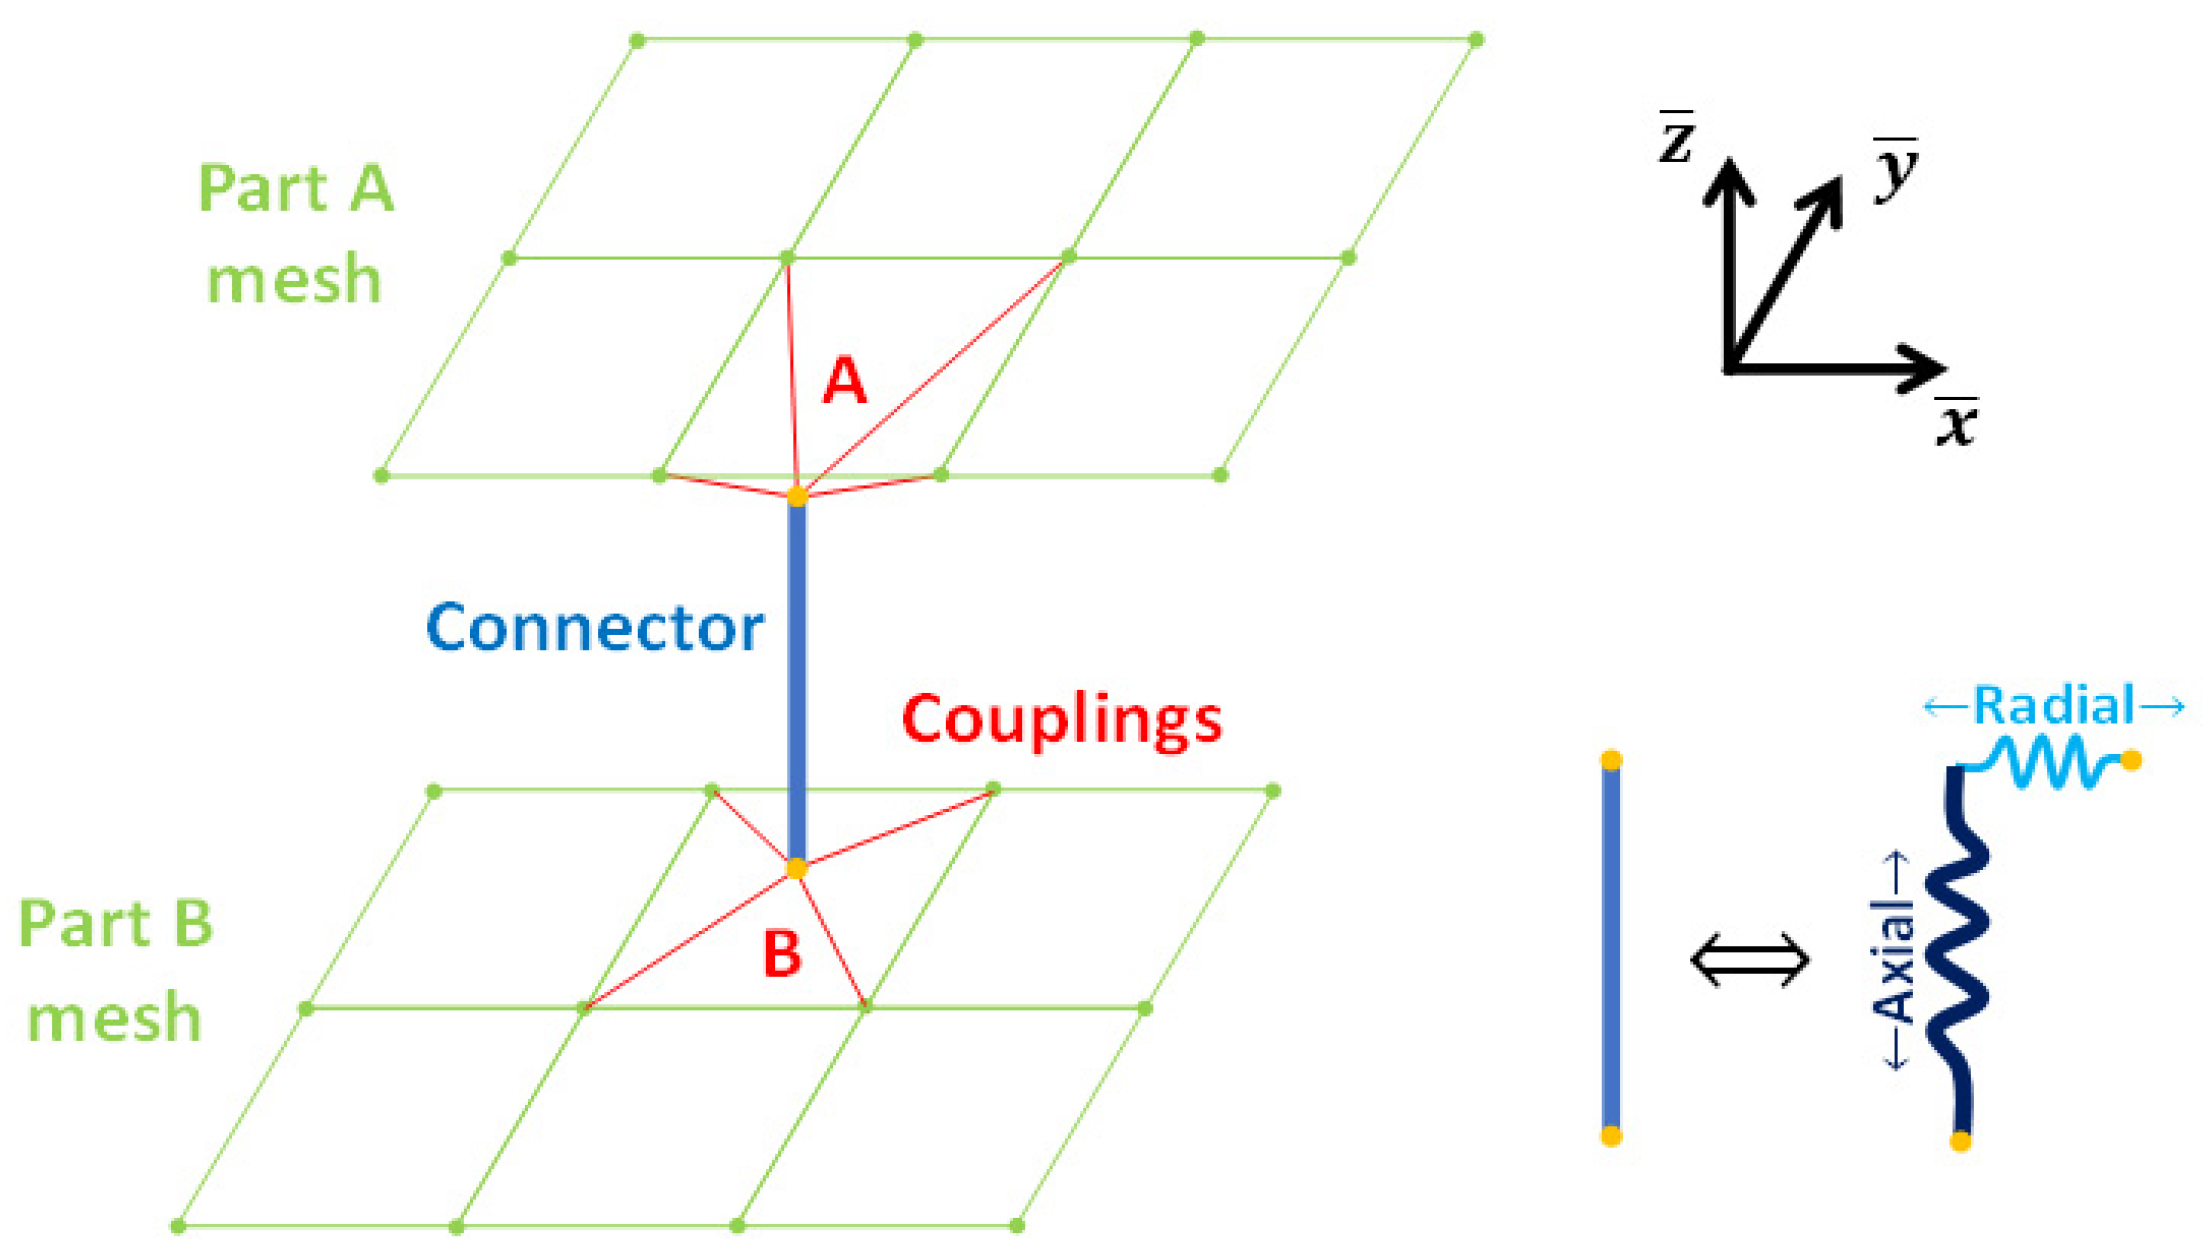
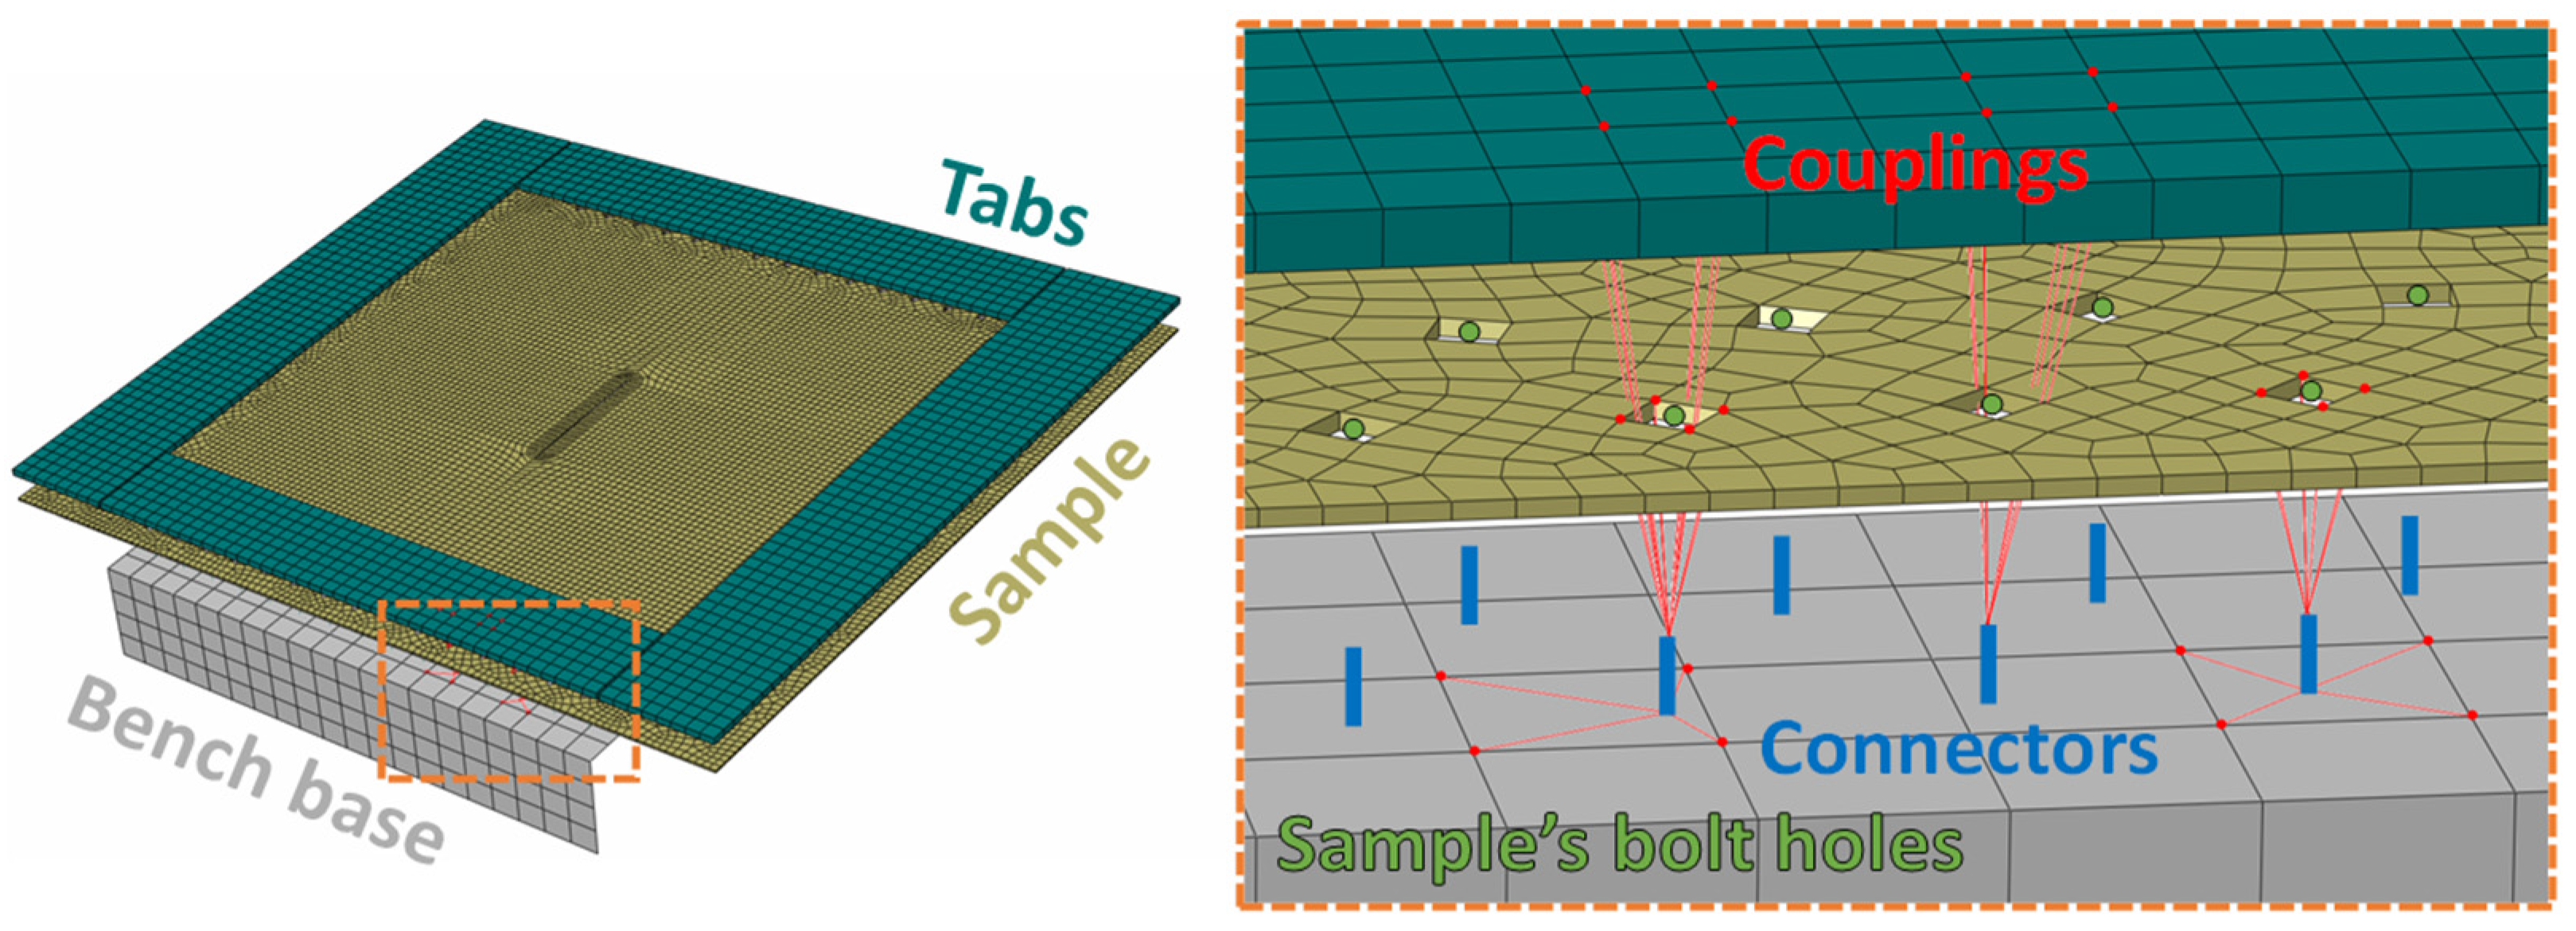
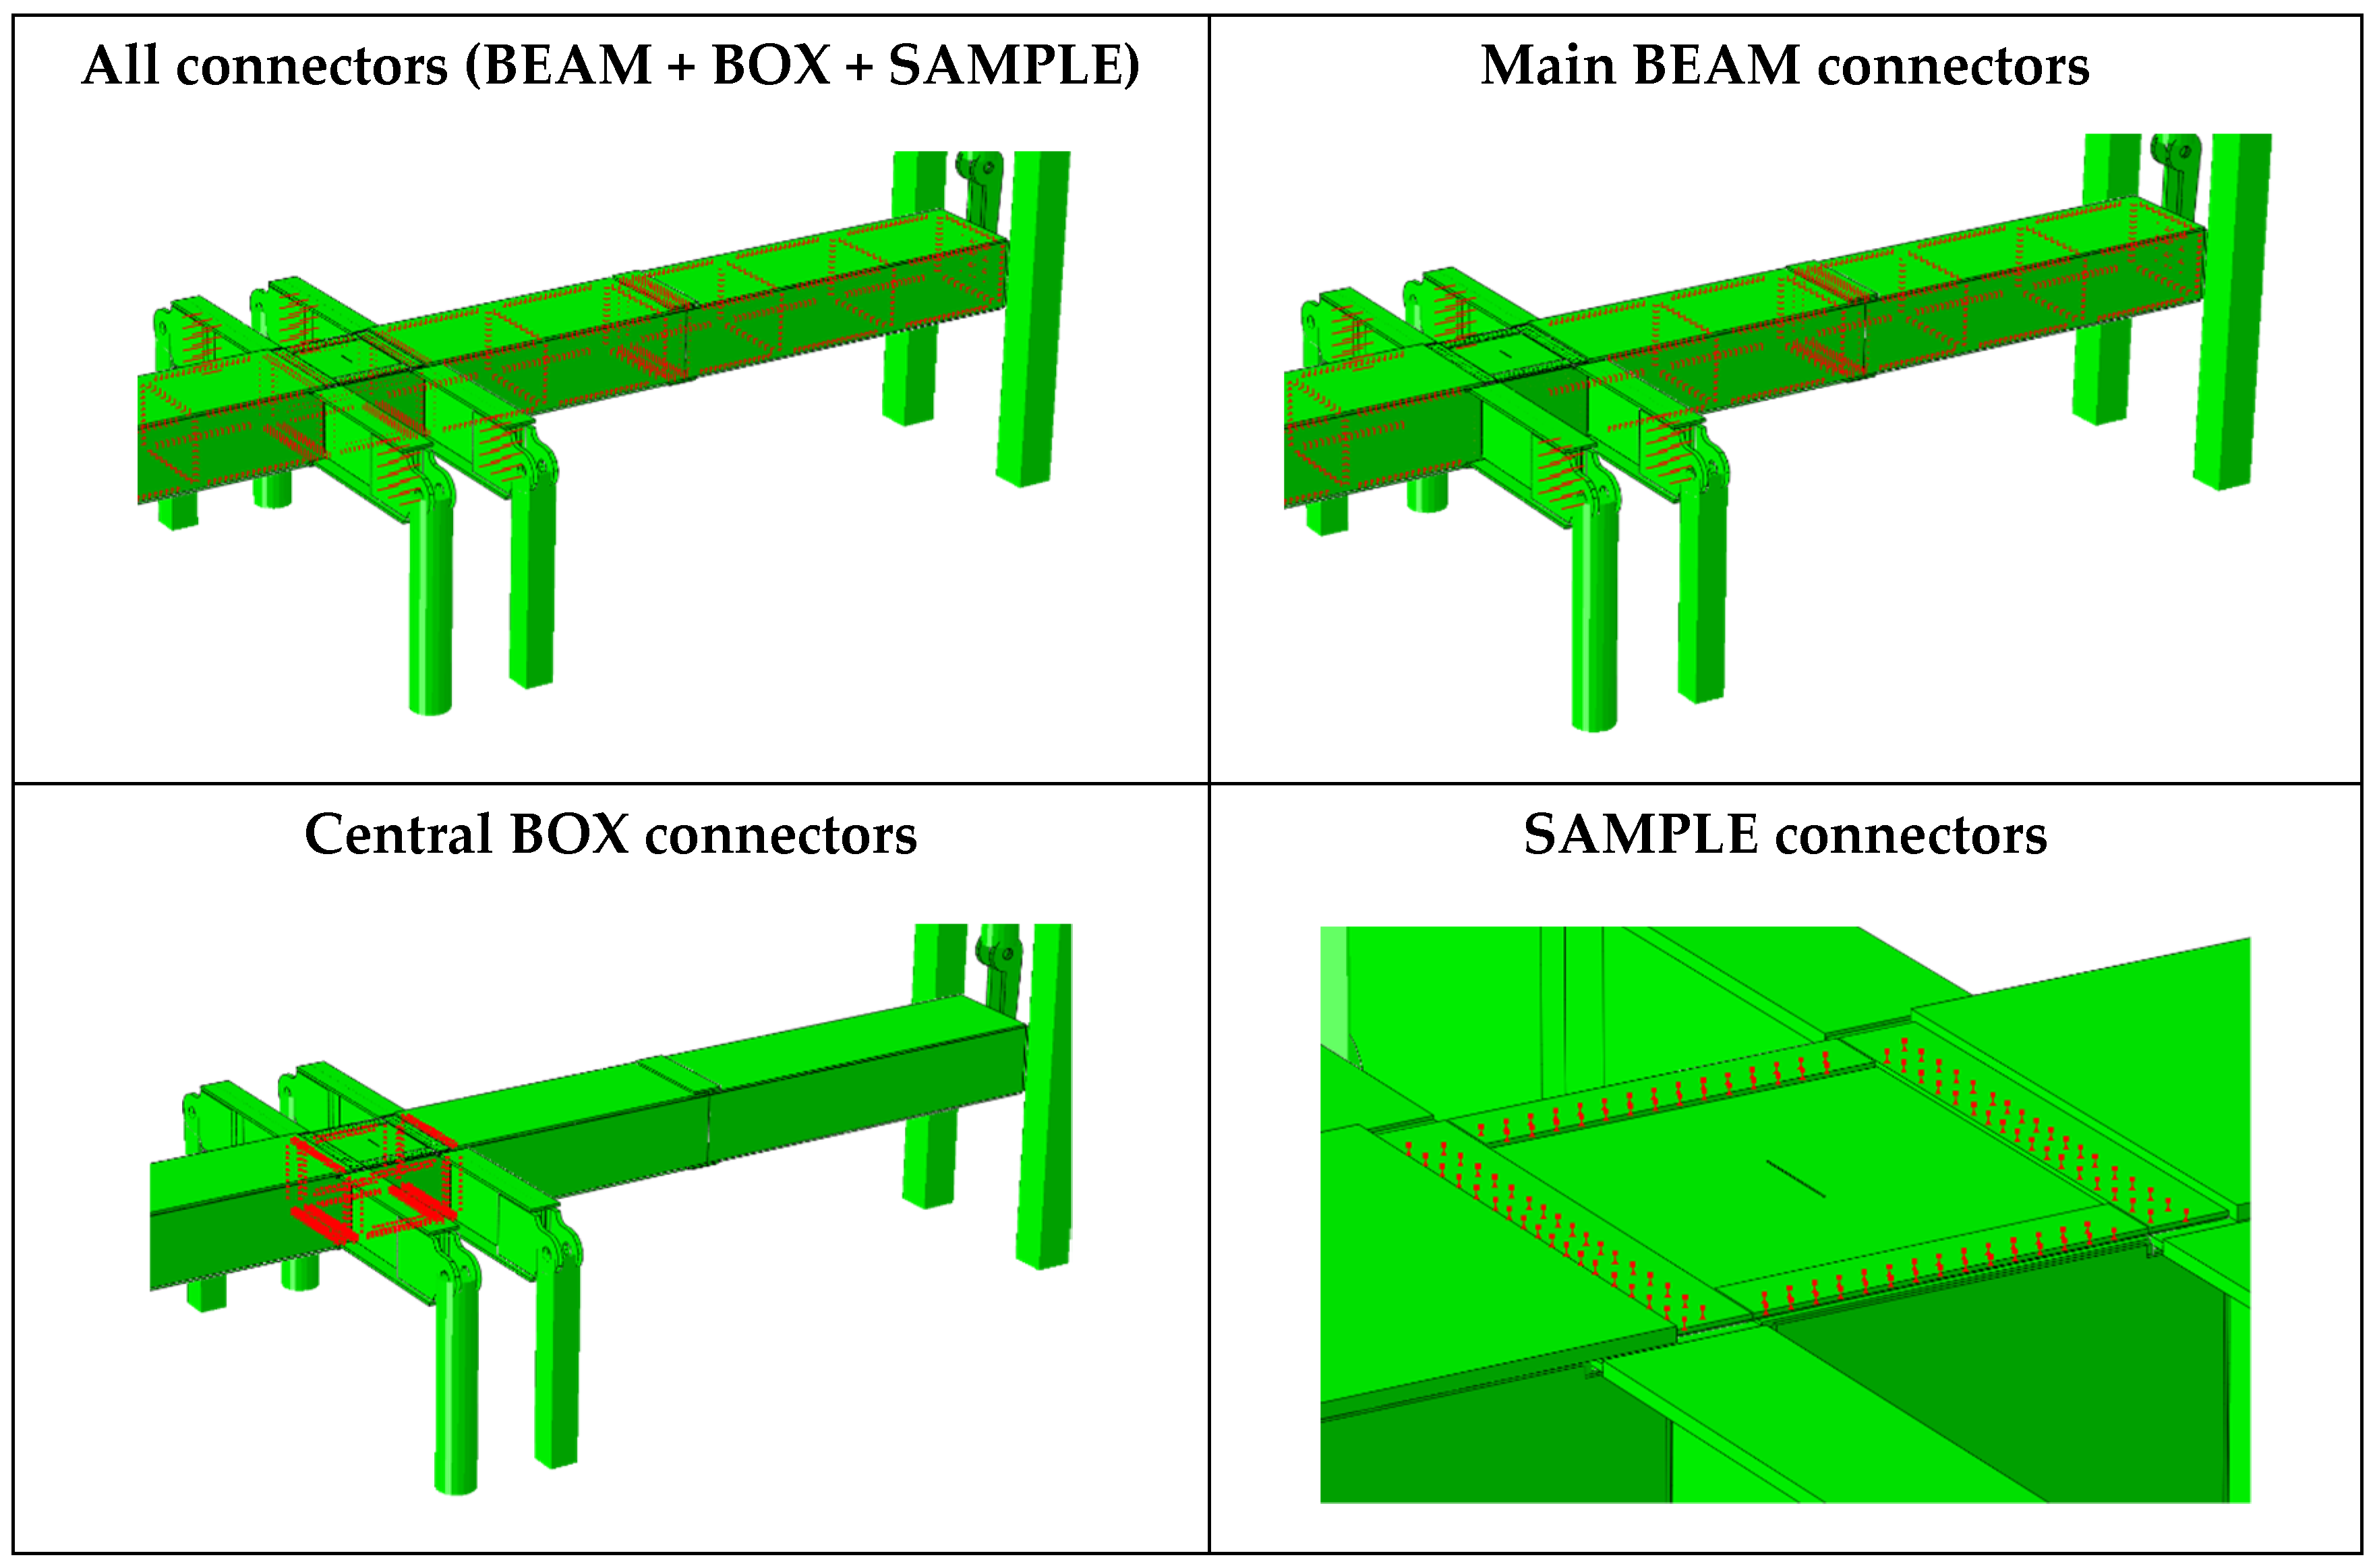
3.2.1. Modelling Strategy
3.2.2. Identification of Bolted Joint Parameters
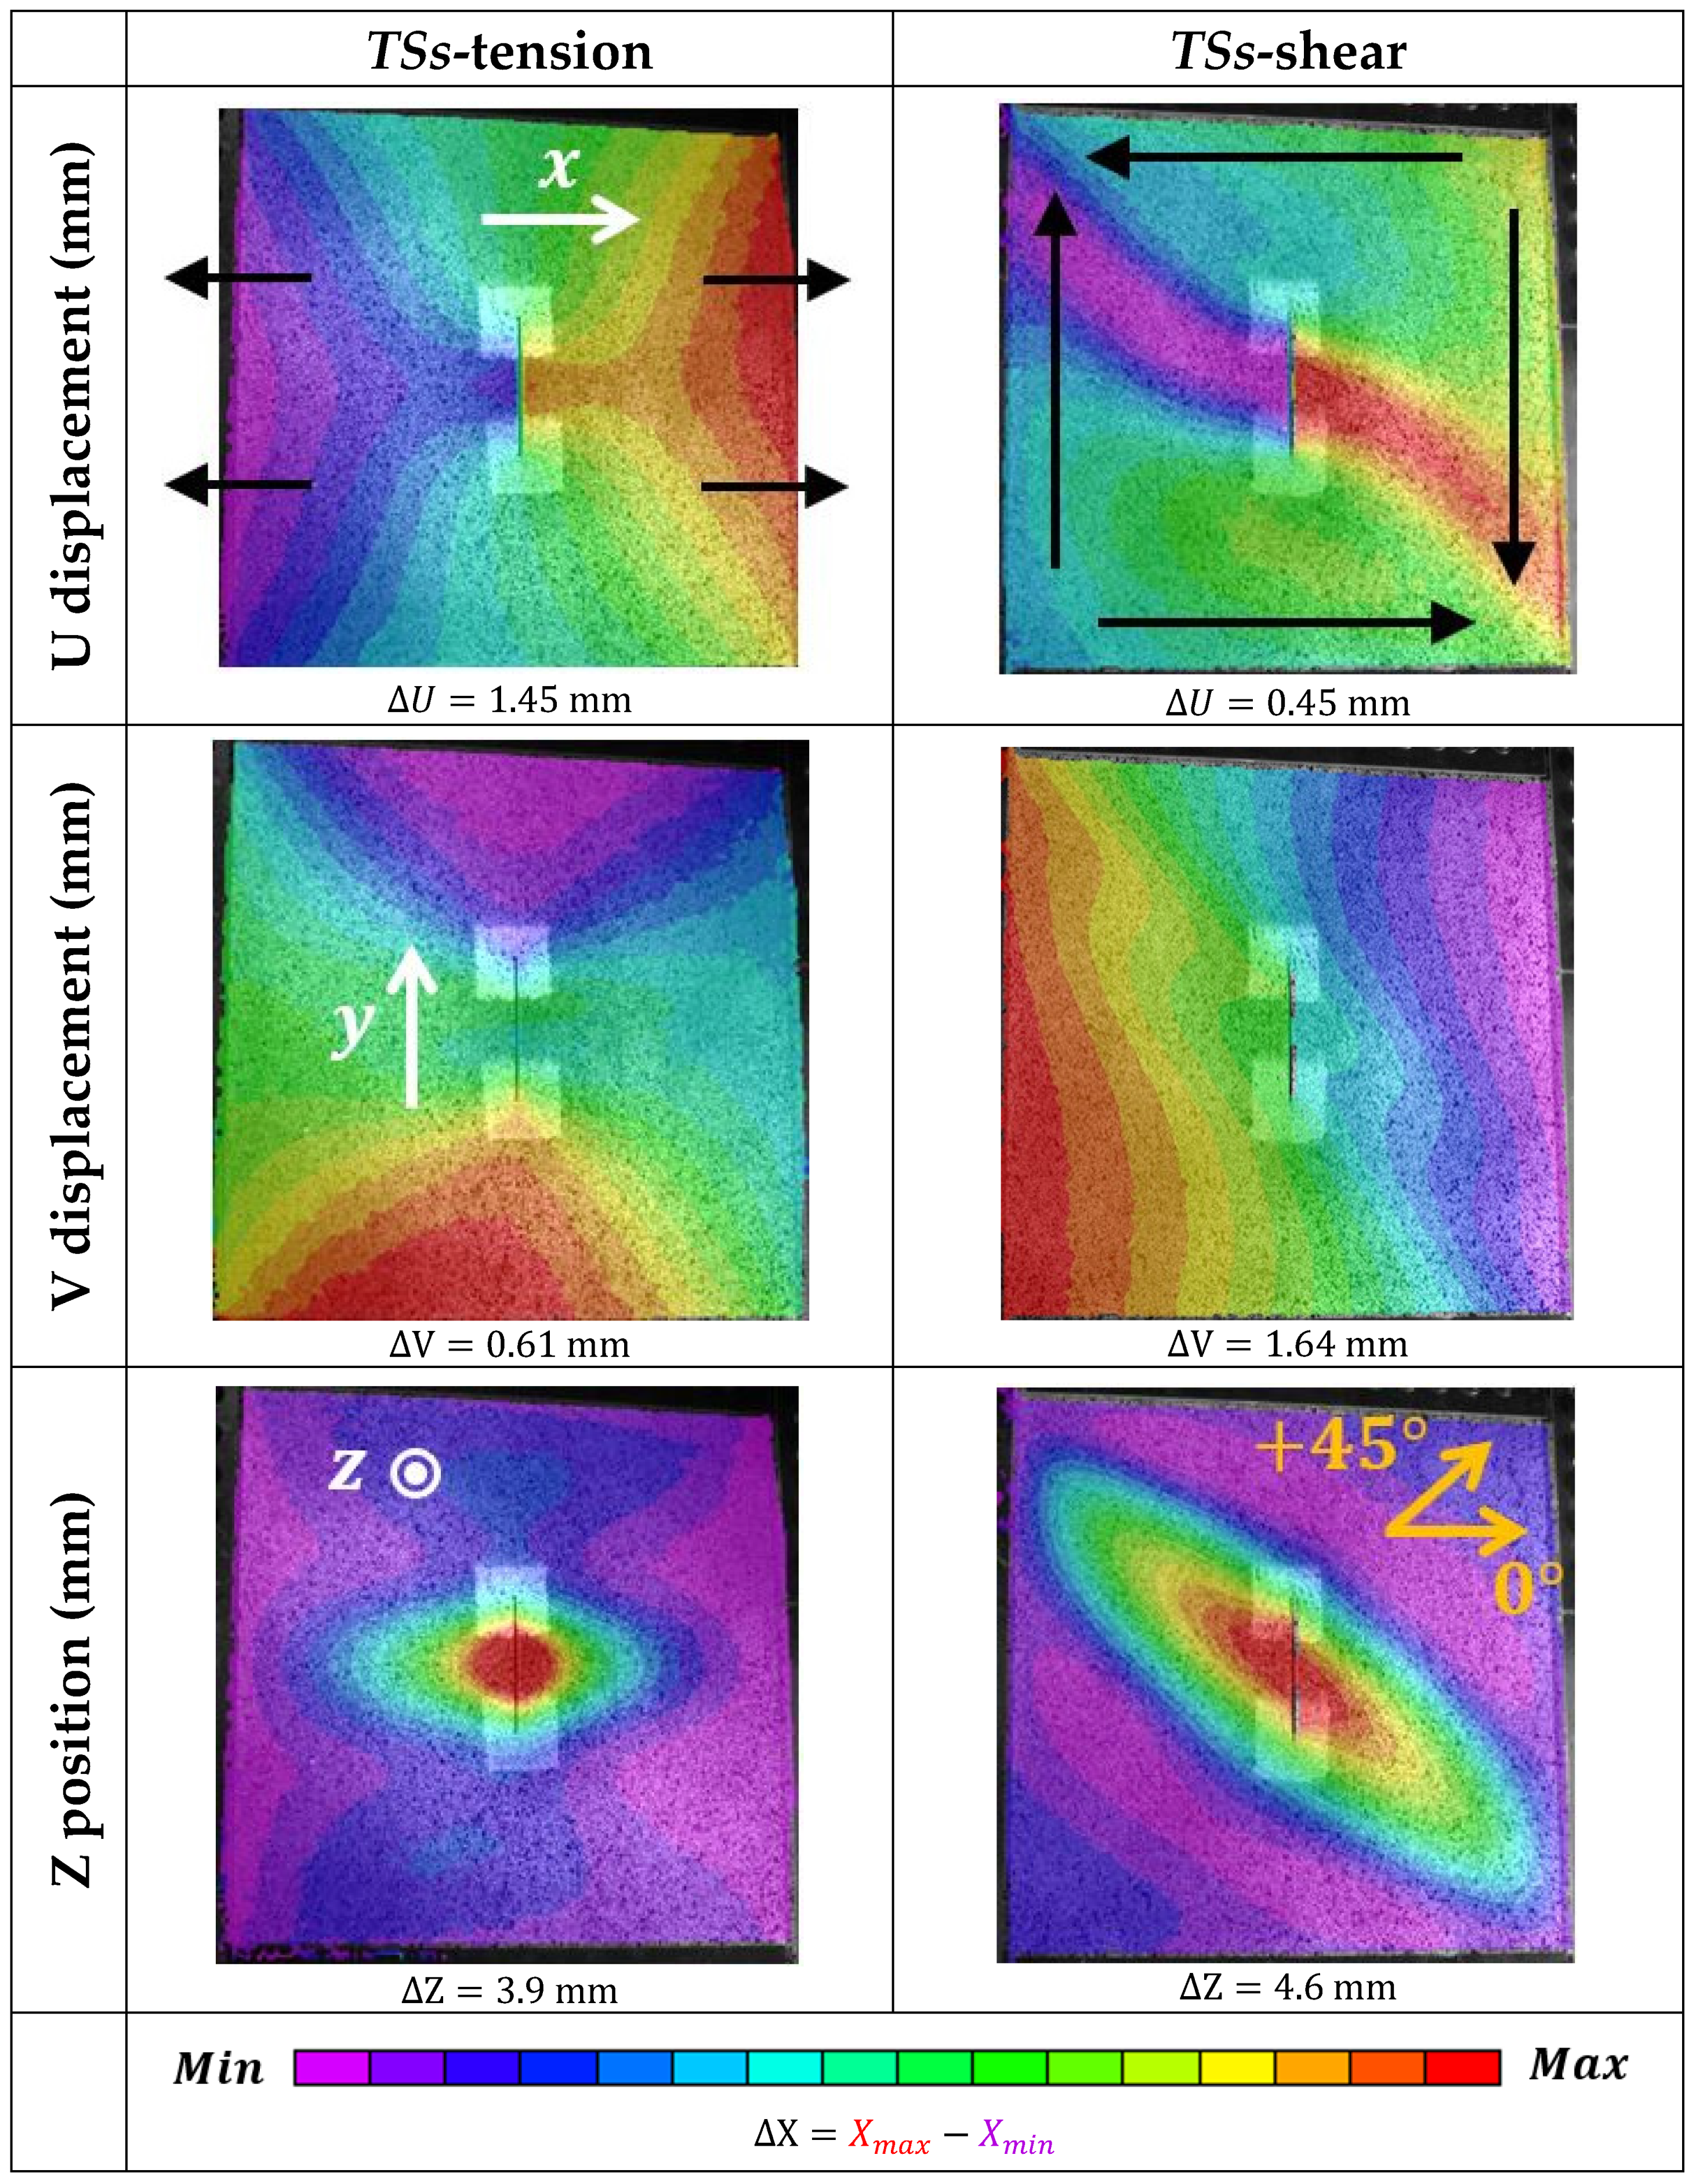
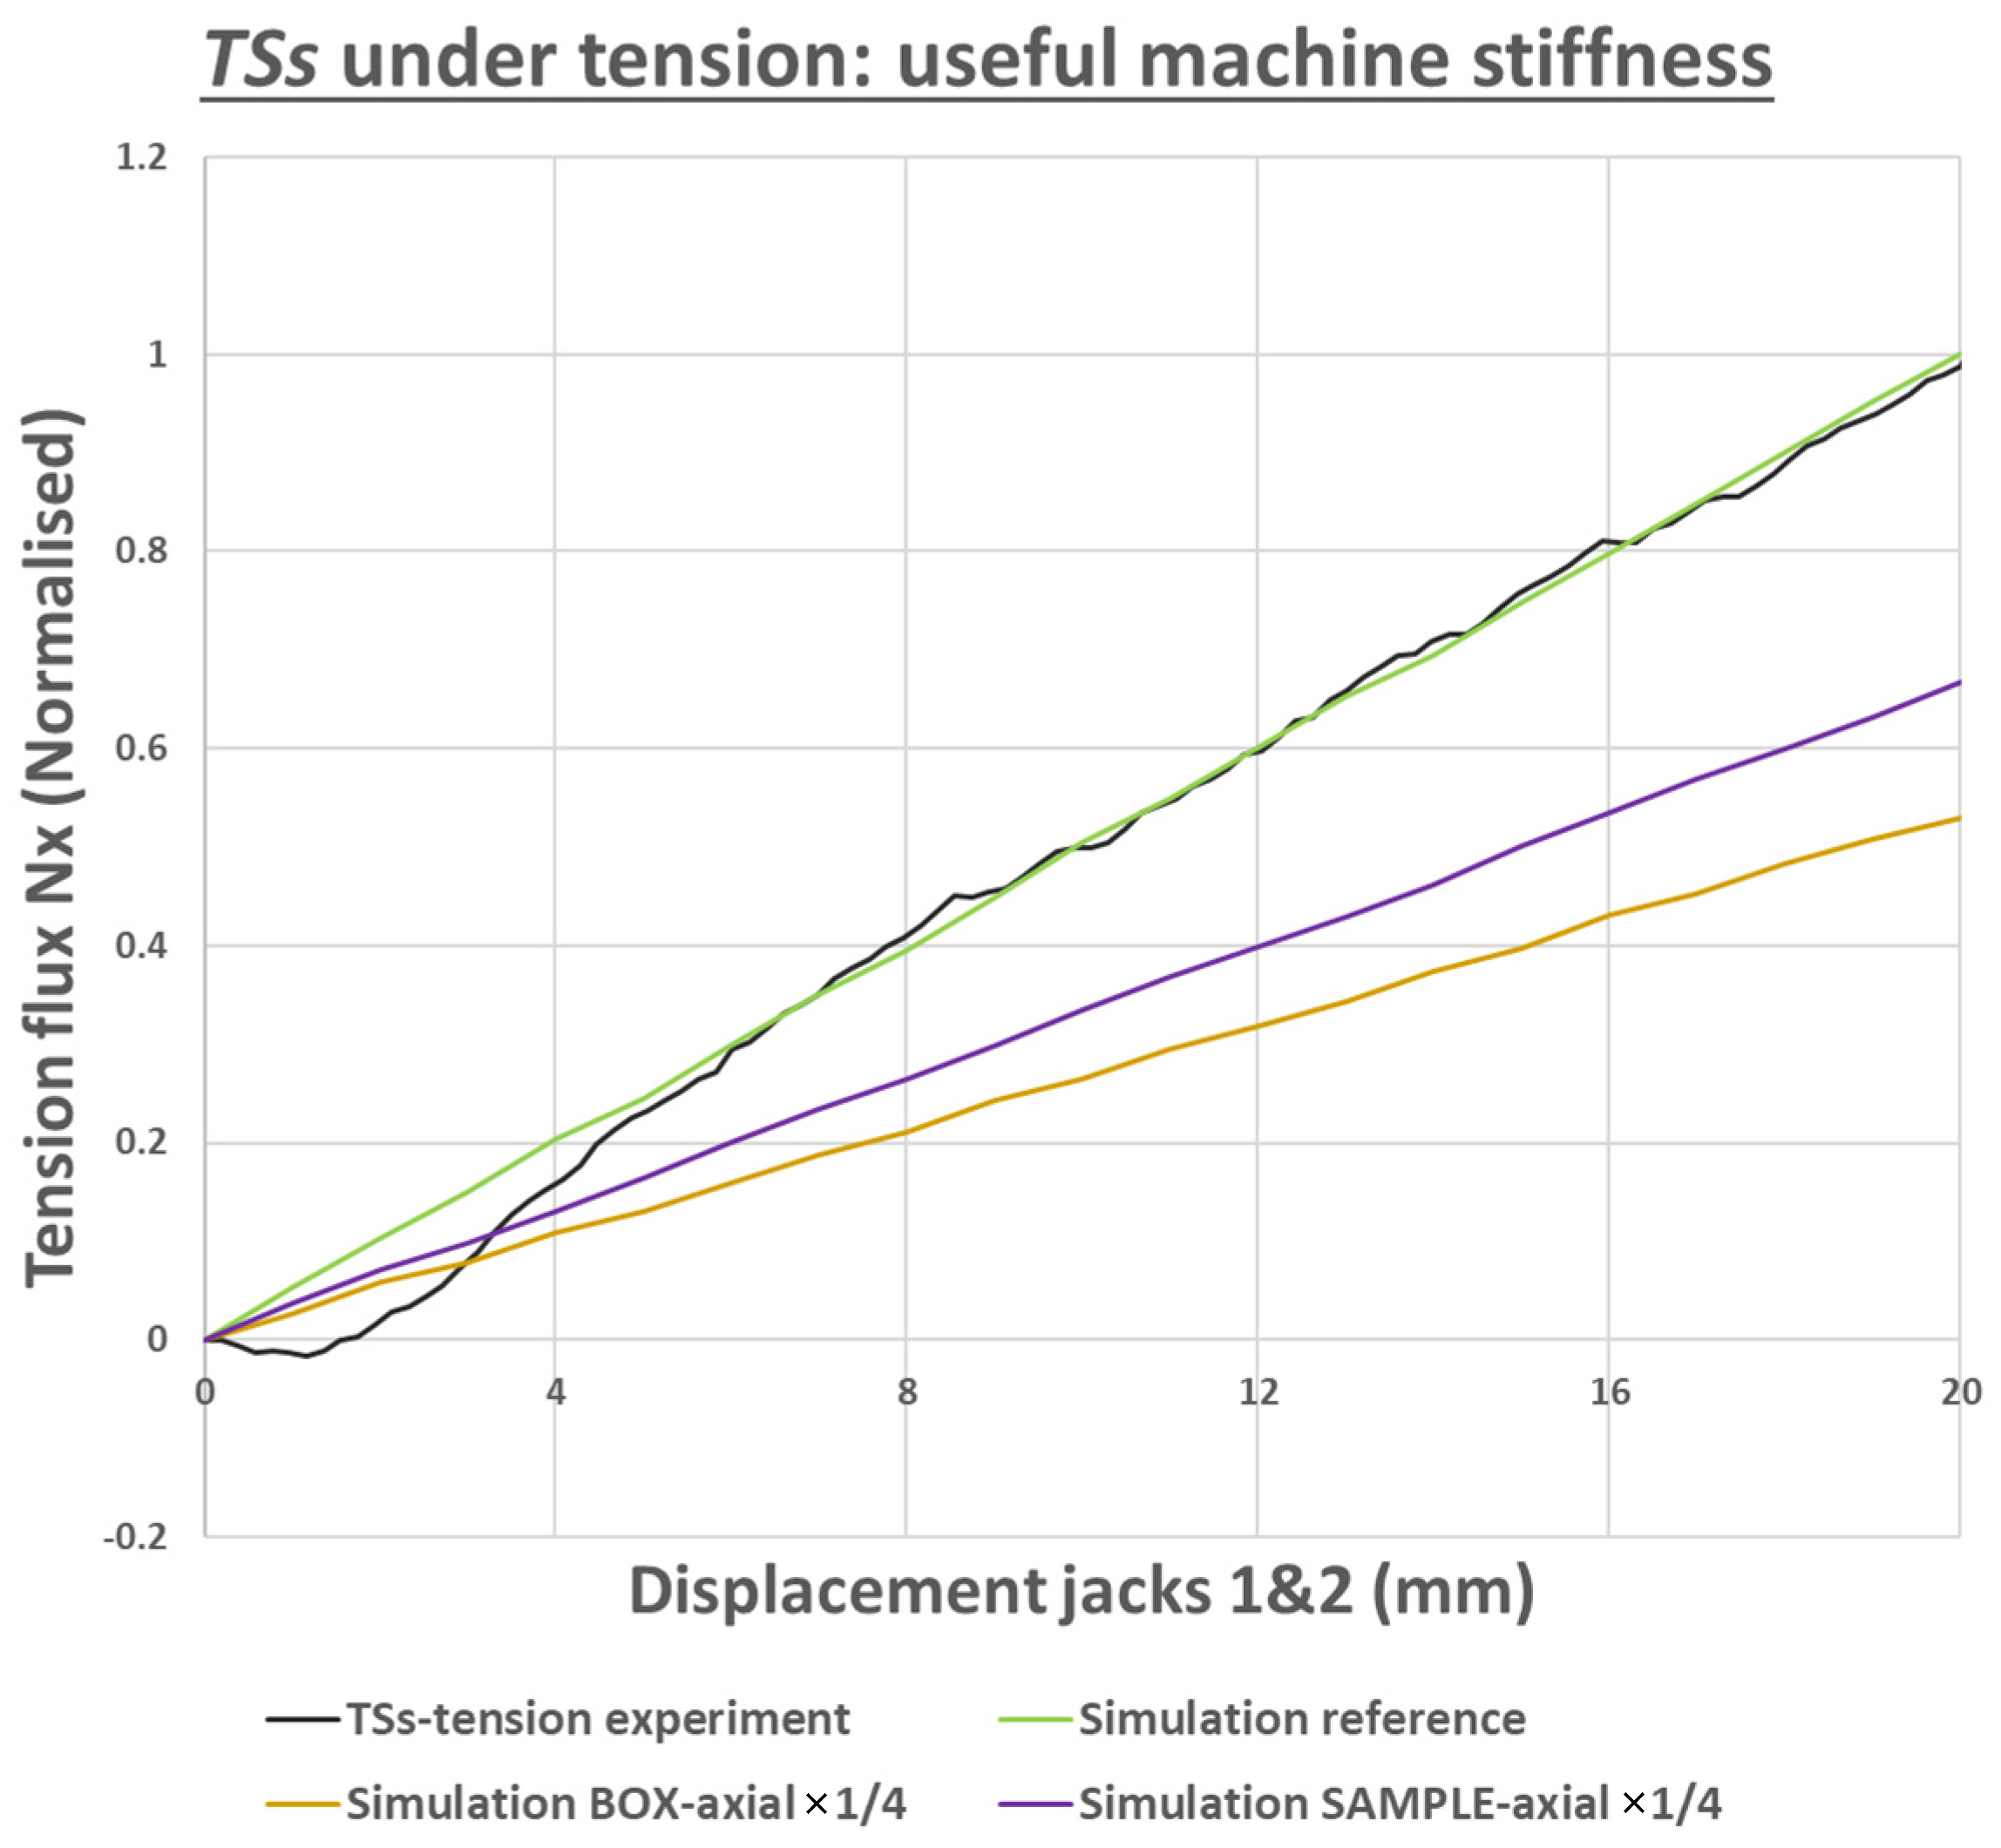
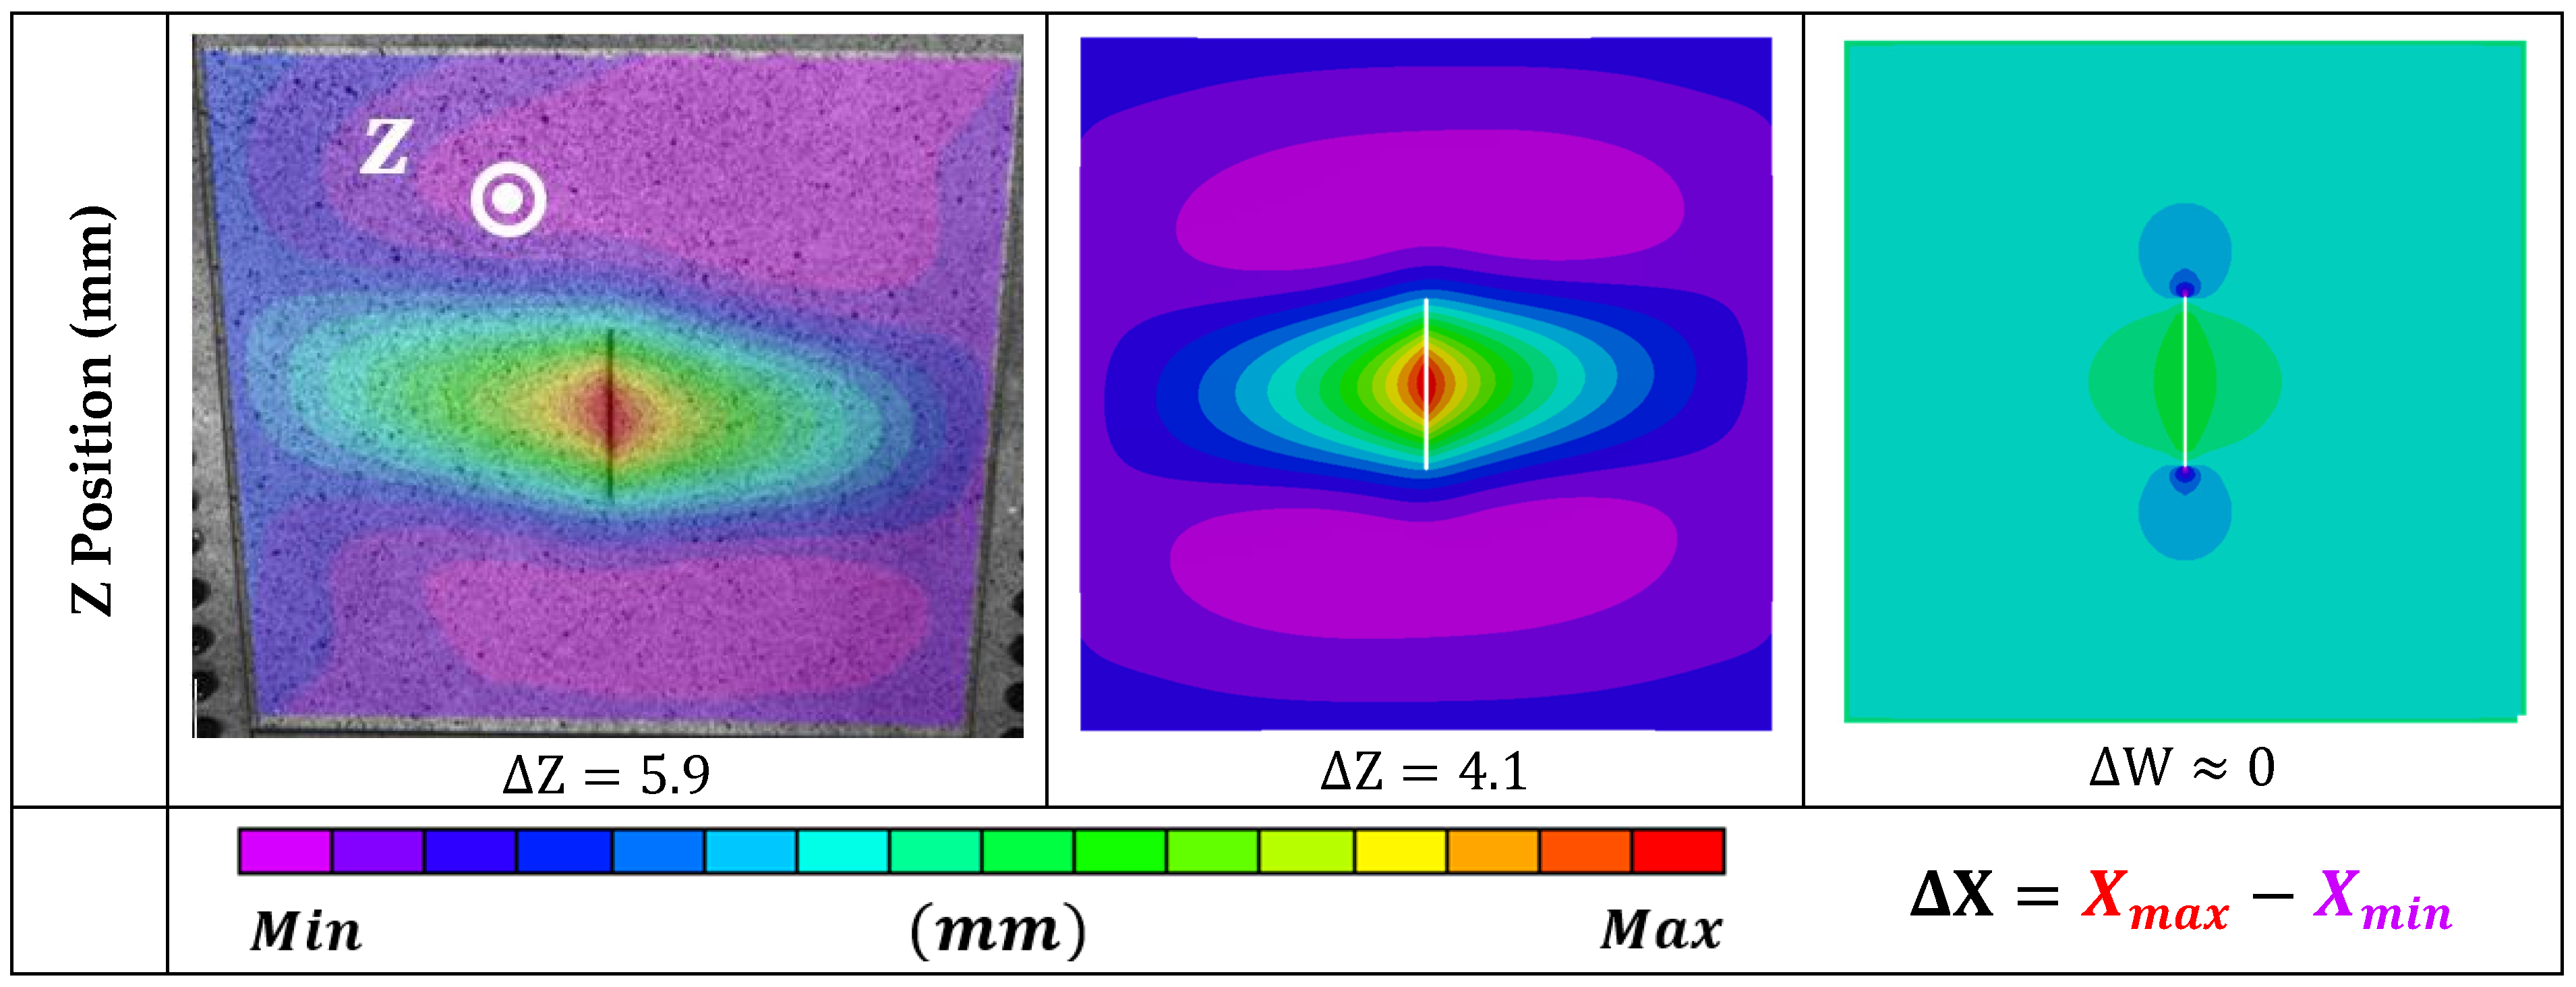
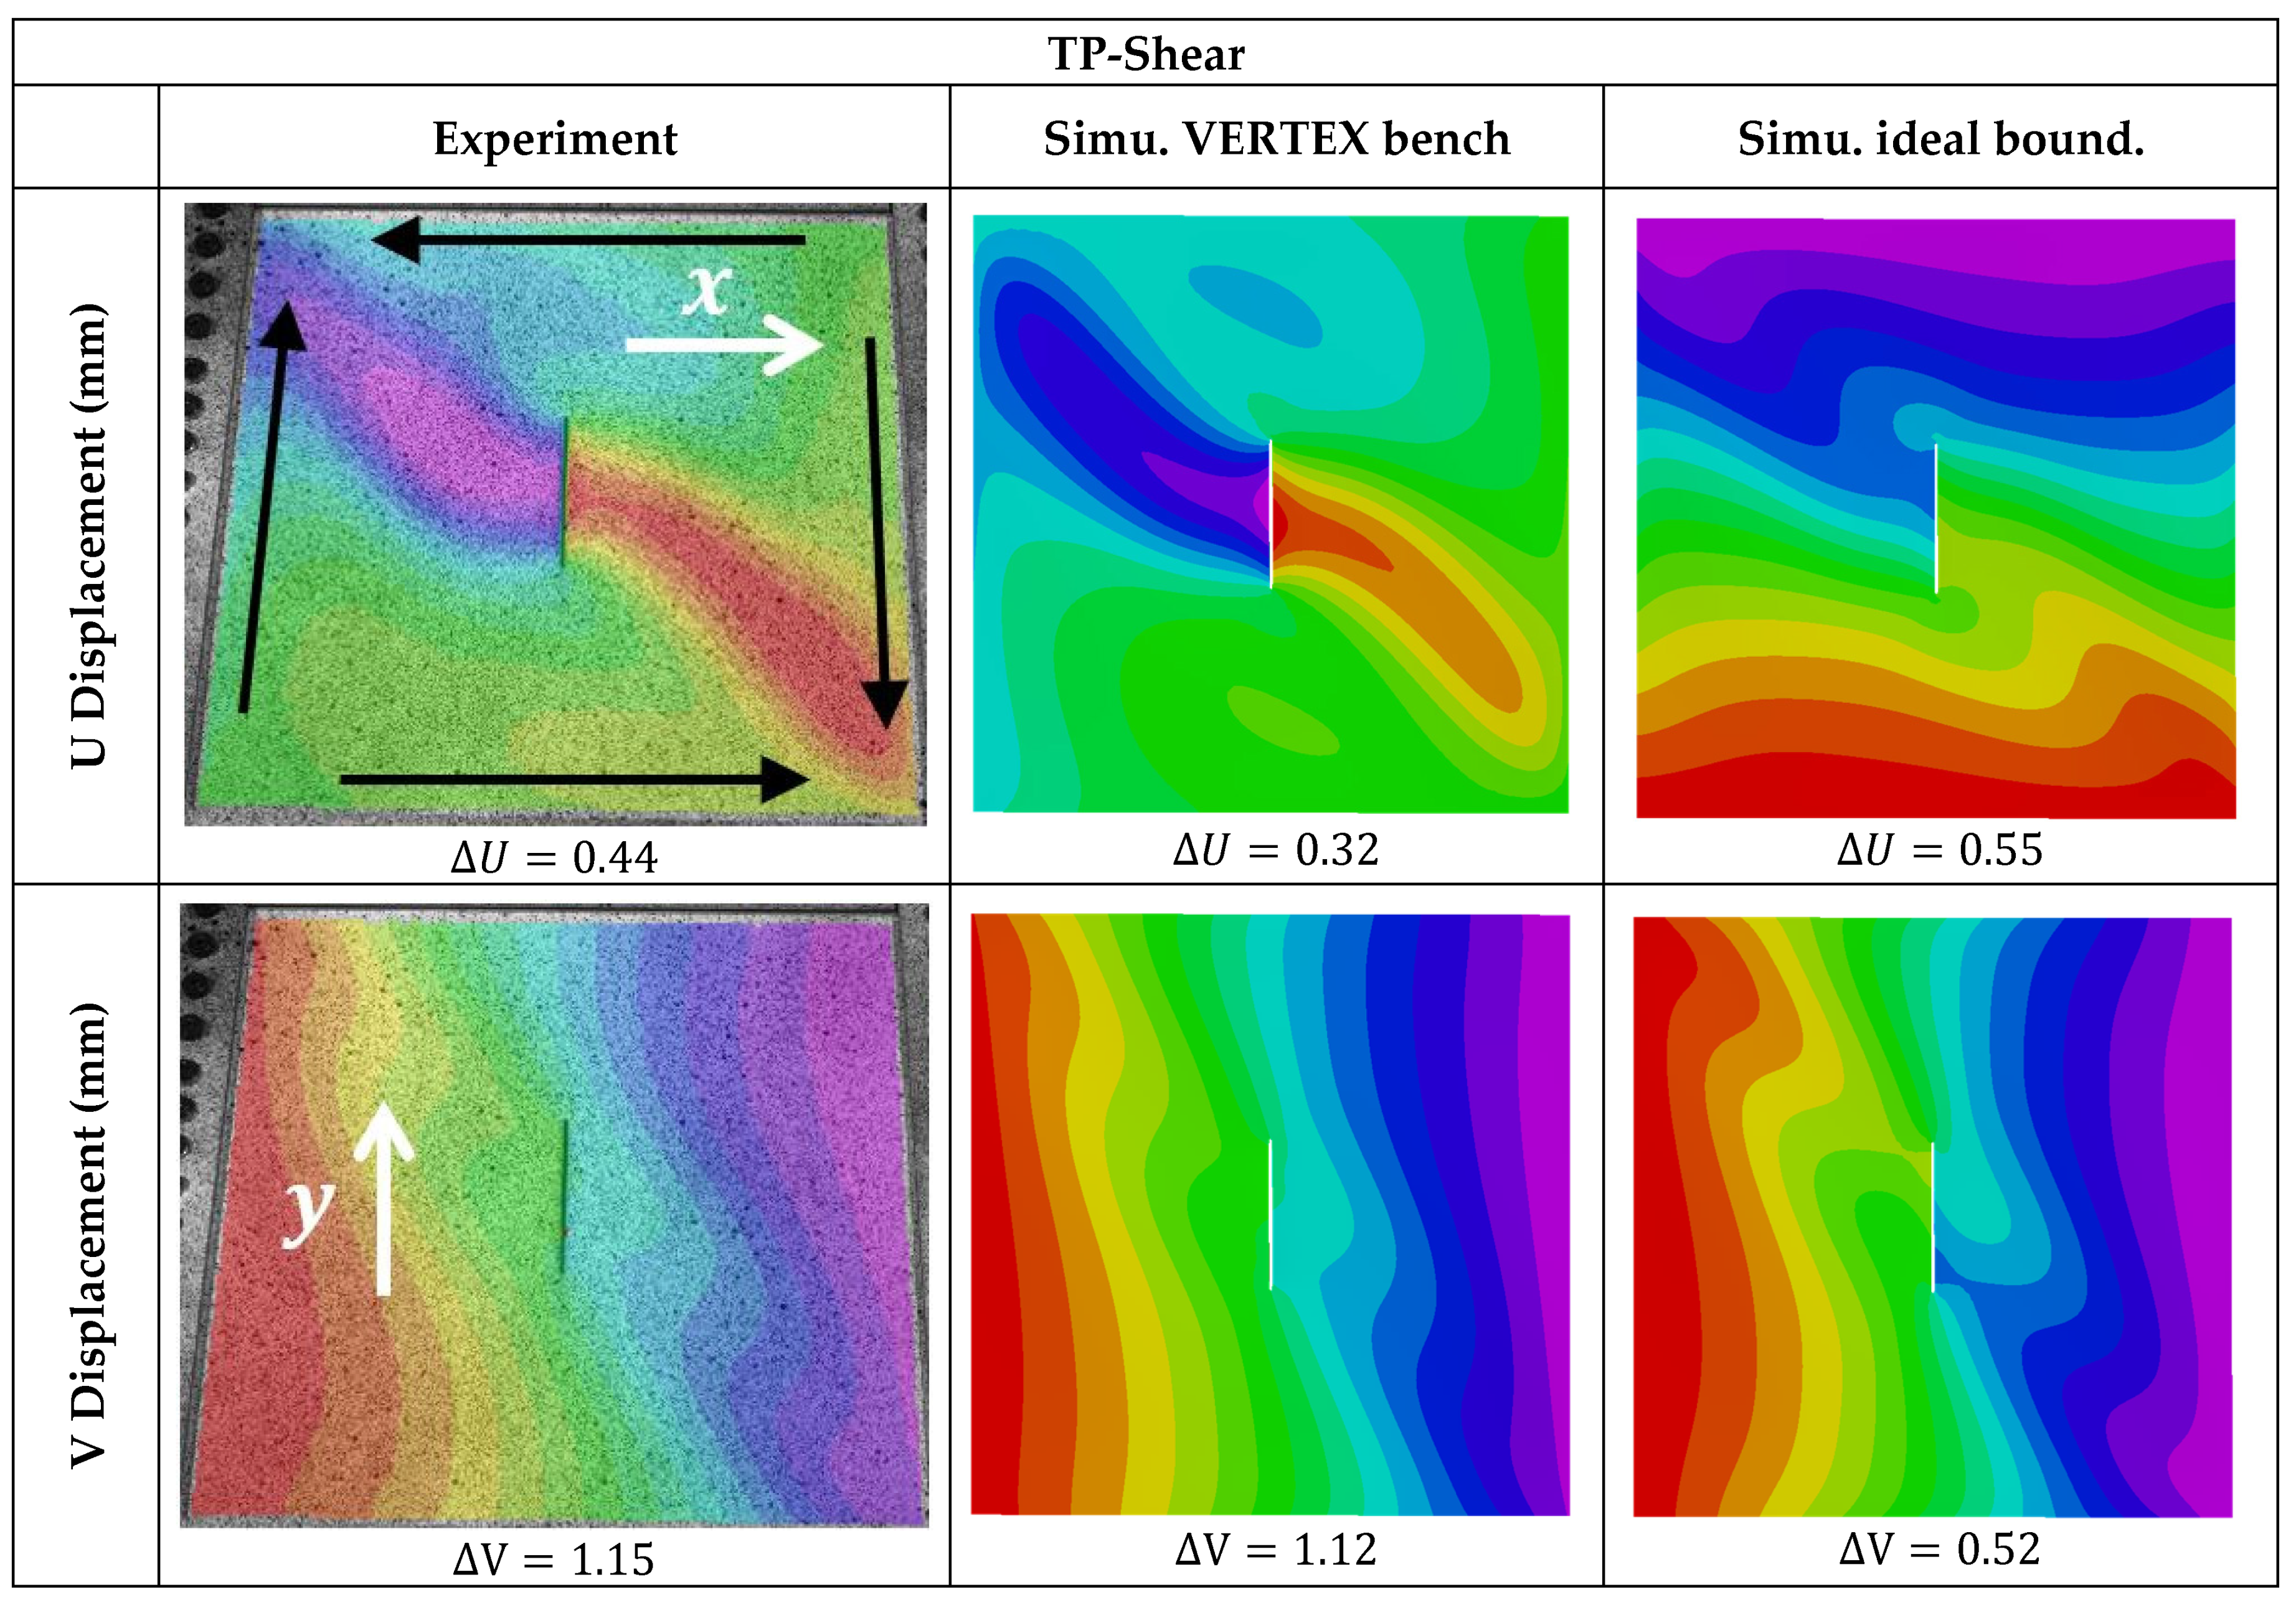
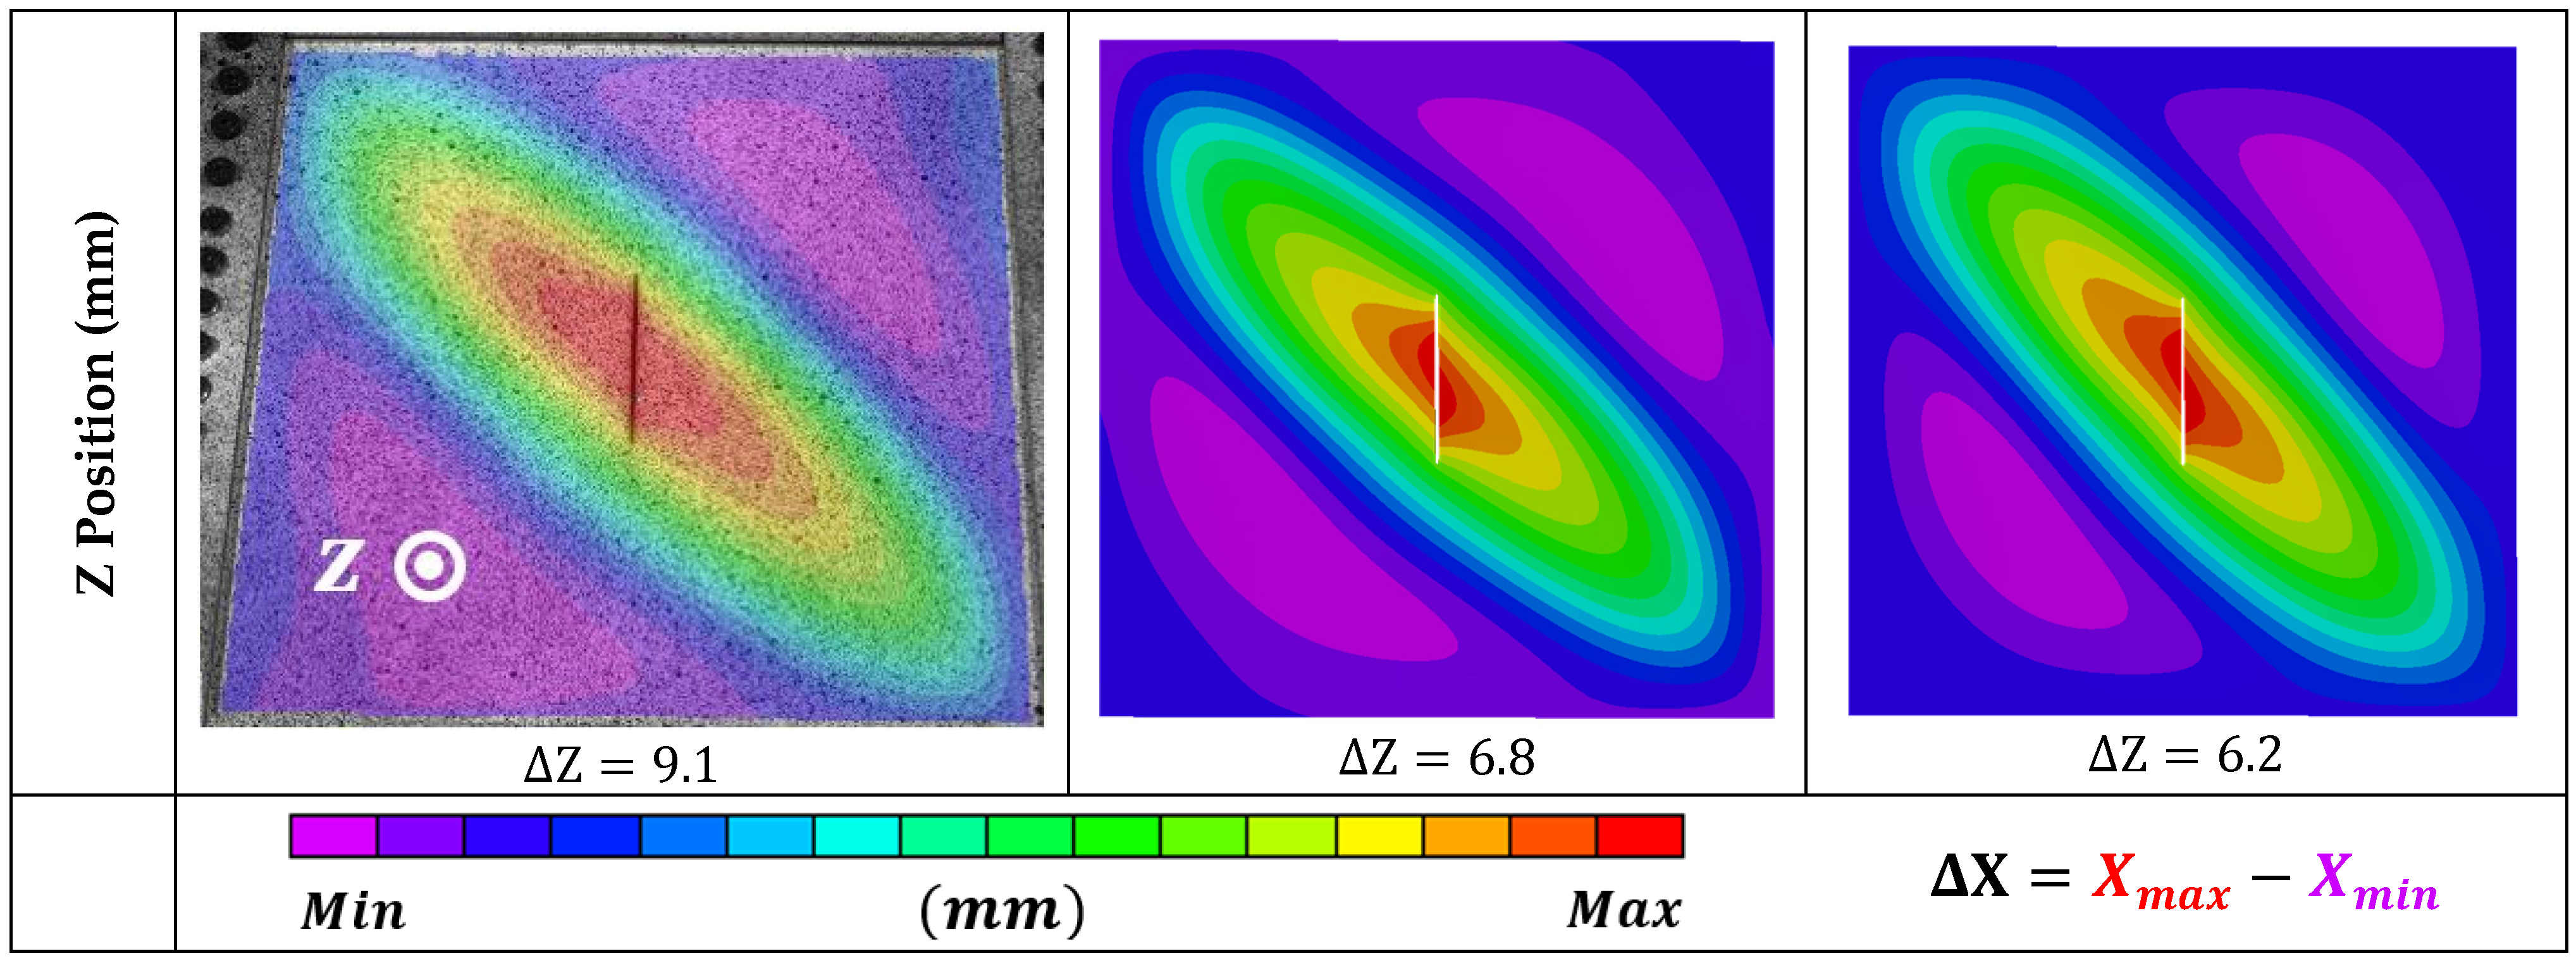
4. Results and Validation
5. Case Studies
6. Conclusions and Perspectives
Author Contributions
Funding
Data Availability Statement
Acknowledgments
Conflicts of Interest
References
- Rouchon, J. Certification of Large Airplane Composite Structures. 1990. Available online: https://www.icas.org/ICAS_ARCHIVE/ICAS1990/ICAS-90-1.8.1.pdf (accessed on 1 November 2023).
- Thomsen, O.; Dulieu-Barton, J.; Halett, S.; Butler, R. Validation of Composite Aerostructures through Integrated Multi-Scale Modelling and High-Fidelity Substructure Testing Facilitated by Design of Experiments and Bayesian learning. In Proceedings of the ECCM 20, Lausanne, Switzerland, 26–30 June 2022. [Google Scholar]
- Sola, C.; Castanié, B.; Michel, L.; Lachaud, F.; Delabie, A.; Mermoz, E. On the role of kinking in the bearing failure of composite laminates. Compos. Struct. 2016, 141, 184–193. [Google Scholar] [CrossRef]
- Castanié, B.; Crézé, S.; Barrau, J.J.; Lachaud, F.; Risse, L. Experimental analysis of failures in filled hole compression tests of carbon/epoxy laminate. Compos. Struct. 2009, 92, 1192–1199. [Google Scholar] [CrossRef]
- Montagne, B.; Lachaud, F.; Paroissien, E.; Martini, D.; Congourdeau, F. Failure analysis of single lap composite laminate bolted joints: Comparison of experimental and numerical tests. Compos. Struct. 2020, 238, 111949. [Google Scholar] [CrossRef]
- Journoud, P.; Bouvet, C.; Castanié, B.; Laurin, F.; Ratsifandrihana, L. Experimental and numerical analysis of unfolding failure of L-shaped CFRP specimens. Compos. Struct. 2020, 232, 111563. [Google Scholar] [CrossRef]
- Bertolini, J.; Castanié, B.; Barrau, J.-J.; Navarro, J.-P. Multi-level experimental and numerical analysis of composite stiffener debonding. Part 1: Non-specific specimen level. Compos. Struct. 2009, 90, 381–391. [Google Scholar] [CrossRef]
- Bertolini, J.; Castanié, B.; Barrau, J.-J.; Navarro, J.-P.; Petiot, C. Multi-level experimental and numerical analysis of composite stiffener debonding. Part 2: Element and panel level. Compos. Struct. 2009, 90, 392–403. [Google Scholar] [CrossRef]
- Toral-Vasquez, J.; Castanié, B.; Barrau, J.-J.; Swiergiel, N. Multi-level analysis of low -cost Z-pinned composite junctions. Part 1: SINGLE Z-PIN BEHAVIOR. Compos. Part Appl. Sci. Manuf. 2011, 42, 2070–2081. [Google Scholar] [CrossRef]
- Toral-Vasquez, J.; Castanié, B.; Barrau, J.-J.; Swiergiel, N. Multi-level analysis of low -cost Z-pinned composite junctions. Part 2: Joint Behavior. Sci. Manuf. 2011, 42, 41. [Google Scholar]
- Meeks, C.; Greenhalgh, E.; Falzon, B.G. Stiffener debonding mechanisms in post-buckled CFRP aerospace panels. Compos. Part Appl. Sci. Manuf. 2004, 36, 934–946. [Google Scholar] [CrossRef]
- Leon-Dufour, J.-L. Dimensionnement Des Structures Composites Aux Dommages; Journée de l’Association Aéronautique et Astronautique de France—3AF, CNES, Toulouse, Airbus: Toulouse, France, 2008. [Google Scholar]
- Harris, C.E.; Starnes, J.H.; Shuart, M.J. Design and Manufacturing of Aerospace Composite Structures, State-of-the-Art Assessment. J. Aircr. 2002, 39, 545–560. [Google Scholar] [CrossRef]
- Codolini, A.; Li, Q.M.; Wilkinson, A. Mechanical characterization of thin injection-moulded polypropylene specimens under large in-plane shear deformations. Polym. Test. 2018, 69, 485–489. [Google Scholar] [CrossRef]
- Gan, K.W.; Laux, T.; Taher, S.T.; Dulieu-Barton, J.M.; Thomsen, O.T. A novel fixture for determining the tension/compression-shear failure envelope of multidirectional composite laminates. Compos. Struct. 2018, 184, 662–673. [Google Scholar] [CrossRef]
- Lin, S.B.; Ding, J.L.; Zbib, H.M.; Aifantis, E.C. Characterization of yield surfaces using balanced biaxial tests of cruciform plate specimens. Scr. Metall. Mater. 1993, 28, 617–622. [Google Scholar] [CrossRef]
- Lucía Zumaquero, P.; Correa, E.; Justo, J.; París, F. Transverse biaxial tests on long fibre reinforced composites. Compos. Struct. 2022, 297, 115868. [Google Scholar] [CrossRef]
- Moncy, A.; Castro, O.; Berggreen, C.; Stang, H. Understanding the effect of anisotropy in composite materials on the performance of cruciform specimens. Compos. Struct. 2021, 273, 114225. [Google Scholar] [CrossRef]
- Shahverdi Moghaddam, H.; Keshavanarayana, S.R.; Ivanov, D.; Yang, C.; Horner, A.L. In-plane shear response of a composite hexagonal honeycomb core under large deformation—A numerical and experimental study. Compos. Struct. 2021, 268, 113984. [Google Scholar] [CrossRef]
- Damghani, M.; Pir, R.A.; Murphy, A.; Fotouhi, M. Experimental and numerical study of hybrid (CFRP-GFRP) composite laminates containing circular cut-outs under shear loading. Thin-Walled Struct. 2022, 179, 109752. [Google Scholar] [CrossRef]
- Li, X.; Gao, W.; Liu, W. Post-buckling progressive damage of CFRP laminates with a large-sized elliptical cutout subjected to shear loading. Compos. Struct. 2015, 128, 313–321. [Google Scholar] [CrossRef]
- Hopgood, P.; Cook, J.; Clarke, A. Multi-axial testing of planar composite specimens. In Proceedings of the 12th International Conference on Composite Materials, Paris, France, 5–9 July 1999; pp. 5–9. [Google Scholar]
- Boehler, J.P.; Demmerle, S.; Koss, S. A new direct biaxial testing machine for anisotropic materials. Exp. Mech. 1994, 34, 1–9. [Google Scholar] [CrossRef]
- Soto, A.; González, E.V.; Maimí, P.; Mayugo, J.A.; Pasquali, P.R.; Camanho, P.P. A methodology to simulate low velocity impact and compression after impact in large composite stiffened panels. Compos. Struct. 2018, 204, 223–238. [Google Scholar] [CrossRef]
- Feng, Y.; Liu, S.; Zhang, T.; Jiao, S. Experimental and theoretical investigation on the shear performance of stiffened composite panel with I-shaped stiffeners. Compos. Struct. 2022, 284, 115234. [Google Scholar] [CrossRef]
- Wu, X.; Chen, Q.; Zhao, B.; Zhang, K.; Wang, P.; Yue, Z. Experimental behavior and shear bearing capacity simulation of stiffened composite panels subjected to invisible damage impact. Thin-Walled Struct. 2022, 178, 109454. [Google Scholar] [CrossRef]
- Carpiuc-Prisacari, A.; Poncelet, M.; Kazymyrenko, K.; Leclerc, H.; Hild, F. A complex mixed-mode crack propagation test performed with a 6-axis testing machine and full-field measurements. Eng. Fract. Mech. 2017, 176, 1–22. [Google Scholar] [CrossRef]
- Carpiuc-Prisacari, A.; Poncelet, M.; Kazymyrenko, K.; Hild, F.; Leclerc, H. Comparison between experimental and numerical results of mixed-mode crack propagation in concrete: Influence of boundary conditions choice. Cem. Concr. Res. 2017, 100, 329–340. [Google Scholar] [CrossRef]
- Fields, R.A.; Richards, W.L.; DeAngelis, M.V. Combined Loads Test Fixture for Thermal-Structural Testing Aerospace Vehicle Panel Concepts. H-2488. 2004. Available online: https://ntrs.nasa.gov/citations/20040031531 (accessed on 1 November 2023).
- Bergan, A.; Bakuckas, J.; Awerbuch, J.; Tan, T.-M. Assessment of damage containment features of a full-scale PRSEUS fuselage panel. Compos. Struct. 2014, 113, 174–185. [Google Scholar] [CrossRef]
- Rouse, M.; Anbur, D. Fuselage response simulation of stiffened panels using a pressure-box test machine. In Proceedings of the 36th Structures, Structural Dynamics and Materials Conference, New Orleans, LA, USA, 10–13 April 1995. [Google Scholar] [CrossRef]
- Arabzadeh, A.; Soltani, M.; Ayazi, A. Experimental investigation of composite shear walls under shear loadings. Thin-Walled Struct. 2011, 49, 842–854. [Google Scholar] [CrossRef]
- Kaufmann, W.; Beck, A.; Karagiannis, D.; Werne, D. The Large Universal Shell Element Tester LUSET. ETH Zur. Rep. 2019. [Google Scholar] [CrossRef]
- French, C.W.; Schultz, A.E.; Hajjar, J.F.; Shield, C.K.; Ernie, D.W.; Dexter, R.J.; Du, D.; Olson, S.A.; Daugherty, D.J.; Wan, C.P. Multi-axial subassemblage testing (MAST) system: Description and capabilities. In Proceedings of the 13th WCEE, Vancouver, BC, Canada, 1–6 August 2004; p. 12. [Google Scholar]
- Serra, J.; Pierré, J.E.; Passieux, J.C.; Périé, J.N.; Bouvet, C.; Castanié, B.; Petiot, C. Validation and modeling of aeronautical composite structures subjected to combined loadings: The VERTEX project. Part 2: Load envelopes for the assessment of panels with large notches. Compos. Struct. 2017, 180, 550–567. [Google Scholar] [CrossRef]
- Serra, J.; Pierré, J.E.; Passieux, J.C.; Périé, J.N.; Bouvet, C.; Castanié, B. Validation and modeling of aeronautical composite structures subjected to combined loadings: The VERTEX project. Part 1: Experimental setup, FE-DIC instrumentation and procedures. Compos. Struct. 2017, 179, 224–244. [Google Scholar] [CrossRef]
- Peters, R.W. Buckling Tests of Flat Rectangular Plates under Combined Shear and Longitudinal Compression. 1946. Available online: https://ntrs.nasa.gov/api/citations/19930082377/downloads/19930082377.pdf (accessed on 1 November 2023).
- Klein, H. Gernal about Buckling Tests with Thin-Walled Shells; Deutsche Forschungsanstalt für Luft- und Raumfahrt: Köln, Germany, 1989. [Google Scholar]
- Castanié, B.; Barrau, J.-J.; Jaouen, J.-P. Theoretical and experimental analysis of asymmetric sandwich structures. Compos. Struct. 2002, 55, 295–306. [Google Scholar] [CrossRef]
- Castanié, B.; Barrau, J.J.; Jaouen, J.P.; Rivallant, S. Combined shear/compression structural testing of asymmetric sandwich structures. Exp. Mech. 2004, 44, 461–472. [Google Scholar] [CrossRef]
- Trellu, A.; Pichon, G.; Bouvet, C.; Rivallant, S.; Castanié, B.; Serra, J. Combined loadings after medium velocity impact on large CFRP laminate plates: Tests and enhanced computation/testing dialogue. Compos. Sci. Technol. 2020, 196, 108194. [Google Scholar] [CrossRef]
- Zucco, G.; Oliveri, V.; Peeters, D.; Telford, R.; Clancy, G.J.; McHale, C.; Rouhi, M.; O’Higgins, R.; Young, T.M.; Weaver, P.M. Static Test of a Thermoplastic Composite Wingbox Under Shear and Bending Moment. In Proceedings of the 2018 AIAA/ASCE/AHS/ASC Structures, Structural Dynamics, and Materials Conference, Kissimmee, FL, USA, 7 January 2018. [Google Scholar] [CrossRef]
- Zucco, G.; Oliveri, V.; Rouhi, M.; Telford, R.; Clancy, G.; McHale, C.; O’Higgins, R.; Young, T.M.; Weaver, P.M.; Peeters, D. Static test of a variable stiffness thermoplastic composite wingbox under shear, bending and torsion. Aeronaut. J. 2020, 124, 635–666. [Google Scholar] [CrossRef]
- Best, R.; Fleischer, T.; Götze, M.; Sachse, M.; Semsch, M. A Test Concept For Future Aircraft Fuselage Panels. In Proceedings of the ICAF 2009, Bridging the Gap between Theory and Operational Practice, Dordrecht, The Netherlands, 27–29 May 2009; pp. 3–14. [Google Scholar] [CrossRef]
- Rouse, M.; Young, R.D.; Gehrki, R.E. Structural Stability of a Stiffened Aluminum Fuselage Panel Subjected to Combined Mechanical and Internal Pressure Loads; AIAA Paper: Reston, VA, USA, 2003; p. 10. [Google Scholar]
- Ge, D.; Mo, Y.; He, B.; Wu, Y.; Du, X. Experimental and numerical investigation of stiffened composite curved panel under shear and in-plane bending. Compos. Struct. 2016, 137, 185–195. [Google Scholar] [CrossRef]
- Grotto, F.; Bouvet, C.; Castanié, B.; Serra, J. Experimental behaviour of aeronautic notched carbon fibre reinforced thermoplastic panels under combined tension-shear-pressure loadings. Eng. Fail. Anal. 2023, 146, 107075. [Google Scholar] [CrossRef]
- Williamson, C.; Cook, J.; Clarke, A.B. Investigation into the Failure of Open and Filled Holes in CFRP Laminates under Biaxial Loading Conditions; Springer: Berlin/Heidelberg, Germany, 2007; p. 10. [Google Scholar]
- Carpiuc-Prisacari, A. Innovative Tests for Characterizing Mixed-Mode Fracture of Concrete: From Pre-Defined to Interactive and Hybrid Tests. Ph.D. Thesis, Université Paris Saclay (COmUE), Gif-sur-Yvette, France, 2015. Available online: https://tel.archives-ouvertes.fr/tel-01272985 (accessed on 7 July 2022).
- Sztefek, P.; Olsson, R. Tensile stiffness distribution in impacted composite laminates determined by an inverse method. Compos. Part Appl. Sci. Manuf. 2008, 39, 1282–1293. [Google Scholar] [CrossRef]
- Serra, J.; Bouvet, C.; Castanié, B.; Petiot, C. Scaling effect in notched composites: The Discrete Ply Model approach. Compos. Struct. 2016, 148, 127–143. [Google Scholar] [CrossRef]
- Dassault Systemes Simulia. Abaqus Analysis User’s Manual. V6.12., vol. 6.3.3 Explicit dynamic Analysis/Bulk Viscosity. 2016. Available online: http://193.136.142.5/texis/search/hilight2.html/+/usb/pt03ch06s03at08.html?CDB=v6.12#usb-anl-aexpdynamic-bulkviscosity (accessed on 1 November 2023).
- Chandregowda, S.; Reddy, G.R.C. Evaluation of fastener stiffness modelling methods for aircraft structural joints. In Proceedings of the Advances in Mechanical Design, Materials and Manufacture: First International Conference on Design, Materials and Manufacture (ICDEM 2018), Karnataka, India, 29–31 January 2018; p. 020001. [Google Scholar] [CrossRef]
- Guillot, J. Modélisation et calcul des assemblages vissés. Généralités. Fonct. Compos. Mécaniques 2007. [Google Scholar] [CrossRef]
- Wagner, H. Structures of Thin Sheet Metal Their Design and Construction. NACA Memo 490. 1928. Available online: https://ntrs.nasa.gov/api/citations/19930090854/downloads/19930090854.pdf (accessed on 1 November 2023).
- Smits, A.; Van Hemelrijck, D.; Philippidis, T.P.; Cardon, A. Design of a cruciform specimen for biaxial testing of fibre reinforced composite laminates. Compos. Sci. Technol. 2005, 66, 964–975. [Google Scholar] [CrossRef]


| Sample Reference | Material | Central Damage | Thickness (mm) |
|---|---|---|---|
| ALU | Aluminium AU4G1 | None | 5 mm |
| TSs | Unidirectional CFRP tapes, thermoset | 100 mm notch | ~1 mm |
| TSd | Same CFRP tapes as TSs | 100 mm notch | double that of TSs |
| TP | Unidirectional CFRP tapes, thermoplastic | 100 mm notch | ~1 mm |
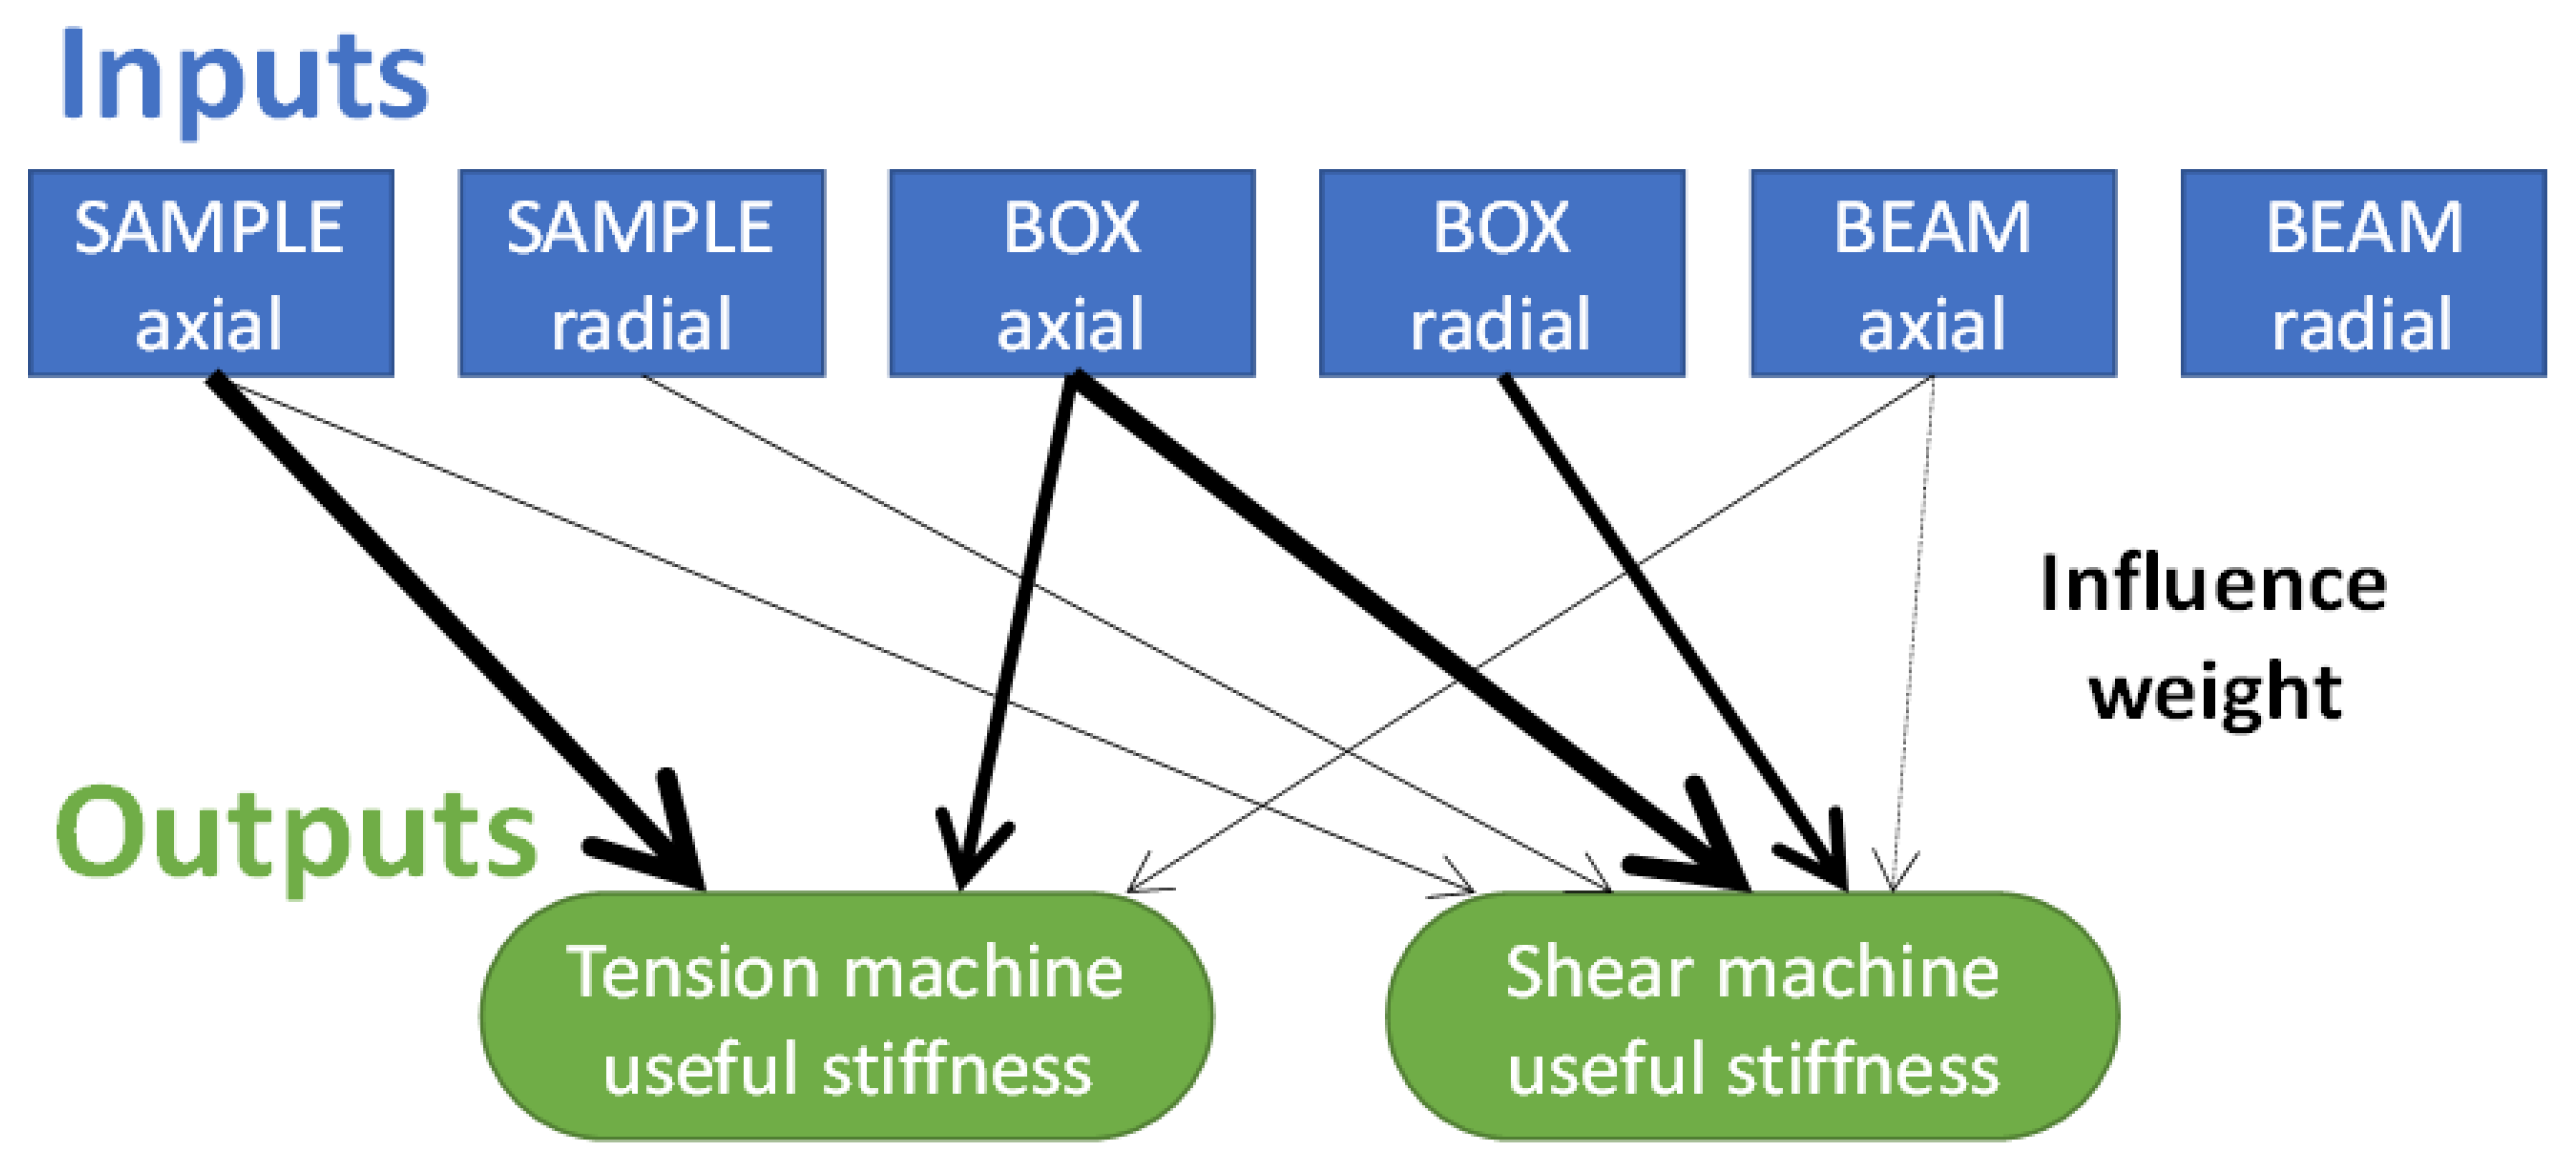
| Parameter | SAMPLE | BOX | BEAM | |||
|---|---|---|---|---|---|---|
| Axial | Radial | Axial | Radial | Axial | Radial | |
| Value (N/mm) | 10,000 | 5000 | 10,000 | 10,000 | 80,000 | 100,000 |
| Influence on Tension | +++ | --- | +++ | --- | + | --- |
| Influence on Shear | + | + | ++ | ++ | - | -- |
Disclaimer/Publisher’s Note: The statements, opinions and data contained in all publications are solely those of the individual author(s) and contributor(s) and not of MDPI and/or the editor(s). MDPI and/or the editor(s) disclaim responsibility for any injury to people or property resulting from any ideas, methods, instructions or products referred to in the content. |
© 2024 by the authors. Licensee MDPI, Basel, Switzerland. This article is an open access article distributed under the terms and conditions of the Creative Commons Attribution (CC BY) license (https://creativecommons.org/licenses/by/4.0/).
Share and Cite
Grotto, F.; Peta, O.; Bouvet, C.; Castanié, B.; Serra, J. Testing Structural Elements under Multiaxial Loading: A Numerical Model of the Bench to Understand and Predict Complex Boundary Conditions. Aerospace 2024, 11, 68. https://doi.org/10.3390/aerospace11010068
Grotto F, Peta O, Bouvet C, Castanié B, Serra J. Testing Structural Elements under Multiaxial Loading: A Numerical Model of the Bench to Understand and Predict Complex Boundary Conditions. Aerospace. 2024; 11(1):68. https://doi.org/10.3390/aerospace11010068
Chicago/Turabian StyleGrotto, Florent, Oscar Peta, Christophe Bouvet, Bruno Castanié, and Joël Serra. 2024. "Testing Structural Elements under Multiaxial Loading: A Numerical Model of the Bench to Understand and Predict Complex Boundary Conditions" Aerospace 11, no. 1: 68. https://doi.org/10.3390/aerospace11010068
APA StyleGrotto, F., Peta, O., Bouvet, C., Castanié, B., & Serra, J. (2024). Testing Structural Elements under Multiaxial Loading: A Numerical Model of the Bench to Understand and Predict Complex Boundary Conditions. Aerospace, 11(1), 68. https://doi.org/10.3390/aerospace11010068