Abstract
Fan rotor blades are critical components of aeroengines. When an aircraft flies in icing conditions, ice accumulation on the fan surface may lead to periodic shedding. Severe ice shedding can cause mechanical damage to the engine, posing significant safety risks. This study investigates ice accretion on the surface of ROTOR 67 rotor blades and their stress distribution. This paper presents an in-depth analysis of the internal stress distribution of ice layers on the surface of rotating blades under different icing times and rotational speeds, especially the stress concentration of the areas at the contact surface between the ice layer and the blade. This study predicts the stress distribution of ice layers under different working conditions more accurately, which helps to identify potential ice layer fracture risks in advance. Moreover, it integrates the icing process, stress distribution, and shedding mechanism for analysis, providing a comprehensive perspective. It considers the interaction of various environmental factors and operating conditions, offering an in-depth understanding of ice layer behavior under complex working conditions.
1. Introduction
When an aircraft traverses a cloud containing supercooled water droplets, it inevitably experiences ice accretion on the engine’s fan blades. Once the ice accumulation reaches a certain level, it can shed due to the influence of centrifugal and aerodynamic forces. The shedding ice fragments, if ingested by the engine, could cause mechanical damage to the engine, severely compromising flight safety. There are two modes of ice shedding: one where the ice detaches from the blade surface and another where the internal fracture of the ice leads to shedding [1]. The latter is a more common occurrence. Therefore, it is crucial to conduct stress analyses of the ice layers on rotating blades to identify potential initial fracture locations.
The study of high-altitude icing has a long history. As early as 1953, Messinger proposed the renowned Messinger thermodynamic model [2], which performs a thermodynamic analysis of icing surfaces to determine the specific amount of ice at each location. This model has had a profound impact on the field. However, research focusing on ice accretion and shedding on high-speed rotating machinery, especially on turbofan engine fan blades, has only garnered attention in recent years. Professor Ryohei Hayashi and Professor Makoto Yamamoto from Tokyo University of Science developed a numerical model in their research that integrates the impact of supercooled droplets, icing, and ice shedding [3]. This model has been partially validated by experimental results. Professors Yong Chen and Wei Dong from Shanghai Jiao Tong University comprehensively considered the separation of ice from the blade interface and the fracture of the ice itself [4]. Using fracture mechanics and cohesive zone models, they provided preliminary predictions regarding ice shedding from fan blades. Professor Hui Hu from Iowa State University utilized an icing wind tunnel and high-speed imaging technology to observe transient unstable icing moments on a constant-speed fan [5]. His and his colleagues’ work included analyzing the impact area of supercooled droplets and the ice accretion shapes on rotating components. They identified the icing characteristics and thickness at different locations on the rotating components for various ice types. Several years later, they advanced their research using 3D scanning technology based on digital image projection [6]. This technique enabled them to develop three-dimensional models of complex ice structures and quantify the evolution of these structures over time on rotating fan blades. Their findings outlined the correlations between ice accretion and aerodynamic forces, centrifugal forces, and ice adhesion forces. Research by Professor Gong Chen and colleagues from Shanghai Jiao Tong University involved using a cold chamber environment [7]. They scaled down a specific turbofan engine model and controlled the icing conditions to determine the effects of environmental temperature and rotational speed on ice shedding from fan blades. Chen Ningli and his team from Southwest Petroleum University developed a more comprehensive numerical icing model based on a rotating body-fitted non-orthogonal curvilinear coordinate system [8]. Their model specifically considered energy changes due to water film inflow and outflow control volumes, achieving higher accuracy compared to that of LWICE software. They further explored the impact of centrifugal forces on ice accretion on rotating blades.
This article first employs the Euler–Euler method to calculate the two-phase flow of air and water droplets. Using a shallow-water model, the ice accretion on the fan blades is determined under a constant environmental temperature, pressure, and liquid water content for different icing durations. Subsequently, a static structural analysis of the ice shapes is performed. The results reveal the relationship between the maximum principal stress within the ice and the centrifugal and aerodynamic forces. Additionally, the impact of different ice shapes on the magnitude and distribution of the internal principal stress is analyzed. This article presents an in-depth study of the distribution of internal stress within the ice layer on the surface of rotating blades under different icing times and rotational speeds, especially analyzing the stress concentration of the areas at the contact surface between the ice and the blade, which is an important supplement to existing research.
2. Numerical Methods
The primary forces acting on ice formed on the surface of rotating blades are the aerodynamic pressure exerted on the ice and the centrifugal force generated by the blade’s rotation. This study utilizes a numerical simulation of a three-dimensional rotor blade. Initially, the flow field conditions inside a compressor rotor blade are simulated to construct the initial icing environment. Subsequently, ice accretion simulations are conducted to yield three-dimensional ice accretion models for different icing durations. These 3D models are used to perform static structural analyses. Aerodynamic forces are applied at each load step of the rotating model, ultimately resulting in the distribution of maximum principal stress within the ice layer on the blade surface for different icing durations. The following sections will provide a detailed explanation of this process.
2.1. Calculation of Local Collection Coefficient
In this study, the Euler–Euler two-phase flow model is employed. The flow field is assumed to be three-dimensional and compressible. The governing equations for the rotating coordinate system are solved by considering the effects of centrifugal and Coriolis forces, using the Navier–Stokes equations [9,10], and adopting the k-ε turbulence model [11].
The droplets are treated as a continuous phase within the flow field. Using the Eulerian approach, the continuity and momentum equations for the droplet phase are formulated as follows [12,13]:
where α and Vd represent the volume fraction and average velocity of the droplets, respectively. The right-hand side of the momentum equation accounts for the drag force, buoyancy, and gravitational forces acting on the droplets. Red denotes the Reynolds number of the droplets, and CD represents the drag coefficient, which can be determined using empirical formulas for the flow around spherical droplets. K is the droplet inertia coefficient, and Fr is the local Froude number.
For subsequent ice shape calculations, it is necessary to determine the distribution of the water quantities impacting the blade surface. Therefore, the local collection efficiency is calculated using the following formula:
where LWC∞ and V∞ denote the liquid water content and velocity of the droplets in the far field, respectively.
Using the aforementioned governing equations, the water droplet collection efficiency on the fan blade surface is computed, which serves as a prerequisite boundary condition for ice accretion calculations.
2.2. Calculation of Ice Accretion on Blade
When droplets hit the blade surface, a thin water film forms, which flows along the blade surface due to centrifugal force, aerodynamic force, and other factors. The ice accretion amount on the blade surface is determined based on the thermodynamic conditions of the water film in various regions, ultimately resulting in the three-dimensional shape of the ice.
Assuming that the wall surfaces are adiabatic, the wall heat transfer coefficient and heat flux of the adiabatic flow field are calculated by extending the ice accretion data. This method simulates ice accretion on the fan blades of turbofan engines.
To determine the water film’s movement speed and direction, it is assumed that the water film velocity near the wall is zero and that the water film thickness is small. The water film velocity vector and the corresponding average velocity can be obtained by averaging the water film velocity along its thickness. The specific formula is as follows:
where τa,wall is the shear stress, which is the primary stress experienced by the water film.
When considering the body forces acting on the water film, the centrifugal force and Coriolis force must be taken into account as follows:
where ω is the angular velocity.
When analyzing the thermodynamic conditions, the primary data are obtained through the mass conservation equation and the energy conservation equation [14].
The mass conservation equation is given by
Here V∞LWCβ represents the mass of the water film formed by the droplets impinging on the blade surface, and V∞ is the freestream velocity of the droplets, LWC is the liquid water content, and β is the collection efficiency of the droplets on the blade surface. The terms mevap and mice represent the mass of the evaporated water film and the mass of the ice accreted on the blade surface, respectively.
The energy conservation equation is given as follows:
The three terms on the right side of the equation represent the energy transferred by the impact of the supercooled droplets, the heat removed by the evaporation of the water film, and the energy change resulting from the freezing of the water film, respectively.
To solve for unknown quantities, such as the mass of ice accretion, the model assumes that if the equilibrium temperature of a certain region on the blade surface is below 0 °C, there will be no liquid water in that region. Conversely, if the equilibrium temperature of a certain region on the blade surface is above 0 °C, it is assumed that no ice accretion will occur in that region.
This numerical model of ice accretion has been widely validated for three-dimensional models [15].
2.3. Analysis of Internal Ice Stresses
Due to the high-speed rotation of the rotor blades, the ice formed on the blade surface generates significant stresses.
Before calculating these stresses, the following assumptions are made: there are no cavities or impurities within the ice, indicating that the physical properties are uniformly constant across all the points within the ice; the ice is tightly bonded to the surface of the blade, with no consideration of gaps at the contact surface; and the physical properties of the ice remain constant and do not change over time.
Based on the theory of elasticity, the differential equations for the stress equilibrium of a three-dimensional solid are expressed as follows [16]:
The maximum principal stress within the ice is often a critical factor in determining crack initiation. When the maximum principal stress calculated through a simulation exceeds a critical stress level, it is deemed as the point of crack initiation. The principal stress refers to the normal stress on an infinitesimal area element at a point within a material, where the shear stress on that area element, with a normal vector n, is zero. This can also be interpreted as the normal stress on a differential plane where the shear stress is zero. The formula for the principal stress is given as follows:
σ represents the principal stress, and the maximum principal stress is the largest value among the three calculated principal stresses.
3. Numerical Simulation Results
In this study, the NASA Rotor 67 fan rotor blade was selected as the numerical research subject. This blade features a transonic design with a low aspect ratio, and has extensive experimental and simulation data. The NASA Rotor 67 is designed with a rotational speed of 16,043 rpm, a tip speed of 426 m/s, a hub diameter of approximately 0.1 m, a blade height of approximately 0.15 m, a blade chord length of approximately 0.5 m, and an aspect ratio of 1.56.
Considering the actual operating environment of the engine, the working conditions listed in Table 1 were chosen for this study, ensuring an inlet speed of 150 m/s. The ice shapes formed at 15 s and 30 s, respectively, were used to analyze the stress distribution under design rotational speeds of 70%, 80%, 90%, and 100%.

Table 1.
Boundary conditions of the actual operating environment of the engine.
Ice is a complex anisotropic material whose physical properties vary significantly with the temperature. This study references multiple experimental data sources [17,18,19,20] to summarize the ideal mechanical properties of ice under the simulated environmental conditions. These properties are used as the material parameters for the simulations, with the specific values listed in Table 2. Considering the actual conditions under which ice may crack [21], it is assumed that if the maximum principal stress in any region of the ice exceeds 0.6 MPa, there will be trend towards crack formation in that region.
Table 2.
Physical properties of ice [17,18,19,20].
This paper assumes that the material of the blades is aluminum alloy, with specific physical parameters as shown in Table 3. The blades will undergo a slight deformation at high speeds, which also affects the icing on the blade surface and the stress within it. Considering this situation, this paper will conduct a stress analysis of the ice layer on the surface of the blades.
Table 3.
Physical properties of aluminum alloy.
Additionally, the adhesion strength between the ice and the blade surface needs to be considered. By introducing a cohesive force model at the contact interface using the finite element method (FEM) for the numerical simulation, the adhesion state between the ice and the interface can be determined. This approach also allows for a relatively accurate simulation of the stress within the ice [4,22]. The parameters for the cohesive force model are provided in Table 4. In the following case studies, the stress distribution within the ice is calculated under the condition that the adhesion strength between the blade surface and the ice does not exceed the limit value.
Table 4.
Adhesive interface model [4,22].
3.1. Modeling and Validation
3.1.1. NASA Rotor 67 Flow Field Validation
The NASA Rotor 67 model is shown in Figure 1.

Figure 1.
NASA Rotor 67.
The grid division adopts a structured grid, ensuring the quality and orthogonality of the grid, and the appropriate grid refinement is carried out at the front edge, trailing edge, and near-wall areas to meet the requirements of the turbulence model and wall function for the near-wall grid’s y+ value. To eliminate the impact of the grid size and time step on the calculation accuracy, this paper conducts a grid independence verification for the NASA Rotor 67 model. Four sets of grids with different densities are used, with the total number of grids being 1,448,902, 2,683,576, 3,107,906, and 3,911,188, respectively. To more clearly see the differences between the different grid numbers and experimental values [23], the flow rate is processed dimensionlessly. The total pressure ratio and isentropic efficiency characteristic lines of the NASA Rotor 67 are calculated, and the calculation results are shown in Figure 2. The overall trend of the total pressure ratio and isentropic efficiency characteristic lines for the four sets of grids matches well with the experimental results, and the numerical calculation results differ from the experimental results by a maximum of 3.7%, which can be considered reliable. Considering the computational time cost, the Grid2 grid number is finally selected for the numerical calculation.
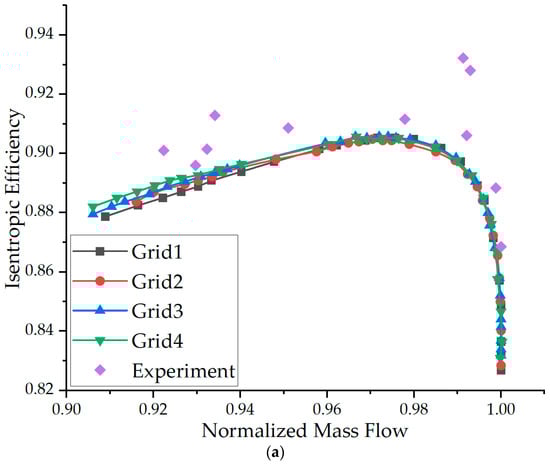
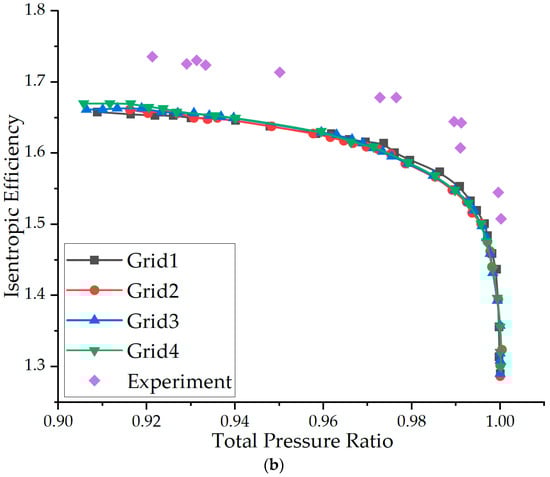
Figure 2.
Comparison of characteristic curves calculated from four sets of grids with experiments: (a) isentropic efficiency; (b) total pressure ratio.
The specific grid division is shown in Figure 3.
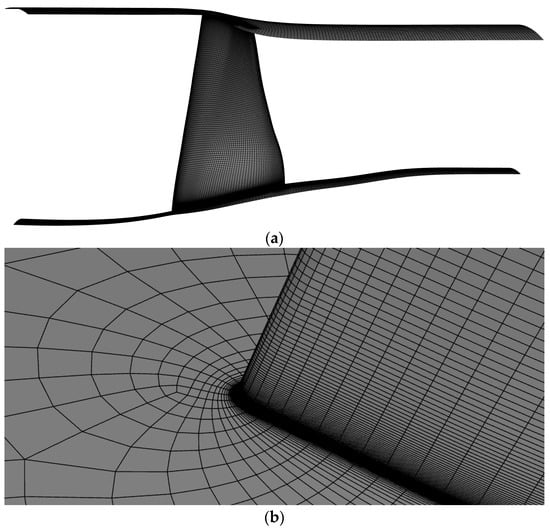
Figure 3.
NASA Rotor 67 mesh partitioning: (a) passage; (b) leading Edge.
3.1.2. Ice Accretion Model Validation
In order to verify the accuracy of the icing model, the NACA 0012 airfoil, which has the most comprehensive experimental data, is selected as the validation object and compared with the experimental results of Jaiwon Shin et al. [24] in the NASA Lewis icing wind tunnel. After the grid independence verification, the number of grids in the fluid domain is 76,084, and the grid orthogonality is good. The icing wind tunnel working conditions are shown in Table 5.
Table 5.
Boundary conditions on the icing wind tunnel working conditions.
Figure 4 is a comparison chart of the numerical simulation results and the experimental results. The horizontal and vertical coordinates in the figure are the dimensionless numbers of the wing coordinate and the chord length. It can be observed that the icing obtained by the numerical simulation is basically consistent with the icing obtained by the experiment in terms of ice shape and size, which proves that the selected numerical model is reliable.
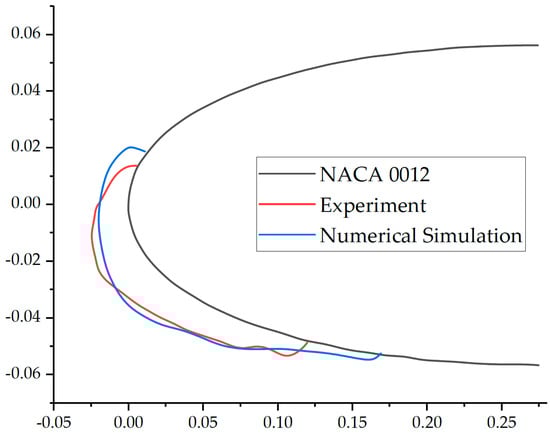
Figure 4.
Comparison of numerical simulation results with ice wind tunnel experimental results.
3.2. Distribution of Ice Stress along Chordwise and Spanwise Directions
To clearly observe the stress state within the ice at different blade heights, five typical positions along the blade height direction were selected, as shown in Figure 5.
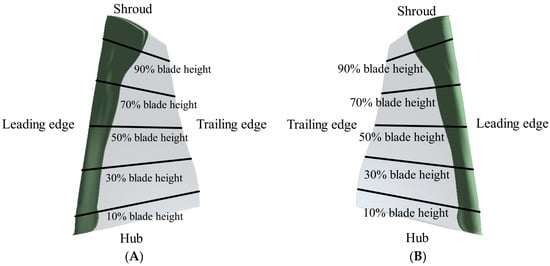
Figure 5.
Illustration of the icing morphology on the rotor blade and the selected blade height (30-s icing): (A) pressure surface; (B) suction surface.
The analysis of the maximum principal stress within the ice shapes at various blade heights for icing durations of 15 s and 30 s is presented. When the rotational speed is 90% of the design speed, the icing morphology on the blade surface and the corresponding stress distributions are illustrated in Figure 6 and Figure 7.
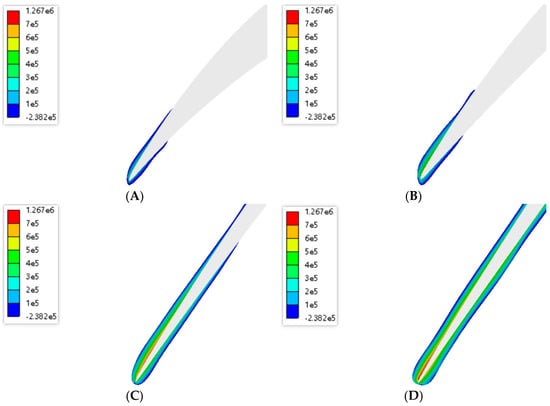
Figure 6.
Maximum principal stress distribution within the ice shapes at various blade heights for a 15-s icing duration at 90% of the design speed (Pa): (A) 10% blade height; (B) 30% blade height; (C) 70% blade height; and (D) 90% blade height.
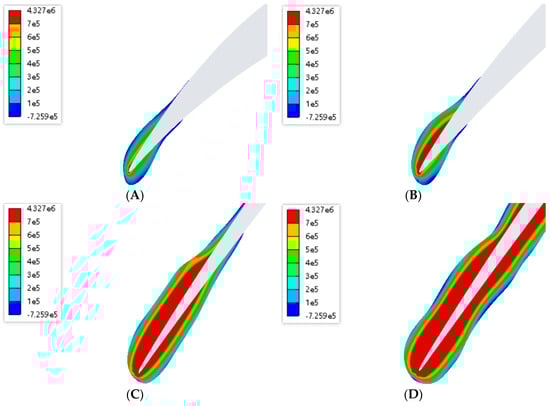
Figure 7.
Maximum principal stress distribution within the ice shapes at various blade heights for a 30-s icing duration at 90% of the design speed (Pa): (A) 10% blade height; (B) 30% blade height; (C) 70% blade height; and (D) 90% blade height.
3.2.1. Icing Morphology
Figure 5 shows that the icing region gradually increases along the chord length from the blade root to the blade tip. This is due to the influence of centrifugal forces, which cause the water film to flow towards the blade tip. Simultaneously, aerodynamic forces drive the water film to spread along the chord. Near the blade tip, icing covers approximately 50% of the chord length. Owing to the continuous migration of the water film towards the blade tip due to centrifugal forces, the thickness of the water film increases progressively from the root to the tip.
Figure 6 and Figure 7 show that due to aerodynamic forces and centrifugal forces, the water film flows irregularly on the blade surface. The suction side displays thicker icing than the pressure side. On the pressure side close to the leading edge, particularly below about 40% of the blade height, there is a noticeably thicker region compared to other areas. This effect is pronounced from the root to the tip due to centrifugal forces, which cause the icing to spread along the chord direction. At around 70% of the blade height, this trend intensifies rapidly, with icing covering approximately 50% of the chord length at the tip. The flow of the water film causes the icing thickness to increase from the root to the tip, with the suction and pressure sides nearing symmetry at higher blade heights due to the dominant influence of centrifugal forces over aerodynamic forces.
With an increased icing duration, there is no significant development in the spanwise direction of the blade icing. Below approximately 40% of the blade height on the pressure side near the leading edge, a notably thicker area develops, whereas the ice layer in other regions thickens uniformly. The geometric characteristics of the ice shapes remain relatively similar.
The observations and analysis of the icing process on the blade reveal the critical role of centrifugal and aerodynamic forces in the formation of ice. The centrifugal forces drive the water film towards the blade tip, resulting in a gradual increase in the icing region’s extent along the chord, particularly near the tip, where icing covers about 50% of the chord length. Moreover, due to the combined effects of the aerodynamic and centrifugal forces, a significant difference in the ice thickness distribution is noted between the pressure and suction sides of the blade, with the area below the leading edge on the pressure side being the thickest. However, as the icing duration increases, the overall trend is a uniform thickening of the ice layer without notable spanwise growth, indicating a certain geometric stability.
3.2.2. Analysis of Stresses in Ice along the Chord
Figure 6 reveals that at 90% of the design rotational speed, the internal stress of the ice morphology formed after 15 s of icing gradually increases from the blade root to the blade tip, with the area of the high-stress regions also expanding. At 10% and 30% of the blade height, the ice layer on the suction side is thicker and more substantial compared to the pressure side, and there are more pronounced stress concentration regions within the ice layer on the suction side. As the blade height increases, the ice morphology becomes thicker, and at 70% and 90% of the blade height, the icing shapes on the suction and pressure sides exhibit a degree of symmetry. However, different characteristics of the stress distribution appear in the ice layers at higher blade heights. The contour results indicate that the maximum principal stress and the distribution range of the high-stress regions within the ice on the suction side are significantly greater than those on the pressure side. Additionally, on both suction and pressure sides, the maximum principal stress within the ice shows a decreasing trend outward from the ice–blade contact surface.
Figure 7 illustrates that the ice morphology formed after 30 s of icing exhibits similar but more pronounced characteristics, with a larger internal stress and more extensive high-stress regions. This can be inferred as the result of the prolonged icing duration, which leads to a greater ice mass, thereby increasing the centrifugal forces acting on the blade.
To further quantify the high-stress regions in a single blade height plane, 21 evenly distributed points were selected along the contact surface, from a position at 5% chord length from the leading edge on the suction side to a position at 5% chord length from the leading edge on the pressure side, as shown in Figure 8.
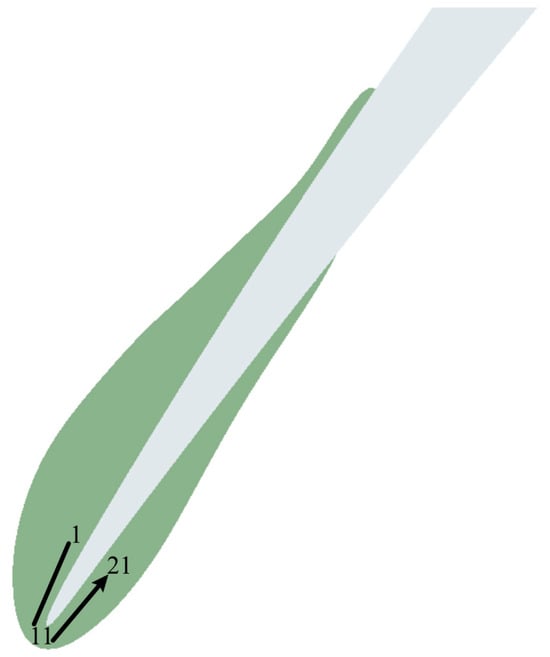
Figure 8.
Schematic diagram of equidistant points at leading edge (50% blade height).
Figure 9 presents the distribution of the maximum principal stress within the ice near the leading edge of the blade. It can be observed that the maximum principal stress gradient near the leading edge of the blade varies greatly for different icing durations, with the stress variation along the chord tending to stabilize. Additionally, the internal stress of the ice on the suction side is significantly higher than that on the pressure side, with a larger stress gradient along the chord on the suction side. There are noticeable differences in the maximum principal stress distribution within the ice layer in this region between the different icing durations. Specifically, the ice layer on the blade surface after 30 s of icing exhibits a more pronounced stress concentration in this area, while the stress concentration is relatively less noticeable after 15 s of icing. Under the same icing duration, the trend of the maximum principal stress distribution within the ice at different blade heights shows certain similarities.
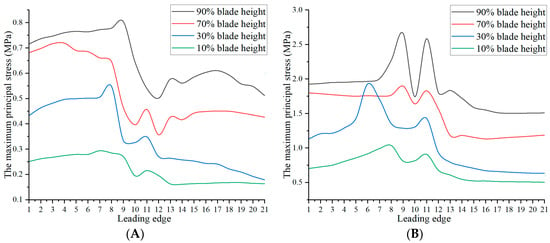
Figure 9.
Distribution of maximum principal stress within ice near contact surface at leading edge region at 90% Rotational Speed: (A) 15-s icing; (B) 30-s icing.
Through structural mechanics analyses, the shapes and stress distributions of the ice layers on the rotating blades at different rotational speeds and icing durations have been studied and observed in detail. The results indicate that from the blade root to the tip, the ice layer thickness continuously increases along with the stress and that high-stress regions expand within the ice layer. Additionally, the internal stress within the ice layer on the suction side of the blade is generally higher than that on the pressure side, with more significant stress concentration regions. As the icing duration increases, both the stress and the area of high-stress regions tend to increase, mainly due to the increasing mass of the ice layer and the resultant greater centrifugal forces acting on the blade. Furthermore, the gradient of the stress variation near the leading edge of the blade icing is substantial, showing a non-uniform stress distribution along the chord. The trends in the stress distribution within the ice layer at different blade heights exhibit a degree of similarity under the same icing duration.
3.2.3. Analysis of Stresses in Ice along Span
To achieve a more accurate assessment of the stresses within the three-dimensional icing on the blade, this study quantitatively analyzes the stress by selecting seven points along the span-wise direction on both the suction and pressure sides from the leading edge, specifically at positions corresponding to the leading edge, 1% chord length, 3% chord length, and 5% chord length from the leading edge. The specific node distribution is illustrated in Figure 10. The maximum principal stresses within the ice at these nodes were extracted and observed along the blade height to analyze the data variations within the entire three-dimensional ice morphology. Figure 11 demonstrates the trends of the maximum principal stresses at various nodes along the blade height for the ice morphologies formed after 15 s and 30 s of icing.
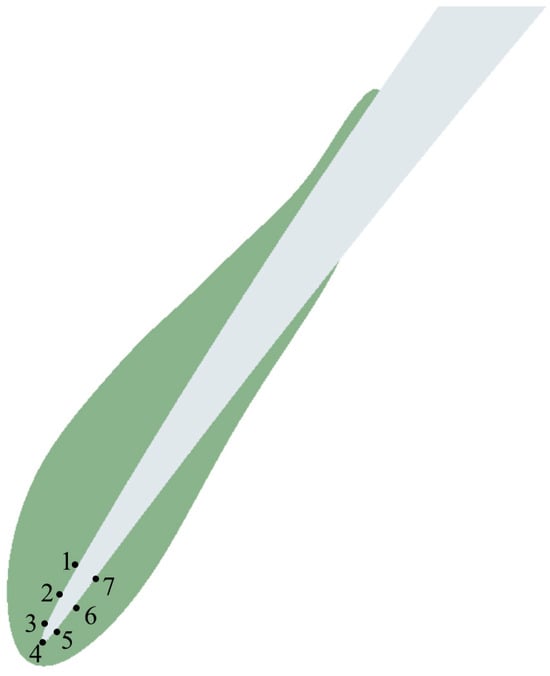
Figure 10.
Schematic diagram of nodes at mid-span plane (50% blade height).
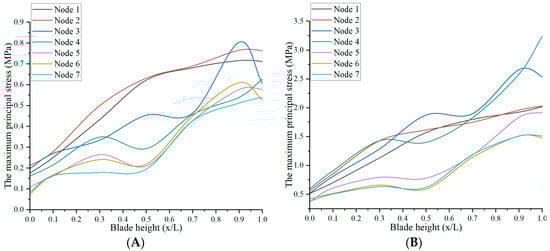
Figure 11.
Variation trend of maximum principal stress along blade height at various nodes under 90% rotational speed: (A) 15-s icing; (B) 30-s icing.
The data analysis reveals that the maximum principal stresses within the ice on the suction side are significantly higher than those on the pressure side. The maximum principal stresses for the 30 s ice morphology are markedly higher than those for the 15 s ice morphology, showing noticeable gradient differences along the blade height. This indicates that the icing geometry has a substantial impact on the magnitude and distribution of the principal stresses. Along the blade height, the overall trend of the maximum principal stress variations is similar for both the 15 s and 30 s ice morphologies.
Based on the variations in the maximum principal stresses within the ice layers on the suction and pressure sides of the rotating blades for different icing durations, the maximum principal stresses within the ice on the suction side are significantly higher than those on the pressure side. This may be due to the greater aerodynamic pressures acting on the suction side during flight. Furthermore, as the icing duration increases, the maximum principal stresses within the ice layers also increase significantly, with noticeable gradient differences along the blade height, highlighting the significant impact of the icing geometry on the magnitude and distribution of the stress. Finally, although changes in the icing duration affect the magnitude of the stress, the trend of stress variations along the blade height remains consistent between the 15 s and 30 s ice morphologies.
3.3. Relationship between Stress within Ice and Rotor Speed
A principal stress analysis was conducted on the ice shapes with icing times of 15 s and 30 s under design rotational speeds of 70%, 80%, 90%, and 100%. As illustrated in Figure 12, the distribution of the maximum principal stress within the ice shape at a 50% blade height for a 15 s icing time shows a trend where the maximum stress increases with higher rotational speeds. The area of high-stress zones also expands with increasing speed.
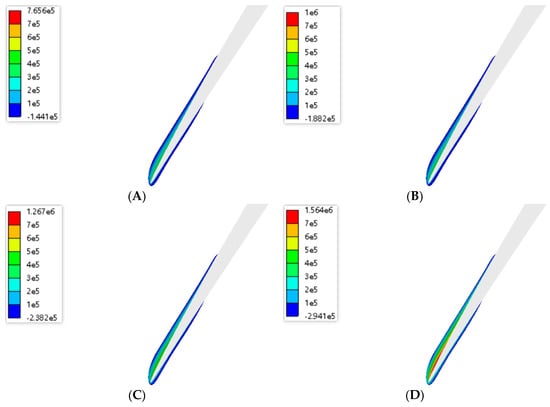
Figure 12.
Maximum principal stress distribution at 50% blade height for 15 s icing time at various speeds (Pa): (A) 70% design rotational speed; (B) 80% design rotational speed; (C) 90% design rotational speed; and (D) 100% design rotational speed.
Figure 13 presents the stress distribution for the ice shape with a 30 s icing time under different rotational speeds at the 50% blade height. The distribution pattern is similar to that observed for the 15 s icing time; however, due to the thicker ice layer, the maximum principal stress is higher, and the high-stress zones are more extensive.
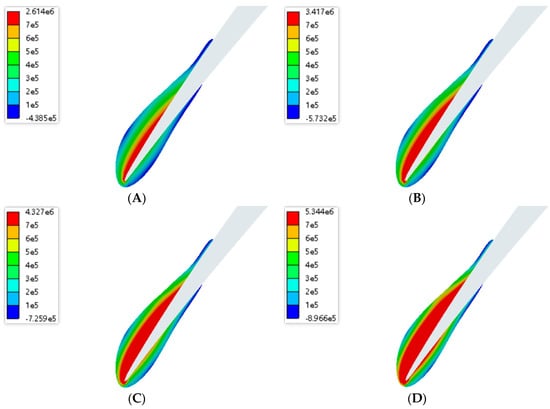
Figure 13.
Maximum principal stress distribution at 50% blade height for 30 s icing time at various speeds (Pa): (A) 70% design rotational speed; (B) 80% design rotational speed; (C) 90% design rotational speed; and (D) 100% design rotational speed.
This analysis reveals that the stress within the ice increases with the rotor speed, highlighting the need to account for these variations in the design and maintenance of rotor blades operating under icing conditions.
The maximum principal stresses of the ice shapes at various rotational speeds were numerically averaged to obtain the data shown in Figure 14. The results clearly indicate that the average maximum principal stress within the ice layer on the blade increases with the rotor speed. This trend highlights the critical impact of the operational speed on the structural integrity of the ice accumulation, suggesting that higher rotational speeds exacerbate the internal stress levels within the ice layer.
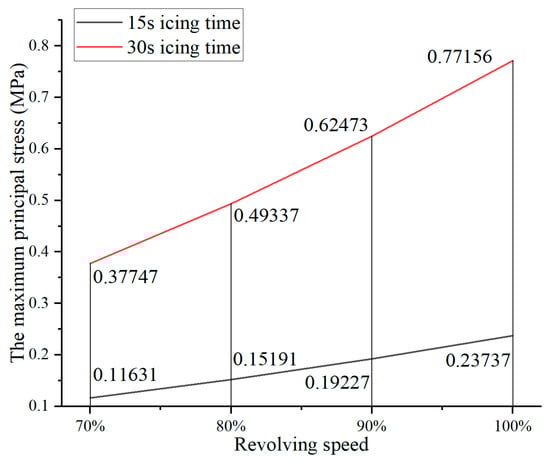
Figure 14.
Average maximum principal stress within ice shapes for 15 s and 30 s icing times at various rotational speeds.
Figure 15 illustrates the distribution of the maximum principal stresses in the leading-edge region near the contact surface at a 50% blade height (corresponding to the previously discussed area) for different rotational speeds. In this figure, Point 11 represents the leading edge, Points 1–11 denote the pressure side, and Points 11–21 denote the suction side. The observation of this figure reveals that for an icing time of 15 s, the minimum value of the maximum principal stress occurs at Point 12, with a significant gradient in the maximum principal stress between Points 8 and 12, while the other regions exhibit relatively smooth changes in the maximum principal stress. For an icing time of 30 s, the maximum principal stress is highest at Point 7, with significant stress gradients between Points 6 and 7 and Points 7 and 12, indicating a severe stress concentration at Point 7, while the rest of the region exhibits relatively smooth changes in the maximum principal stress.
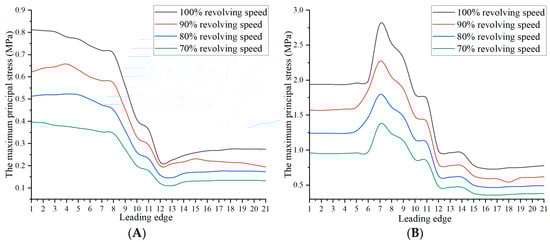
Figure 15.
Distribution of internal maximum principal stresses in leading-edge region near contact surface at 50% blade height for different rotational speeds: (A) 15-s icing; (B) 30-s icing.
For the same icing time, as the rotational speed increases, the maximum principal stress of this region gradually increases, with the distribution trend and stress concentration locations remaining consistent. This pattern can be preliminarily extended to the entire ice layer, indicating that with changes in the rotational speed, the distribution of the principal stresses within the ice layer becomes more consistent. Additionally, under conditions of varying icing times but the same rotational speed, the leading-edge position at a 50% blade height (the region spanning from 1.5% chord length on the suction side to 0.5% chord length on the pressure side from the leading edge) exhibits significant stress gradients, with similar trends in the stress variation. As the rotational speed increases, the gradient of the maximum principal stress variation also increases.
On the pressure side, the maximum principal stress of the ice layer tends to be stable along the chordwise direction, with differences in the gradient variation and specific distribution characteristics between the different icing times. On the suction side, the maximum principal stress distribution along the spanwise direction tends to stabilize for a 15 s icing time, showing an initial rising trend, reaching a peak, and then gradually decreasing. For a 30 s icing time, the stress quickly peaks and then rapidly decreases, exhibiting a more pronounced stress concentration phenomena, followed by the maintaining of a relatively high maximum principal stress value. This is caused by differences in the ice layer thickness and internal structure due to the icing times. For a 15 s icing time, the ice layer is thinner, making the icing shape more uniform and the stress distribution relatively even. For a 30 s icing time, the ice layer is thicker, leading to more defined icing shape characteristics and a less uniform stress distribution.
The peak values of the maximum principal stress at various blade heights predominantly occur on the suction side, approximately at 1% to 4% chord length from the leading edge. Considering this specific condition, the maximum values of the maximum principal stress along the blade height direction for icing shapes at 15 s and 30 s under different rotational speeds were compiled, as illustrated in Figure 16.
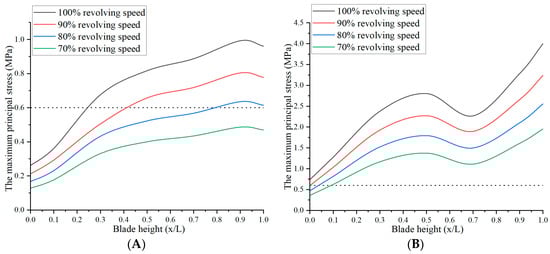
Figure 16.
The magnitude of the maximum principal stress at different blade heights for various rotational speeds: (A) 15-s icing; (B) 30-s icing.
It was observed that along the blade height direction, the maximum principal stress for the ice shape with a 15 s icing duration generally exhibited an increasing trend, with a slight decrease near the blade tip. Conversely, for the 30 s icing duration, the maximum principal stress significantly decreased at around 50% of the blade height, which could be attributed to factors such as ice geometry, contact surface geometry, and centrifugal force.
Using 0.6 MPa as the cracking threshold [21], it was noted that for a 30 s icing duration, the maximum principal stress in the ice on the blade surface exceeded 0.6 MPa across the various rotational speeds, surpassing the cracking threshold. Under actual conditions, most of the ice would have already detached. In contrast, the stress within the ice for a 15 s icing duration was more representative of the conditions experienced by engine rotor blades under typical icing weather conditions.
Based on the previous analysis, it can be preliminarily inferred that as the rotational speed increases, the cracking location of the ice on a blade surface for a 15 s icing duration gradually approaches the blade base. It is conjectured that at 80%, 90%, and 100% of the maximum rotational speeds, the initial cracking occurs at approximately 75%, 40%, and 20% of the blade height on the suction side, respectively. Conversely, at 70% of the maximum rotational speed, the internal maximum principal stress of the ice on the blade surface for a15 s icing duration remains below 0.6 MPa, indicating no tendency towards internal fracturing at this speed. Only with a prolonged icing time might fracturing occur.
In summary, this analysis partially explains why, under actual flight conditions, the icing on the engine rotor surface appears more severe near the blade base and is thicker on the pressure surface compared to the suction surface.
This investigation delved into the stress characteristics within the ice layer on rotating blades under different icing durations and rotational speeds, revealing that the rotational speed, icing duration, and ice geometry significantly influence the magnitude and distribution of the stress within the ice layer. This study found that with an increasing icing time and rotational speed, both the maximum principal stress within the ice layer and its distribution range increased. Moreover, regions with thicker ice layers typically exhibited higher principal stresses. Additionally, noticeable differences in the stress distribution were observed at the leading edge of the blade under varying icing durations and rotational speeds, particularly showing severe stress concentration phenomena for longer icing durations.
4. Conclusions and Future Prospects
A series of numerical simulations on the stresses within the ice accretion on the surface of rotor blades were conducted, leading to the following conclusions:
- (1)
- The magnitude and specific distribution characteristics of the stresses within the ice accretion are significantly influenced by the ice geometry, contact surface geometry, and centrifugal force. As the icing duration increases, the ice accretion on the blade surface thickens, resulting in higher stress and an expansion of the high-stress regions, with a more pronounced stress concentration. From the blade root to the blade tip, the stress within the ice accretion generally shows an increasing trend, with an enlarged area of high-stress regions. The maximum principal stress and the distribution area of the high-stress regions on the suction side of the ice accretion are much larger than those on the pressure side. Additionally, the stress decreases gradually from the contact surface outward, indicating a tendency for the ice to fracture first at the contact surface, potentially leading to ice shedding or breaking.
- (2)
- The maximum principal stress gradient is significant at the leading edge of the ice accretion. The locations of the maximum principal stress at various blade heights are found to be approximately 1% to 4% from the leading edge on the suction side at the contact surface between the ice and the blade.
- (3)
- The preliminary inferences suggest that the ice accretion on the blade surface tends to crack at 75%, 40%, and 20% of the blade height on the suction side at 80%, 90%, and 100% of the design rotational speeds, respectively.
- (4)
- As the rotational speed decreases, the maximum stresses within the ice accretion exhibit a decreasing trend, with the area of high-stress regions gradually reducing.
These findings provide insights into the behavior of ice accretion on rotor blades under different icing durations and rotational speeds, highlighting the influence of geometric factors and centrifugal forces on the stress distribution and potential fracturing.
It is hoped that in the future, laboratory experiments can be used to verify the accuracy of the numerical simulation results, thereby enhancing the reliability of this research, and to further study the interactive effects of more environmental factors such as temperature, humidity, and liquid water content, with the rotational speed and icing time on the stress distribution of the ice layer, as well as the dynamic process of ice layer shedding, including the critical conditions for shedding, crack propagation during the shedding process, and stress wave propagation.
Author Contributions
Conceptualization, L.Z.; methodology, L.Z.; validation, Z.X.; formal analysis, Z.X.; investigation, Z.X.; data curation, Z.X.; writing—original draft preparation, Z.X.; writing—review and editing, Z.X. and L.Z.; supervision, Z.L.; project administration, Z.L.; funding acquisition, Z.L. and H.G. All authors have read and agreed to the published version of the manuscript.
Funding
This research received no external funding. And The APC was funded by Z.L. and H.G.
Data Availability Statement
Data will be made available upon request.
Conflicts of Interest
The authors declare that they have no known competing financial interests or personal relationships that could have appeared to influence the work reported in this paper.
References
- Fortin, G.; Perron, J. Ice Adhesion Models to Predict Shear Stress at Shedding. J. Adhes. Sci. Technol. 2012, 26, 523–553. [Google Scholar] [CrossRef]
- Messinger, B.L. Equilibrium Temperature of an Unheated Icing Surface as a Function of Air Speed. J. Aeronaut. Sci. 1953, 20, 29–42. [Google Scholar] [CrossRef]
- Hayashi, R.; Yamamoto, M. Modelling of ice shedding phenomenon for engine fan icing. Trans. JSME 2014, 80, 815. [Google Scholar] [CrossRef]
- Chen, Y.; Dong, W.; Wang, Z.; Fu, L. Numerical Simulation of Ice Shedding From a Fan Blade. In Proceedings of the ASME Turbo Expo 2015: Turbine Technical Conference and Exposition, Montreal, QC, Canada, 15–19 June 2015. [Google Scholar] [CrossRef]
- Li, L.; Hu, H. An Experimental Study of Dynamic Ice Accretion Process on Aero-engine Spinners. In Proceedings of the 55th AIAA Aerospace Sciences Meeting, Grapevine, TX, USA, 9–13 January 2017. [Google Scholar] [CrossRef]
- Tian, L.; Hu, H.; Hu, H. Quantification of the Ice Structures Accreted over the Surfaces of Rotating Aero-Engine Fan Blades. In Proceedings of the AIAA AVIATION 2022 Forum, Chicago, IL, USA, 27 June–1 July 2022. [Google Scholar] [CrossRef]
- Chen, G.; Yang, K.; Wang, L.; Kong, W.; Wang, F. Test of ice shedding on turbofan engine blade in refrigeratory environment. J. Beijing Univ. Aeronaut. Astronaut. 2018, 44, 2106–2114. (In Chinese) [Google Scholar] [CrossRef]
- Ning-li, C.H.E.N.; Jian-min, D.U.; Hong-hu, J.I.; Ya-ping, H.U.; Yong-qing, Y.U.A.N. Numerical Study of Effects of Centrifugal Force on Ice Accretion on a Rotor Blade. J. Propuls. Technol. 2020, 41, 1314–1323. [Google Scholar] [CrossRef]
- Chorin, A.J. Numerical solution of the Navier-Stokes equations. Math. Comput. 1968, 22, 745–762. [Google Scholar] [CrossRef]
- Matsuura, T.; Suzuki, M.; Yamamoto, M.; Shishido, S.; Murooka, T.; Miyagawa, H. Numerical simulation of ice accretion phenomena on rotor blade of axial blower. J. Therm. Sci. 2012, 21, 322–326. [Google Scholar] [CrossRef]
- Launder, B.E.; Spalding, D.B. The numerical computation of turbulent flows. Comput. Methods Appl. Mech. Eng. 1990, 3, 269–289. [Google Scholar] [CrossRef]
- Bourgault, Y.; Habashi, W.G.; Dompierre, J.; Boutanios, Z.; Bartolomeo, W.D. An Eulerian approach to supercooled droplets impingement calculations. In Proceedings of the 35th Aerospace Sciences Meeting and Exhibit, Reno, NV, USA, 6–9 January 1997. [Google Scholar] [CrossRef]
- Hu, L.; Zhu, X.; Hu, C.; Chen, J.; Du, Z. Calculation of the Water Droplets Local Collection Efficiency on the Wind Turbines Blade. J. Energy Resour. Technol. 2017, 139, 051211. [Google Scholar] [CrossRef]
- Zheng, Y.; Zhang, F.; Wang, D.; Li, S. Numerical and Experimental Study of Ice Accretion Process and Ice Protection on Turbo-Fan Engine Splitter. In Proceedings of the ASME Turbo Expo 2019: Turbomachinery Technical Conference and Exposition, Phoenix, AZ, USA, 17–21 June 2019. [Google Scholar] [CrossRef]
- Ahn, G.B.; Jung, K.Y.; Myong, R.S.; Shin, H.B.; Habashi, W.G. Numerical and experimental investigation of ice accretion on rotorcraft engine air intake. J. Aircr. 2015, 52, 903–909. [Google Scholar] [CrossRef]
- Ding, L.; Chang, S.; Yi, X.; Song, M. Coupled thermo-mechanical analysis of stresses generated in impact ice during in-flight de-icing. Appl. Therm. Eng. 2020, 181, 115681. [Google Scholar] [CrossRef]
- Gammon, P.H.; Kiefte, H.; Clouter, M.J. Elastic constants of ice samples by BrillouinSpectroscopy. J. Glaciol. 1980, 25, 159–168. [Google Scholar] [CrossRef]
- Petrovic, J.J. Review Mechanical properties of ice and snow. J. Mater. Sci. 2003, 38, 1–6. [Google Scholar] [CrossRef]
- Fortin, G.; Beisswenger, A.; Perron, J. Centrifuge Adhesion Test to Evaluate Icephobic Coatings. In Proceedings of the AIAA Atmospheric and Space Environments Conference, Toronto, ON, Canada, 2–5 August 2010. [Google Scholar] [CrossRef]
- Duval, P.; Schulson, E.M. Creep and Fracture of Ice; Cambridge University Press: Cambridge, UK, 2009. [Google Scholar] [CrossRef]
- Sommerwerk, H.; Horst, P. Analysis of the mechanical behavior of thin ice layers on structures including radial cracking and de-icing. Eng. Fract. Mech. 2017, 182, 400–424. [Google Scholar] [CrossRef]
- Dong, W.; Ding, J.; Zhou, Z.X. Experimental Study on the Ice Freezing Adhesive Characteristics of Metal Surfaces. J. Aircr. 2014, 51, 719–726. [Google Scholar] [CrossRef]
- Strazisar, A.J.; Powell, J.A. Laser Anemometer Measurements in a Transonic Axial Flow Compressor Rotor. ASME. J. Eng. Power 1981, 103, 430–437. [Google Scholar] [CrossRef]
- Shin, J. Characteristics of surface roughness associated with leading-edge ice accretion. J. Aircr. 1994, 33, 316–321. [Google Scholar] [CrossRef]


Disclaimer/Publisher’s Note: The statements, opinions and data contained in all publications are solely those of the individual author(s) and contributor(s) and not of MDPI and/or the editor(s). MDPI and/or the editor(s) disclaim responsibility for any injury to people or property resulting from any ideas, methods, instructions or products referred to in the content. |
© 2024 by the authors. Licensee MDPI, Basel, Switzerland. This article is an open access article distributed under the terms and conditions of the Creative Commons Attribution (CC BY) license (https://creativecommons.org/licenses/by/4.0/).